
 Submit a Paper
 Propose a Special lssue
 Open Access
ARTICLE

Prediction of Root Zone Temperature Dynamics at Effective Depth on Lettuce Production in Greenhouse Using Sensitivity and Feature Importance Analysis with XGBoost
Department of Biosystem Engineering, Faculty of Agriculture, Igdir University, Igdir, Türkiye
* Corresponding Author: Hasan Kaan Kucukerdem. Email:
(This article belongs to the Special Issue: Application of Digital Agriculture and Machine Learning Technologies in Crop Production)
Phyton-International Journal of Experimental Botany 2026, 95(1), 16 https://doi.org/10.32604/phyton.2026.074188
Received 05 October 2025; Accepted 31 December 2025; Issue published 30 January 2026
 View Full Text
 Download PDF
Abstract
Root-zone temperature (RZT) strongly affects plant growth, nutrient uptake and tolerance to environmental stress, making its regulation a key challenge in greenhouse cultivation in cold climates. This study aimed to assess the potential of passive techniques, namely black polyethylene mulch and row covers, for modifying RZT dynamics in lettuce (Lactuca sativa L.) production and to evaluate the predictive performance of the eXtreme Gradient Boosting (XGBoost) algorithm. Experiments were conducted in Iğdır, Türkiye, over a 61-day period, with soil temperature continuously monitored at depths of 1–30 cm under mulched and non-mulched conditions, alongside measurements of greenhouse air temperature both with and without row covers. The application of row covers increased internal air temperature by 5.8°C, while mulching raised RZT by 0.6–1.3°C, with effects diminishing at deeper layers. XGBoost modeling achieved high predictive accuracy, with RMSE values of 0.150–0.189°C and R2 values above 0.99, and feature-importance analysis indicated that neighboring soil depths were the strongest predictors of RZT. These findings show that integrating row covers and mulching can stabilize the root-zone microclimate without active heating. The XGBoost model provides a robust tool for forecasting soil temperature and supports sustainable greenhouse production in cold regions.Keywords
The continuous growth of the global population has intensified the demand for both food and energy, underscoring the need for efficient and sustainable greenhouse systems. Within controlled environment agriculture, root-zone temperature (RZT) is a primary driver of water and nutrient uptake, root metabolism, and overall plant vigor. Modest RZT elevation (+3°C) enhances biomass, pigments, and metabolite profiles by improving nutrient acquisition and activating root metabolism in lettuce across different air-temperature regimes [1]. Complementary evidence indicates that controlling RZT through targeted heating methods improves photosynthesis, yield, and quality with favorable energy use compared with bulk-air heating [2]. Moreover, seasonal energy assessments suggest that on-site renewables can supply a substantial fraction of the RZT heating/cooling demand, reinforcing the thermal efficiency and low-carbon potential of root zone focused strategies [3]. Implementation-oriented work further highlights timing and control for example, morning RZT elevation and heat pump assisted RZT control to translate RZT management into consistent productivity gains [4,5].
Mulching and row covers are widely adopted passive microclimate strategies that regulate soil and near-surface air temperatures. Recent field studies show that plastic mulches reduce soil heat loss and increase soil temperature while dampening daily thermal fluctuations an effect most pronounced during cold periods [6,7,8,9]. For cool-season vegetables such as lettuce (Lactuca sativa L.), mulching has been associated with improved yield and quality traits under open-field and protected settings, including biodegradable or bio-based covers [10,11]. Likewise, row covers/low tunnels extend the growing season by retaining heat and humidity and by buffering against frost, and they are used not only in open-field systems but also inside Mediterranean-type greenhouses during early crop stages to enhance the microclimate and reduce pest pressure [12,13]. Integrating row covers with mulching within greenhouses therefore provides additional thermal buffering and contributes to passive energy conservation a practical complement to active climate control when energy costs or night temperatures are limiting [12,13].
Direct, continuous measurement of root-zone temperature (RZT) at scale often requires specialized instrumentation and maintenance, which limits practicality for large-area or long-term deployments; consequently, many studies favor indirect estimation or modeling approaches [14,15]. In parallel, the literature documents a broad toolbox of empirical, semi-empirical, and physics-based models for soil temperature dynamics ranging from calibrated air-to-soil transfer relations to land-surface/crop models and climate-model evaluations [16,17,18]. More recently, machine learning (ML) methods have gained prominence for capturing nonlinear responses among environmental drivers and soil thermal behavior, with hybrid and explainable ML frameworks delivering strong accuracy across depths and conditions [19,20].
Beyond conventional tree-based models, a wide spectrum of ML algorithms has been applied to soil temperature estimation. Recent studies confirm that artificial neural networks (ANNs) and their hybrids can accurately forecast soil temperature across depths and climates, often surpassing linear baselines [19,21]. Support Vector Machines (SVM) and MARS remain strong non-linear contenders in comparative reviews and benchmarks, particularly when inputs include radiation, air temperature, humidity, and wind speed [22]. In parallel, deep learning architectures most notably CNNs and CNN-LSTM hybrids have demonstrated state-of-the-art performance for hourly and spatiotemporal soil-temperature prediction [23,24]. That said, the higher data and compute demands of deep models can limit routine deployment in production greenhouse settings; consequently, efficient gradient-boosting approaches (e.g., XGBoost) are frequently favored as a practical compromise between accuracy, speed, and interpretability for environmental modeling workflows [25,26].
Among contemporary ML algorithms, XGBoost has emerged as a powerful and efficient ensemble method, combining gradient-boosted trees with regularization to deliver strong accuracy and fast training on nonlinear, high-dimensional data. Comparative studies in agri-environmental contexts consistently report superior or top tier performance of XGBoost relative to baselines such as Random Forest (RF) and Support Vector Machines (SVM) including greenhouse microclimate prediction and crop quality regression while maintaining practical computational efficiency [27,28,29]. Broader benchmarks and domain applications likewise show XGBoost outperforming RF in complex classification/regression tasks, reinforcing its suitability as a default, high-performing learner in agricultural modeling workflows [30,31,32].
Despite extensive research on the individual effects of mulching and row covers, a study explicitly examining their combined influence on root-zone temperature in greenhouse systems particularly when analyzed within advanced machine learning frameworks has not been reported in the open literature. To bridge this research gap, the present study explores the thermal dynamics of RZT under mulched and non-mulched row cover treatments in a greenhouse environment. Specifically, it assesses the predictive performance of the XGBoost algorithm in modeling soil temperature at the effective root zone depth of lettuce (10 cm) [33]. By integrating passive thermal management techniques with data-driven modeling, this research aims to establish a sustainable and computationally efficient framework for optimizing greenhouse production under cold climatic conditions.
In this context, the present study has three main contributions. First, it provides a detailed experimental quantification of how the combined use of row covers and black polyethylene mulch modifies the vertical root-zone temperature profile (1–30 cm) for winter lettuce in an unheated greenhouse under a strongly heating-dominated continental climate. Second, it develops high-accuracy XGBoost models for predicting RZT at the effective root depth (10 cm) under both mulched and non-mulched conditions, using multi-depth soil temperatures and routine climatic variables as inputs. Third, it links the model-based feature-importance and sensitivity results to soil-physics and crop-physiology concepts and discusses how such interpretable, IoT-ready models can support passive microclimate management and decision making in sustainable greenhouse production.
The experiment was conducted in Iğdır, located in the Erzurum-Kars section of Northeastern Anatolia (39°55.2′ N, 44°03.0′ E) at an elevation of 850 m above sea level (Fig. 1). The region is characterized by a continental climate with strong seasonality, cold winters, and hot, dry summers. Long-term meteorological records (1941–2024) indicate mean monthly temperatures ranging from −3.3°C in January to 25.9°C in July, with maximum average values peaking at 33.4°C in midsummer. Minimum temperatures regularly drop below −8.0°C in January. Precipitation follows a bimodal distribution, with May representing the wettest month (46.9 mm), while August and September are distinctly dry despite high temperatures. Sunshine duration varies between 2.4 h (December) and 10.1 h (July), reflecting substantial variation in solar radiation availability [34]. This climatic regime imposes thermal and hydrological constraints on agricultural production, particularly in unheated greenhouse systems.
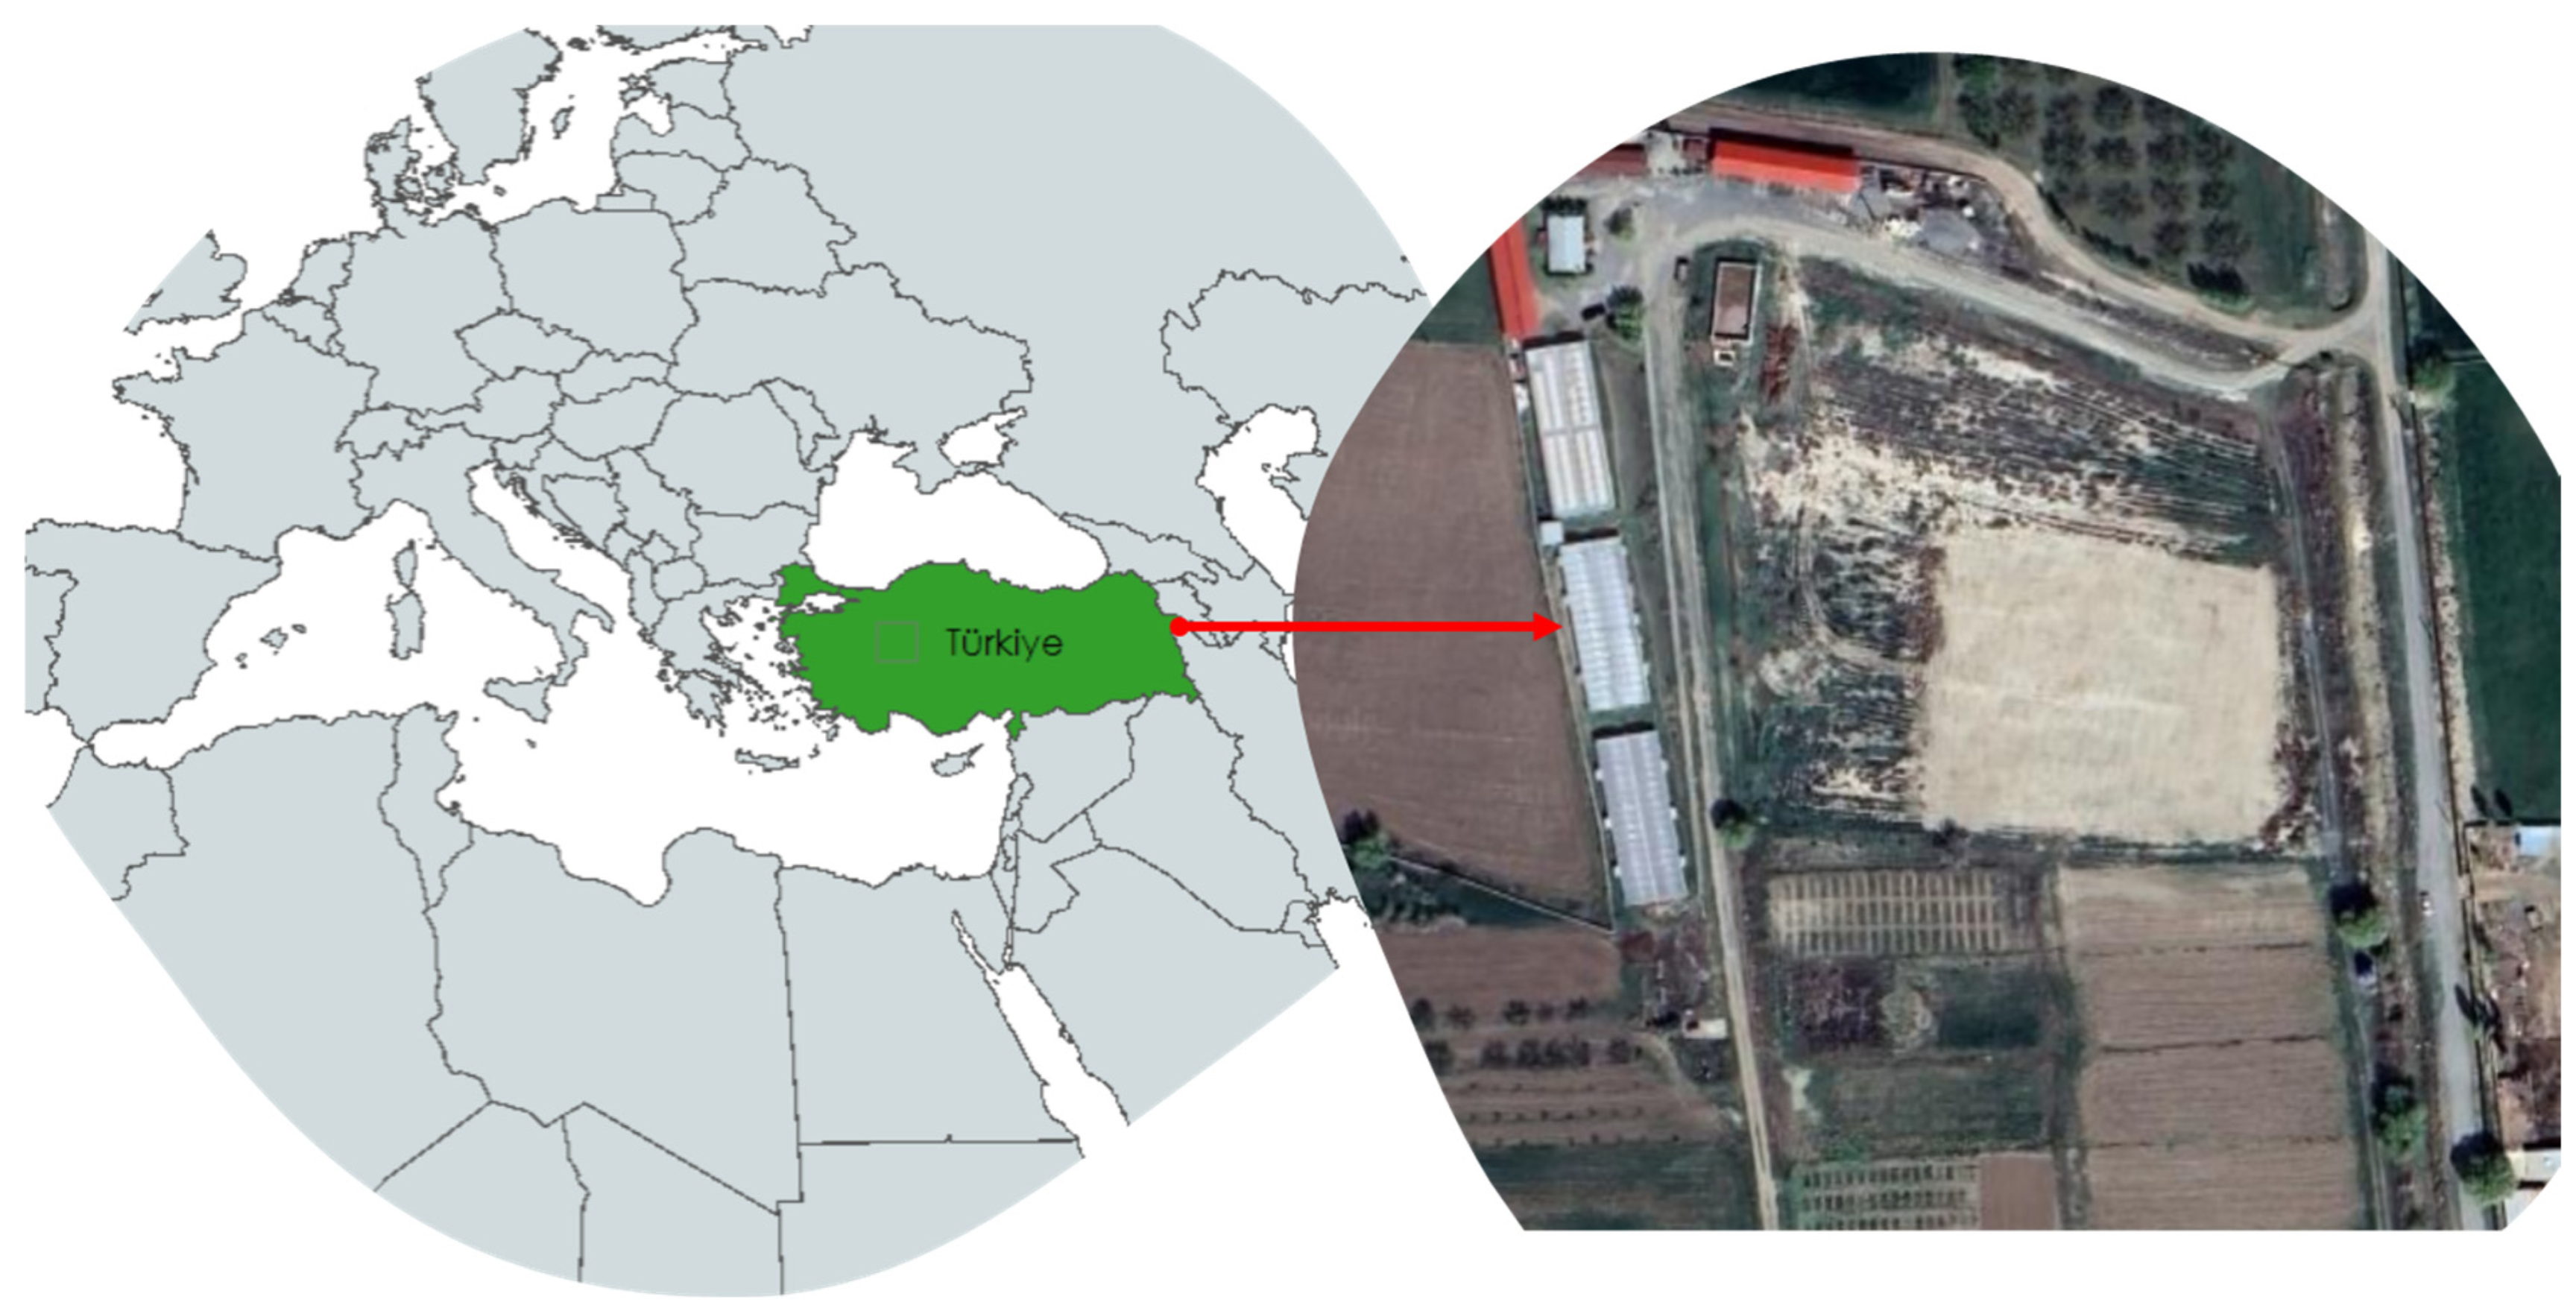
Figure 1: Global location of study area.
2.2 Experimental Greenhouse and Measurement System
The study was carried out in a 525 m2 (35 m × 15 m) greenhouse at the Agricultural Research and Application Center of Iğdır University. The greenhouse structure consisted of polycarbonate side walls and a polyethylene roof, equipped with side ventilation openings corresponding to 2.5% of the floor area. Row covers were 1.0 m in width and 0.9 m in height, with an approximate internal volume of 21 m3 per tunnel (Fig. 2). A total of 12 row covers were installed, of which six were supplemented with black polyethylene mulch (175 µm thickness) and six were maintained as non-mulched controls. Three commercial lettuce cultivars (Carmesi, El Maria, and Fiyonk) were planted with a row spacing of 40 cm and intra-row spacing of 30 cm. This design enabled comparative evaluation of mulched versus non-mulched row cover treatments under identical greenhouse conditions. Ventilation was applied during midday hours when indoor temperatures exceeded 25°C, and kept closed otherwise to minimize convective heat loss.
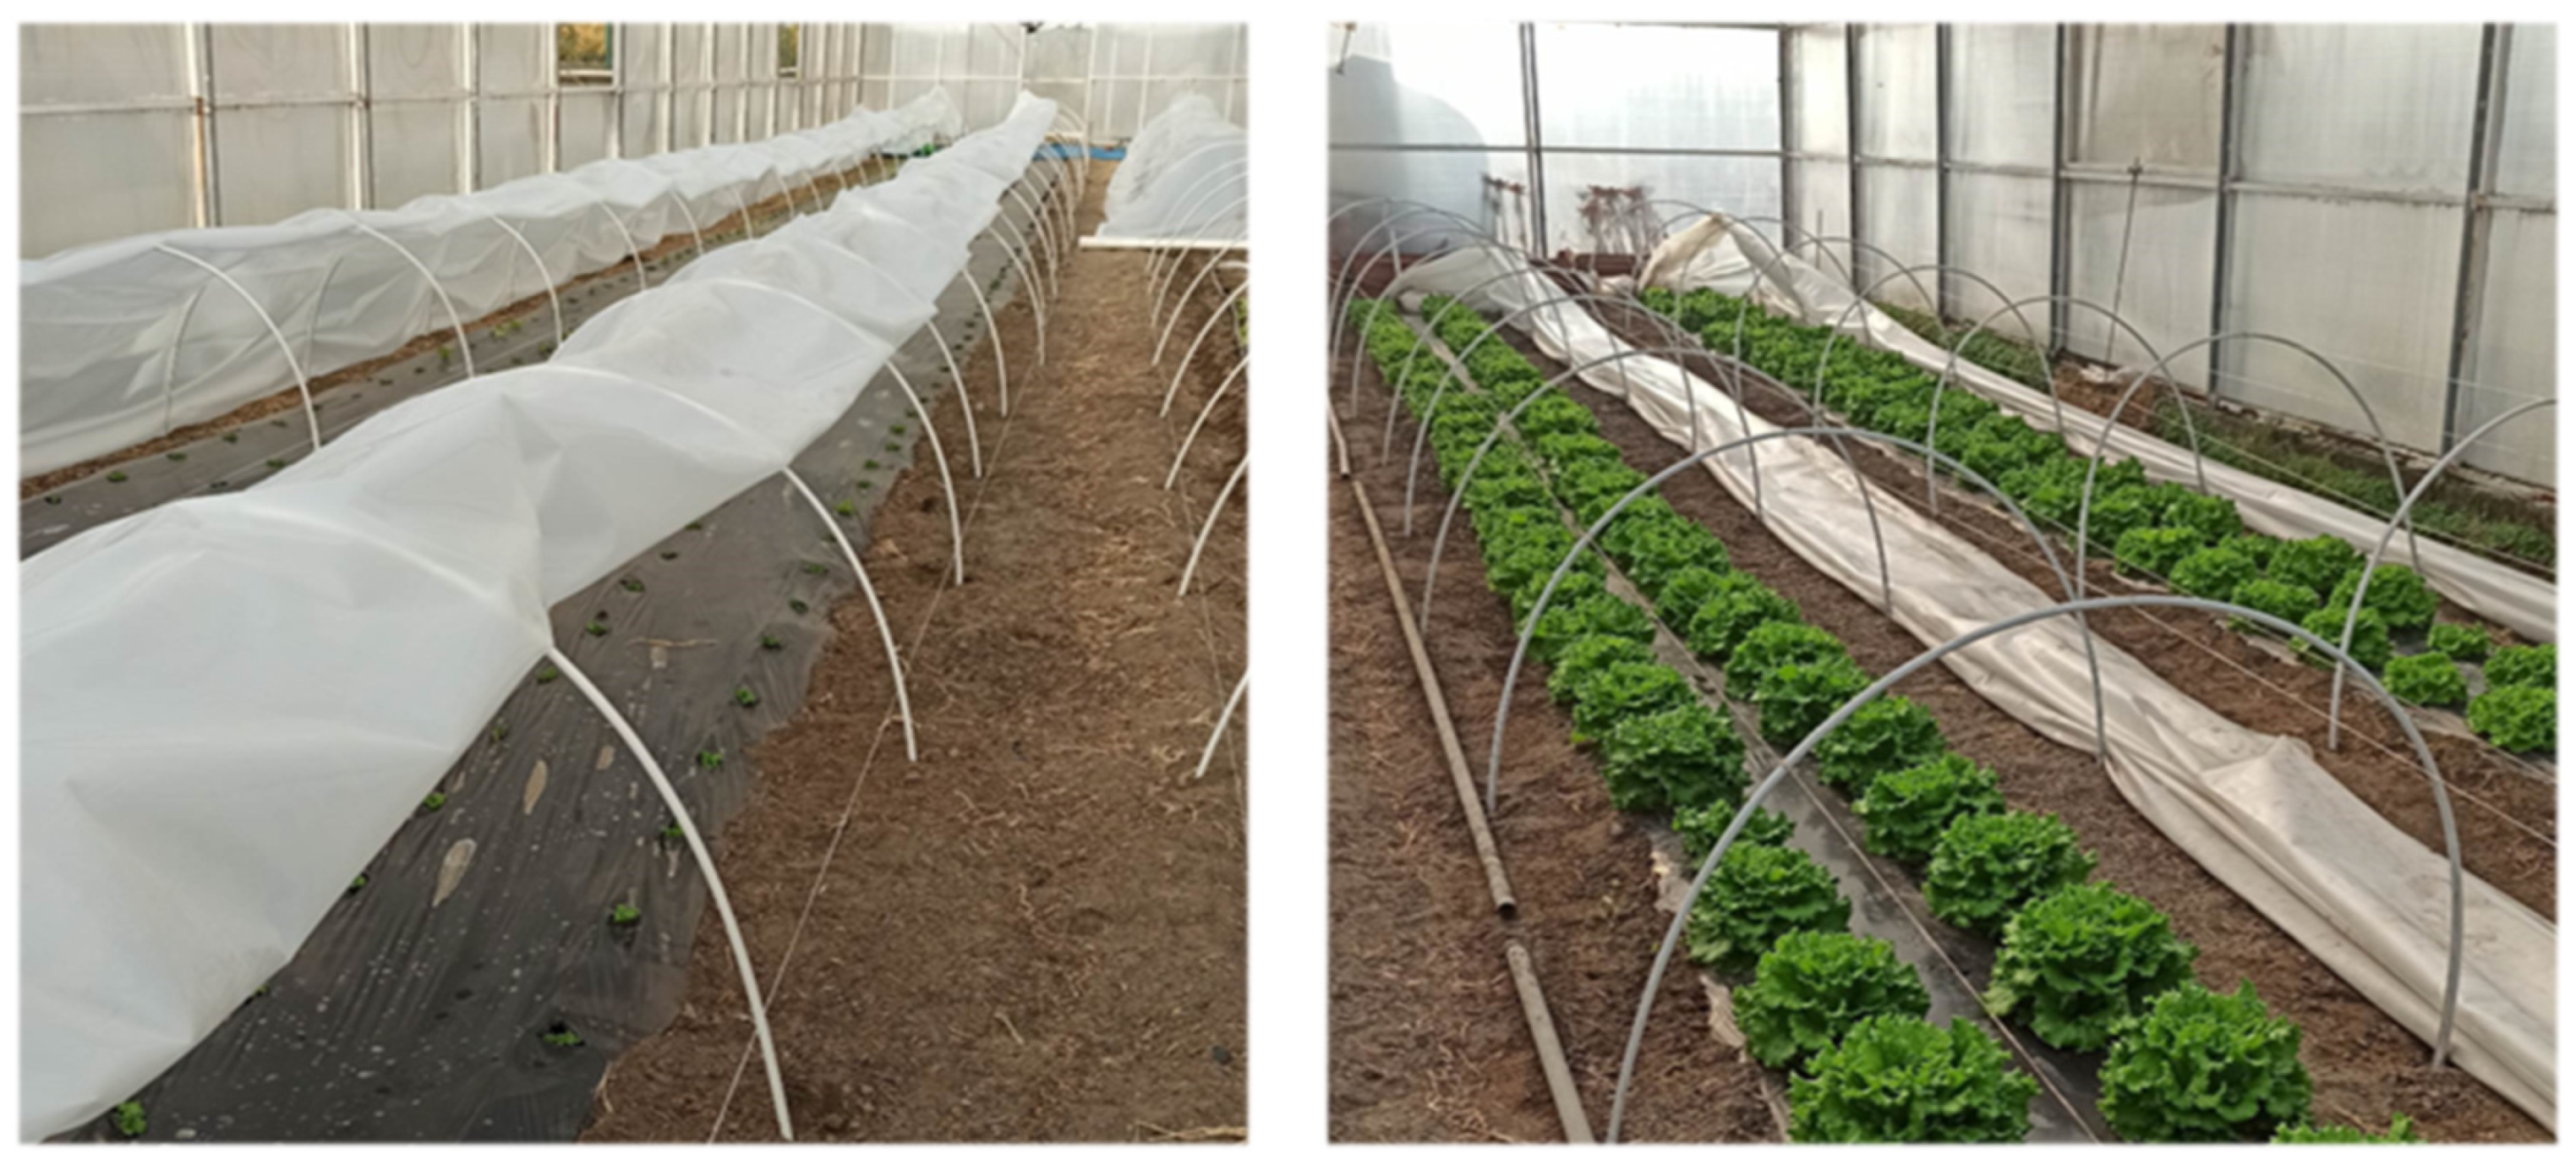
Figure 2: Row covers inside an experimental greenhouse.
Environmental parameters were monitored throughout the 61 days growing period, ending with harvest on 3 January 2023. Temperature sensors (HOBO UX-120-006M, Onset Computer Corporation, USA) were deployed to record outdoor air temperature, greenhouse indoor temperature, and inside the row covers. Root zone temperature (RZT) was continuously measured at depths of 1, 10, 20, and 30 cm in both mulched and non-mulched tunnels. The temperature sensors had an operational range of −20°C to 80°C with an accuracy of ±0.2°C. Relative humidity inside the row covers was measured using Elitech RC-4HC loggers, which have a measurement range of 10–99% and an accuracy of ±3%.
As neither manufacturer provided a specific calibration procedure in the user manuals, a two-point check method was applied to evaluate differences among the sensors. For quality control, all probes were placed side by side for 24 h in a controlled indoor environment; no sensor deviated beyond the accuracy specified by the manufacturer. Additional meteorological parameters, including solar radiation and wind speed, were obtained from the automated weather station at the Agricultural Research and Application Center of Iğdır University. Measurements were recorded at 5-min intervals and subsequently aggregated into hourly and daily averages for analysis.
In the outdoor environment, air temperature, relative humidity, solar radiation and wind speed were measured, whereas inside the greenhouse the air temperature and, within the row covers, air temperature and relative humidity were monitored. In addition, soil temperature was measured at depths of 1, 10, 20 and 30 cm beneath the row covers. The experimental design and sensor layout are presented in Fig. 3. Raw 5-min records were downloaded from the HOBO and Elitech loggers as CSV files and merged in RStudio based on their time stamps. All time series were converted to local time (GMT+3) and aligned to a common 5-min grid. The cleaned 5-min data were then aggregated to hourly means for all variables; only hours with a complete set of predictors and a valid target value (Tym10 or Tnm10) were retained.
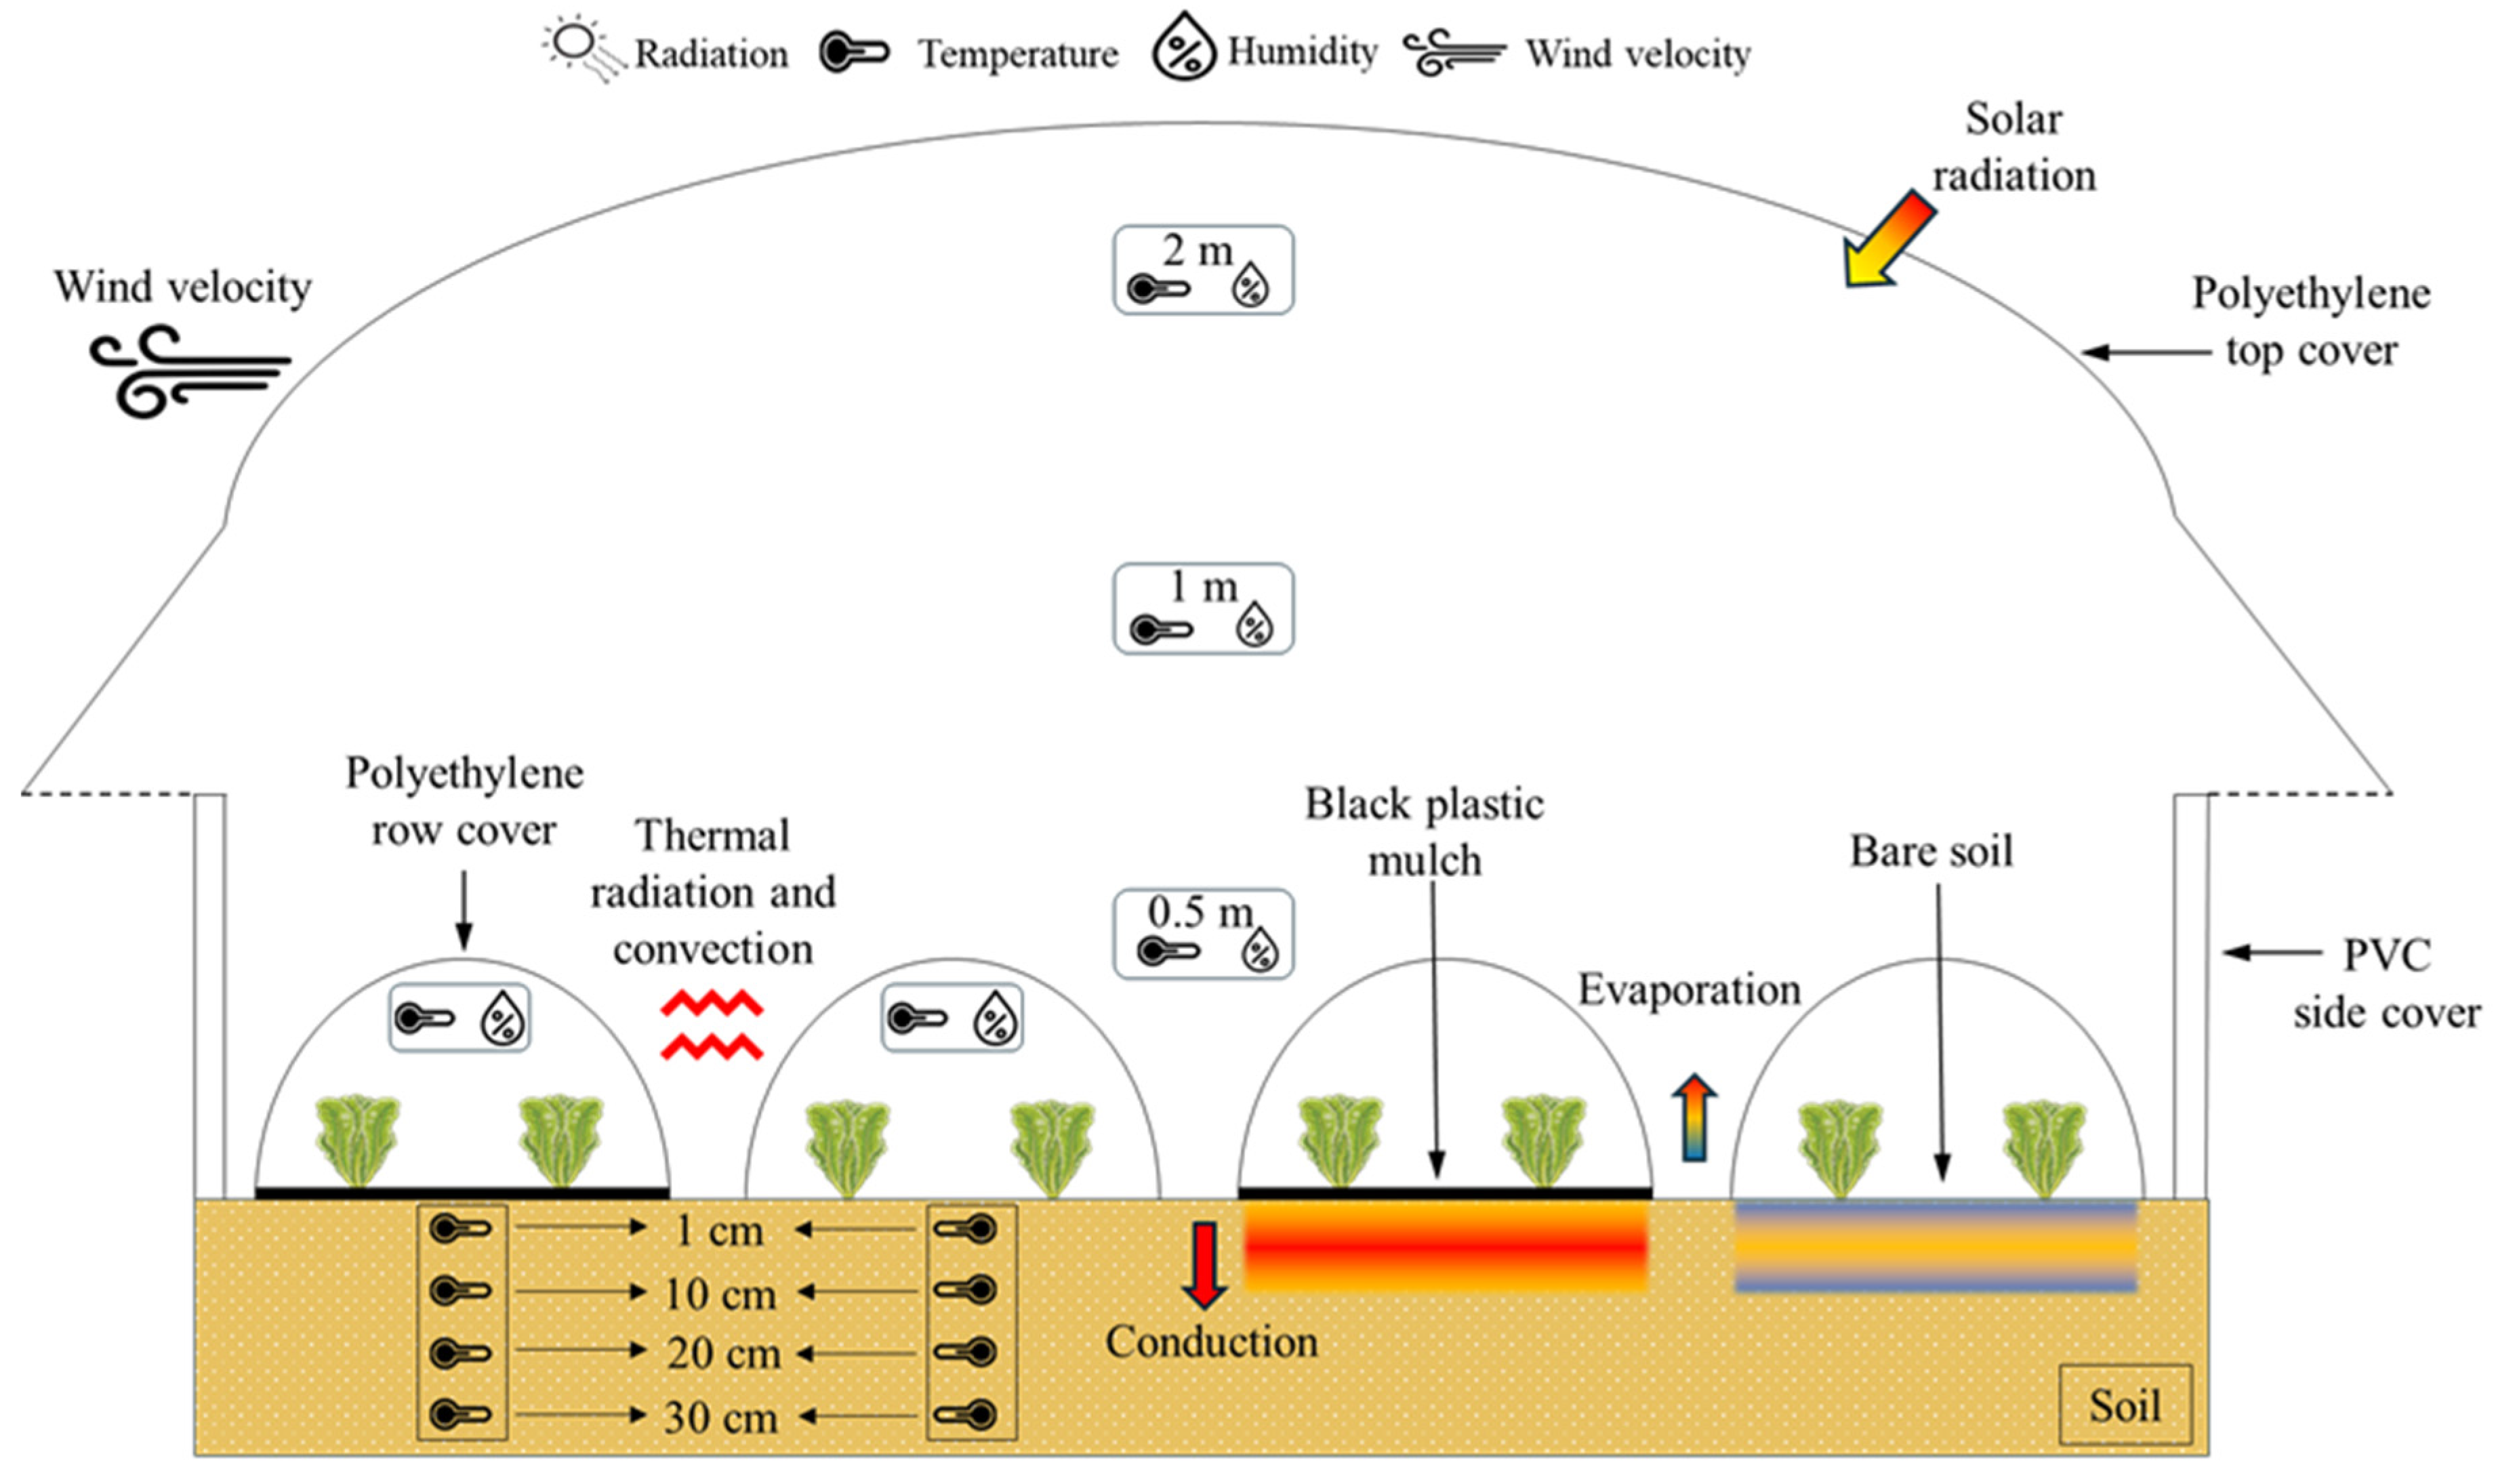
Figure 3: Schematic description of application and sensor layout.
Measurement uncertainties were assessed using the method proposed by [35]. If the experimental result ωR is a function of independent variables (x1, x2, x3, x4, …, xn), combined uncertainty is given by Eq. (1);
Here R is a calculated result, x1, x2, x3, …, xn are the measured values. ω1, ω2, ω3, …, ωn is the uncertainty of the values x1, x2, x3, …, xn measured respectively. ωR is the absolute uncertainty of the outcome R and ωR is the percentage uncertainty of the outcome R. In this study, the experiments are conducted at 4.06% uncertainty.
2.4 Statistics and Machine Learning Model
Greenhouse environments represent complex, nonlinear systems in which multiple meteorological and biological factors interact dynamically. Machine learning (ML) techniques are well suited for modeling such systems due to their ability to approximate nonlinear functions. In this study, all statistical analyses and the eXtreme Gradient Boosting (XGBoost) algorithm were implemented in R (v.2025.05.0-496) [36] using the XGBoost package together with the supporting libraries car, rstatix, caret, tidyverse, ggplot2, corrplot, dalex and psych. The full dataset, consisting of 1272 hourly observations, was randomly partitioned into a training set (70%) and an independent test set (30%), and separate XGBoost models were fitted for the mulched and non-mulched treatments.
XGBoost was selected as the primary modeling framework for several reasons. First, the dataset corresponds to a typical medium-sized tabular problem with a moderate number of predictors, a setting in which gradient-boosted decision trees are known to perform strongly and often outperform or match artificial neural networks and deep-learning architectures while requiring less hyperparameter tuning and computational effort [37,38]. Second, recent studies on soil and root-zone temperature prediction have reported that boosting ensembles, and XGBoost in particular, achieve equal or superior accuracy compared with random forest, support vector regression, multilayer perceptrons and other classical methods across different depths and climatic conditions [21,22,29,39,40]. In addition, XGBoost provides built-in feature-importance measures and is readily compatible with post-hoc interpretation tools such as partial dependence and sensitivity analysis, which aligns with the aim of this study to link the dominant predictors to soil-physics and crop-physiology processes.
To examine whether air temperatures measured at different heights inside the greenhouse (0.5, 1.0, 1.5 and 2.0 m) could be pooled, a one-way analysis of variance (ANOVA) was applied with height as a fixed factor and hourly indoor temperature as the response variable. The null hypothesis stated that the mean greenhouse air temperature is identical at all four elevations, and the alternative that at least one height differs. As no significant differences were detected (p > 0.05), the vertical temperature profile was considered homogeneous, and the temperature at 0.5 m (canopy level), together with the average across all heights, was used in the subsequent descriptive analyses.
To evaluate the effect of mulch on root-zone temperature at the effective depth, an independent-samples t-test was performed to compare the mean soil temperature at 10 cm under mulched (Tym10) and non-mulched (Tnm10) tunnels. The null hypothesis was that the mean Tym10 and Tnm10 values are equal, and the alternative that mulching alters the mean RZT. Assuming independence of hourly observations between treatments and approximate normality of the residuals, the test was conducted at α = 0.05. The resulting p-value (<2.2 × 10⁻¹⁶) provided strong evidence against the null hypothesis and confirmed that mulch application significantly increased root-zone temperature.
Descriptive statistics and correlation analysis were first inspected to verify that the distributions of the variables were well behaved and to identify potential multicollinearity among predictors. Because XGBoost is a tree-based method and therefore scale-invariant, no standardization or normalization of the continuous variables was applied. The input features included solar radiation (Rad), wind speed (Vw), relative humidity (TambRh, TrcymRh, TrcnmRh), air temperature (Tamb, TgRh, Trcym, Trcnm) and soil temperatures at 1, 20 and 30 cm depth (Tym1, Tym20, Tym30 or Tnm1, Tnm20, Tnm30). The model outputs were the predicted RZT at 10 cm depth (Tym10 for mulched and Tnm10 for non-mulched conditions). Model performance was evaluated using root mean square error (RMSE), mean absolute error (MAE) and the coefficient of determination (R2). Ten-fold cross-validation on the training set was adopted for hyperparameter tuning, and feature-importance and sensitivity analyses were conducted to assess model robustness and interpretability. A schematic diagram of the modeling workflow is given in Fig. 4.
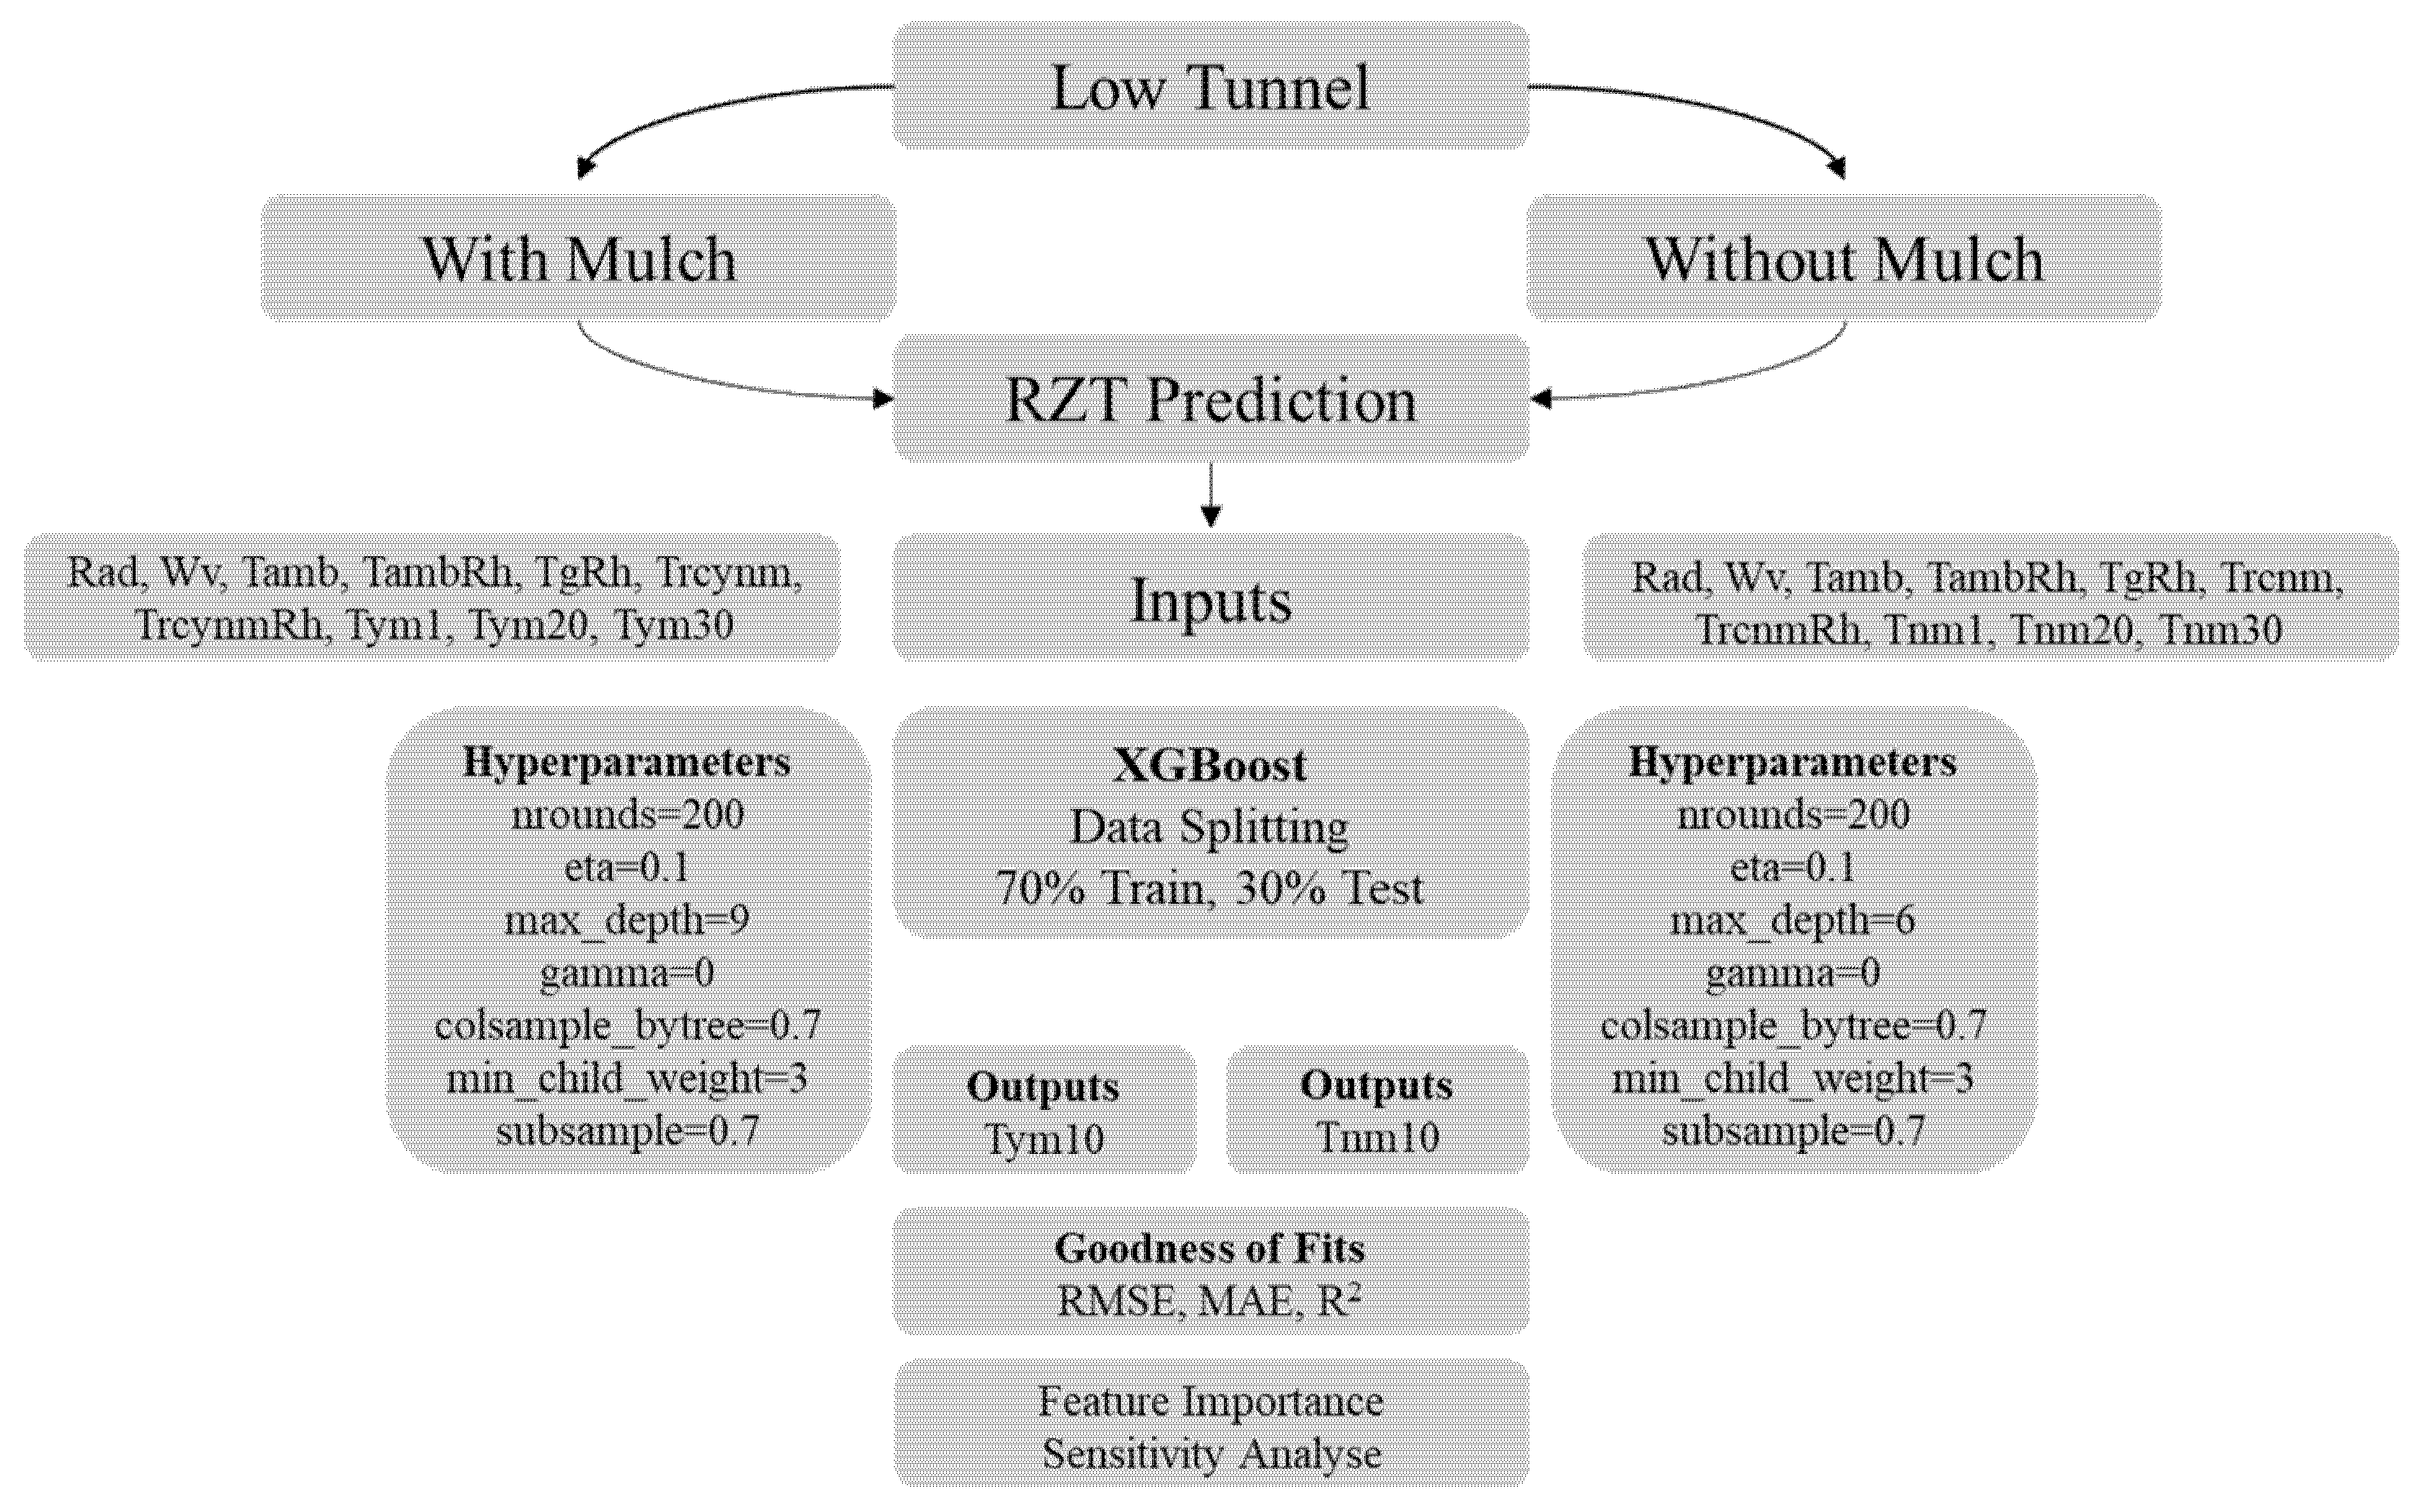
Figure 4: Roadmap of the model with XGboost algorithm.
Hyperparameter tuning of the XGBoost models followed current best-practice recommendations for gradient-boosting algorithms. A regular grid was defined over seven key hyperparameters: the number of boosting rounds (nrounds), maximum tree depth (max_depth), learning rate (eta), minimum loss reduction required to split a node (gamma), column subsampling fraction (colsample_bytree), minimum child weight (min_child_weight), and row subsampling fraction (subsample). Candidate values were specified to span shallow to moderately deep trees and conservative to more aggressive learning rates (e.g., nrounds ∈ (100, 200, 400), max_depth ∈ (3, 6, 9), eta ∈ (0.05, 0.10, 0.20), gamma ∈ (0, 0.05), colsample_bytree ∈ (0.6, 0.7, 0.8), min_child_weight ∈ (1, 3, 5), subsample ∈ (0.6, 0.7, 0.8). For each combination in the grid, 10-fold cross-validation was repeated on the training set, and the configuration that minimized the cross-validated RMSE was selected as optimal. The final tuned models for Tym10 and Tnm10 corresponded to nrounds = 200, eta = 0.10, gamma = 0, colsample_bytree = 0.70, min_child_weight = 3 and subsample = 0.70, with max_depth = 9 for the mulched case and 6 for the non-mulched case, as reported in Table 1.
Table 1: Hyperparameter optimization for XGBoost algorithm.
| Parameters | With Mulch | Without Mulch |
|---|---|---|
| nrounds | 200 | 200 |
| max_depth | 9 | 6 |
| eta | 0.1 | 0.1 |
| gamma | 0 | 0 |
| colsample_bytree | 0.7 | 0.7 |
| min_child_weight | 3 | 3 |
| subsample | 0.7 | 0.7 |
After tuning, the best hyperparameter set for each treatment was used to refit the model on the entire training subset, and predictions were generated for both the training and test data. Model accuracy was quantified using root mean square error (RMSE), mean absolute error (MAE), and the coefficient of determination (R2), computed according to Eqs. (3)–(5). In addition, feature importance was derived from the trained XGBoost models using gain, cover and frequency statistics, while model-agnostic sensitivity analysis based on mean dropout loss was carried out with the Dalex package to evaluate the impact of removing each input variable on prediction error. Together these steps provide a transparent and reproducible pipeline from raw sensor data to tuned, validated models for estimating root-zone temperature under mulched and non-mulched greenhouse conditions.
XGBoost has some superior properties like speed, accuracy, flexibility and is supported by the open-source community. Thanks to these properties, it is very popular in data science competitions like Kaggle. It is a gradient boosting algorithm that progresses by correcting the errors in the previous model with each new model. During training of the model, a classification and regression tree (CART) is created, and each tree is retrained using the residuals (errors) of the previous tree (Eq. (2)).
Some evaluation criteria have been determined in the literature to measure performance of models created to predict output data. These criteria to be used specifically for this study are Root Mean Square Error (RMSE; Eq. (3)), Mean Absolute Error (MAE; Eq. (4)), Coefficient of Determination (R2; Eq. (5)). Evaluation of the algorithms depends on goodness of fit criteria that are defined as follows [41,42]:
3.1 Temperature and Humidity Changes in Open and Closed Environments
Meteorological parameters that are important for greenhouse production are given in Fig. 5, showing daily averages of outdoor temperature, wind speed, and radiation. Continuous monitoring at 5-min intervals revealed substantial thermal variation, with recorded temperatures ranging from −11.40°C (min) to 27.65°C (max), establishing a mean ambient temperature of 4.83°C throughout the study duration.
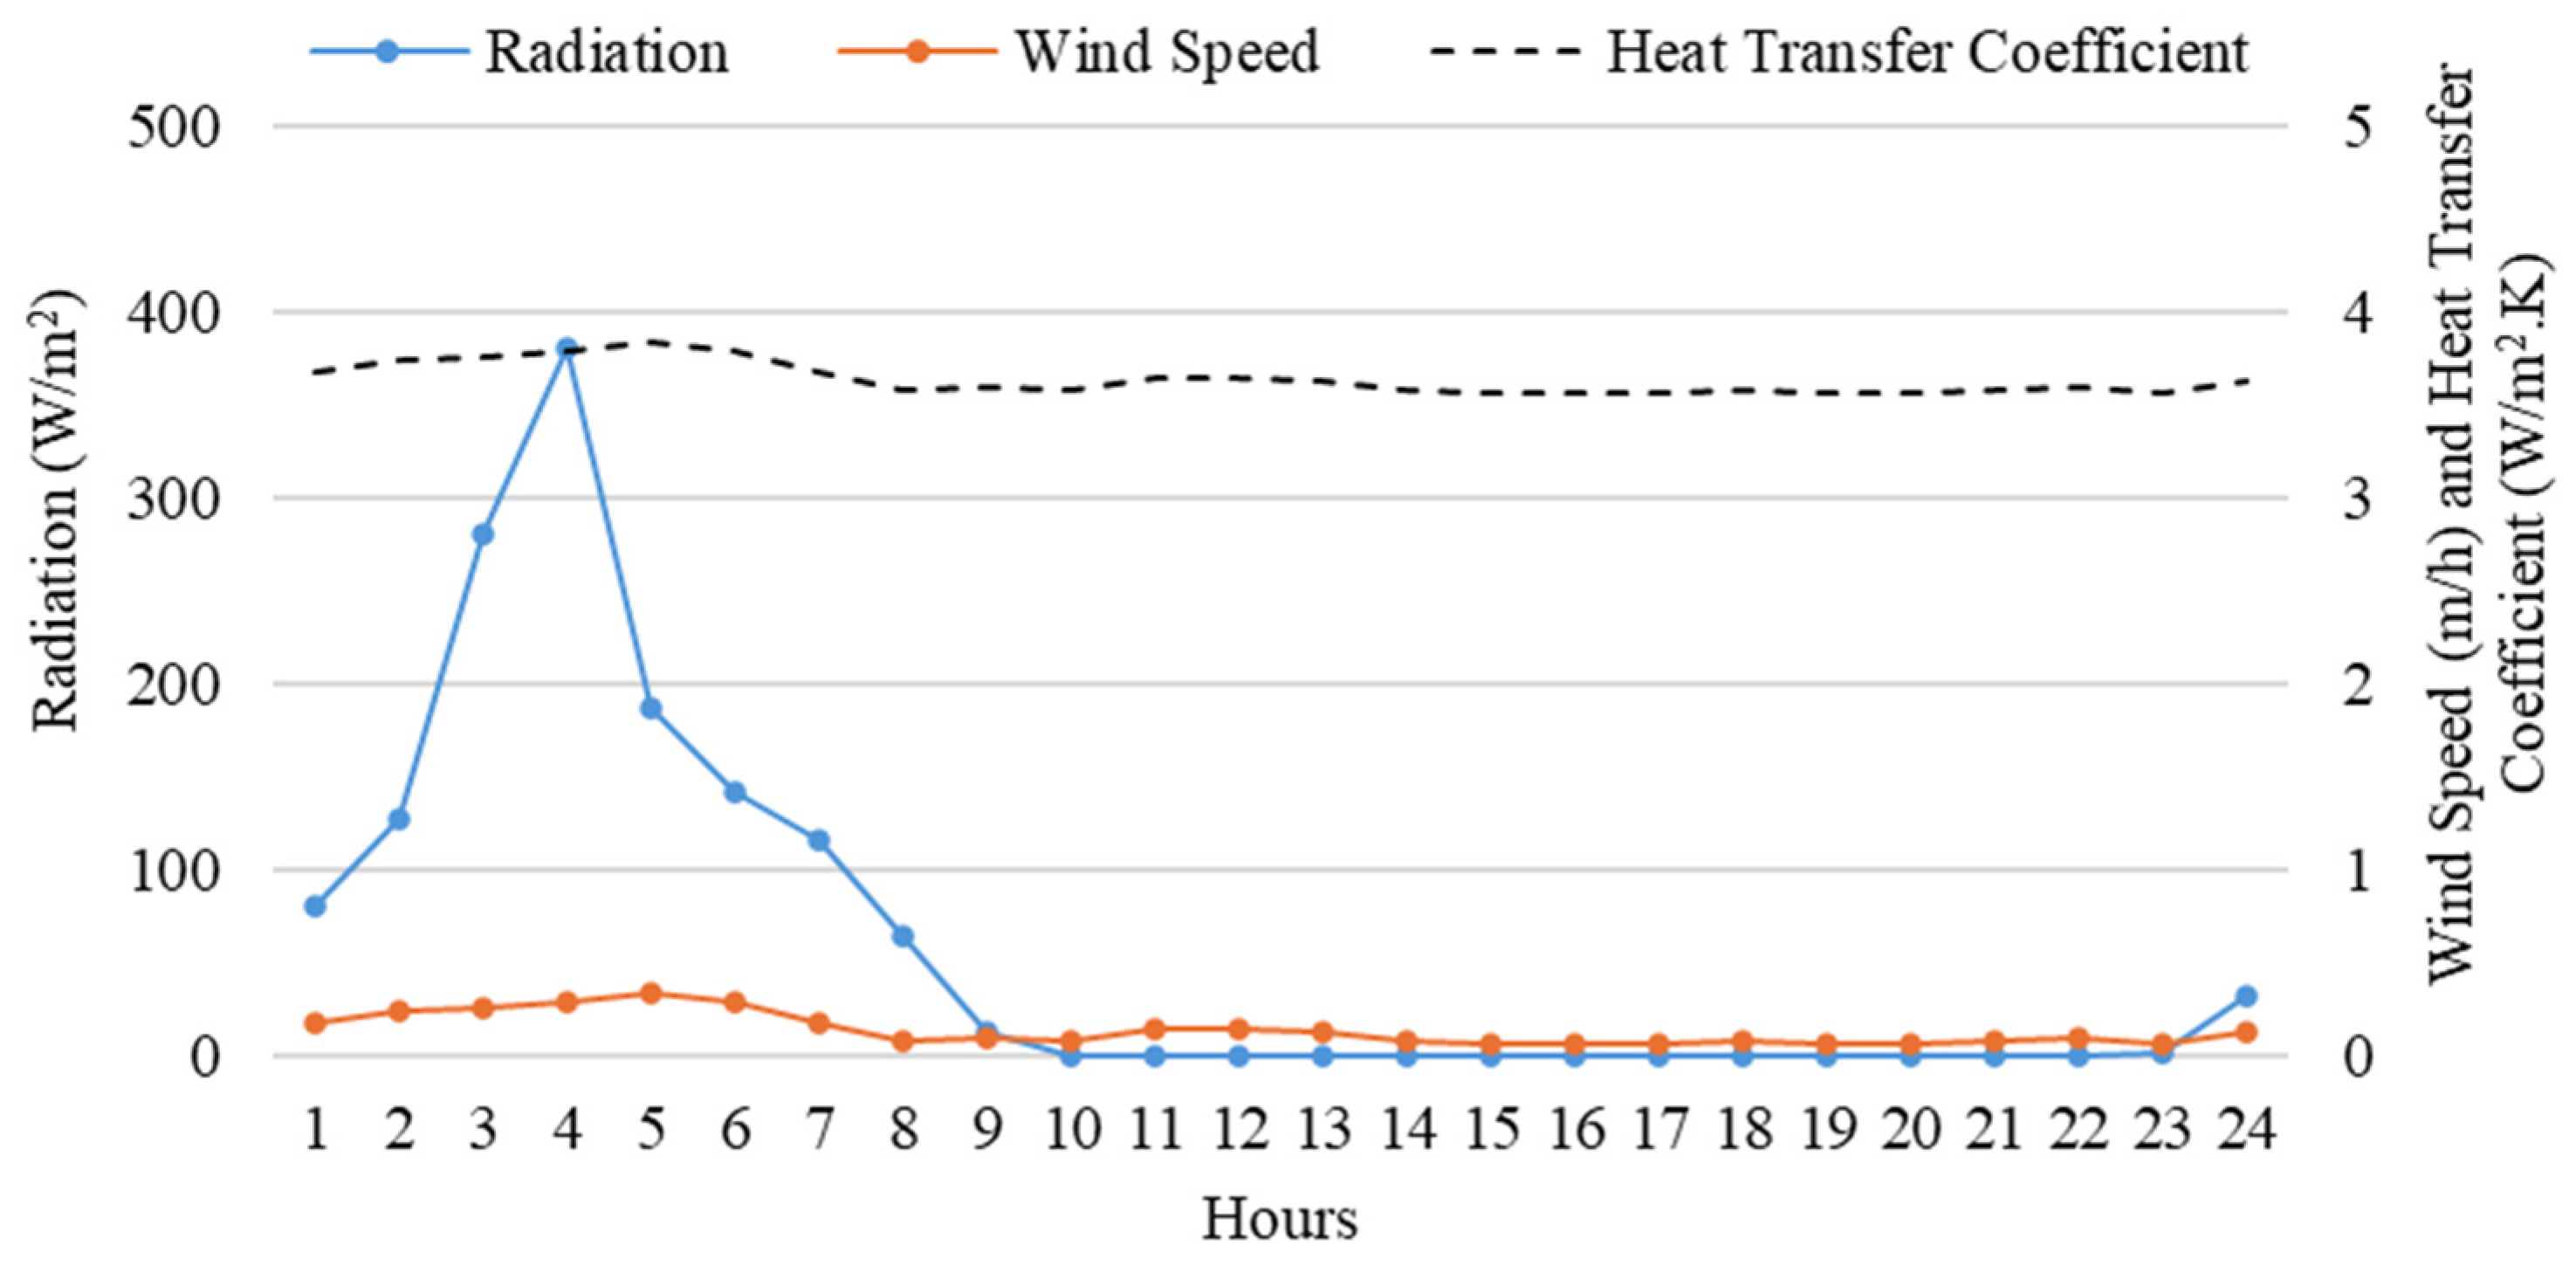
Figure 5: Average hourly changes in solar radiation, wind speed and outside surface heat transfer coefficient on the reference day.
Air temperature in the greenhouse was monitored at four vertical heights (0.5 m, 1 m, 1.5 m, and 2 m) to evaluate thermal stratification. Statistical analysis (p > 0.05) confirmed no significant differences between elevation levels, justifying the use of average hourly values for subsequent analysis. During the cultivation period, greenhouse temperatures exhibited considerable variation, ranging from −5.2°C (minimum) to 33.3°C (maximum), with a average of 8.3°C. The maximum temperature (33.3°C) occurred on 18 November 2022 at 13:35 local time, prompting immediate activation of ventilation windows and circulation fans to mitigate heat stress. Conversely, the minimum temperature (−5.2°C) was recorded on 11 December 2022 at 07:00. Average hourly temperature changes of ambient, greenhouse and row covers (with and without mulch) were given in Fig. 6.
During the experimental period, greenhouse demonstrated significant thermal buffering capacity. When the minimum outdoor temperature reached −11.4°C, the corresponding indoor air temperature was maintained at −5.4°C, representing a 6.0°C temperature difference. On average, the greenhouse interior maintained 3.4°C temperature elevation above outdoor conditions throughout the cultivation period. Subzero temperatures were recorded within the greenhouse interior on 11 nocturnal periods (18% of cultivation period for nights).
These suboptimal thermal conditions, particularly detrimental to lettuce (Lactuca sativa L.) cultivation, were effectively mitigated through the implementation of row cover interventions. The mean air temperature inside the row cover with mulch was 2.36°C higher than that of the greenhouse interior, while the row cover without mulch was on average 1.92°C warmer. During the coldest hours of the day throughout the cultivation period, the mulched row cover maintained a temperature 3.46°C above that of the greenhouse interior, whereas the non-mulched row cover was 3.40°C warmer. Supplemental thermal protection provided by row covers proved critical in maintaining viable growing conditions during these harsh cold events.
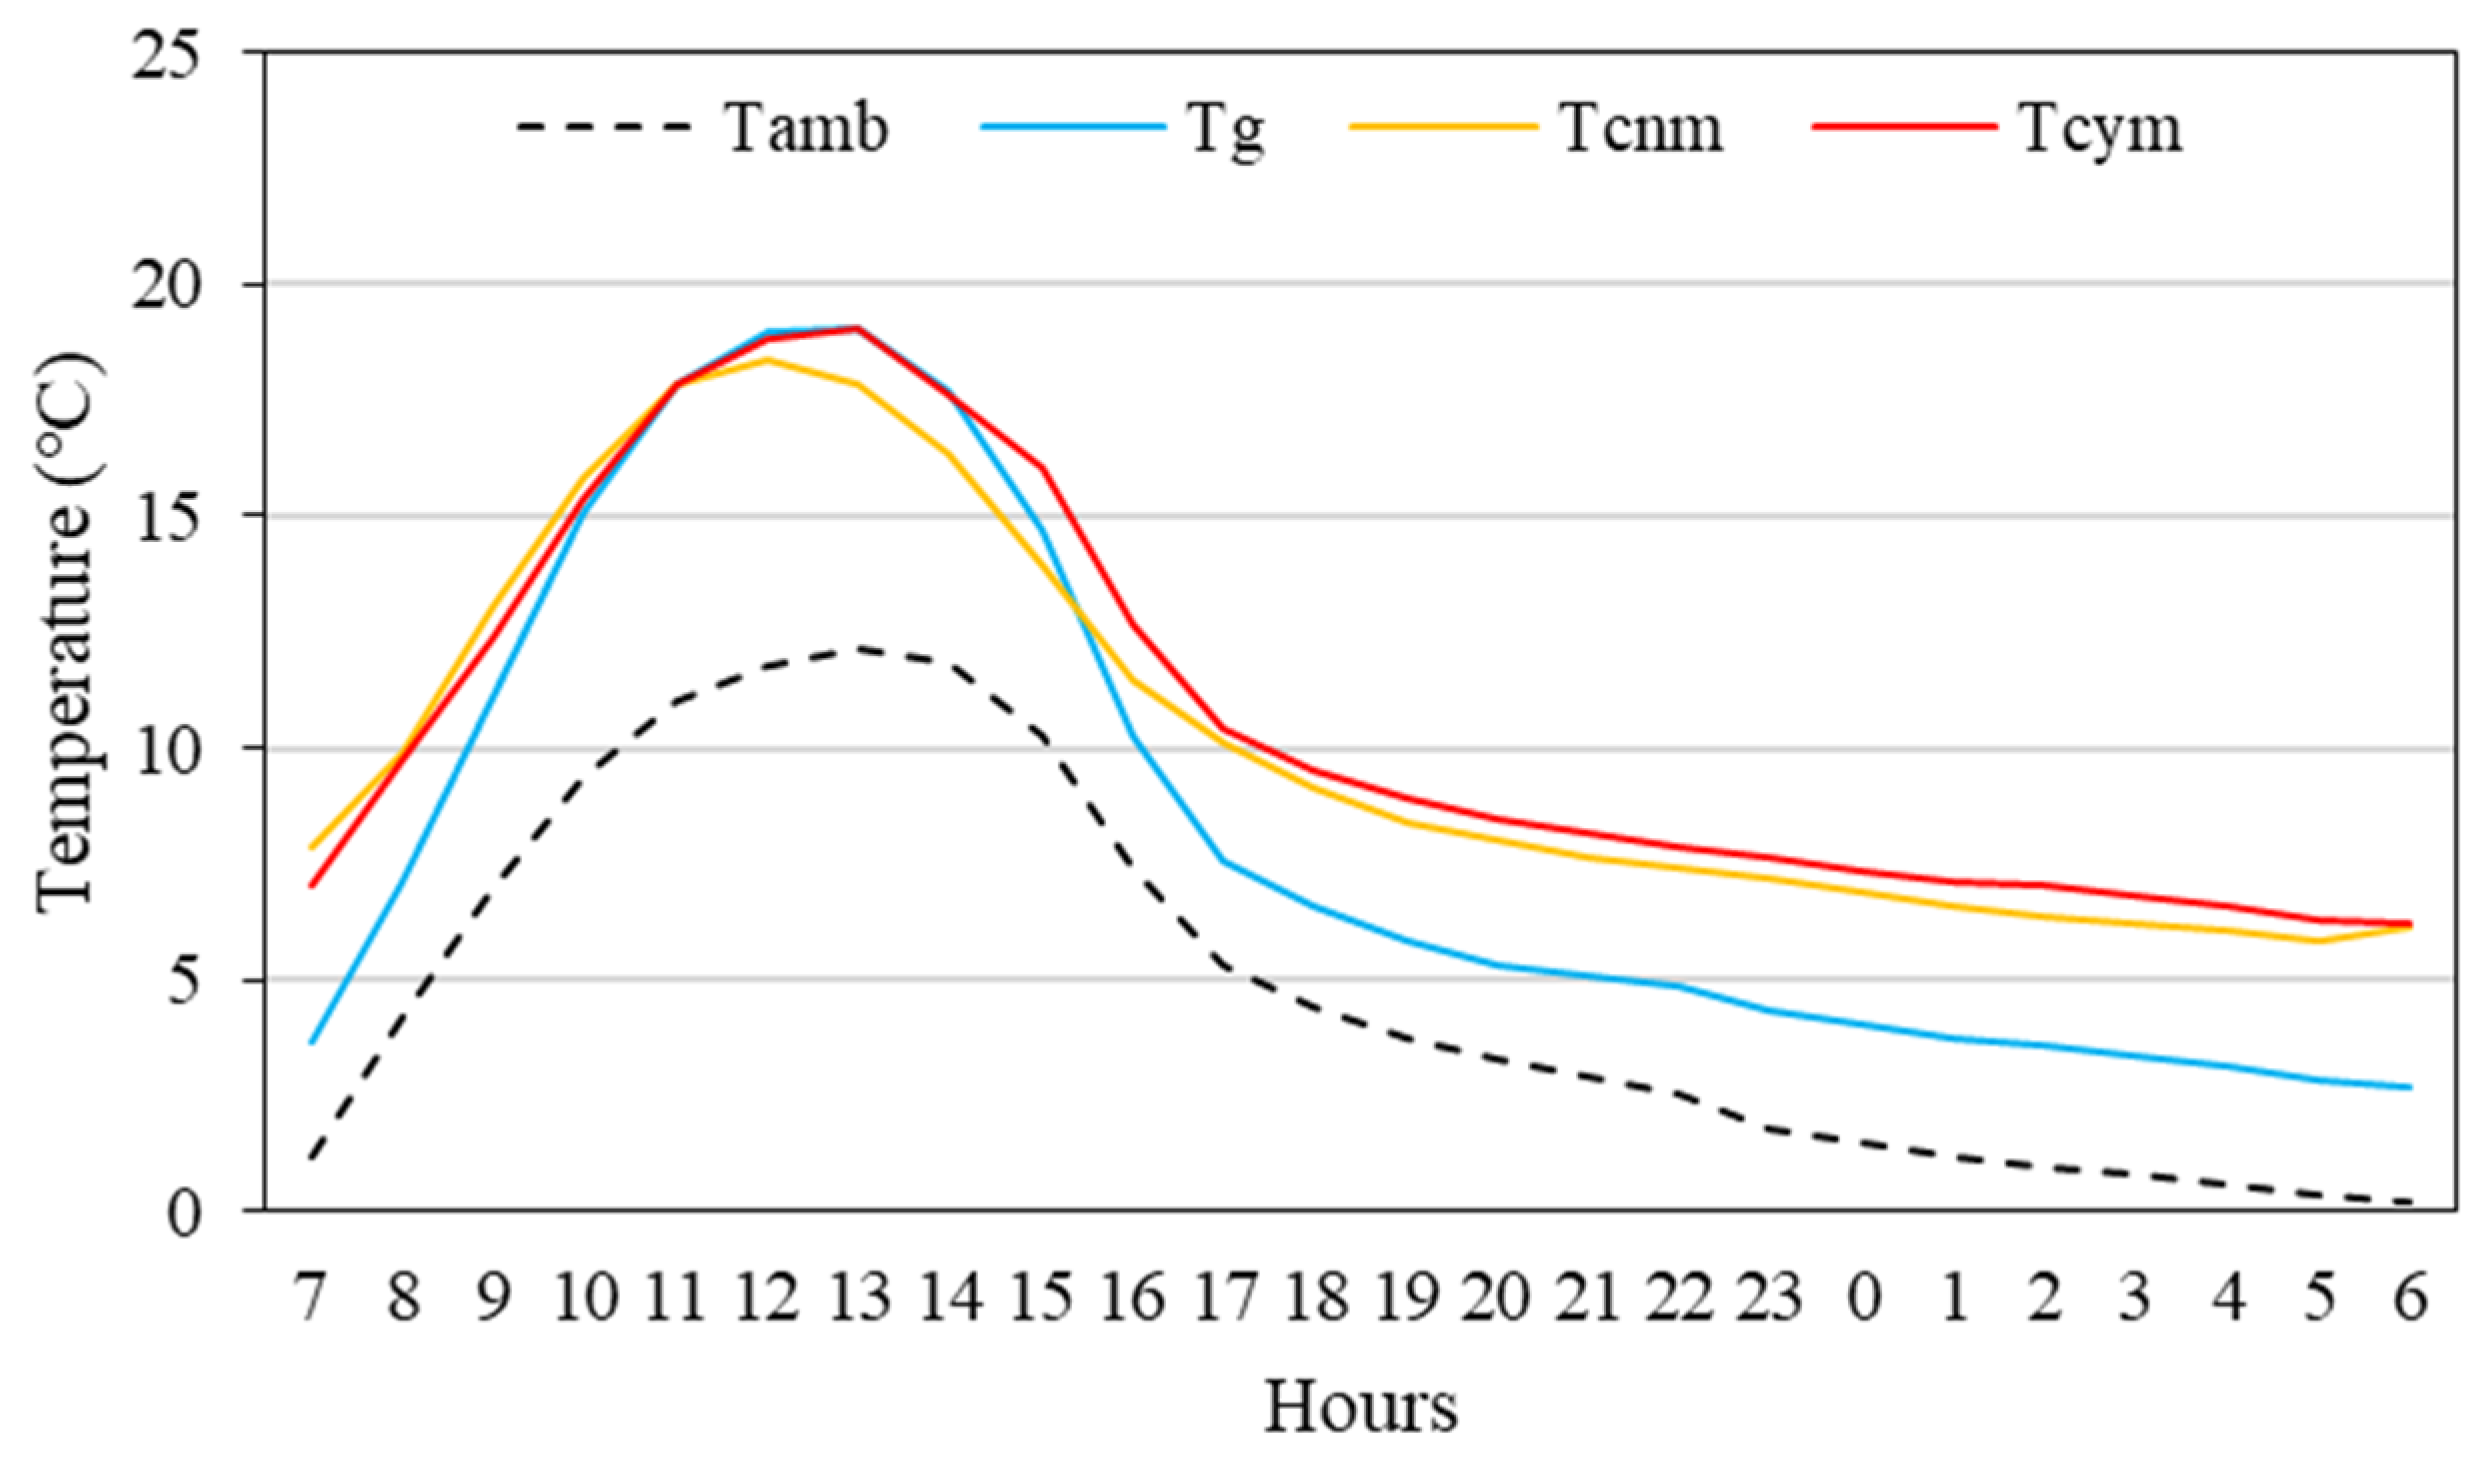
Figure 6: Hourly profiles of ambient temperature (Tamb), greenhouse temperature (Tg) and characteristic temperatures of the row covers Tcnm (without mulch) and Tcym (with mulch) configurations.
Previous studies have documented the thermal regulation capacity of row covers under varying environmental conditions. Lopez-Martinez [8] reported a mean temperature increase of 2.8 ± 1.2°C in greenhouse with row covers under Mediterranean climate conditions compared to control areas without tunnel protection. Similarly, Ref. [43] observed that row covers in open-field settings maintained daytime temperatures approximately 4°C higher than ambient conditions.
Consistent with these findings, experimental results demonstrate that row covers incorporating black plastic mulch exhibited superior thermal performance compared to non-mulched tunnels. Mulching functioned as an effective thermal energy reservoir, absorbing and storing solar radiation-derived heat during daylight hours and subsequently releasing this stored energy into the tunnel microenvironment during nocturnal periods. This diurnal heat flux modulation contributed significantly to nighttime temperature maintenance. Furthermore, the row cover structure itself provided critical insulation by suppressing convective heat transfer between the soil surface and the plant canopy air layer. This dual mechanism combining the thermal mass effect of mulch with the convective barrier properties of the tunnel structure resulted in enhanced temperature stability throughout the diurnal cycle.
Experimental results indicated minimal variation in average humidity levels between mulched and non-mulched tunnel environments, with mean values of 82.9% and 82.6%, respectively. Maximum and minimum humidity conditions were recorded within mulched tunnels (19.8–95.1%) and non-mulched tunnels (17.5–99.9%), as illustrated in Fig. 7. A distinct diurnal pattern was observed in both treatments, characterized by declining relative humidity levels corresponding to increased daytime temperatures and solar radiation intensity. These findings demonstrate consistent microclimate behavior across both cultivation methods and align with established literature on protected agricultural systems, particularly the works of [9] regarding humidity fluctuations in controlled environments and [44] on low-tunnel microclimate dynamics. The parallel responses between treatments suggest that mulch application had negligible effects on humidity regulation, with solar-mediated thermal changes serving as the primary driver of humidity variation in both systems.
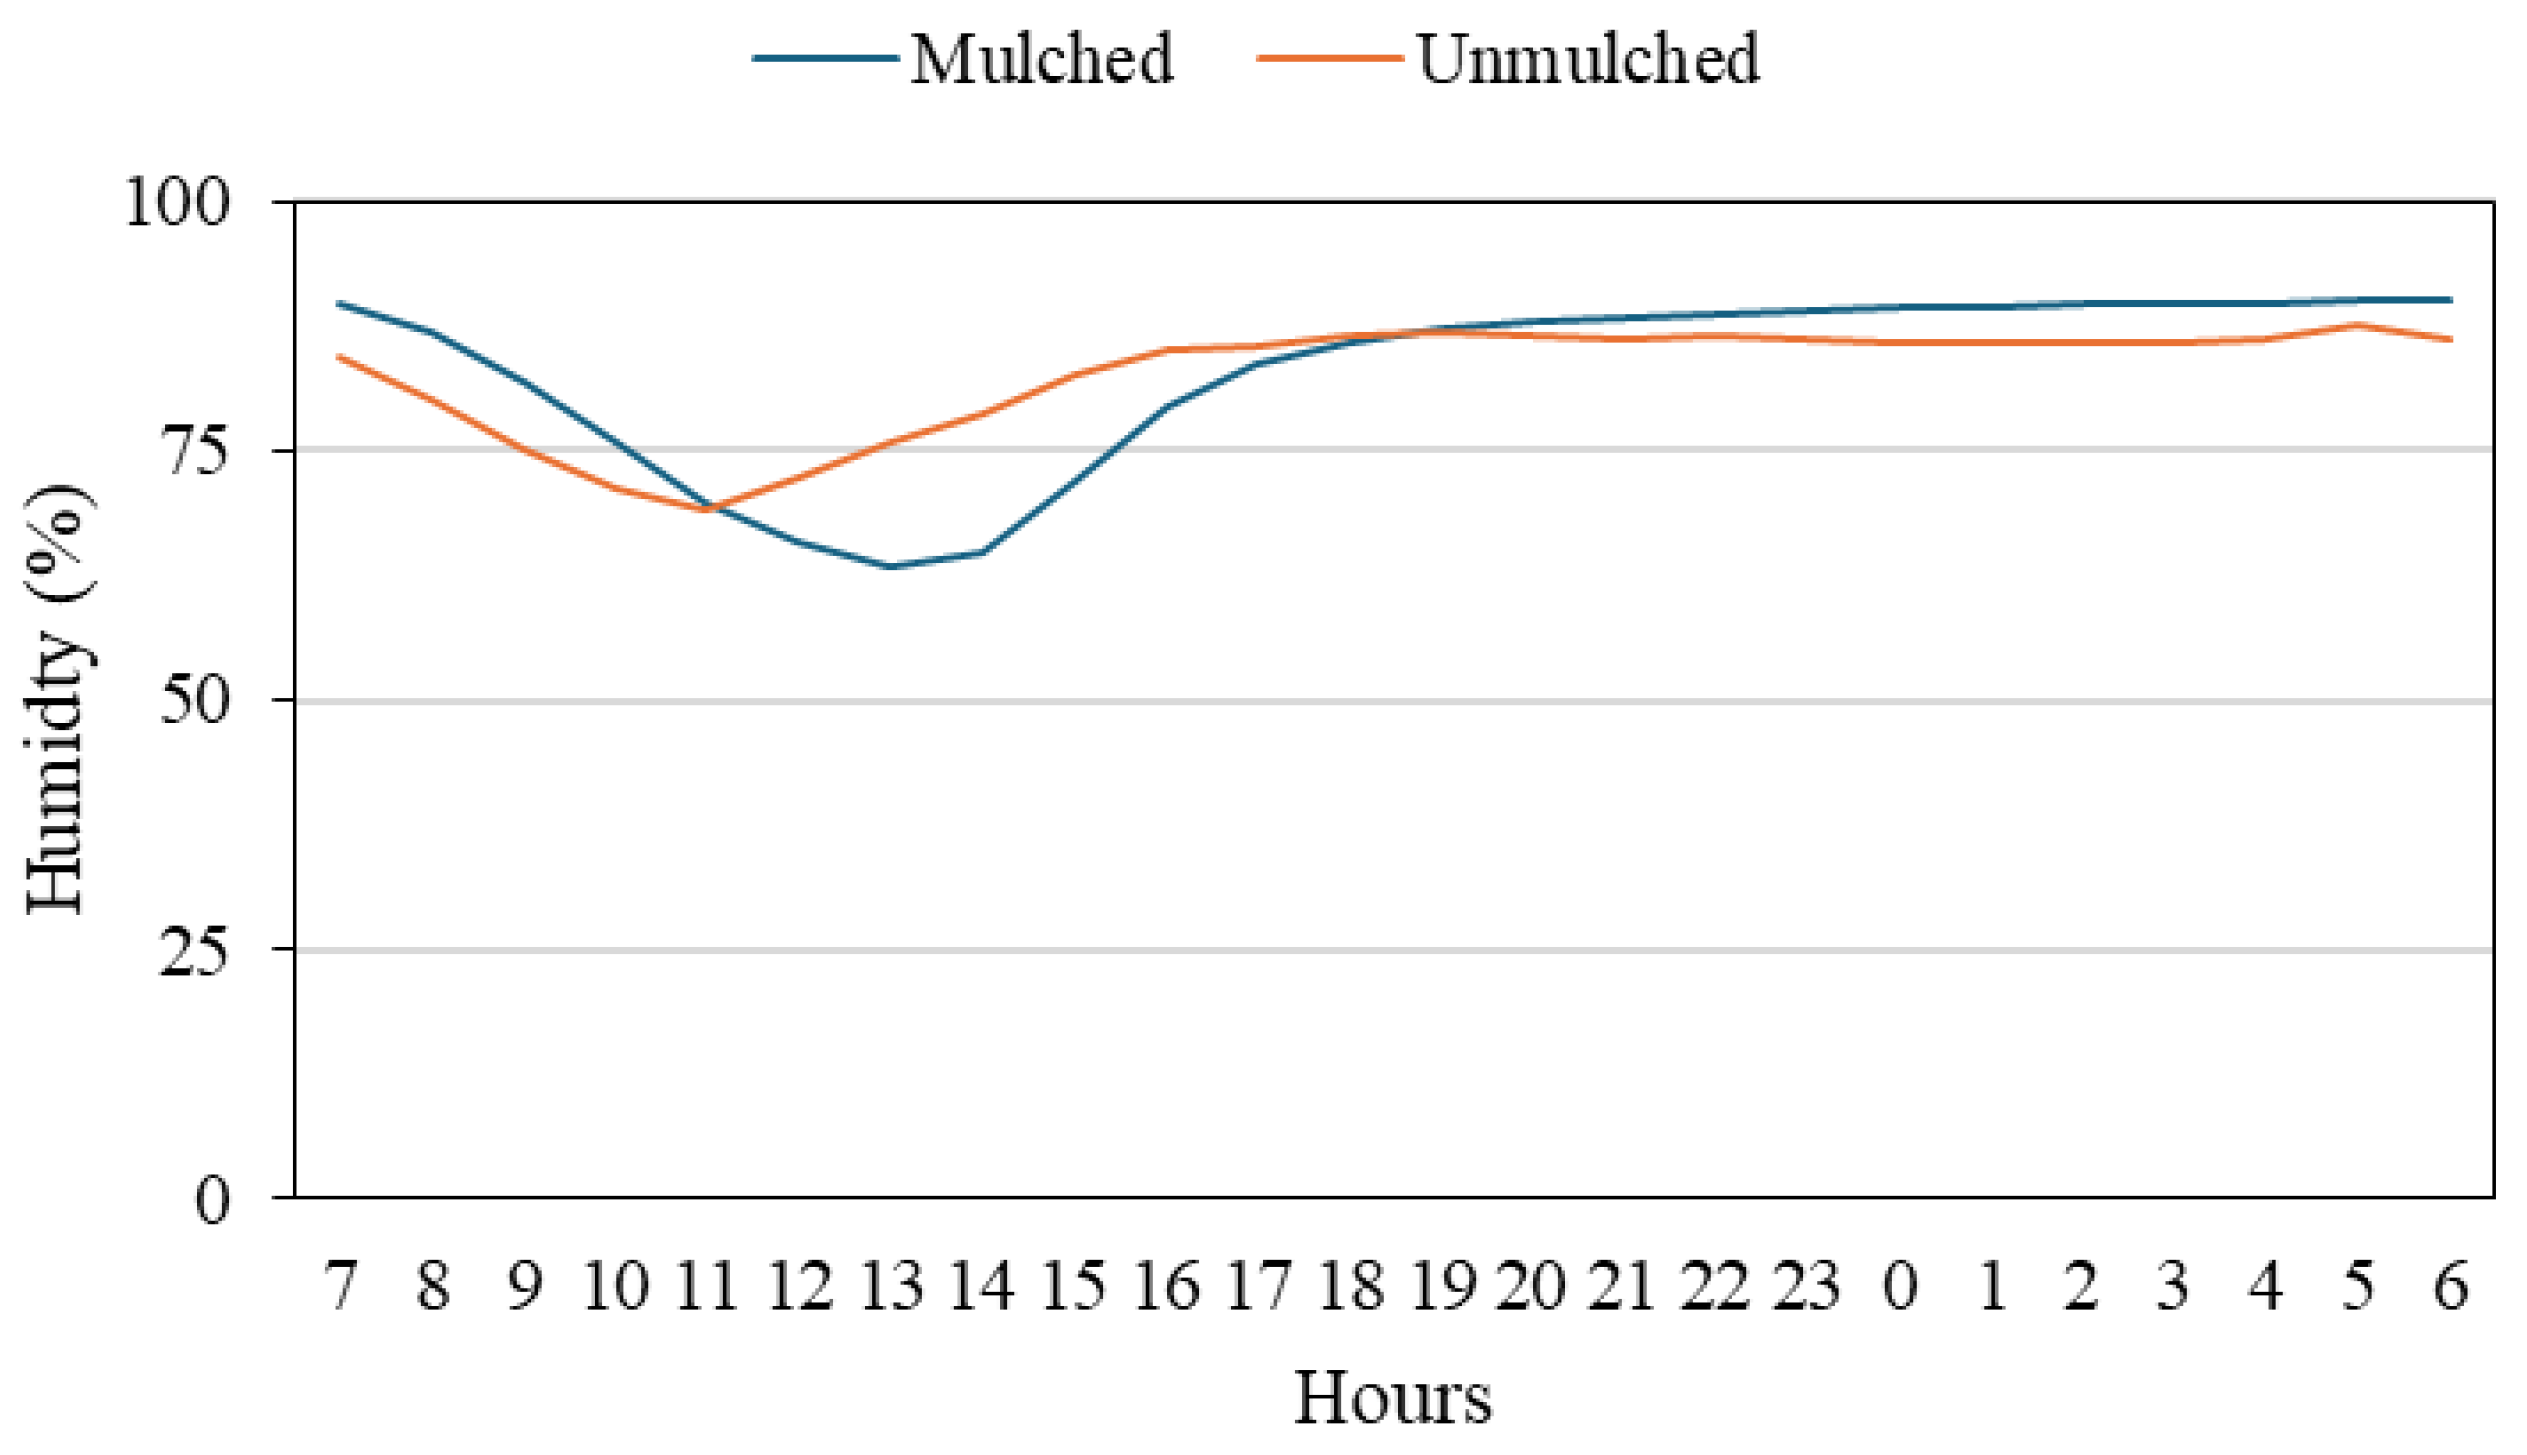
Figure 7: Air humidity inside the row covers with and without mulch.
Soil temperatures on root zone were measured throughout the growing period. Mulch application positively affected root zone temperatures. Surface soil temperatures exhibited diurnal variations inversely correlated with row cover air temperatures, with daytime values remaining lower than tunnel air temperatures but exceeding them during nocturnal periods. This thermal hysteresis pattern is attributable to the soil’s higher thermal mass and slower thermal response compared to air. The analysis showed clear vertical thermal gradients in the soil profile. At 1 cm depth, temperatures ranged from 6.6 to 24.0°C (mean 13.7°C); at 10 cm from 8.1 to 24.1°C (mean 14.1°C); at 20 cm from 10.0 to 24.1°C (mean 14.7°C); and at 30 cm from 10.8 to 24.1°C (mean 15.1°C) (Fig. 8). With increasing depth, diurnal fluctuations decreased and mean temperature increased, confirming the soil’s buffering capacity and the effectiveness of mulch in stabilizing root-zone conditions.
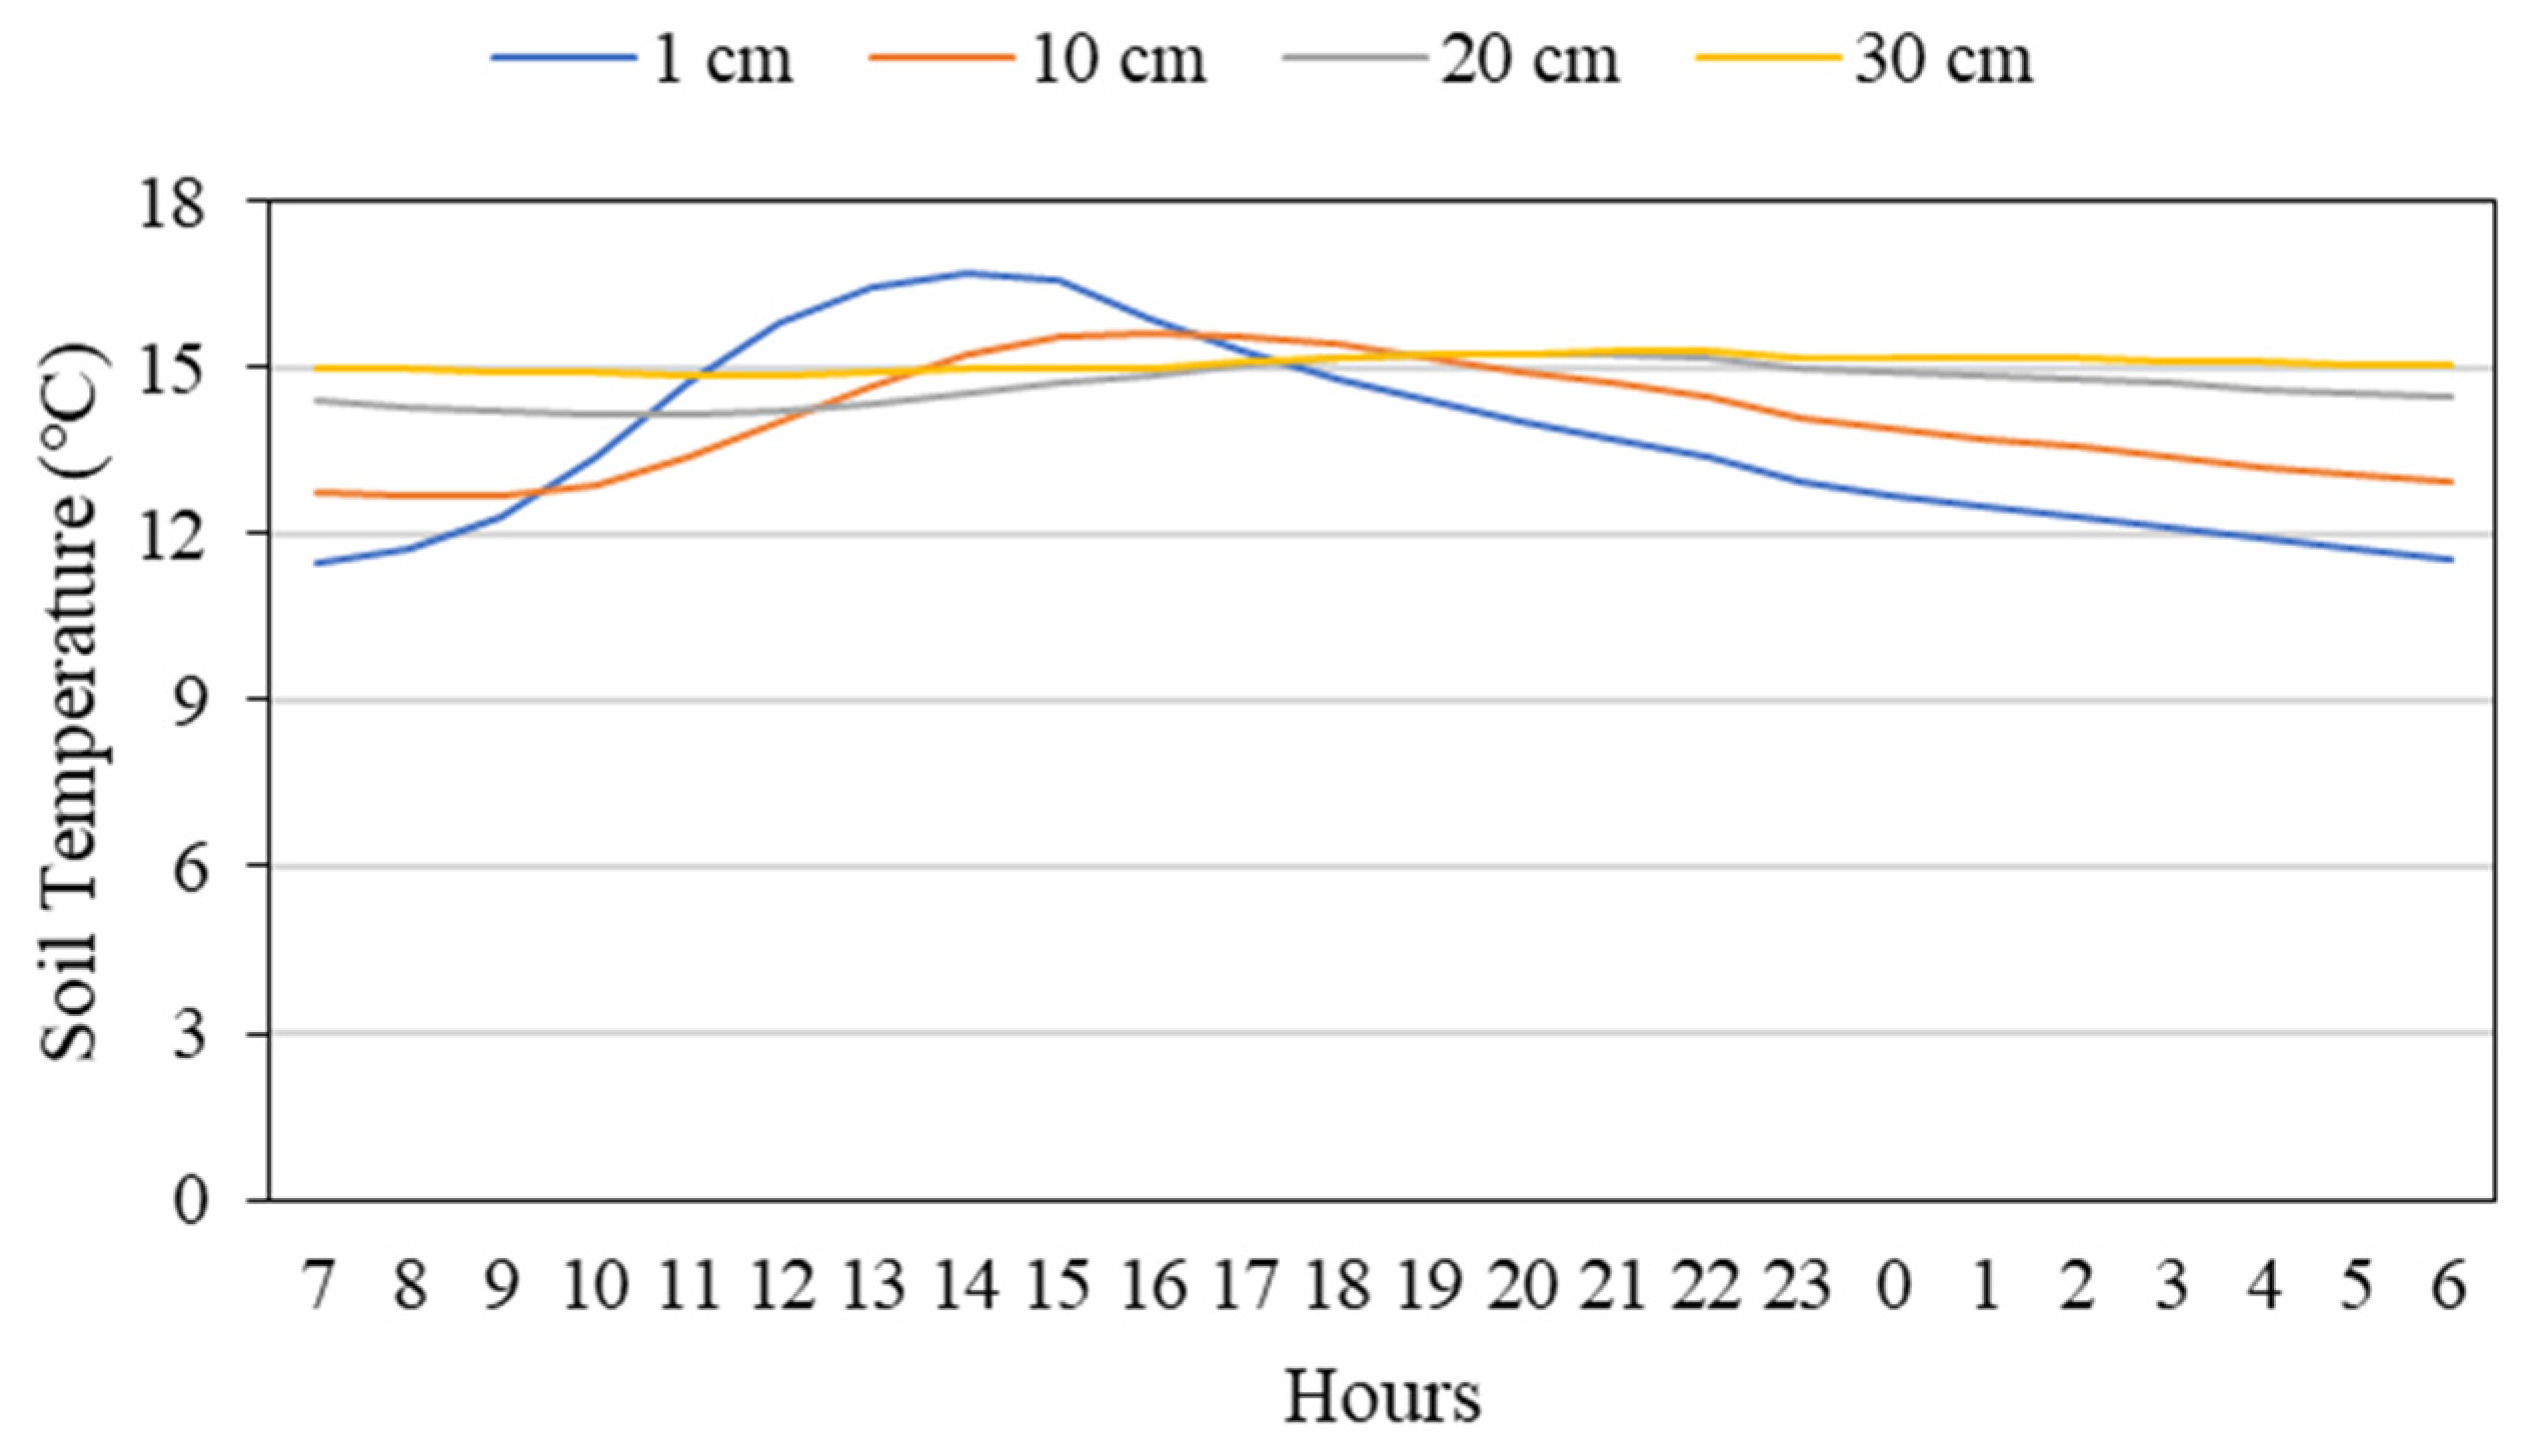
Figure 8: Soil temperatures on different depth with mulch.
Fig. 9 illustrates the diurnal evolution of soil temperature at different depths under mulched tunnel conditions. Near-surface soil layers exhibit pronounced day–night fluctuations in response to changes in the tunnel air environment, whereas deeper layers display progressively damped and smoother temperature curves. This attenuation of diurnal amplitude with depth confirms the strong thermal buffering capacity of the soil–mulch system and indicates that the root zone is effectively shielded from short-term atmospheric fluctuations.
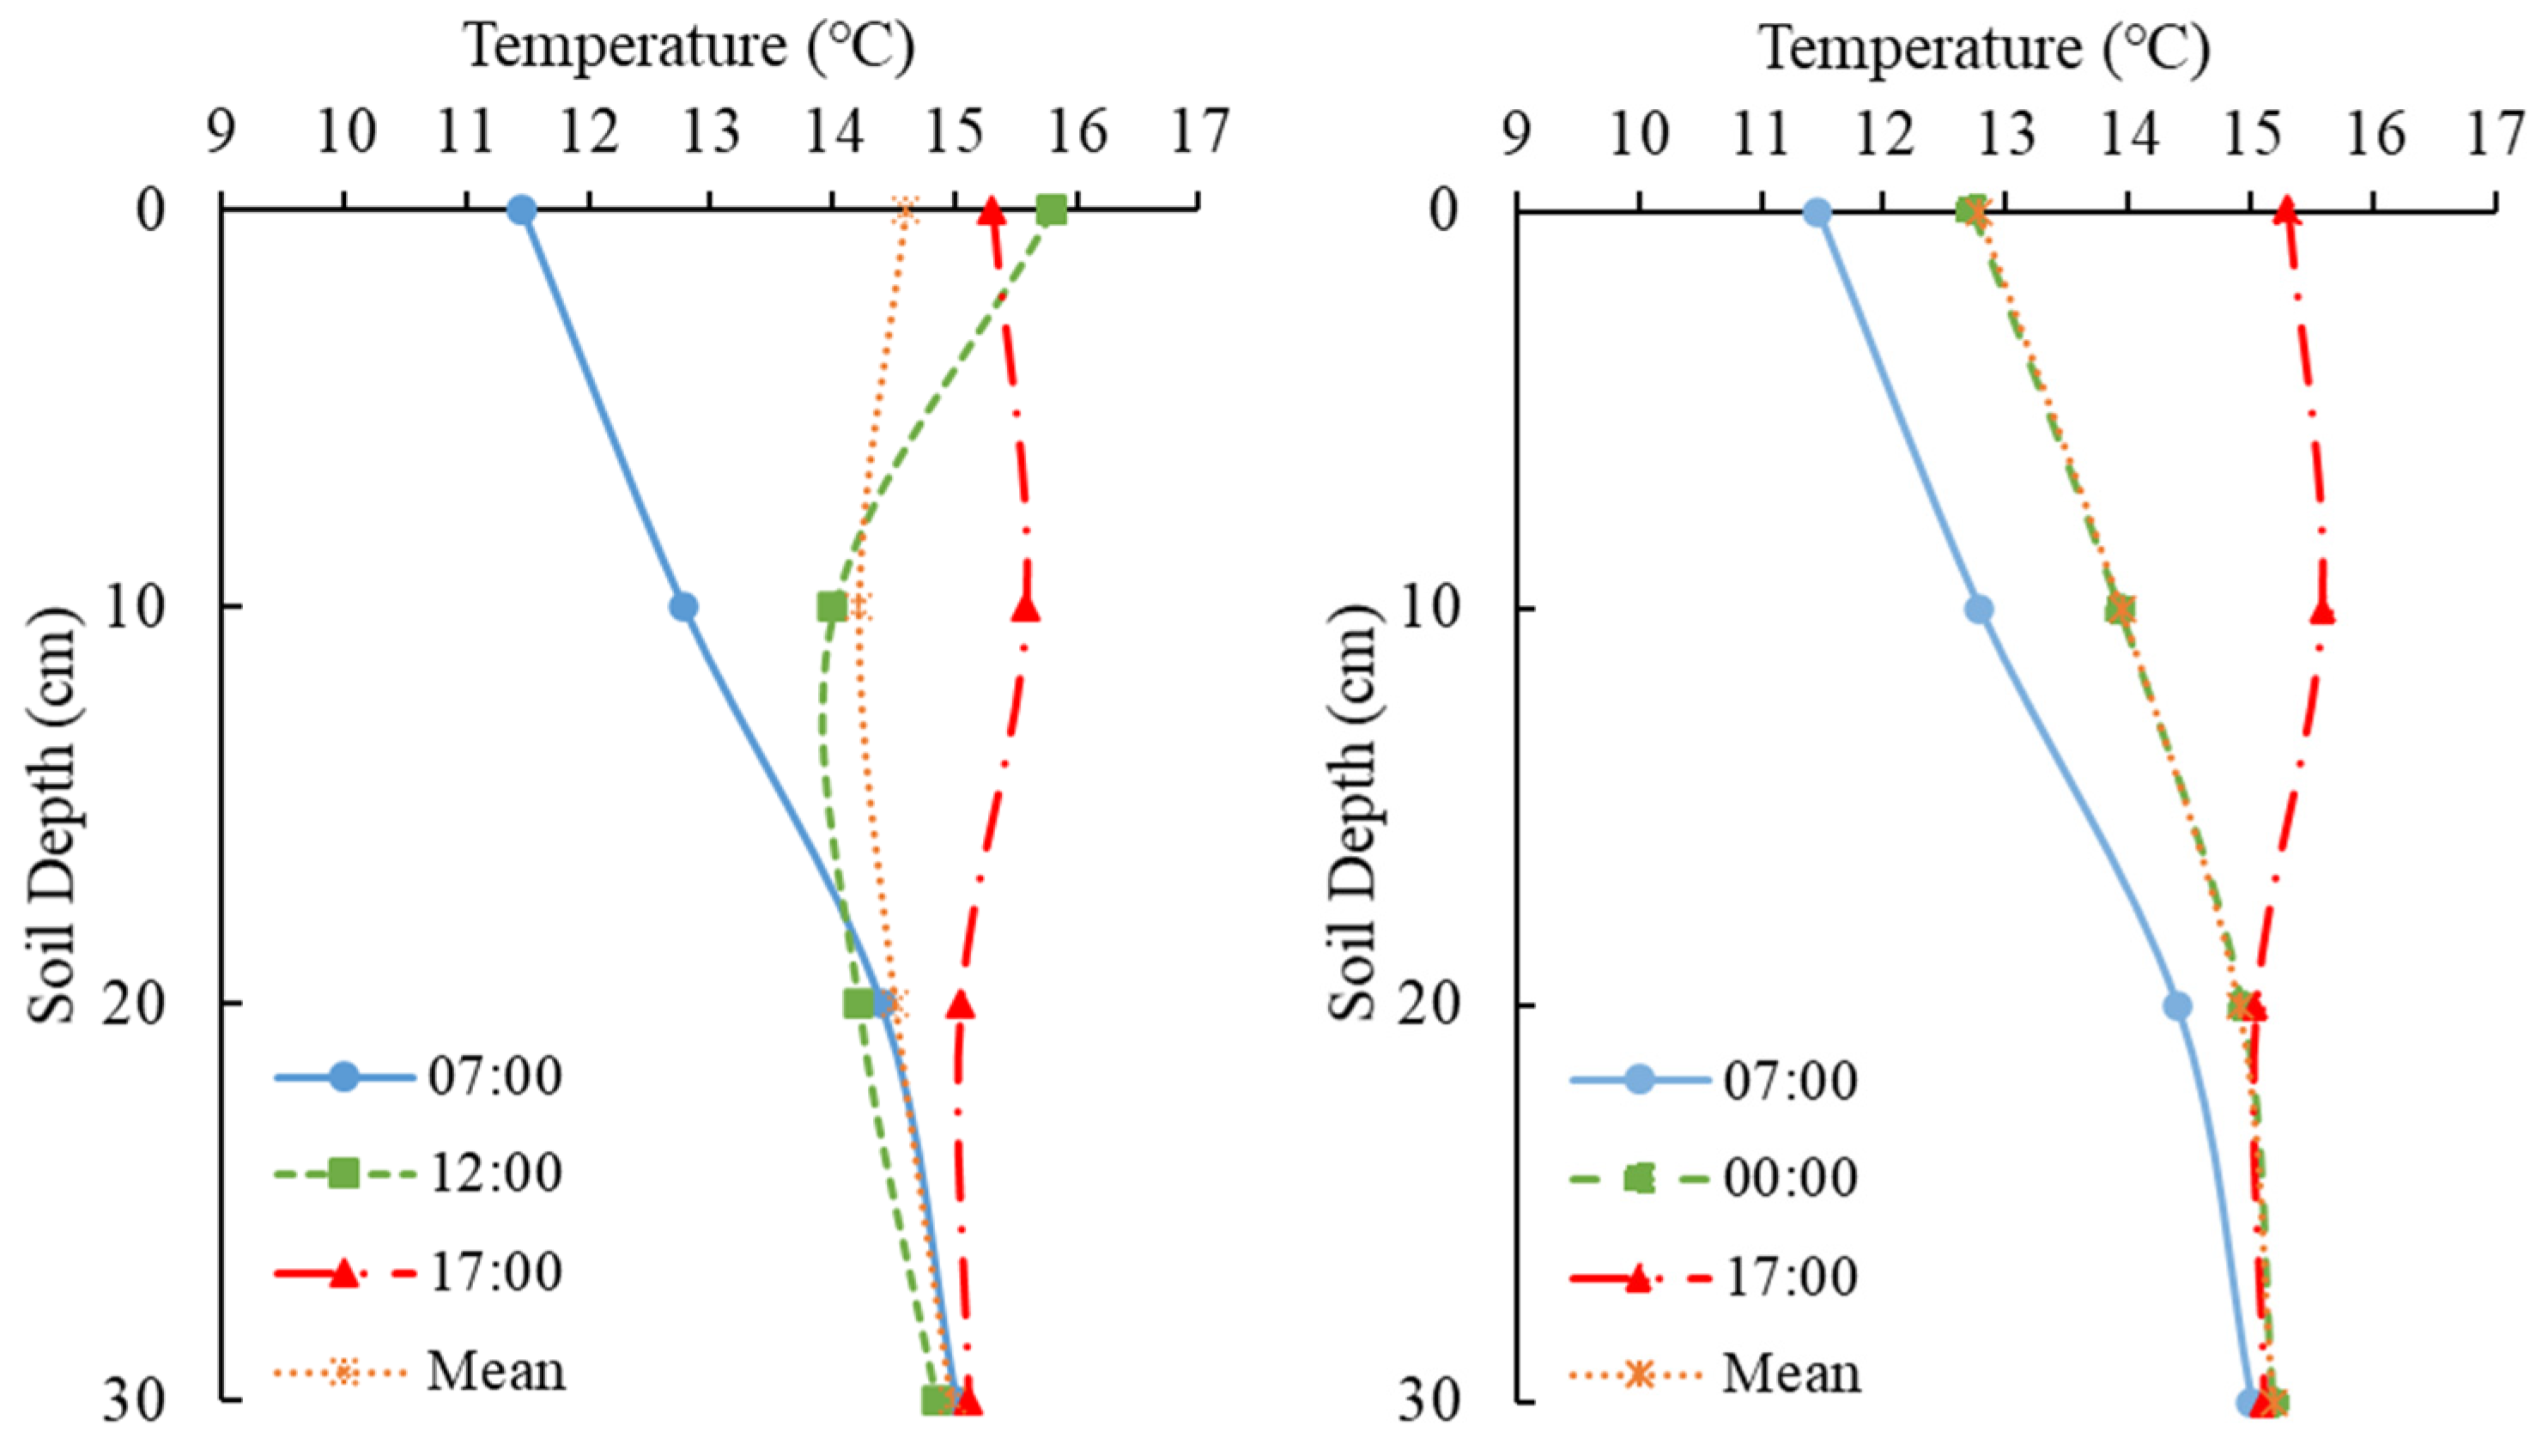
Figure 9: Diurnal variation of soil temperature at different depths in the mulched tunnel daytime (left), nighttime (right).
For the non-mulched tunnels, hourly averages were calculated from the data recorded at five-minute intervals. At the soil surface (1 cm), the minimum, maximum, and average temperatures were recorded as 5.1°C, 25.2°C, and 12.4°C, respectively. At a depth of 10 cm, the corresponding values were 7.5°C (min), 24.1°C (max), and 13.3°C (mean); at 20 cm depth, 9.1°C, 24.1°C, and 13.9°C; and at 30 cm depth, 9.6°C, 24.1°C, and 14.5°C, respectively (Fig. 10). These results indicate that temperature fluctuations decrease with increasing soil depth, leading to more thermally stable conditions in the subsurface layers.
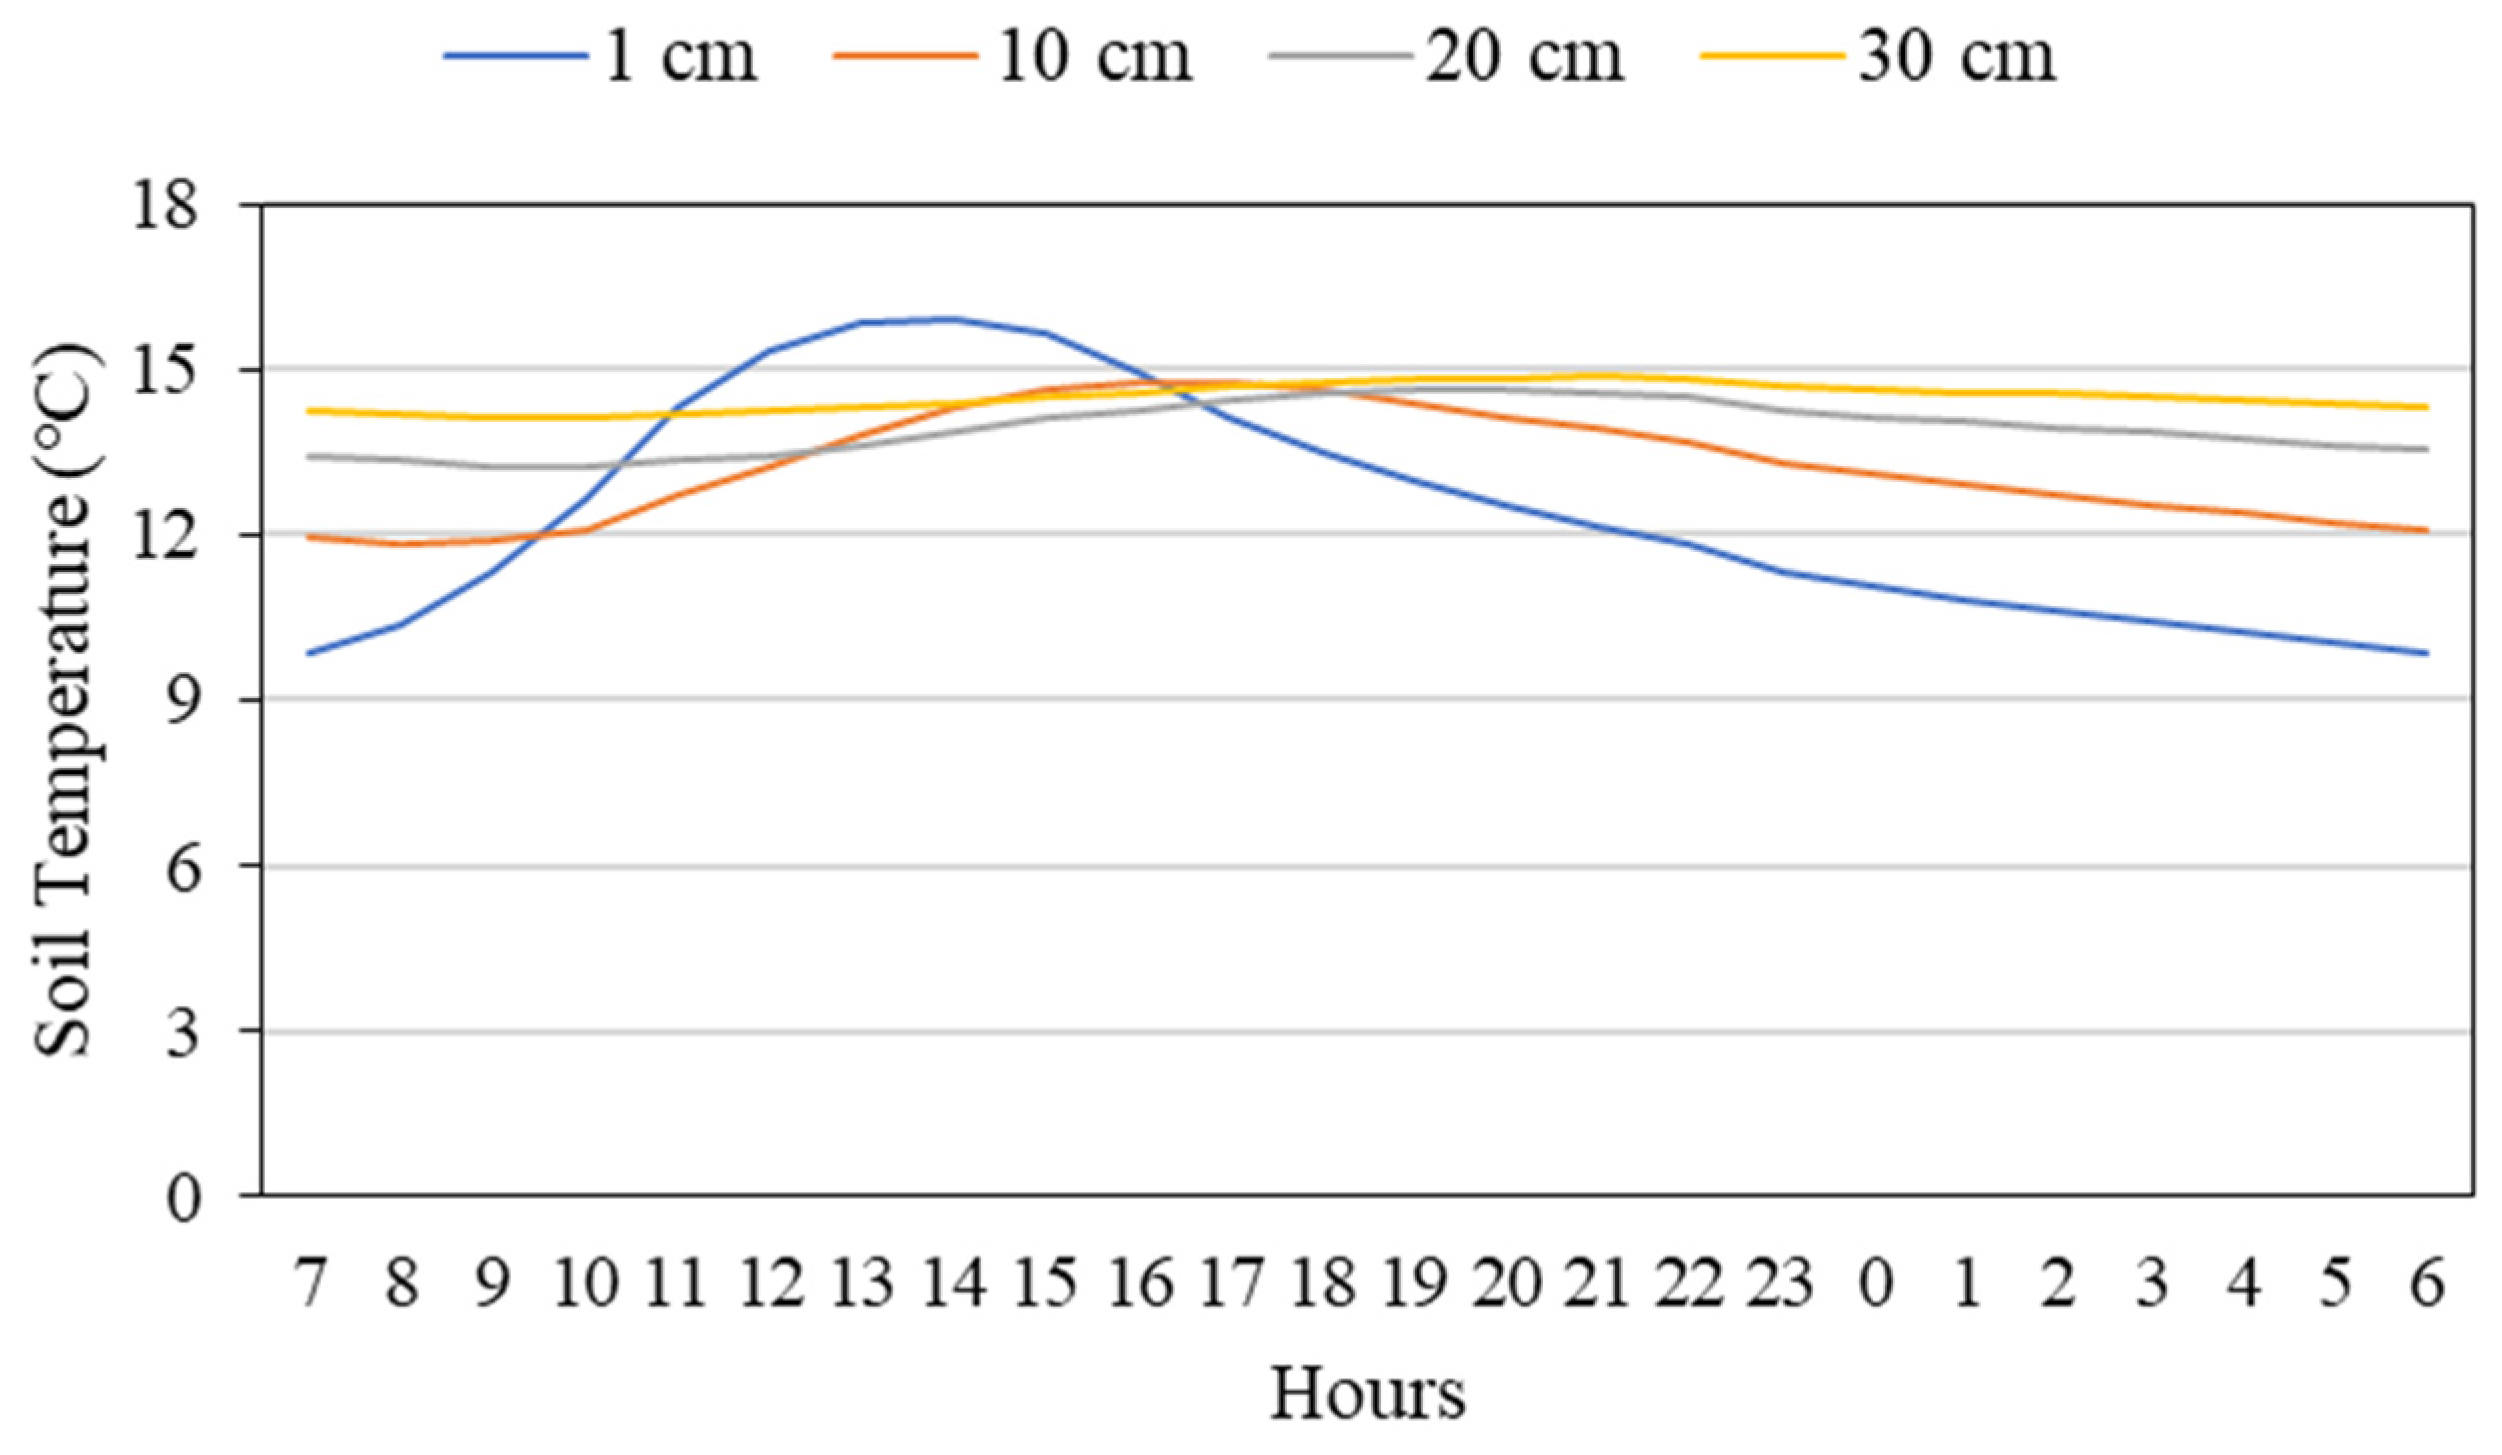
Figure 10: Soil temperatures on different depths without mulch.
Fig. 11 shows hourly soil temperature profiles in the non-mulched tunnel at different depths. Near the surface (1 cm), soil temperature closely follows the diurnal cycle and exhibits a relatively wide range (about 9.8–15.9°C), whereas deeper layers are more thermally buffered. At 30 cm depth, temperatures remain almost constant (approximately 14.1–14.9°C) throughout the day, confirming that subsurface soil experiences markedly reduced short-term fluctuations compared with the upper soil layer.
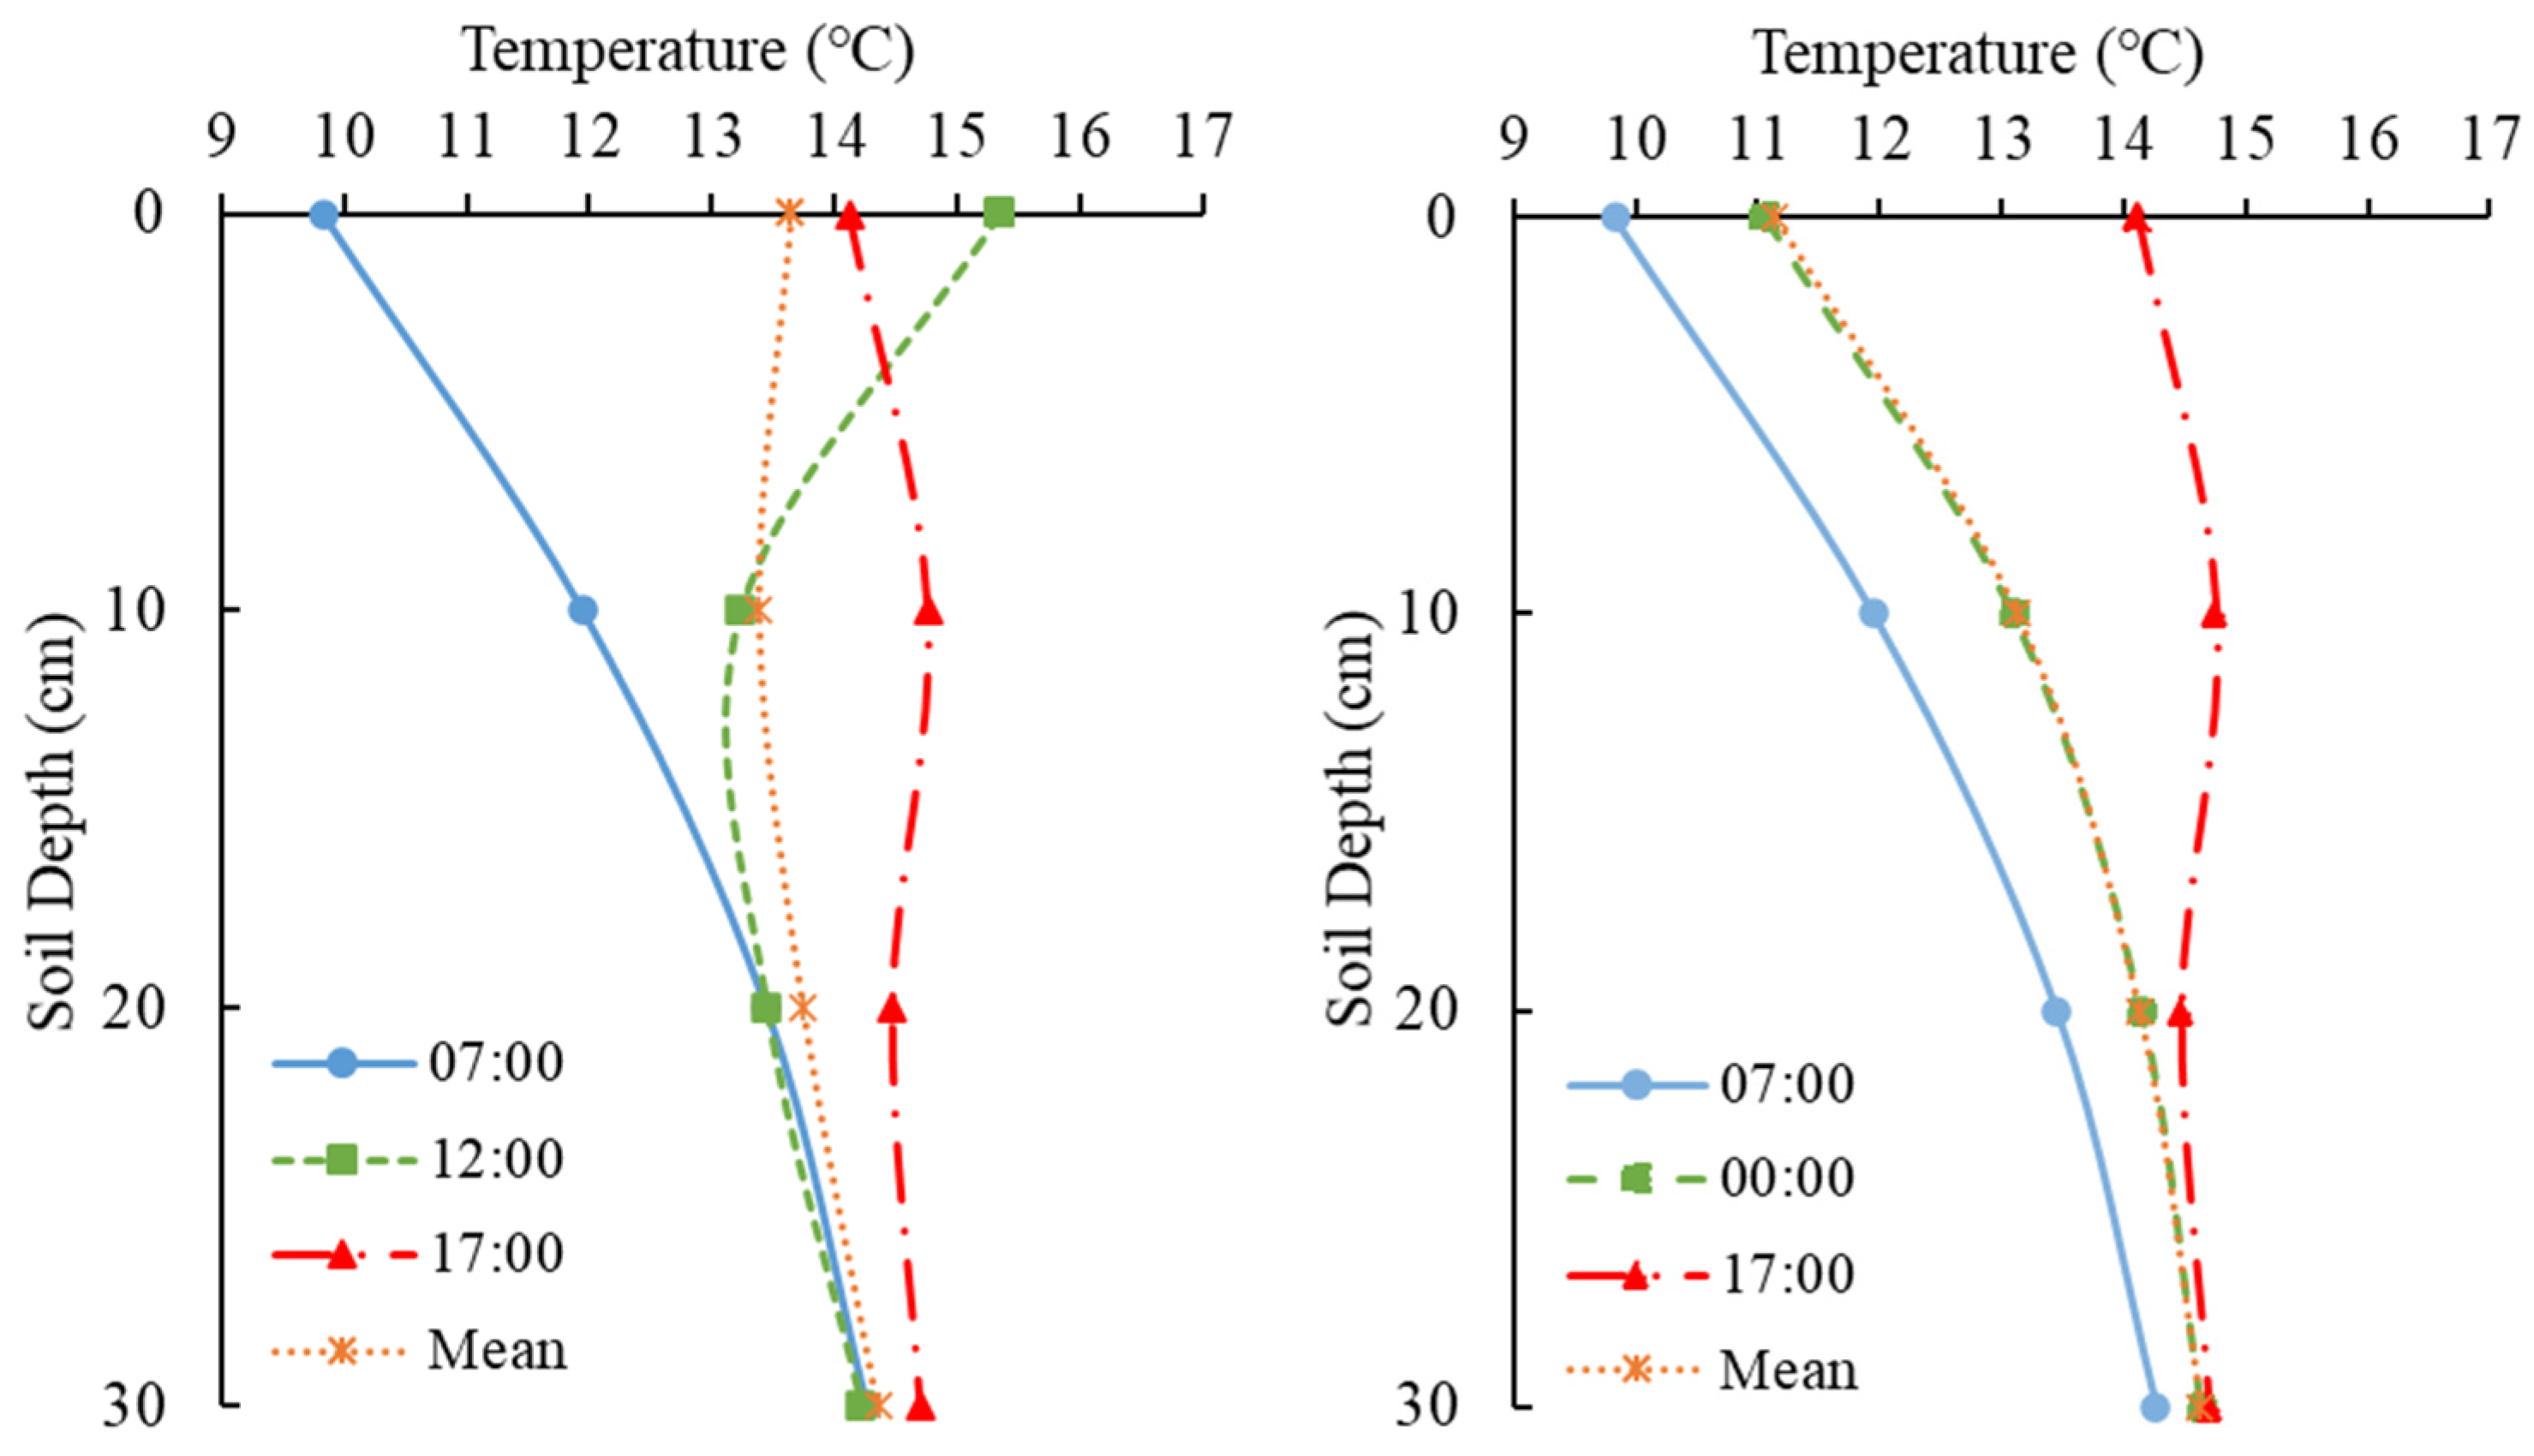
Figure 11: Diurnal variation of soil temperature at different depths in the non-mulched tunnel daytime (left), nighttime (right).
Temperature differences between mulched and non-mulched tunnel soils as a function of time of day and soil depth are presented in Fig. 12. The greatest difference was observed at the 1 cm soil depth, particularly during periods without solar radiation. The influence of the mulch application diminished with increasing soil depth.
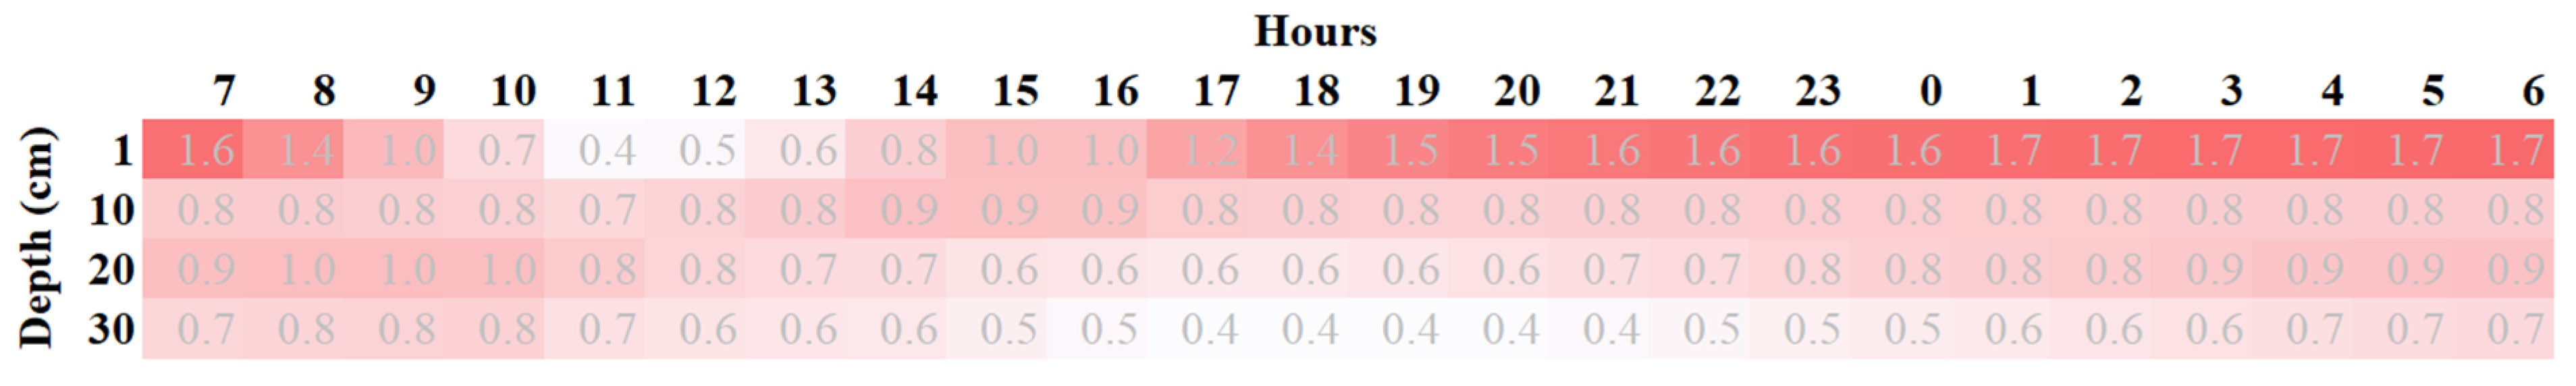
Figure 12: Soil temperature differences between tunnels with and without mulch.
Libik [45] reported increases in soil temperature of 5.9°C at 08:00 and 6.8°C at 14:00 in a 0.5 m high row cover cultivated with watermelon in an open field. Similarly, Ref. [46] found that average daily maximum and minimum soil temperatures were higher 4–5 °C and 1–3 °C compared to uncovered treatment.
3.3 Statistics and XGBoost Results of Experiment
An independent samples t-test was conducted to compare the means of Tym10 and Tnm10. The analysis revealed that the mean of Tym10 (14.0135) was significantly higher than that of Tnm10 (13.1589), with a t-value of 8.7737 and 2484.6 degrees of freedom. The associated p-value was less than 2.2 × 10⁻¹⁶, indicating that the observed difference is highly statistically significant at the α = 0.05 level. Furthermore, the 95% confidence interval for the mean difference ranged from 0.6636 to 1.0457, confirming that the difference between the two means is both statistically and practically meaningful. Based on these results, it can be concluded that there is a significant difference between Tym10 and Tnm10 (Table 2).
Table 2: T-test results between Tym10 and Tnm10.
| Variable | Value |
|---|---|
| Mean (Tym10) | 14.01354 |
| Mean (Tnm10) | 13.15888 |
| t-value | 8.7737 |
| Degrees of freedom (df) | 2484.6 |
| p-value | <2.2 × 10⁻¹⁶ |
| Confidence interval (95%) | (0.6636, 1.0457) |
Radiation (Rad) exhibited a highly skewed distribution (skew = 3.1) and extreme variability, with a mean of 59.4, a standard deviation of 117.5, and a wide range of 805.1, indicating substantial fluctuations in solar radiation during the measurement period. Wind speed (Vw) showed minimal variability (mean = 0.1, SD = 0.3) and was slightly positively skewed. Ambient relative humidity (TambRh) and ambient temperature (Tamb) had moderate variability, with the former negatively skewed (skew = −0.8) and the latter approximately symmetric. Soil temperature and humidity measurements at different depths and positions (e.g., Trcym, Trcnm, Tnm10, Tym10) showed relatively stable distributions, with standard deviations ranging between 1.4°C and 2.1°C and means generally between 10°C and 15°C. Most temperature-related variables displayed near-normal distributions, with skewness and kurtosis values close to zero. The soil moisture-related parameters (e.g., TrcymRh, TrcnmRh) also had consistent values but exhibited some degree of left skewness. The standard errors (SE) for all variables were low, indicating reliable estimates of the means. These properties indicate that the dataset is suitable for subsequent inferential and machine-learning analyses (Table 3).
Table 3: Descriptive statistics of experimental data.
| n | mean | sd | median | min | max | range | skew | kurt | se | |
|---|---|---|---|---|---|---|---|---|---|---|
| Rad | 1272 | 59.4 | 117.5 | 0.0 | 0.0 | 805.1 | 805.1 | 3.1 | 11.4 | 3.3 |
| Wv | 0.1 | 0.3 | 0.0 | 0.0 | 2.1 | 2.1 | 2.3 | 6.0 | 0.0 | |
| TambRh | 78.1 | 16.1 | 82.0 | 32.0 | 99.0 | 67.0 | −0.8 | −0.2 | 0.5 | |
| Tamb | 4.9 | 5.8 | 3.9 | −9.6 | 23.8 | 33.4 | 0.7 | 0.9 | 0.2 | |
| TgRh | 8.1 | 6.6 | 6.8 | −5.0 | 29.8 | 34.8 | 0.9 | 0.4 | 0.2 | |
| Trcym | 10.5 | 5.4 | 9.3 | −0.1 | 29.7 | 29.8 | 1.0 | 0.8 | 0.2 | |
| TrcymRh | 84.0 | 13.3 | 88.0 | 27.2 | 95.0 | 67.9 | −2.3 | 5.3 | 0.4 | |
| Trcnm | 10.0 | 5.4 | 8.8 | −0.9 | 30.8 | 31.7 | 1.1 | 1.0 | 0.2 | |
| TrcnmRh | 84.3 | 15.2 | 92.0 | 27.2 | 96.1 | 68.9 | −1.7 | 2.1 | 0.4 | |
| Tym1 | 13.7 | 3.1 | 13.3 | 7.1 | 23.5 | 16.4 | 0.6 | 0.2 | 0.1 | |
| Tym10 | 14.0 | 2.6 | 13.9 | 8.5 | 20.4 | 11.9 | 0.2 | −0.8 | 0.1 | |
| Tym20 | 14.7 | 2.3 | 14.8 | 10.2 | 18.7 | 8.5 | −0.1 | −1.4 | 0.1 | |
| Tym30 | 15.1 | 2.2 | 15.2 | 10.9 | 18.9 | 8.0 | −0.2 | −1.4 | 0.1 | |
| Tnm1 | 12.3 | 3.0 | 11.8 | 5.8 | 21.9 | 16.1 | 0.8 | 0.4 | 0.1 | |
| Tnm10 | 13.2 | 2.3 | 13.1 | 7.9 | 18.7 | 10.9 | 0.1 | −0.7 | 0.1 | |
| Tnm20 | 13.9 | 2.1 | 14.0 | 9.4 | 17.8 | 8.4 | −0.2 | −1.1 | 0.1 | |
| Tnm30 | 14.4 | 2.1 | 14.7 | 9.9 | 18.1 | 8.3 | −0.3 | −1.2 | 0.1 |
The correlation heatmap illustrates the strength and direction of linear relationships among environmental variables, root-zone conditions, and soil temperatures at various depths under mulched tunnel conditions (Fig. 13). As expected, strong positive correlations were observed among the soil temperature variables (Tym1, Tym10, Tym20, Tym30), with coefficients exceeding 0.95, indicating consistent thermal behavior across soil depths. Tym10, the focal variable, showed its strongest correlations with Tym20 (r = 0.99) and Tym30 (r = 0.97), suggesting that soil heat propagation is uniform in the mulched setting. Additionally, positive correlations were noted between Tym10 and Trcym (r = 0.92) and TrcymRh (r = 0.89), reflecting the influence of root-zone conditions on subsurface soil temperature. Conversely, air humidity parameters such as TambRh (r = −0.24) and TgRh (r = −0.34) were negatively correlated with Tym10, indicating that higher humidity is generally associated with lower soil temperatures, likely due to reduced solar radiation and evapotranspiration. Radiation (Rad) exhibited a moderate positive correlation with Tym10 (r = 0.40), suggesting that solar input contributes to subsurface heating, although this effect may be modulated by the mulch layer. Wind speed (Vw) and ambient temperature (Tamb) had weaker or negligible correlations with Tym10 (r = 0.00 and r = −0.04, respectively), implying minimal direct influence under these specific conditions. Overall, the clustering pattern reinforces the separation between subsurface thermal dynamics and atmospheric variables, highlighting the insulating and buffering role of mulch in soil temperature regulation.
The correlation heatmap illustrates the strength and direction of linear relationships among environmental parameters, root-zone conditions, and soil temperatures at various depths under non-mulched (bare soil) conditions. Strong positive correlations were observed among the soil temperature variables (Tnm1, Tnm10, Tnm20, Tnm30), with coefficients exceeding 0.85, indicating a consistent thermal profile across soil depths in the absence of mulch. Tnm10, the central variable of interest, exhibited its strongest associations with Tnm20 (r = 0.97), Tnm30 (r = 0.96), and Vw (r = 0.93), suggesting that soil heat distribution and vapor water content are closely linked under open-surface conditions. Radiation (Rad) also correlated highly with Tnm10 (r = 0.93), reinforcing the role of solar input in driving soil heating where no mulch barrier is present. Conversely, atmospheric humidity indicators such as TambRh (r = −0.67) and TrcnmRh (r = −0.60) were strongly negatively correlated with Tnm10, implying that higher relative humidity coincides with cooler soil conditions likely due to decreased radiation and enhanced evaporative cooling. Interestingly, Trcnm showed a weak negative correlation with Tnm10 (r = −0.20), suggesting a more complex or indirect relationship between transpiration and mid-depth soil temperature. The hierarchical clustering structure further emphasizes the clear distinction between subsurface thermal-radiative variables and ambient humidity-related parameters, reflecting the lack of buffering insulation in the bare-soil setting and the stronger sensitivity of soil temperature to atmospheric fluctuations.
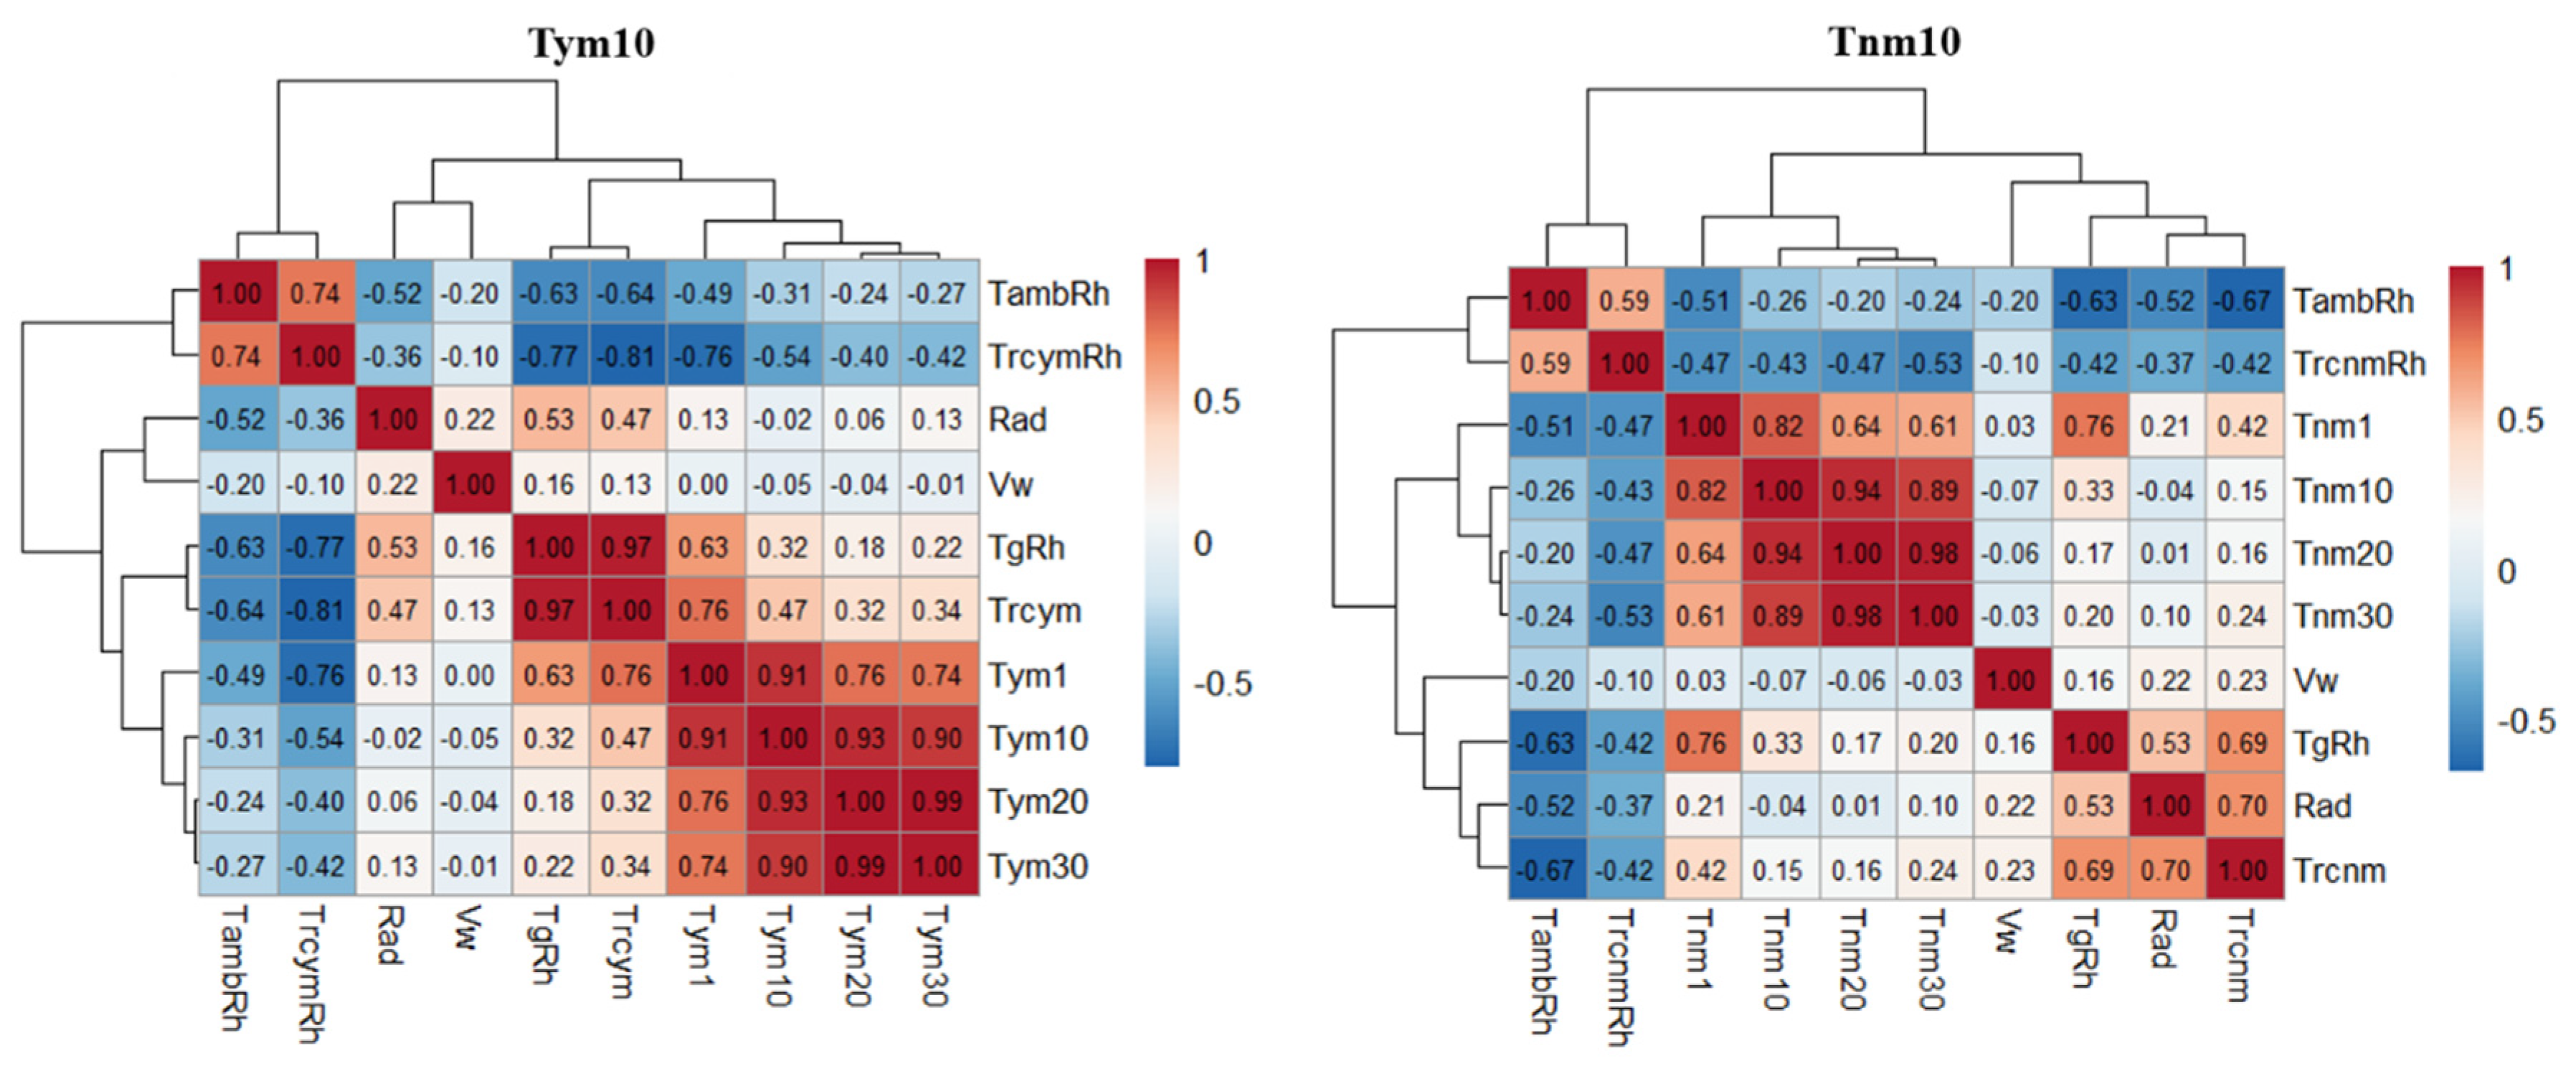
Figure 13: Pearson’s correlation analysis of Tym10 and Tnm10.
Table 4 summarizes the goodness-of-fit metrics for the XGBoost models developed to predict soil temperature at 10 cm depth under mulched (Tym10) and non-mulched (Tnm10) tunnel conditions, evaluated on both training and test datasets. The root mean square error (RMSE) and mean absolute error (MAE) values are notably low across all scenarios, indicating high predictive accuracy. For the training sets, the RMSE was 0.102 for Tym10 and 0.069 for Tnm10, while the MAE values were 0.076 and 0.053, respectively. Corresponding test set errors were slightly higher, with RMSE values of 0.189 (Tym10) and 0.150 (Tnm10), and MAE values of 0.126 and 0.106, suggesting minimal overfitting and strong model generalization. Furthermore, the coefficient of determination (R2) values exceeded 0.99 for both training and test sets in both conditions, demonstrating that the models captured nearly all the variance in the target variable. These results confirm the robustness and reliability of the XGBoost models in accurately estimating soil temperature at 10 cm depth under both mulched and non-mulched environments.
A full multi-model benchmark including random forest, support vector regression, multilayer perceptrons or deep sequence models was not conducted in this study, which is a limitation. However, the achieved RMSE values of 0.150–0.189°C and R2 values above 0.99 for 10-cm RZT are already comparable with, or better than, the performance ranges reported in recent studies that employed ensemble boosting, self-training, hybrid deep-learning and other advanced AI approaches for soil temperature prediction [21,22,29,47,48,49]. Moreover, comparative reviews and benchmarking studies on soil temperature estimation and tabular environmental data more broadly indicate that gradient boosting decision trees and XGBoost in particular—are consistently among the top-performing algorithms and often outperform deep neural networks on medium-sized tabular datasets [37,38,50]. These findings suggest that, while future work should systematically compare XGBoost with random forest, deep neural networks and hybrid architectures under multi-season and multi-site conditions, the present choice of XGBoost as the main modeling framework is well justified for the data scale and application targeted here.
Table 4: Goodness of fit criteria values for train and test sets.
| Metrics | Train (Tym10) | Test (Tym10) | Train (Tnm10) | Test (Tnm10) |
|---|---|---|---|---|
| RMSE | 0.102 | 0.189 | 0.069 | 0.150 |
| MAE | 0.076 | 0.126 | 0.053 | 0.106 |
| R2 | 0.999 | 0.994 | 0.999 | 0.995 |
Relationship between observed and predicted values for the Tym10 and Tnm10 datasets was given in Fig. 14, respectively. In both subfigures, the data points align closely along the fitted quadratic regression line, indicating a strong agreement between observed and predicted values. Fig. 14a means the model explains about 99.41% of the variation in Tym10 values, reflecting a highly accurate predictive performance with minimal deviation from the ideal 1:1 line and Fig. 14b shows that 99.55% of the variation is captured by the model, indicating even slightly better performance. The near-unity slope coefficients in both figures (approximately 1.01 and 1.02, respectively) and the very small quadratic terms suggest a predominantly linear relationship, with only minor non-linearity. Overall, these results demonstrate the model’s excellent generalization capability and robustness in predicting both Tym10 and Tnm10 temperatures under the given conditions.
Table 5 presents the results of feature importance and sensitivity analyses for the XGBoost model developed to estimate soil temperature at 10 cm depth (Tym10) under mulched tunnel conditions. The metrics used for importance analysis Gain, Cover, and Frequency indicate how often and how effectively each feature contributes to the model’s predictive performance, while the Mean Dropout Loss quantifies the sensitivity of the model to the exclusion of each variable. Among the input features, Tym20 emerged as the most influential according to Gain (0.472), followed by Tym1 (0.319) and Tym30 (0.185), suggesting that soil temperatures at adjacent depths (20 cm, 1 cm, and 30 cm) are the primary determinants of temperature at 10 cm. However, sensitivity analysis based on Mean Dropout Loss ranked Tym1 as the most sensitive feature (203.784), slightly surpassing Tym20 (182.682), indicating that the model’s performance deteriorates more significantly when Tym1 is removed. This discrepancy suggests that while Tym20 contributes more consistently during model training, Tym1 may carry more critical information under certain conditions. Radiation (Rad) ranked fourth in both importance and sensitivity, confirming its role as a secondary but still relevant factor. Other atmospheric and root-zone variables such as TrcymRh, TgRh, Trcym, TambRh, and Vw were found to have limited influence, with minimal gain and low dropout loss values, indicating a lesser role in the estimation of Tym10 under mulched conditions. Overall, the analysis confirms that soil temperature at other depths exerts the greatest influence on Tym10, while aboveground environmental variables contribute marginally in the presence of mulch.
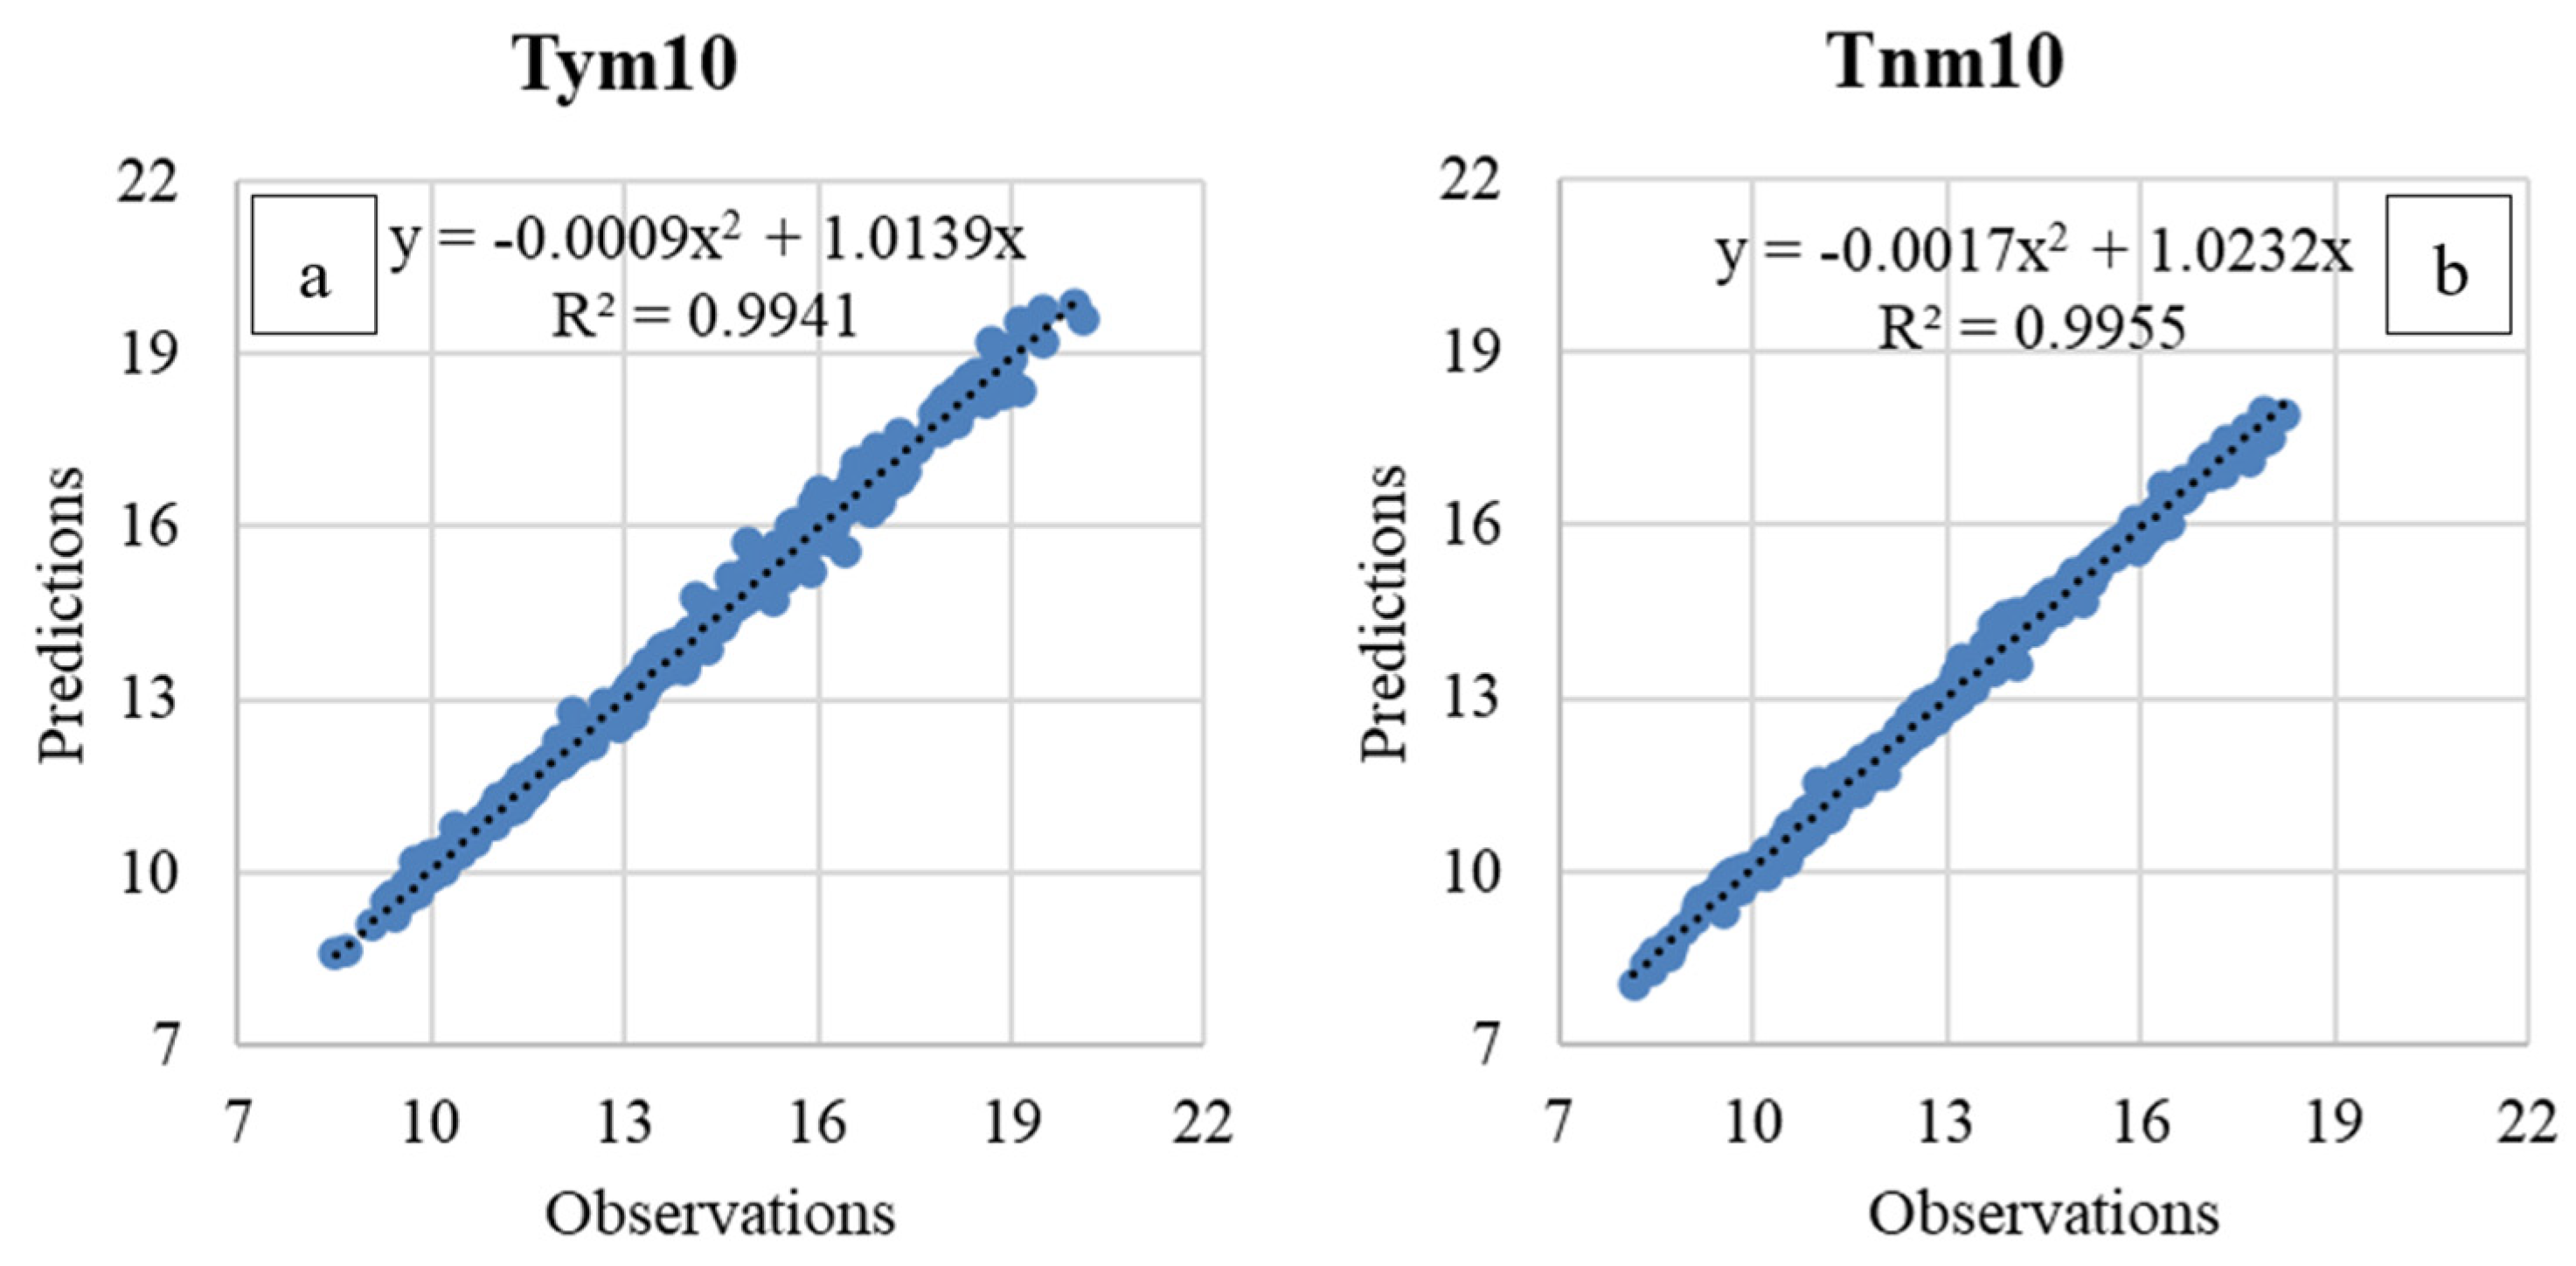
Figure 14: Relationship between observed and predicted Tym10 (a) and Tnm10 (b) values with 1:1 graphs.
Table 6 reports the feature importance and sensitivity analysis results for the XGBoost model predicting soil temperature at 10 cm depth (Tnm10) under non-mulched row cover conditions. Among the input features, Tnm20 was identified as the most influential variable across all metrics, with the highest gain (0.759), cover (0.215), frequency (0.170), and mean dropout loss (86.092), indicating its dominant role in the model’s predictive capacity and stability. Tnm1 ranked second in both importance and sensitivity, also contributing substantially to the model (gain = 0.175; dropout loss = 57.414), which emphasizes the strong vertical coherence in soil temperature dynamics near the 10 cm layer in the absence of mulch. Tnm30, while showing moderate importance (gain = 0.044), ranked much lower in sensitivity (6th), suggesting it contributes useful but less critical information to the model. In contrast, environmental and atmospheric variables such as radiation (Rad), relative humidity (TgRh, TrcnmRh, TambRh), Trcnm, and wind speed (Vw) were associated with low gain and minimal dropout losses, reflecting their relatively limited influence under mulch-free conditions.
Table 5: Feature importance and sensitivity analyses results for Tym10.
| Importance Level | Sensitivity Level | Feature | Gain | Cover | Frequency | Mean Dropout Loss |
|---|---|---|---|---|---|---|
| 1 | 2 | Tym20 | 0.472 | 0.160 | 0.135 | 182.682 |
| 2 | 1 | Tym1 | 0.319 | 0.201 | 0.152 | 203.784 |
| 3 | 3 | Tym30 | 0.185 | 0.112 | 0.120 | 44.493 |
| 4 | 4 | Rad | 0.013 | 0.083 | 0.088 | 43.663 |
| 5 | 5 | TrcymRh | 0.005 | 0.134 | 0.135 | 21.248 |
| 6 | 6 | TgRh | 0.003 | 0.123 | 0.145 | 21.110 |
| 7 | 8 | Trcym | 0.002 | 0.113 | 0.114 | 9.882 |
| 8 | 7 | TambRh | 0.001 | 0.064 | 0.096 | 10.532 |
| 9 | 9 | Vw | 0.000 | 0.010 | 0.015 | 2.634 |
Notably, Rad and TgRh showed slightly elevated sensitivity levels compared to their importance rankings, hinting at their situational relevance despite weaker average contributions. Overall, the analysis highlights that, similar to the mulched scenario, soil temperatures at adjacent depths are the most decisive factors in estimating Tnm10. However, the relatively lower dropout loss values across all features, compared to the mulched case, suggest a more uniform distribution of influence and possibly reduced complexity in thermal dynamics in the absence of a mulch layer.
Table 6: Feature importance and sensitivity analyses results for Tnm10.
| Importance Level | Sensitivity Level | Feature | Gain | Cover | Frequency | Mean Dropout Loss |
|---|---|---|---|---|---|---|
| 1 | 1 | Tnm20 | 0.759 | 0.215 | 0.170 | 86.092 |
| 2 | 2 | Tnm1 | 0.175 | 0.220 | 0.176 | 57.414 |
| 3 | 6 | Tnm30 | 0.044 | 0.094 | 0.095 | 5.654 |
| 4 | 3 | Rad | 0.008 | 0.069 | 0.070 | 8.238 |
| 5 | 5 | Trcnm | 0.006 | 0.096 | 0.122 | 6.043 |
| 6 | 4 | TgRh | 0.005 | 0.131 | 0.136 | 7.546 |
| 7 | 7 | TrcnmRh | 0.002 | 0.096 | 0.126 | 4.473 |
| 8 | 8 | TambRh | 0.002 | 0.058 | 0.091 | 2.990 |
| 9 | 9 | Vw | 0.000 | 0.020 | 0.014 | 1.196 |
In XGBoost modeling, four key metrics Gain, Cover, Frequency, and Mean Dropout Loss are commonly employed to evaluate feature importance and assess each variable’s contribution to model performance. Gain represents the improvement in accuracy (i.e., information gain) brought about by a feature when it is used to split decision nodes; thus, it is widely regarded as the most informative metric for determining a feature’s predictive value. Cover reflects the proportion of training samples affected by a feature’s splits, thereby indicating the extent to which a variable influences broader segments of the dataset. Frequency (also referred to as weight) denotes how often a feature is used to split nodes across all trees in the model, capturing its structural relevance in the ensemble. While these three metrics focus on a feature’s involvement during model construction, Mean Dropout Loss serves as a measure of sensitivity by quantifying the average increase in model loss when a given feature is removed. A higher dropout loss suggests that the model heavily relies on that feature to maintain predictive accuracy. Taken together, these metrics provide a comprehensive understanding of both the structural and functional importance of each input variable within the XGBoost framework, allowing researchers to identify critical predictors and assess model robustness.
The results show that combining row covers and mulching provides clear thermal benefits for lettuce in unheated greenhouses. Row covers increased in-tunnel air temperature, while the mulch raised root-zone temperature (RZT), with effects that attenuated with depth. These outcomes are consistent with recent evidence that floating row covers used inside Mediterranean-type greenhouses improve air and near-surface microclimates during early crop stages and that new passive heating configurations continue to be evaluated for mild-winter settings [8]. On the soil side, contemporary studies in protected and field systems confirm that mulches reduce heat loss, damp daily thermal swings and elevate soil temperatures, with these effects being most pronounced in cold periods and early growth stages; similar warming has also been reported for biodegradable films [9,51].
Consistent with these trends, our dataset showed the largest warming near the surface and a diminishing effect with depth, reflecting the soil’s thermal buffering. Comparable depth-dependent profiles and improved hydrothermal status with mulching have been reported in greenhouse vegetables and cold-zone production [9]. In lettuce and other leafy crops, modest RZT elevation (+3°C) enhances biomass and metabolite profiles by stimulating nutrient uptake and root metabolism, underscoring the agronomic relevance of the passive RZT gains documented here [1].
From a modeling perspective, XGBoost achieved very high accuracy for 10-cm RZT under both mulched and non-mulched conditions. This aligns with recent greenhouse and agro-environmental studies in which XGBoost consistently performs at or near state-of-the-art, often surpassing RF/SVM baselines, and with newer time-series architectures proposed specifically for greenhouse soil-temperature forecasting [25,29,52]. Feature-importance and sensitivity analyses revealed that soil temperatures at adjacent depths were the dominant predictors of RZT, whereas atmospheric parameters such as solar radiation, wind speed and relative humidity played only marginal roles.
From a physical standpoint, the dominance of soil temperatures at 1, 20 and 30 cm in the XGBoost models reflects the essentially one-dimensional vertical conduction of heat within the soil profile. Classical solutions of the heat diffusion equation show that a sinusoidal temperature forcing at the surface propagates downward as a damped thermal wave, whose amplitude decreases exponentially with depth while the phase is shifted in time; as a result, temperatures at neighbouring depths (e.g., 10, 20 and 30 cm) remain highly correlated and exhibit very similar diurnal cycles [53,54]. The temperature at 10 cm is therefore governed primarily by the thermal gradient immediately above and below this depth, and the multi-depth soil profile effectively integrates the past influence of atmospheric forcing. Once the thermal state of the surrounding layers is known, additional meteorological variables such as solar radiation, air temperature, wind speed or humidity provide relatively little marginal explanatory power, because their effect on the root zone has already been “embedded” in the multi-depth soil signal [55,56]. Plastic mulches are also known to partially decouple surface soil temperature from the atmosphere by changing net radiation and soil heat flux, thus creating weaker diurnal fluctuations in the lower layers [57,58,59]. Under mulched conditions this behaviour is further amplified. Plastic and organic mulches modify the surface energy balance by altering net radiation, suppressing evaporation and sensible heat exchange and changing soil heat flux, thereby buffering subsurface temperatures against short-term atmospheric fluctuations [60]. Experimental studies consistently show that mulches raise minimum soil temperatures, narrow the diurnal temperature range and shift the damping depth of the thermal wave, so that deeper layers experience smaller and more delayed oscillations compared with bare soil [10,61]. In this context, it is physically plausible that the XGBoost models assign the highest importance to the temperatures of adjacent soil layers, which carry both the conductive coupling within the profile and the cumulative imprint of mulch-modified surface forcing, while instantaneous atmospheric drivers appear as secondary predictors.
From a physiological perspective, this pattern is consistent with the shallow root system of lettuce, for which the majority of roots are confined to the upper 20–30 cm of soil, with a high root length density in the 0–10 or 10–20 cm layers [62]. Root-zone temperature in this window strongly affects nutrient uptake, root metabolism and biomass accumulation, so small changes in the 10-cm layer—and in the adjacent depths that buffer it—translate directly into differences in plant performance. Recent studies on lettuce have shown that increasing RZT by only a few degrees can markedly enhance growth and metabolite profiles, whereas overly cold or overly warm root zones reduce root activity and yield [1,63,64]. Thus, the feature-importance results are agronomically plausible: the model relies most heavily on the thermal state of the root zone itself (neighbouring depths), whereas more distal atmospheric variables play a secondary role once soil temperatures are included.
This indicates that vertical heat transfer within the soil profile exerts a stronger influence on RZT than external meteorological drivers, a finding supported by previous observations of strong soil thermal coupling [65]. The homogeneity of prediction errors further suggests that the model was not biased toward particular time periods or environmental conditions, reinforcing its robustness across diurnal and seasonal variations. Recent work on parsimonious RZT models similarly emphasizes strong vertical and temporal coherence in soil thermal fields and high explanatory power from proximal depths [66].
Practically, integrating row covers with mulching offers a low-cost, low-carbon pathway to stabilize RZT and reduce reliance on bulk-air heating. Contemporary heating studies also advocate local/root-zone heating as an efficient alternative that maintains plant performance while cutting energy demand; prototype systems using air-source heat pumps for RZT control have been validated in recent trials [67]. Beyond energy savings, maintaining a more stable RZT enhances root activity, nutrient uptake and microbial processes, which are critical for plant growth during cold seasons. This is particularly relevant for regions such as Iğdır, where unheated greenhouses are often unusable during winter months due to extreme cold. By enabling the cultivation of crops like lettuce that require relatively low thermal and light inputs, passive techniques such as mulching and row covers extend the growing season and diversify production opportunities. Looking forward, coupling passive measures with data-driven forecasting (e.g., transformer-based predictors) and digital-twin control concepts could further improve decision-making under variable winter conditions and support scalable deployment in commercial greenhouses [25,68].
The application of machine learning in this context offers additional benefits. Unlike purely empirical models, XGBoost provides flexibility in incorporating diverse agronomic and meteorological parameters while maintaining computational efficiency. The model’s ability to capture nonlinear interactions makes it suitable for predicting soil temperature under different crops, soil types and management practices. However, further research is required to test the model under varying climatic conditions and with additional plant species. Moreover, integrating field data with real-time meteorological forecasts could enhance predictive capacity and support decision-making in greenhouse management.
The magnitude and vertical pattern of root-zone temperature modification observed in this study are broadly consistent with previous reports on mulching and low tunnels, but under a distinct microclimatic setting. In our unheated continental greenhouse, the combination of row covers and black polyethylene mulch increased RZT at 10 cm depth by 0.6–1.3°C relative to the non-mulched treatment, with the strongest effects near the soil surface and diminishing influence at deeper layers. Similar depth-dependent responses were reported for plastic mulch and low tunnels in open-field or mild-climate systems, where soil temperature increases of approximately 0.7–3.3°C at shallow depths have been documented compared with bare soil [69,70]. These somewhat lower absolute gains in our study likely reflect the additional buffering effect of the greenhouse envelope, yet they confirm that mulching and row covers remain effective passive tools for RZT stabilization even under harsh winter conditions.
Compared with studies that relied on active root-zone heating, such as water-based floor heating, sand-embedded heating or air-source heat pumps, we achieved more modest but still agronomically meaningful RZT elevation without any external energy input. For example, Bi [2] and Myung [5] reported RZT increases of several degrees and substantial yield improvements in cucumber and paprika using water-based or heat-pump-driven systems.
Quantitatively, the XGBoost models developed here yielded RMSE values of 0.150–0.189°C and R2 values above 0.99 on the independent test sets for 10-cm soil temperature, which places their performance at the upper end of what has been reported for soil and root-zone temperature prediction. Recent ensemble and hybrid machine-learning studies, including XGBoost, CatBoost, LightGBM and deep learning architectures, typically report R2 values between about 0.90 and 0.99 and RMSE values on the order of 0.3–1.5°C depending on depth, time step and climatic variability [29,39,71]. The results therefore confirm that gradient-boosting approaches are highly suitable for greenhouse soil temperature modeling, especially when multi-depth soil information is available.
Distinction of the present work is that RZT was modeled under combined passive micro-climate management (row covers + mulch) and under a strongly heating-dominated continental climate, whereas most previous ML-based studies have focused either on open-field conditions or on different greenhouse heating concepts (e.g., PCM-based storage or active root-zone heating) [2,40,72]. In this respect, our study complements earlier work on root-zone temperature control for lettuce and other vegetables [64,73] by demonstrating that high-accuracy, interpretable XGBoost models can be trained using readily available climatic and soil-depth inputs, specifically targeting the effective root depth relevant for crop management decisions.
This study evaluated the combined effects of row covers and mulching on root-zone temperature (RZT) in lettuce grown under unheated greenhouse conditions and tested an XGBoost model for RZT prediction. Row covers increased internal air temperature by 5.8°C, while mulching raised RZT by 0.6–1.3°C, with the largest changes occuring in the upper 10 cm of soil. Together, these measures created a more favourable microclimate for lettuce growth during cold periods.
The XGBoost models successfully predicted RZT at 10 cm depth with high accuracy, achieving RMSE values of 0.150–0.189°C and R2 = 0.99 under both mulched and non-mulched conditions. Feature importance and sensitivity analyses revealed that adjacent soil depths were the dominant predictors of RZT, whereas meteorological variables contributed only marginally. These results confirm the strong vertical thermal coupling within the soil profile and highlight the reliability of machine learning approaches for soil thermal modeling.
From a practical standpoint, integrating row covers and mulching into greenhouse production systems provides an energy-efficient alternative to conventional heating, reducing fossil fuel dependency and promoting environmental sustainability. Beyond energy conservation, maintaining a more stable RZT enhances root activity, nutrient uptake and microbial processes, thereby supporting plant growth under suboptimal thermal conditions.
Operationally, the calibrated XGBoost model can be embedded as a lightweight predictive module within intelligent greenhouse architectures. Using routinely measured soil temperatures at 1, 20 and 30 cm together with standard climate variables, the model can generate short-term forecasts of RZT at the effective root depth and feed these predictions into IoT-based controllers or decision-support platforms. In automated systems, this information may be used to trigger rule-based actions such as closing row covers before forecasted cold nights, adjusting ventilation or irrigation schedules, or refining set-points in active root-zone heating and PCM-assisted storage systems. Recent smart-greenhouse and decision-support studies have shown that similar sensor- and ML-driven frameworks can improve microclimate control and reduce energy use while maintaining crop comfort, confirming the practical feasibility of such integration [74,75,76]. In low-input smallholder greenhouses, the same model could be delivered through a simple mobile or web interface that translates predicted RZT into recommendations on when to install or remove row covers, apply secondary mulches or delay transplanting during cold spells, thereby providing accessible decision support without requiring high-cost automation.
This study has several limitations that also point to directions for future work. The present findings are based on a single crop (lettuce), one unheated greenhouse at a single location and one winter production season, so the trained models are calibrated to a specific combination of climate, soil conditions, greenhouse design and crop rooting pattern; their direct transfer to other regions, soil types or crops with deeper or differently structured root systems cannot be assumed without additional validation. Likewise, interannual variability in winter severity and management practices was not captured, which may influence the robustness of the learned relationships under more extreme or atypical years. Future research should therefore extend the proposed modeling framework to different crops, soil types and climatic conditions, and rely on multi-season, multi-site datasets to externally validate and, if necessary, recalibrate the XGBoost models, examine their generalizability and explore domain-adaptation strategies across locations and crops. A further limitation is that several potentially influential hydro-physical variables, such as continuous soil-moisture measurements and detailed substrate properties (e.g., texture, bulk density, organic matter content and hydraulic characteristics), were not available and thus could not be incorporated, even though previous studies have shown that soil water content and texture affect both the amplitude and phase of soil-temperature dynamics, thermal conductivity and heat capacity, and ultimately plant performance under mulched or covered conditions. Consequently, the current models rely on multi-depth soil temperatures and standard climate variables as proxies for these processes rather than explicitly representing the hydro-physical state of the root zone. Future work should integrate in-situ soil-moisture sensing and site-specific soil-physical characterization into the feature set and, in parallel, couple XGBoost predictions with real-time meteorological forecasts and precision-agriculture technologies to further improve RZT-prediction accuracy, enhance model transferability across soils, crops and greenhouse systems, and support the development of more broadly applicable, IoT-ready decision-support tools for sustainable greenhouse production in heating-dominated regions.
Acknowledgement:
Funding Statement: The author received no specific funding for this study.
Availability of Data and Materials: The data that support the findings of this study are available from the Corresponding Author, [HKK], upon reasonable request.
Ethics Approval: Not applicable.
Conflicts of Interest: The authors declare no conflicts of interest.
References
1. Hayashi S , Levine CP , Yu W , Usui M , Yukawa A , Ohmori Y , et al. Raising root zone temperature improves plant productivity and metabolites in hydroponic lettuce production. Front Plant Sci. 2024; 15: 1352331. doi:10.3389/fpls.2024.1352331. [Google Scholar] [CrossRef]
2. Bi X , Wang X , Zhang X . Effects of different root zone heating methods on cucumber. Horticulturae. 2022; 8( 12): 1137. doi:10.3390/horticulturae8121137. [Google Scholar] [CrossRef]
3. Liantas G , Chatzigeorgiou I , Ravani M , Koukounaras A , Ntinas GK . Energy use efficiency and carbon footprint of greenhouse hydroponic cultivation using public grid and PVs as energy providers. Sustainability. 2023; 15( 2): 1024. doi:10.3390/su15021024. [Google Scholar] [CrossRef]
4. Levine CP , Hayashi S , Ohmori Y , Kusano M , Kobayashi M , Nishizawa T , et al. Controlling root zone temperature improves plant growth and pigments in hydroponic lettuce. Ann Bot. 2023; 132( 3): 455– 70. doi:10.1093/aob/mcad127. [Google Scholar] [CrossRef]
5. Myung J , Cui M , Lee B , Lee H , Shin J , Chun C . Development of a root-zone temperature control system using air-source heat pump and its impact on the growth and yield of paprika. Aob Plants. 2024; 16( 5): plae047. doi:10.1093/aobpla/plae047. [Google Scholar] [CrossRef]
6. Gheshm R , Brown RN . The effects of black and white plastic mulch on soil temperature and yield of crisphead lettuce in southern new England. HortTechnology. 2020; 30( 6): 781– 8. doi:10.21273/horttech04674-20. [Google Scholar] [CrossRef]
7. Amare G , Desta B . Coloured plastic mulches: impact on soil properties and crop productivity. Chem Biol Technol Agric. 2021; 8( 1): 4. doi:10.1186/s40538-020-00201-8. [Google Scholar] [CrossRef]
8. López-Martínez A , Molina-Aiz F , Moreno-Teruel M , Peña-Fernández A , Baptista F , Valera-Martínez D . Low tunnels inside Mediterranean greenhouses: effects on air/soil temperature and humidity. Agronomy. 2021; 11( 10): 1973. doi:10.3390/agronomy11101973. [Google Scholar] [CrossRef]
9. Ma Z , Ma J , Chai Y , Song W , Han F , Huang C , et al. Mulching improves the soil hydrothermal environment, soil aggregate content, and potato yield in dry farmland. Agronomy. 2024; 14( 11): 2470. doi:10.3390/agronomy14112470. [Google Scholar] [CrossRef]
10. Zhang P , Zhang Z , Xiao M , Chao J , Dai Y , Liu G , et al. Effects of organic mulching on moisture and temperature of soil in greenhouse production of tomato under unheated greenhouse cultivation in the cold zone of China. Food Sci Nutr. 2023; 11( 8): 4829– 42. doi:10.1002/fsn3.3460. [Google Scholar] [CrossRef]
11. Marasovic P , Kopitar D , Peremin-Volf T , Andreata-Koren M . Effect of biodegradable nonwoven mulches from natural and renewable sources on lettuce cultivation. Polymers. 2024; 16( 7): 1014. doi:10.3390/polym16071014. [Google Scholar] [CrossRef]
12. Bonachela S , Sánchez-Guerrero MC , López JC , Medrano E , Hernández J . Evaluation of new passive heating systems for low-cost greenhouses in a mild-winter area. Horticulturae. 2025; 11( 7): 752. doi:10.3390/horticulturae11070752. [Google Scholar] [CrossRef]
13. USDA-NRCS . Low Tunnel System Fact Sheet (Alaska). Natural Resources Conservation Service; 2024 [cited 2025 Jan 1]. Available from: https://www.nrcs.usda.gov/. [Google Scholar]
14. Li M , Sun H , Zhao R . A review of root zone soil moisture estimation methods based on remote sensing. Remote Sens. 2023; 15( 22): 5361. doi:10.3390/rs15225361. [Google Scholar] [CrossRef]
15. Kim D , Zarei M , Lee S , Lee H , Lee G , Lee SG . Wearable standalone sensing systems for smart agriculture. Adv Sci. 2025; 12( 16): 2414748. doi:10.1002/advs.202414748. [Google Scholar] [CrossRef]
16. Zhao H , Sassenrath GF , Kirkham MB , Wan N , Lin X . Daily soil temperature modeling improved by integrating observed snow cover and estimated soil moisture in the USA Great Plains. Hydrol Earth Syst Sci. 2021; 25( 8): 4357– 72. doi:10.5194/hess-25-4357-2021. [Google Scholar] [CrossRef]
17. Amato MT , Giménez D . Predicting monthly near-surface soil temperature from air temperature and the leaf area index. Agric For Meteor. 2024; 345: 109838. doi:10.1016/j.agrformet.2023.109838. [Google Scholar] [CrossRef]
18. Zhou J , Zhang J , Huang Y . Evaluation of soil temperature in CMIP6 multimodel simulations. Agric For Meteor. 2024; 352: 110039. doi:10.1016/j.agrformet.2024.110039. [Google Scholar] [CrossRef]
19. Biazar SM , Shehadeh HA , Ali Ghorbani M , Golmohammadi G , Saha A . Soil temperature forecasting using a hybrid artificial neural network in Florida subtropical grazinglands agro-ecosystems. Sci Rep. 2024; 14( 1): 1535. doi:10.1038/s41598-023-48025-4. [Google Scholar] [CrossRef]
20. Yan C , Na T , Zhen Q , Sun Y , Liu K . Prediction of air temperature and humidity in greenhouses via artificial neural network. PLoS One. 2025; 20( 6): e0325650. doi:10.1371/journal.pone.0325650. [Google Scholar] [CrossRef]
21. Mampitiya L , Rozumbetov K , Rathnayake N , Erkudov V , Esimbetov A , Arachchi S , et al. Artificial intelligence to predict soil temperatures by development of novel model. Sci Rep. 2024; 14: 9889. doi:10.1038/s41598-024-60549-x. [Google Scholar] [CrossRef]
22. Taheri M , Schreiner HK , Mohammadian A , Shirkhani H , Payeur P , Imanian H , et al. A review of machine learning approaches to soil temperature estimation. Sustainability. 2023; 15( 9): 7677. doi:10.3390/su15097677. [Google Scholar] [CrossRef]
23. Farhangmehr V , Cobo JH , Mohammadian A , Payeur P , Shirkhani H , Imanian H . A convolutional neural network model for soil temperature prediction under ordinary and hot weather conditions: comparison with a multilayer perceptron model. Sustainability. 2023; 15( 10): 7897. doi:10.3390/su15107897. [Google Scholar] [CrossRef]
24. Farhangmehr V , Imanian H , Mohammadian A , Cobo JH , Shirkhani H , Payeur P . A spatiotemporal CNN-LSTM deep learning model for predicting soil temperature in diverse large-scale regional climates. Sci Total Environ. 2025; 968: 178901. doi:10.1016/j.scitotenv.2025.178901. [Google Scholar] [CrossRef]
25. Wang F , Wang Y , Chen W , Zhao C . An improved iTransformer with RevIN and SSA for greenhouse soil temperature prediction. Agronomy. 2025; 15( 1): 223. doi:10.3390/agronomy15010223. [Google Scholar] [CrossRef]
26. Liu W , Han T , Wang C , Zhang F , Xu Z . Predicting indoor temperature of solar green house by machine learning algorithms: a comparative analysis and a practical approach. Smart Agric Technol. 2025; 12: 101096. doi:10.1016/j.atech.2025.101096. [Google Scholar] [CrossRef]
27. Jeon YJ , Kim JY , Hwang KS , Cho WJ , Kim HJ , Jung DH . Machine learning-powered forecasting of climate conditions in smart greenhouse containing netted melons. Agronomy. 2024; 14( 5): 1070. doi:10.3390/agronomy14051070. [Google Scholar] [CrossRef]
28. M’hamdi O , Takács S , Palotás G , Ilahy R , Helyes L , Pék Z . A comparative analysis of XGBoost and neural network models for predicting some tomato fruit quality traits from environmental and meteorological data. Plants. 2024; 13( 5): 746. doi:10.3390/plants13050746. [Google Scholar] [CrossRef]
29. Alizamir M , Wang M , Ikram RMA , Ahmed KO , Heddam S , Kim S . An efficient computational investigation on accurate daily soil temperature prediction using boosting ensemble methods explanation based on SHAP importance analysis. Results Eng. 2024; 24: 103220. doi:10.1016/j.rineng.2024.103220. [Google Scholar] [CrossRef]
30. Gökmen F , Uygur V , Sukuşu E . Extreme gradient boosting regression model for soil available boron. Eurasian Soil Sci. 2023; 56( 6): 738– 46. doi:10.1134/S1064229322602128. [Google Scholar] [CrossRef]
31. Shao Z , Ahmad MN , Javed A . Comparison of random forest and XGBoost classifiers using integrated optical and SAR features for mapping urban impervious surface. Remote Sens. 2024; 16( 4): 665. doi:10.3390/rs16040665. [Google Scholar] [CrossRef]
32. Imani M , Beikmohammadi A , Arabnia HR . Comprehensive analysis of random forest and XGBoost performance with SMOTE, ADASYN, and GNUS under varying imbalance levels. Technologies. 2025; 13( 3): 88. doi:10.3390/technologies13030088. [Google Scholar] [CrossRef]
33. Öz H . Effect of aNovel polyethylene mulch material on soil temperature and yield of lettuce (Lactuca sativa L.). Gesunde Pflanz. 2023; 75( 5): 2169– 76. doi:10.1007/s10343-023-00841-4. [Google Scholar] [CrossRef]
34. TSMS . Climate classification. Ankara, Turkey: Turkish State Meteorological Service; 2025 [cited 2025 Jan 1]. Available from: https://www.mgm.gov.tr/veridegerlendirme/il-ve-ilceler-istatistik.aspx?k=A [Google Scholar]
35. Holman JP . Experimental methods for engineers. 8th ed. New York, NY, USA: McGraw-Hill; 2021. [Google Scholar]
36. R Core Team . R: a language and environment for statistical computing. Vienna, Austria: R Foundation for Statistical Computing; 2025 [cited 2025 Jan 1]. Available from: https://www.R-project.org/. [Google Scholar]
37. Shwartz-Ziv R , Armon A . Tabular data: deep learning is not all you need. Inf Fusion. 2022; 81: 84– 90. doi:10.1016/j.inffus.2021.11.011. [Google Scholar] [CrossRef]
38. Grinsztajn L , Oyallon E , Varoquaux G . Why do tree-based models still outperform deep learning on tabular data? arXiv:2207.08815. 2022. [Google Scholar]
39. Tüysüzoğlu G , Bİrant D , Kiranoglu V . Soil temperature prediction via self-training: Izmir case. J Agric Sci. 2022; 28: 47– 62. doi:10.15832/ankutbd.775847. [Google Scholar] [CrossRef]
40. Kucukerdem HK , Ozturk HH . Machine learning-based prediction of root-zone temperature using bio-based phase-change material in greenhouse. Sustainability. 2025; 17( 21): 9455. doi:10.3390/su17219455. [Google Scholar] [CrossRef]
41. Eyduran E , Akin M , Eyduran SP . Application of multivariate adaptive regression splines through R software. Ankara, Turkey: Nobel Academic Publishing; 2019. [Google Scholar]
42. Zaborski D , Ali M , Eyduran E , Grzesiak W , Tariq MM , Abbas F , et al. Prediction of selected reproductive traits of indigenous harnai sheep under the farm management system via various data mining algorithms. Pak J Zool. 2019; 51( 2): 421. doi:10.17582/journal.pjz/2019.51.2.421.431. [Google Scholar] [CrossRef]
43. Gordon GG , Foshee WG , Reed ST , Brown JE , Vinson EL . The effects of colored plastic mulches and row covers on the growth and yield of okra. HortTechnology. 2010; 20( 1): 224– 33. doi:10.21273/horttech.20.1.224. [Google Scholar] [CrossRef]
44. Kapanen A , Schettini E , Vox G , Itävaara M . Performance and environmental impact of biodegradable films in agriculture: a field study on protected cultivation. J Polym Environ. 2008; 16( 2): 109– 22. doi:10.1007/s10924-008-0091-x. [Google Scholar] [CrossRef]
45. Libik A , Siwek P . Changes in soil temperature affected by the application of plastic covers in field production of lettuce and water melon. Acta Hortic. 1994; 371: 269– 74. doi:10.17660/actahortic.1994.371.34. [Google Scholar] [CrossRef]
46. Hirai G . The effect of non-woven fabric floating row covers on the emergence, growth, and bulb yield of direct-seeded Onions (Allium cepa L.) in a subarctic area. The Hortic J. 2019; 88( 1): 67– 75. doi:10.2503/hortj.okd-172. [Google Scholar] [CrossRef]
47. Yin H , Wu Z , Huang Z , Luo Y , Liu X , Peng X , et al. A multivariate soil temperature interval forecasting method for precision regulation of plant growth environment. Front Plant Sci. 2024; 15: 1460654. doi:10.3389/fpls.2024.1460654. [Google Scholar] [CrossRef]
48. Azad N , He H . Generalization of multiple depths soil temperature estimation using LSTM and CNN. J Hydrol. 2025; 661: 133687. doi:10.1016/j.jhydrol.2025.133687. [Google Scholar] [CrossRef]
49. Geng Q , Wang L , Li Q . Soil temperature prediction based on explainable artificial intelligence and LSTM. Front Environ Sci. 2024; 12: 1426942. doi:10.3389/fenvs.2024.1426942. [Google Scholar] [CrossRef]
50. Borisov V , Leemann T , Seßler K , Haug J , Pawelczyk M , Kasneci G . Deep neural networks and tabular data: a survey. IEEE Trans Neural Netw Learning Syst. 2024; 35( 6): 7499– 519. doi:10.1109/tnnls.2022.3229161. [Google Scholar] [CrossRef]
51. Zhao H , Wang X , Jin P , Zhou J , Wang Y , Dong W , et al. Effects of biodegradable mulch films with different thicknesses on the quality of watermelon under protected cultivation. Agronomy. 2025; 15( 10): 2336. doi:10.3390/agronomy15102336. [Google Scholar] [CrossRef]
52. Uttsha MM , Haque AKMN , Banna TT , Deowan SA , Islam MA , Hasan Babu HM . Enhancing agricultural automation through weather invariant soil parameter prediction using machine learning. Heliyon. 2024; 10( 7): e28626. doi:10.1016/j.heliyon.2024.e28626. [Google Scholar] [CrossRef]
53. Gulser C , Ekberli I . A comparison of estimated and measured diurnal soil temperature through a clay soil depth. J Appl Sci. 2004; 4( 3): 418– 23. doi:10.3923/jas.2004.418.423. [Google Scholar] [CrossRef]
54. Ozgener O , Ozgener L , Tester JW . A practical approach to predict soil temperature variations for geothermal (ground) heat exchangers applications. Int J Heat Mass Transf. 2013; 62: 473– 80. doi:10.1016/j.ijheatmasstransfer.2013.03.031. [Google Scholar] [CrossRef]
55. Holmes TRH , Owe M , De Jeu RAM , Kooi H . Estimating the soil temperature profile from a single depth observation: a simple empirical heatflow solution. Water Resour Res. 2008; 44( 2): 2007WR005994. doi:10.1029/2007wr005994. [Google Scholar] [CrossRef]
56. Gao Z , Tong B , Horton R , Mamtimin A , Li Y , Wang L . Determination of desert soil apparent thermal diffusivity using a conduction-convection algorithm. J Geophys Res Atmos. 2017; 122( 18): 9569– 78. doi:10.1002/2017jd027290. [Google Scholar] [CrossRef]
57. Tarara JM . Microclimate modification with plastic mulch. HortScience. 2000; 35( 2): 169– 80. doi:10.21273/hortsci.35.2.169. [Google Scholar] [CrossRef]
58. Kader MA , Nakamura K , Senge M , Mojid MA , Kawashima S . Effects of coloured plastic mulch on soil hydrothermal characteristics, growth and water productivity of rainfed soybean. Irrig Drain. 2020; 69( 3): 483– 94. doi:10.1002/ird.2431. [Google Scholar] [CrossRef]
59. Chen N , Li X , Šimůnek J , Shi H , Hu Q , Zhang Y . Evaluating the effects of biodegradable and plastic film mulching on soil temperature in a drip-irrigated field. Soil Tillage Res. 2021; 213: 105116. doi:10.1016/j.still.2021.105116. [Google Scholar] [CrossRef]
60. Pramanik P , Bandyopadhyay KK , Bhaduri D , Bhattacharyya R , Aggarwal P . Effect of mulch on soil thermal regimes—A review. Int J Agric Environ Biotechnol. 2015; 8( 3): 645. doi:10.5958/2230-732x.2015.00072.8. [Google Scholar] [CrossRef]
61. Li N , Tian F , Hu H , Lu H , Ming G . Effects of plastic mulch on soil heat flux and energy balance in a cotton field in northwest China. Atmosphere. 2016; 7( 8): 107. doi:10.3390/atmos7080107. [Google Scholar] [CrossRef]
62. Murakami T , Yamada K , Yoshida S . Root distribution of field-grown crisphead lettuce (Lactuca sativa L.) under different fertilizer and mulch treatment. Soil Sci Plant Nutr. 2002; 48( 3): 347– 55. doi:10.1080/00380768.2002.10409211. [Google Scholar] [CrossRef]
63. Zhao Z , Cai Y , Gu C , Xu H , Teng Y , Guo W . The effects of root-zone temperature regulation on the growth and quality of hydroponic lettuce in summer. Agronomy. 2025; 15( 12): 2768. doi:10.3390/agronomy15122768. [Google Scholar] [CrossRef]
64. Moccio M , Dunn BL , Kaur A , Fontanier C , Zhang L . Effects of root zone temperature of hydroponic lettuce affects plant growth, nutrient uptake, and vitamin a content. HortScience. 2024; 59( 2): 255– 7. doi:10.21273/hortsci17560-23. [Google Scholar] [CrossRef]
65. Feng Y , Cui N , Hao W , Gao L , Gong D . Estimation of soil temperature from meteorological data using different machine learning models. Geoderma. 2019; 338: 67– 77. doi:10.1016/j.geoderma.2018.11.044. [Google Scholar] [CrossRef]
66. Cross JF , Owen JS Jr , Shreckhise JH , Fields JS , Nackley L , Altland JE , et al. Parsimonious models of root zone temperature in soilless substrates through ensemble machine learning. Smart Agric Technol. 2025; 12: 101289. doi:10.1016/j.atech.2025.101289. [Google Scholar] [CrossRef]
67. Kim HY , Yu OY , Ferrell J . Case study: reducing heating energy consumption in a high tunnel greenhouse with renewable energy and microclimate control by bench-top root-zone heating, bench covers, and under-bench insulation. Discov Sustain. 2024; 5( 1): 86. doi:10.1007/s43621-024-00276-5. [Google Scholar] [CrossRef]
68. Kafi A , Sanfilippo A , Jovanovic R , Shannak S . A predictive greenhouse digital twin for controlled environment agriculture. In: Proceedings of the 27th International Conference on Enterprise Information Systems; 2025 Apr 4–6; Porto, Portugal. doi:10.5220/0013479900003929. [Google Scholar] [CrossRef]
69. Dhatt AS , Garg N , Singh R , Aujla IS . Effect of plastic low tunnel and mulch type on soil temperature, growth, earliness and yield of brinjal under net-house and open field in Plains of North-Western India. J Hortic Sci. 2017; 12( 2): 106– 12. doi:10.24154/jhs.v12i2.9. [Google Scholar] [CrossRef]
70. Snyder K , Grant A , Murray C , Wolff B . The effects of plastic mulch systems on soil temperature and moisture in central Ontario. HortTechnology. 2015; 25( 2): 162– 70. doi:10.21273/horttech.25.2.162. [Google Scholar] [CrossRef]
71. Alizamir M , Ahmed KO , Heddam S , Kim S , Eun Lee J . Daily soil temperature prediction using hybrid deep learning and SHAP for sustainable soil management. Eng Appl Comput Fluid Mech. 2025; 19: 2541686. doi:10.1080/19942060.2025.2541686. [Google Scholar] [CrossRef]
72. Bumgarner NR , Bennett MA , Ling PP , Mullen RW , Kleinhenz MD . Active and passive zonal heating creates distinct microclimates and influences spring- and fall-time lettuce growth in Ohio. HortTechnology. 2012; 22( 2): 228– 36. doi:10.21273/horttech.22.2.228. [Google Scholar] [CrossRef]
73. Kawasaki Y , Matsuo S , Kanayama Y , Kanahama K . Effect of root-zone heating on root growth and activity, nutrient uptake, and fruit yield of tomato at low air temperatures. J Japan Soc Hort Sci. 2014; 83( 4): 295– 301. doi:10.2503/jjshs1.mi-001. [Google Scholar] [CrossRef]
74. Muzamil M , Gul D , Banday RUZ , Rasool S , Mohiuddin M , Masoodi U . Smart greenhouses: a viable option for high-tech farming and food security. In: Handbook of Agricultural Technologies. Singapore: Springer Nature; 2025. p. 1– 22. doi:10.1007/978-981-99-0862-2_22-1. [Google Scholar] [CrossRef]
75. Săcăleanu DI , Matache MG , Roșu ȘG , Florea BC , Manciu IP , Perișoară LA . IoT-enhanced decision support system for real-time greenhouse microclimate monitoring and control. Technologies. 2024; 12( 11): 230. doi:10.3390/technologies12110230. [Google Scholar] [CrossRef]
76. Aborujilah A , Al-Sarem M , Abu-Zanona MA . Forecast-driven climate control for smart greenhouses: energy optimization using LSTM model. Energies. 2025; 18( 21): 5821. doi:10.3390/en18215821. [Google Scholar] [CrossRef]
Cite This Article
 Copyright © 2026 The Author(s). Published by Tech Science Press.
This work is licensed under a Creative Commons Attribution 4.0 International License , which permits unrestricted use, distribution, and reproduction in any medium, provided the original work is properly cited.
 Downloads
 Citation Tools