
 Submit a Paper
 Propose a Special lssue
 Open Access
ARTICLE

Moderate CO2 Enrichment Enhances Saponin Accumulation in Panax japonicus by Activating Sugar Metabolism
College of Agriculture, Anshun University, Anshun, China
* Corresponding Author: Xiao Wang. Email:
(This article belongs to the Special Issue: Plant Responses and Adaptations to Environmental Stresses)
Phyton-International Journal of Experimental Botany 2026, 95(3), 20 https://doi.org/10.32604/phyton.2026.075656
Received 05 November 2025; Accepted 29 December 2025; Issue published 31 March 2026
 View Full Text
 Download PDF
Abstract
Three-year-old Panax japonicus was exposed to elevated CO2 concentrations using open-top chambers: ambient CO2 (aCO2), moderately elevated (e1CO2, 550 μmol/mol), and highly elevated (e2CO2, 750 μmol/mol). Gas exchange parameters, photosynthetic pigments, sugar accumulation, and total saponin content were measured to assess the effects of CO2 enrichment on photosynthesis, sugar metabolism, and saponin biosynthesis. The e1CO2 treatment significantly increased net photosynthetic rate (by 17.22% at 36 days and 69.62% at 92 days), chlorophyll a content, and soluble sugar, sucrose, and starch accumulation. Key sugar metabolism enzymes, including sucrose phosphate synthase (SPS), also showed enhanced activity. Consequently, underground rhizome total saponins rose significantly by 15.16%. In contrast, e2CO2 initially (36 days) stimulated photosynthesis but lost this effect over prolonged exposure (92 days), with no significant impact on photosynthetic parameters, pigments, or sugar levels. Correlation analysis indicated that rhizome saponin content was positively associated with leaf sucrose levels and sucrose synthase (synthetic direction) activity. These findings suggest that moderate CO2 elevation (e1CO2) enhances P. japonicus photosynthesis and sugar metabolism, driving greater saponin accumulation. However, high CO2 (e2CO2) has transient benefits, with stimulatory effects diminishing over time.Keywords
Anthropogenic activities have elevated atmospheric carbon dioxide (CO2) concentrations from a pre-industrial level of approximately 280 ppm to over 420 ppm today and are a primary driver of global climate change [1]. Beyond its climatic effects, this CO2 enrichment (eCO2) acts as a fundamental “aerial fertilizer” for plant growth. Meta-analyses of Free-Air CO2 Enrichment (FACE) studies provide robust statistical evidence of this fertilization effect: for instance, eCO2 at concentrations ranging from 500–600 ppm can stimulate the yield of major C3 cereal crops like wheat and rice by 10–25% and root crops by 25–38% under optimal conditions [2]. This yield enhancement is directly linked to the core physiological impact of eCO2 on C3 plants: the competitive inhibition of ribulose-1,5-bisphosphate carboxylase/oxygenase oxygenation, which reduces photorespiration and thereby increases net CO2 assimilation rates. In FACE studies, photosynthesis in C3 species typically increases by 20–40% under these conditions [3]. This global phenomenon extends beyond staple food crops to medicinal plants, where increased photosynthetic carbon fixation can cascade into secondary metabolism by altering the availability of carbon precursors and energy supply. Numerous studies have investigated the effects of eCO2 on the growth and secondary metabolism of medicinal plants, such as Polygonatum kingianum [4], Typha orientalis [5], Lycium barbarum [6], Dendrobium officinale [7], Mentha piperita [8], and Paris polyphylla [9]. Panax japonicus C. A. Meyer, a perennial herbaceous plant, is one of China’s rare and endangered medicinal herbs and is locally regarded as the “King of Herbal Medicines”. Its primary bioactive constituents include saponins, carbohydrates, and amino acids [10]. As a typical C3 plant, P. japonicus exhibits high photosynthetic responsiveness to eCO2. More importantly, it possesses a robust underground rhizome sink that serves as the primary site for the translocation and storage of photoassimilates like sucrose, establishing a direct source-sink pathway from leaf photosynthesis, where sucrose functions not only as a critical carbon skeleton but also as an energy substrate for the biosynthesis of secondary metabolites, including saponins. While most existing studies on P. japonicus have focused on its chemical composition [11], pharmacological activity [12], quality evaluation [13], and gene regulation [14], physiological and ecological research related to cultivation remains limited. Given these physiological traits, P. japonicus is a well-suited candidate for uncovering the cascade of events from eCO2-induced carbon assimilation and allocation through sugar metabolic pathways to the eventual partitioning of carbon into saponin production.
Saponin accumulation in the underground organs of medicinal plants such as P. japonicus is fundamentally governed by carbohydrate availability and translocation from aerial tissues [15]. Following photosynthetic CO2 assimilation, sucrose serves as the primary transport form of photoassimilates and is partitioned into underground organs, where it is metabolized by key enzymes–including sucrose synthase (SS), sucrose phosphate synthase (SPS), and neutral invertase (NI)–to generate soluble sugars that fuel secondary metabolic pathways such as saponin biosynthesis [16,17]. The glycosylation of aglycones, an essential step in saponin formation, is intrinsically dependent on carbohydrate supply, with uridine diphosphate glucose (UDPG)–derived from sucrose metabolism–serving as the key glycosyl donor for triterpenoid skeletons [18,19]. In underground tissues, the substrate for UDPG synthesis is primarily supplied by leaf photosynthesis, and its abundance is governed by photosynthetic intensity and the translocation efficiency of sucrose [20,21]. Thus, saponin accumulation in below-ground organs is closely linked to photosynthetic activity, sugar metabolism, and carbohydrate status in above-ground parts [22]. While eCO2 has been shown to enhance sugar accumulation and related enzyme activities, its effect on final saponin content is often species-specific and dependent on exposure duration [23,24]. These physiological and biochemical mechanisms provide a theoretical basis for the hypothesis that eCO2 may influence medicinal plant quality by modulating carbon allocation from source leaves to sink organs.
This study investigated the effects of eCO2 on photosynthesis, sugar metabolism, and saponin accumulation in P. japonicus. We hypothesized that a moderate CO2 elevation (e1CO2, 550 μmol/mol) would sustainably enhance the net photosynthetic rate, upregulate the activity of key sugar-metabolizing enzymes, and consequently promote carbon allocation towards sucrose and total saponin biosynthesis in the rhizome. In contrast, a higher CO2 level (e2CO2, 750 μmol/mol) was anticipated to induce only a transient photosynthetic enhancement, with acclimation effects (CO2 level × exposure time interaction) diminishing its long-term benefits on carbon assimilation and partitioning into secondary metabolites. By integrating these physiological and metabolic responses, this study aims to elucidate the mechanistic basis of how eCO2 modulates the carbon flux from primary photosynthesis to secondary saponin biosynthesis in P. japonicus, thereby providing theoretical insights into the impact of future climatic changes on the quality of medicinal plants.
2.1 Plant Material and Substrate
The plant material used in this study was P. japonicus rhizomes. These rhizomes were sourced in November 2024 from a commercial nursery located in Banqiao Town, Enshi City, Enshi Tujia and Miao Autonomous Prefecture, Hubei Province, China, where they had been grown for three years under standardized cultivation practices. The pre-experimental growth conditions at the nursery involved cultivation under a natural forest canopy, providing approximately 60–70% shade. The plants experienced natural ambient temperature and precipitation cycles with supplemental drip irrigation applied during extended dry periods. In November 2024, uniformly sized, three-year-old rhizomes were transplanted into nine cultivation frames (three frames per open-top chamber) with each frame measuring 111 cm × 37 cm × 34 cm. The three OTCs corresponded to three CO2 treatments: ambient CO2 (aCO2), and two elevated CO2 levels (e1CO2 and e2CO2). Each frame contained 20 rhizomes, and frames were randomly positioned within each chamber to avoid positional effects. The plants were allowed to establish and overwinter in the OTCs under ambient conditions. The cultivation substrate consisted of a mixture of yellow soil, nutrient soil, vermiculite, and pig manure compost, with the following nutrient composition: pH 6.7; available nitrogen 38.4 mg/kg; available phosphorus 18.9 mg/kg; available potassium 148.8 mg/kg; organic matter 6.3%.
The experimental apparatus comprised octagonal OTCs, each with eight sides, a side length of 1.0 m, a height of 1.7 m, and a top inclined 45° inward (Fig. 1).
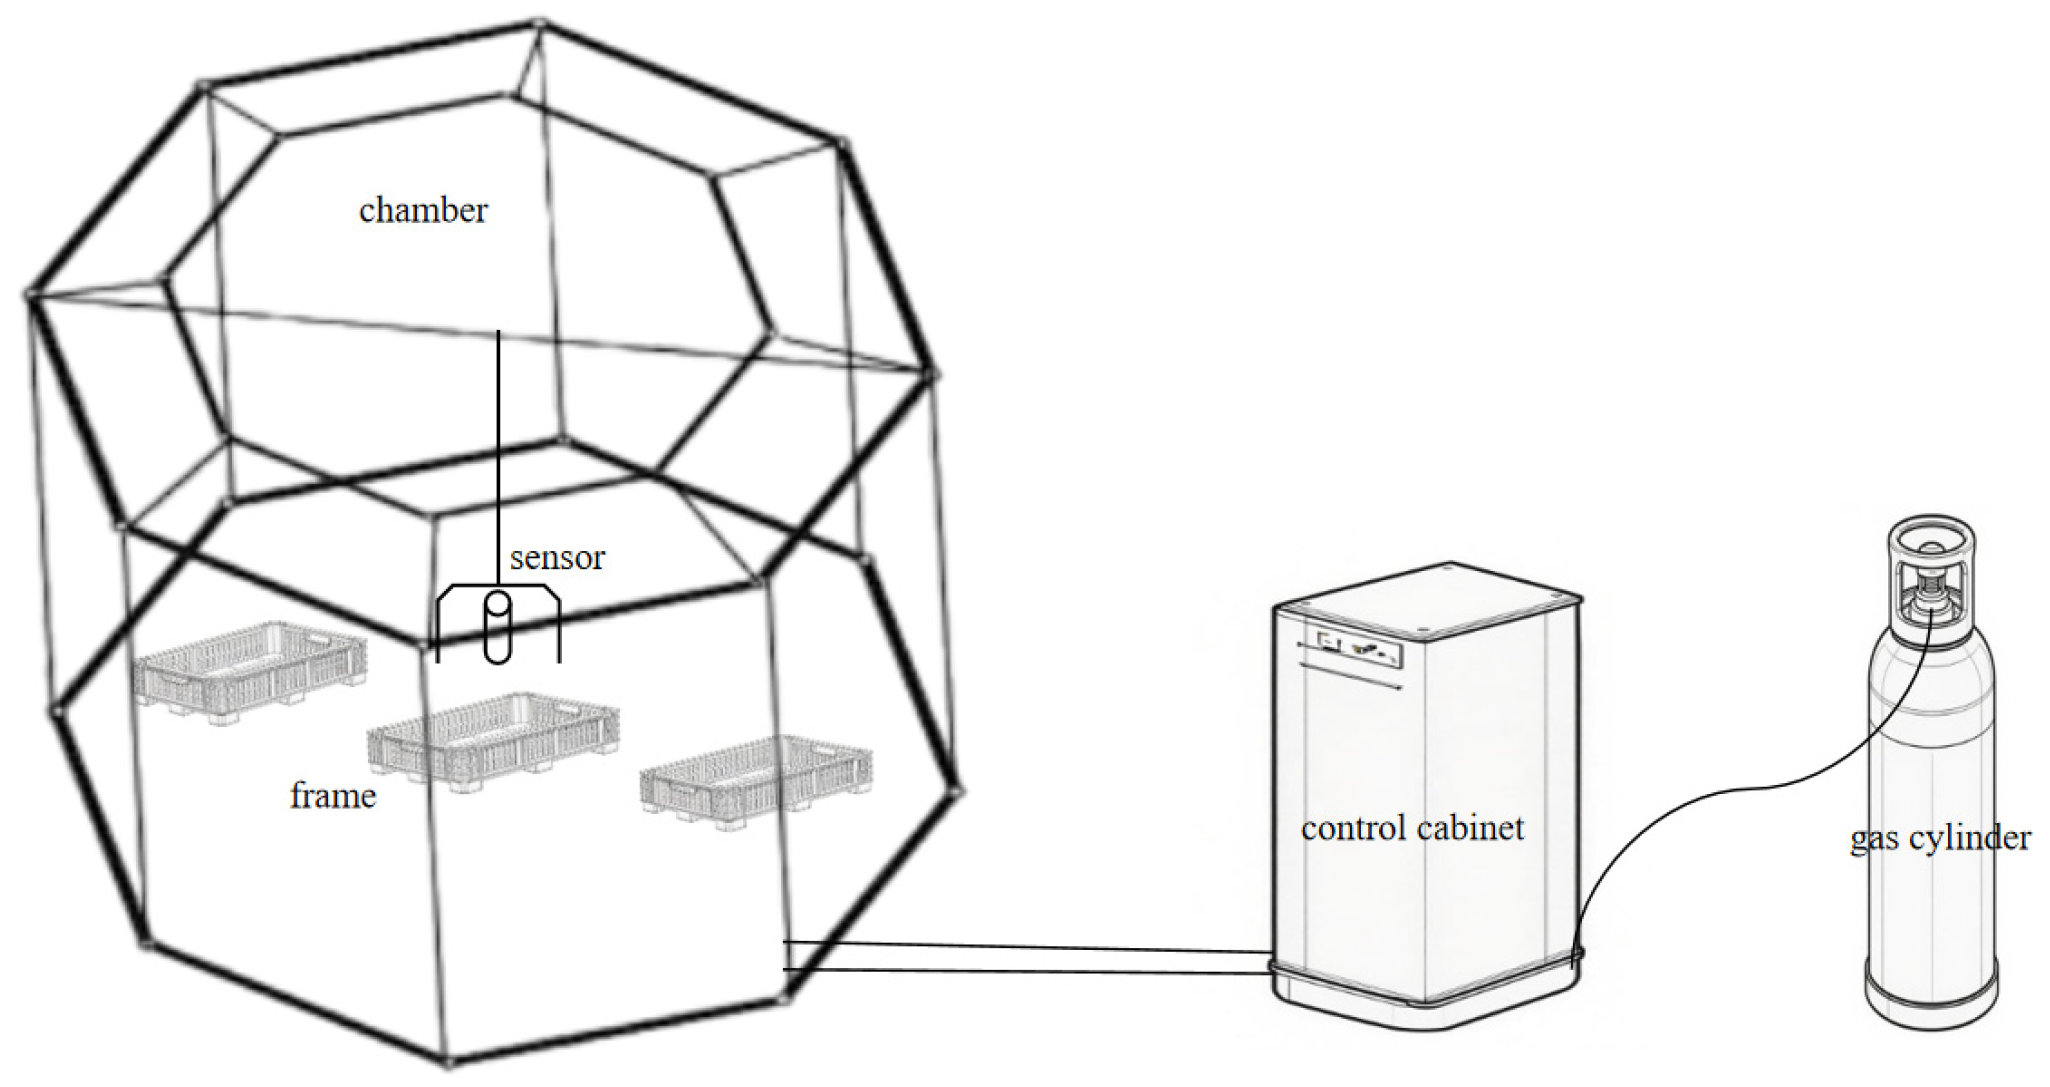
Figure 1: The open-top chamber CO2 concentration control system.
The experiment was conducted with three CO2 concentration treatments: aCO2, e1CO2 and e2CO2. The aCO2 treatment served as the control, with no additional CO2 introduced into the chambers. In contrast, CO2 gas was supplied to the e1CO2 and e2CO2 chambers. The microclimatic conditions within the OTCs were closely monitored and controlled. The CO2 concentration was regulated using a sensor (GMP-220, Vaisala, Finland) positioned 20 cm above the mean plant canopy height and connected to a data logger. This system transmitted real-time data to a control computer, which executed a programmed feedback mechanism to operate electromagnetic valves, thereby maintaining the CO2 concentrations within the specified targets. In addition to CO2, air temperature and relative humidity were continuously monitored at a height of 20 cm above the mean plant canopy height inside each chamber using integrated sensors (MTK-TH800, Asmik, Guangzhou, China), with data logged at 10-min intervals. The continuous time-series data for all parameters were recorded to verify the stability and accuracy of the treatment conditions throughout the experiment. Specifically, the CO2 concentrations were maintained at 550 μmol/mol for the e1CO2 treatment and 750 μmol/mol for the e2CO2 treatment. These setpoints were selected to simulate projected atmospheric CO2 levels, corresponding to mid-century and end-of-century projections, respectively, under the intermediate SSP2-4.5 scenario as outlined in the IPCC Sixth Assessment Report [25]. This approach is widely used to assess plant responses to future climate conditions. Continuous monitoring data of CO2 concentrations in each chamber during the entire experimental period demonstrate that CO2 levels were maintained at stable mean values of 548.6 ± 9.3 μmol/mol for the e1CO2 treatment and 747.1 ± 8.7 μmol/mol for the e2CO2 treatment, confirming effective control around the target setpoints. Each CO2 treatment consisted of three frames with each frame consisting of 20 seedlings. The elevated CO2 treatments commenced on April 11, 2025, shortly after the spring sprouting. Throughout the experimental period, soil moisture was maintained by timely and equal-volume watering to keep the soil consistently moist. Weeds were regularly removed by hand to minimize competition. To assess any potential microclimatic modification by the chambers, air temperature was measured both inside each OTC at canopy height and at corresponding heights in adjacent open-field plots. Air temperature varied naturally across the study period. The ambient temperature ranged from a minimum of 6°C to a maximum of 30°C. Inside the chambers, temperatures closely tracked these external conditions, with a mean chamber effect (temperature difference, inside minus outside) of +0.3°C, confirming minimal thermal alteration by the OTCs. Relative humidity in the ambient environment ranged between 75% and 84%. Gas exchange parameters of P. japonicus leaves were measured at 36 days (leaf expansion stage) and 92 days (nutrient accumulation stage) after the initiation of CO2 treatments. At each sampling time, whole plants were harvested to determine total plant biomass. Subsequently, leaf samples were collected to quantify photosynthetic pigment contents and key sucrose metabolism indicators. Concurrently, underground rhizomes were sampled for the analysis of total saponin content. Each parameter was measured with five replicates to ensure data reliability.
2.2.2 Determination of Biomass
To determine the biomass (g/plant) of P. japonicus seedlings, seedlings were removed from the soil, washed to remove soil from the roots, placed in an oven at 105°C for 30 min and then dried at 70°C until a constant weight was achieved.
2.2.3 Determination of Gas Exchange Parameters
Leaf gas exchange measurements were conducted on sunny days between 9:00 and 11:00 a.m., which served as the standardized measurement window for all samples to minimize diurnal variation using a portable photosynthesis system (LICOR-6400 LI-COR Inc., USA). Within this period, measurement order of plants from different treatments and replicates was randomized to control for temporal effects. For each measurement, a fully expanded, sun-exposed leaf from the upper or middle canopy was enclosed in the standard leaf cuvette. The following cuvette conditions were maintained: the reference CO2 concentration was dynamically controlled to match the growth condition of each plant (i.e., either 400 μmol/mol for aCO2 chambers or the respective elevated levels for e1CO2 and eCO2 chambers); photosynthetic photon flux density (PPFD) was provided by the unit’s built-in red-blue LED light source set to a saturating intensity of 1200 μmol/m2/s; leaf temperature was controlled to 25°C; the vapor pressure deficit (VPD) of the air stream was maintained at 1.0 ± 0.2 kPa; and the flow rate through the cuvette was set to 500 μmol/s with the internal mixing fan operating at standard speed. The following parameters were directly recorded or calculated by the instrument’s software: net photosynthetic rate (Pn), stomatal conductance (Gs), transpiration rate (Tr), and intercellular CO2 concentration (Ci). Instantaneous water-use efficiency (WUE) was calculated as Pn/Tr. For each treatment chamber at each time point (36 and 92 days), measurements were taken on three leaves from each of five different replicate plants, with different plants sampled at each harvest in a destructive, non-repeated measures design.
2.2.4 Determination of Photosynthetic Pigment Content
Photosynthetic pigment content was determined from fully expanded leaves sampled from the middle-upper canopy of five randomly selected plants per open-top chamber. Sampling was conducted between 9:00 and 11:00 a.m. at 36 and 92 days after the initiation of CO2 treatments. From each plant, two leaf were excised, immediately wrapped in aluminum foil, flash-frozen in liquid nitrogen, and stored at 80°C until analysis. Approximately 0.1 g of frozen leaf tissue was finely ground in liquid nitrogen, transferred to a 15 mL centrifuge tube containing 10 mL of 95% (v/v) ethanol, and incubated in the dark at 4°C for 24 h or until the leaf tissue became colorless. The extracts were then centrifuged to remove debris. The absorbance of the supernatant was measured at 470, 649, and 664 nm using a UV-Vis spectrophotometer (UV-2600, Shimadzu, Japan) with a 1 cm path length quartz cuvette. A blank of 95% ethanol was used for baseline correction. The concentrations of chlorophyll a (Chl a), chlorophyll b (Chl b), total chlorophyll (Chl a + b), and total carotenoids (Car) were calculated using the following equations:
Chl a (μg/mL) = 13.36A664 − 5.19A649 Chl b (μg/mL) = 27.43A649 − 8.12A664 Chl a + b (μg/mL) = Chl a + Chl b Car (μg/mL) = (1000A470 − 2.13 × Chl a − 97.64 × Chl b)/209Pigment contents were expressed on a fresh weight basis as micrograms per gram (mg/g FW). All extractions and measurements were performed in triplicate. Data from five plants within a chamber were averaged, and the chamber was considered the experimental unit for statistical analysis. The time from leaf harvesting to freezing did not exceed 3 min to prevent pigment degradation.
2.2.5 Determination of Sugar Content
Soluble sugar, reducing sugar, sucrose, and starch contents were quantified using colorimetric assays based on the principle of generating colored reaction products with specific reagents, followed by absorbance measurement at designated wavelengths to calculate concentrations. Soluble sugars were measured via the anthrone colorimetric method: samples were extracted with boiling water, then reacted with concentrated sulfuric acid and anthrone reagent, with absorbance read at 620 nm. Reducing sugars were determined by the 3,5-dinitrosalicylic acid (DNS) method, where alkaline heating produces a brownish-red compound measured at 540 nm. Sucrose was assayed by first removing reducing sugars via alkali treatment, followed by acid hydrolysis. The resulting glucose and fructose were quantified using the resorcinol reaction at 480 nm. Starch content was measured in samples pre-extracted with 80% ethanol to remove soluble sugars. The residue was hydrolyzed with acid to glucose, which was then quantified by the anthrone method at 620 nm. All assays employed standard curves for conversion, with final concentrations calculated based on sample mass or volume [26].
2.2.6 Determination of Enzyme Activity
Enzyme activities were measured using commercial enzyme-linked immunosorbent assay kits (Keming Biotechnology, Suzhou) following the manufacturer’s protocols. SS-I (decomposing direction) activity was determined by quantifying the reducing sugars (fructose) produced from the SS-I-catalyzed reaction of sucrose with uridine diphosphate (UDP) via the DNS method at 540 nm, expressed as the amount of reducing sugars generated per gram fresh weight per unit time. SS-II (synthetic direction) activity was assessed by measuring the sucrose formation from the SS-II-catalyzed reaction of free fructose with UDPG using the sucrose-resorcinol colorimetric method at 480 nm, with activity calculated relative to a standard curve and expressed as sucrose synthesized per gram fresh weight per unit time. NI activity was determined by detecting the reducing sugars (fructose and glucose) produced from the NI-catalyzed sucrose hydrolysis via the DNS method at 510 nm, expressed as reducing sugar production per gram fresh weight per unit time. SPS activity was measured by quantifying the sucrose phosphate generated from the SPS-catalyzed reaction of fructose-6-phosphate via the resorcinol colorimetric method at 480 nm, expressed as sucrose phosphate produced per gram fresh weight per unit time. Starch phosphorylase (SP) activity was determined by monitoring the NADPH production derived from the conversion of glucose-1-phosphate, generated by the SP-catalyzed reaction of starch’s α-1,4-glycosidic bonds with inorganic phosphate, through the absorbance change at 340 nm. All enzyme activity assays strictly followed the kit protocols, with reaction systems, detection wavelengths, and calculation formulas optimized for each enzyme’s characteristics, and preliminary experiments conducted to ensure method reliability.
2.2.7 Determination of total Saponin Content
Total saponin content was determined using an ultrasonic extraction method followed by vanillin-perchloric acid colorimetry, with ginsenoside Re as the reference standard. Dried and powdered samples were sieved, and 0.05 g was weighed into tubes with 1 mL extraction solvent, then ultrasonically extracted for 1 h. After centrifugation at 8000× g and 25°C for 10 min, the supernatant was collected for analysis. For colorimetric assays, 0.5 mL supernatant was evaporated at 70°C, then mixed with 0.2 mL vanillin-acetic acid solution and 0.8 mL perchloric acid, followed by incubation in a 55°C water bath for 20 min. After adding 200 μL acetic acid to develop the color, the mixture was thoroughly vortexed, and absorbance was measured at 589 nm [27].
Data entry and figure preparation were performed using Excel 2016 and OriginPro 2025, while statistical analyses were conducted in SPSS 23.0. The experimental unit for all analyses was the OTC. Data from plant samples (n = 5) within each chamber were averaged to obtain a single value per chamber per time point. Analysis of variance assessed the effects of CO2 concentration (aCO2, e1CO2, e2CO2), time (36/92 d) on all parameters. Residuals were checked for normality (Shapiro-Wilk) and homoscedasticity (Levene’s). Post-hoc comparisons used Tukey’s HSD test (p < 0.05). Pearson correlations were adjusted for multiple testing using the False Discovery Rate (q < 0.05).
3.1 Effects of Elevated CO2 on Biomass of P. japonicus
At 36 days, no significant differences in biomass were observed among the three CO2 treatments. In contrast, at 92 days, the e1CO2 and e2CO2 treatments significantly increased the biomass by 24.45% and 16.32%, respectively, compared to aCO2 (Fig. 2). These results demonstrate that extended exposure to elevated CO2, enhances plant biomass accumulation over time, with treatment effects becoming more pronounced at the later growth stage.
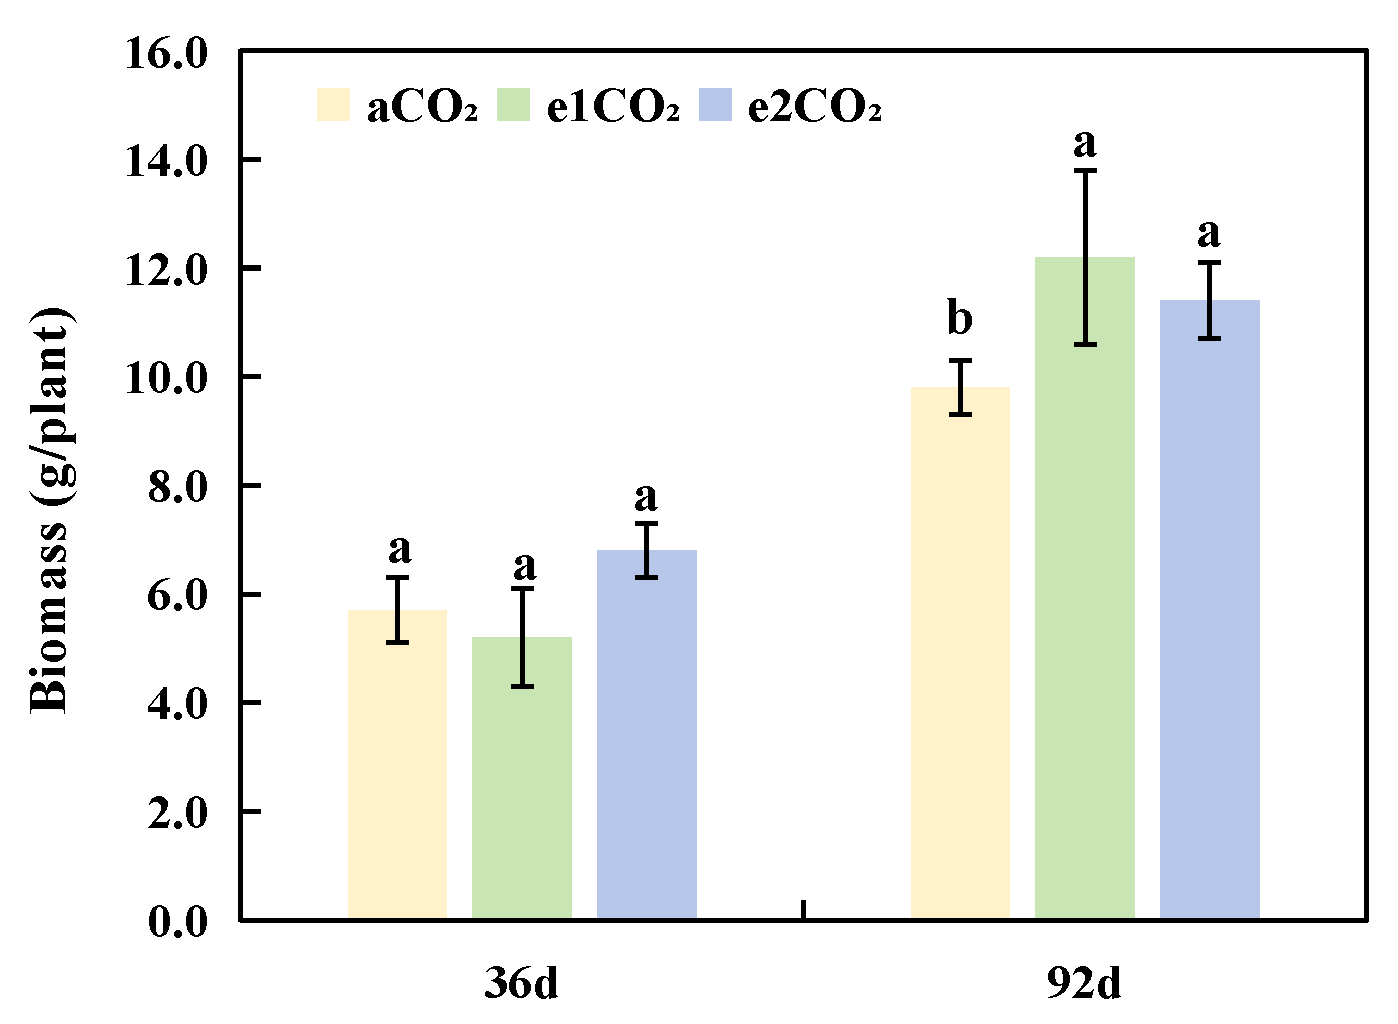
Figure 2: Effects of different treatments on biomass of P. japonicus. The data are expressed as the mean ± standard deviation (n = 5); Different lowercase letters for the same treatment time indicate significant differences (p < 0.05).
3.2 Effects of Elevated CO2 on Gas Exchange Parameters in P. japonicus
The effects of eCO2 on the gas exchange parameters of P. japonicus exhibited temporal variation during exposure (Table 1). After 36 days, both e1CO2 and e2CO2 treatments significantly enhanced Pn, with relative increases of 17.22% (under e1CO2) and 37.78% (under e2CO2) compared to aCO2. Meanwhile, WUE increased significantly under both eCO2 treatments, whereas Tr, Gs and Ci remained unchanged. By day 92, the responses diverged: the e1CO2 treatment still markedly enhanced Pn (69.62% increase) and WUE (41.86% increase), with no detectable changes in Tr, Gs, or Ci; in contrast, the e2CO2 treatment no longer exerted a significant effect on any of the measured gas exchange parameters.
Table 1: Effects of different treatments on the gas exchange parameters of P. japonicus.
| Treatments | Pn (μmol/m2/s) | Tr (mmol/m2/s) | Gs (mo/m2/s) | Ci (μmol/m2/s) | WUE (μmol/mmol) | |
|---|---|---|---|---|---|---|
| 36 d | aCO2 | 3.60 ± 0.24c | 3.11 ± 0.42a | 0.05 ± 0.01a | 323.57 ± 35.47a | 1.14 ± 0.33b |
| e1CO2 | 4.22 ± 0.31b | 2.79 ± 0.58a | 0.04 ± 0.01a | 293.80 ± 28.39a | 1.50 ± 0.39a | |
| e2CO2 | 4.96 ± 0.29a | 2.96 ± 0.71a | 0.05 ± 0.01a | 329.09 ± 46.37a | 1.66 ± 0.51a | |
| 92 d | aCO2 | 4.51 ± 0.48b | 2.78 ± 0.76ab | 0.05 ± 0.03a | 323.91 ± 23.94a | 1.72 ± 0.45b |
| e1CO2 | 7.65 ± 2.08a | 3.31 ± 0.84a | 0.06 ± 0.01a | 274.11 ± 56.50b | 2.44 ± 0.81a | |
| e2CO2 | 3.03 ± 0.73b | 2.24 ± 0.68b | 0.04 ± 0.01a | 324.99 ± 25.07a | 1.43 ± 0.41b | |
3.3 Effects of Elevated CO2 on Photosynthetic Pigment Contents of P. japonicus
After 36 days, both e1CO2 and e2CO2 significantly increased the contents of Chl a (by 19.20% and 24.58%, respectively) and total Chl (a + b) compared to the aCO2 control (Table 2). Conversely, the Chl a/b was significantly reduced by 85.57% under e2CO2 but was not significantly altered by e1CO2 (Table 2). No significant changes were observed in Chl b or Car contents under either treatment (Table 2). Following 92 days of exposure, the e1CO2 treatment sustained a significant increase in Chl a content (29.16%), with no significant effects on other pigments relative to aCO2. In contrast, the e2CO2 treatment showed no significant differences from aCO2 for any pigment metric. Notably, at this stage, the chlorophyll a and total chlorophyll contents in the e2CO2 treatment were significantly lower (by 33.95% and 29.15%, respectively) than those in the e1CO2 treatment (Table 2).
Table 2: Effects of different treatments on the photosynthetic pigment content of P. japonicus.
| Treatments | Chl a (mg/g) | Chl b (mg/g) | Chl a + b (mg/g) | Chl a/b | Car (mg/g) | |
|---|---|---|---|---|---|---|
| 36 d | aCO2 | 2.97 ± 0.14b | 0.58 ± 0.11ab | 3.56 ± 0.21b | 5.06 ± 0.44b | 0.90 ± 0.13a |
| e1CO2 | 3.54 ± 0.27a | 0.70 ± 0.15a | 4.24 ± 0.37a | 4.63 ± 0.26b | 1.00 ± 0.11a | |
| e2CO2 | 3.70 ± 0.19a | 0.39 ± 0.08b | 4.10 ± 0.14a | 9.39 ± 0.38a | 1.09 ± 0.07a | |
| 92 d | aCO2 | 4.63 ± 0.35b | 0.90 ± 0.05a | 5.53 ± 0.35ab | 5.16 ± 0.48a | 1.24 ± 0.31ab |
| e1CO2 | 5.98 ± 0.90a | 1.42 ± 0.57a | 7.41 ± 1.47a | 4.51 ± 1.15a | 1.68 ± 0.20a | |
| e2CO2 | 3.95 ± 0.22b | 0.99 ± 0.58a | 4.94 ± 0.63b | 4.83 ± 2.12a | 1.08 ± 0.28b | |
3.4 Effects of Elevated CO2 on Sugar Accumulation in P. japonicus
The contents of soluble sugars and related components in P. japonicus under eCO2 are presented in Fig. 3. After 36 days of treatment (Fig. 3A,C,D), the e1CO2 and e2CO2 treatments significantly increased the soluble sugar content by 15.57% and 35.38%, respectively, compared to aCO2 (Fig. 3A). The sucrose and starch contents were significantly elevated only under the e2CO2 treatment at this stage (Fig. 3C,D). No significant differences in reducing sugar content were detected among the treatments at 36 days (Fig. 1B). After 92 days of treatment (Fig. 3A,C,D), the e1CO2 treatment significantly enhanced the contents of soluble sugars, sucrose, and starch by 34.10%, 39.19%, and 36.74%, respectively, relative to aCO2. In contrast, the e2CO2 treatment significantly increased sucrose content by 16.68% but had no significant effect on soluble sugar or starch contents (Fig. 3A,C,D). The reducing sugar content remained unaffected by any CO2 treatment at 92 days (Fig. 3B). Furthermore, compared to the e1CO2 treatment, the e2CO2 treatment led to significantly lower levels of soluble sugars, sucrose, and starch at 92 days (Fig. 3A,C,D).
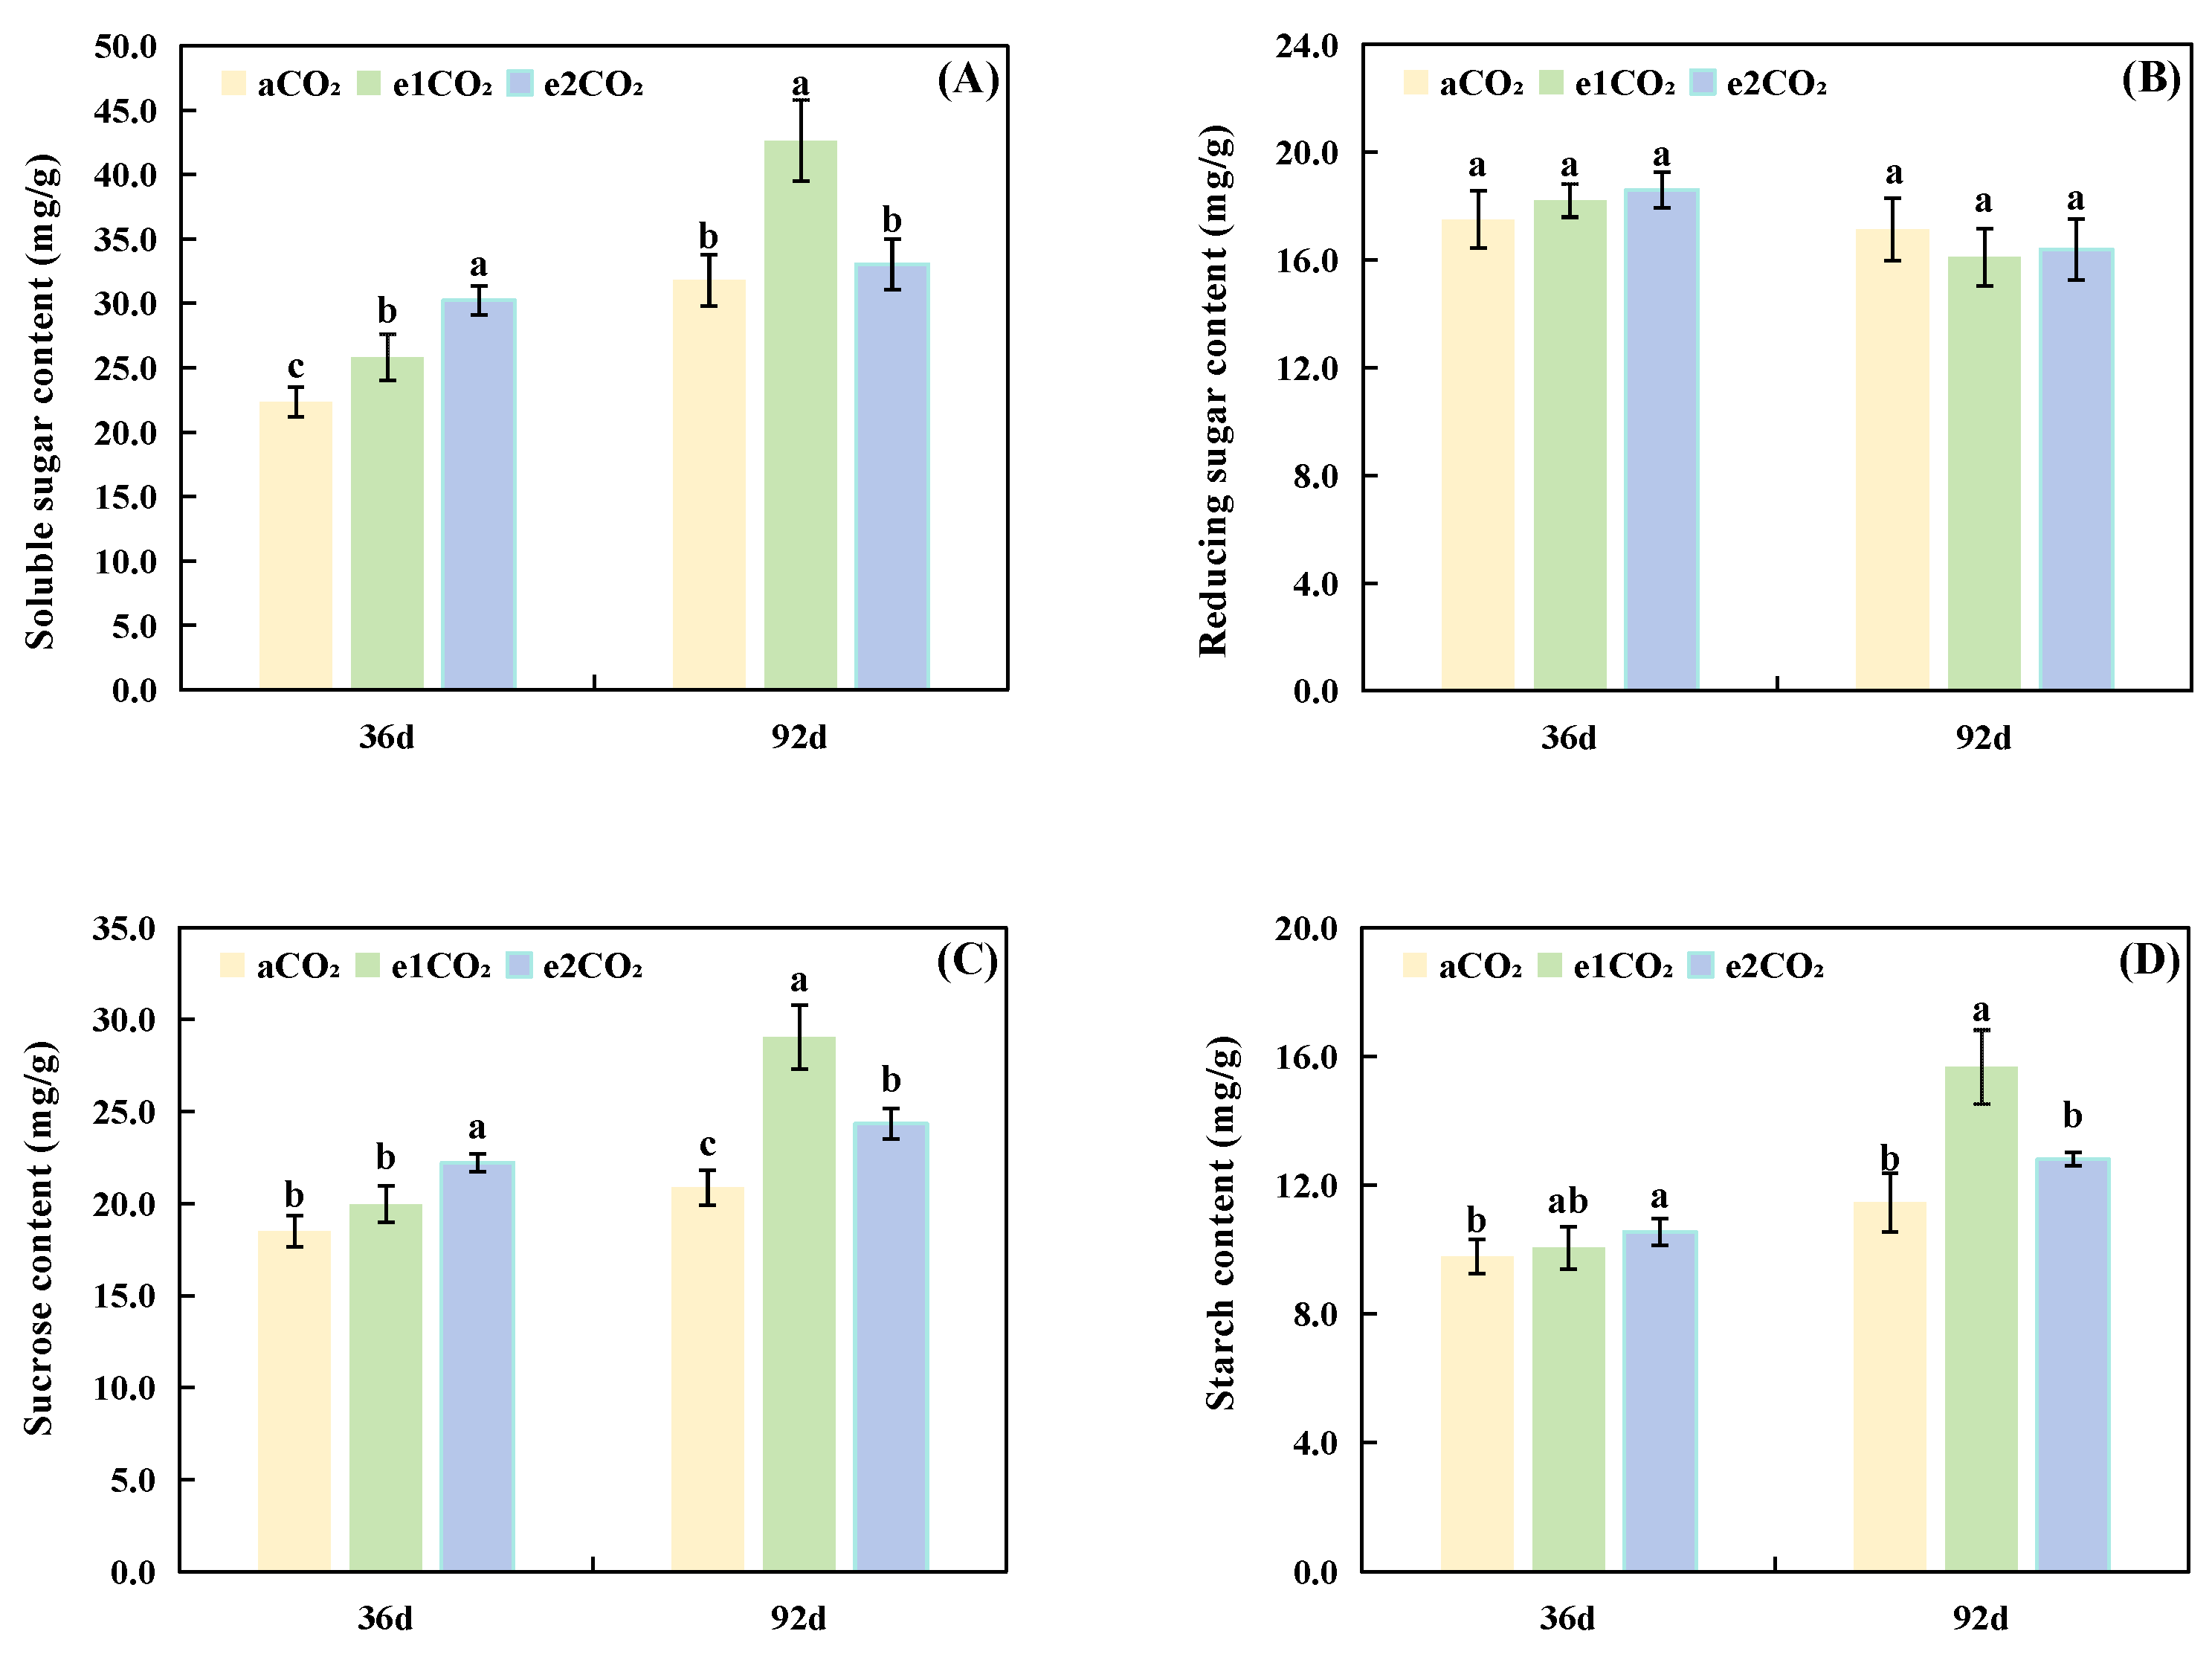
Figure 3: Effects of different treatments on soluble sugar accumulation in P. japonicus. The data are expressed as the mean ± standard deviation (n = 5); Different lowercase letters for the same treatment time indicate significant differences (p < 0.05). (A) Soluble sugar content. (B) Reducing sugar content. (C) Sucrose content. (D) Starch content.
3.5 Effects of Elevated CO2 on Sucrose Metabolism-Related Enzyme Activities in P. japonicus
The activities of key sucrose metabolism enzymes are shown in Fig. 2. At the 36-day time point (Fig. 4A–E), eCO2 significantly affected several enzymes. The activities of SS-II (Fig. 4B) and SPS (Fig. 4E) were significantly enhanced by eCO2. In contrast, the activities of SS-I (Fig. 4A) and NI (Fig. 4C) were significantly reduced. The activity of SP (Fig. 4D) was not significantly altered. At the 92-day time point (Fig. 4A–E), the responses differed between CO2 levels. The e1CO2 treatment significantly decreased SS-I activity (by 19.35%) but significantly increased the activities of SS-II (by 4.72%), NI (by 50.82%), SP (by 22.20%), and SPS (by 72.99%) compared to aCO2. The e2CO2 treatment significantly elevated SPS activity by 11.78% relative to aCO2 but showed no significant effects on the activities of SS-I, SS-II, or SP.
3.6 Effects of Elevated CO2 on Total Saponin Content in P. japonicus
As shown in Fig. 5, after 36 days of treatment, elevated CO2 concentrations (e1CO2 and e2CO2) had no significant effect on total saponin content in the rhizomes of P. japonicus compared to the aCO2 control. After 92 days of treatment, both e1CO2 and e2CO2 treatments significantly increased total saponin content in the rhizomes, with e1CO2 and e2CO2 treatments showing 15.16% and 10.98% increases, respectively, compared to the aCO2 control. No significant difference in total saponin content was observed between the e1CO2 and e2CO2 treatments.
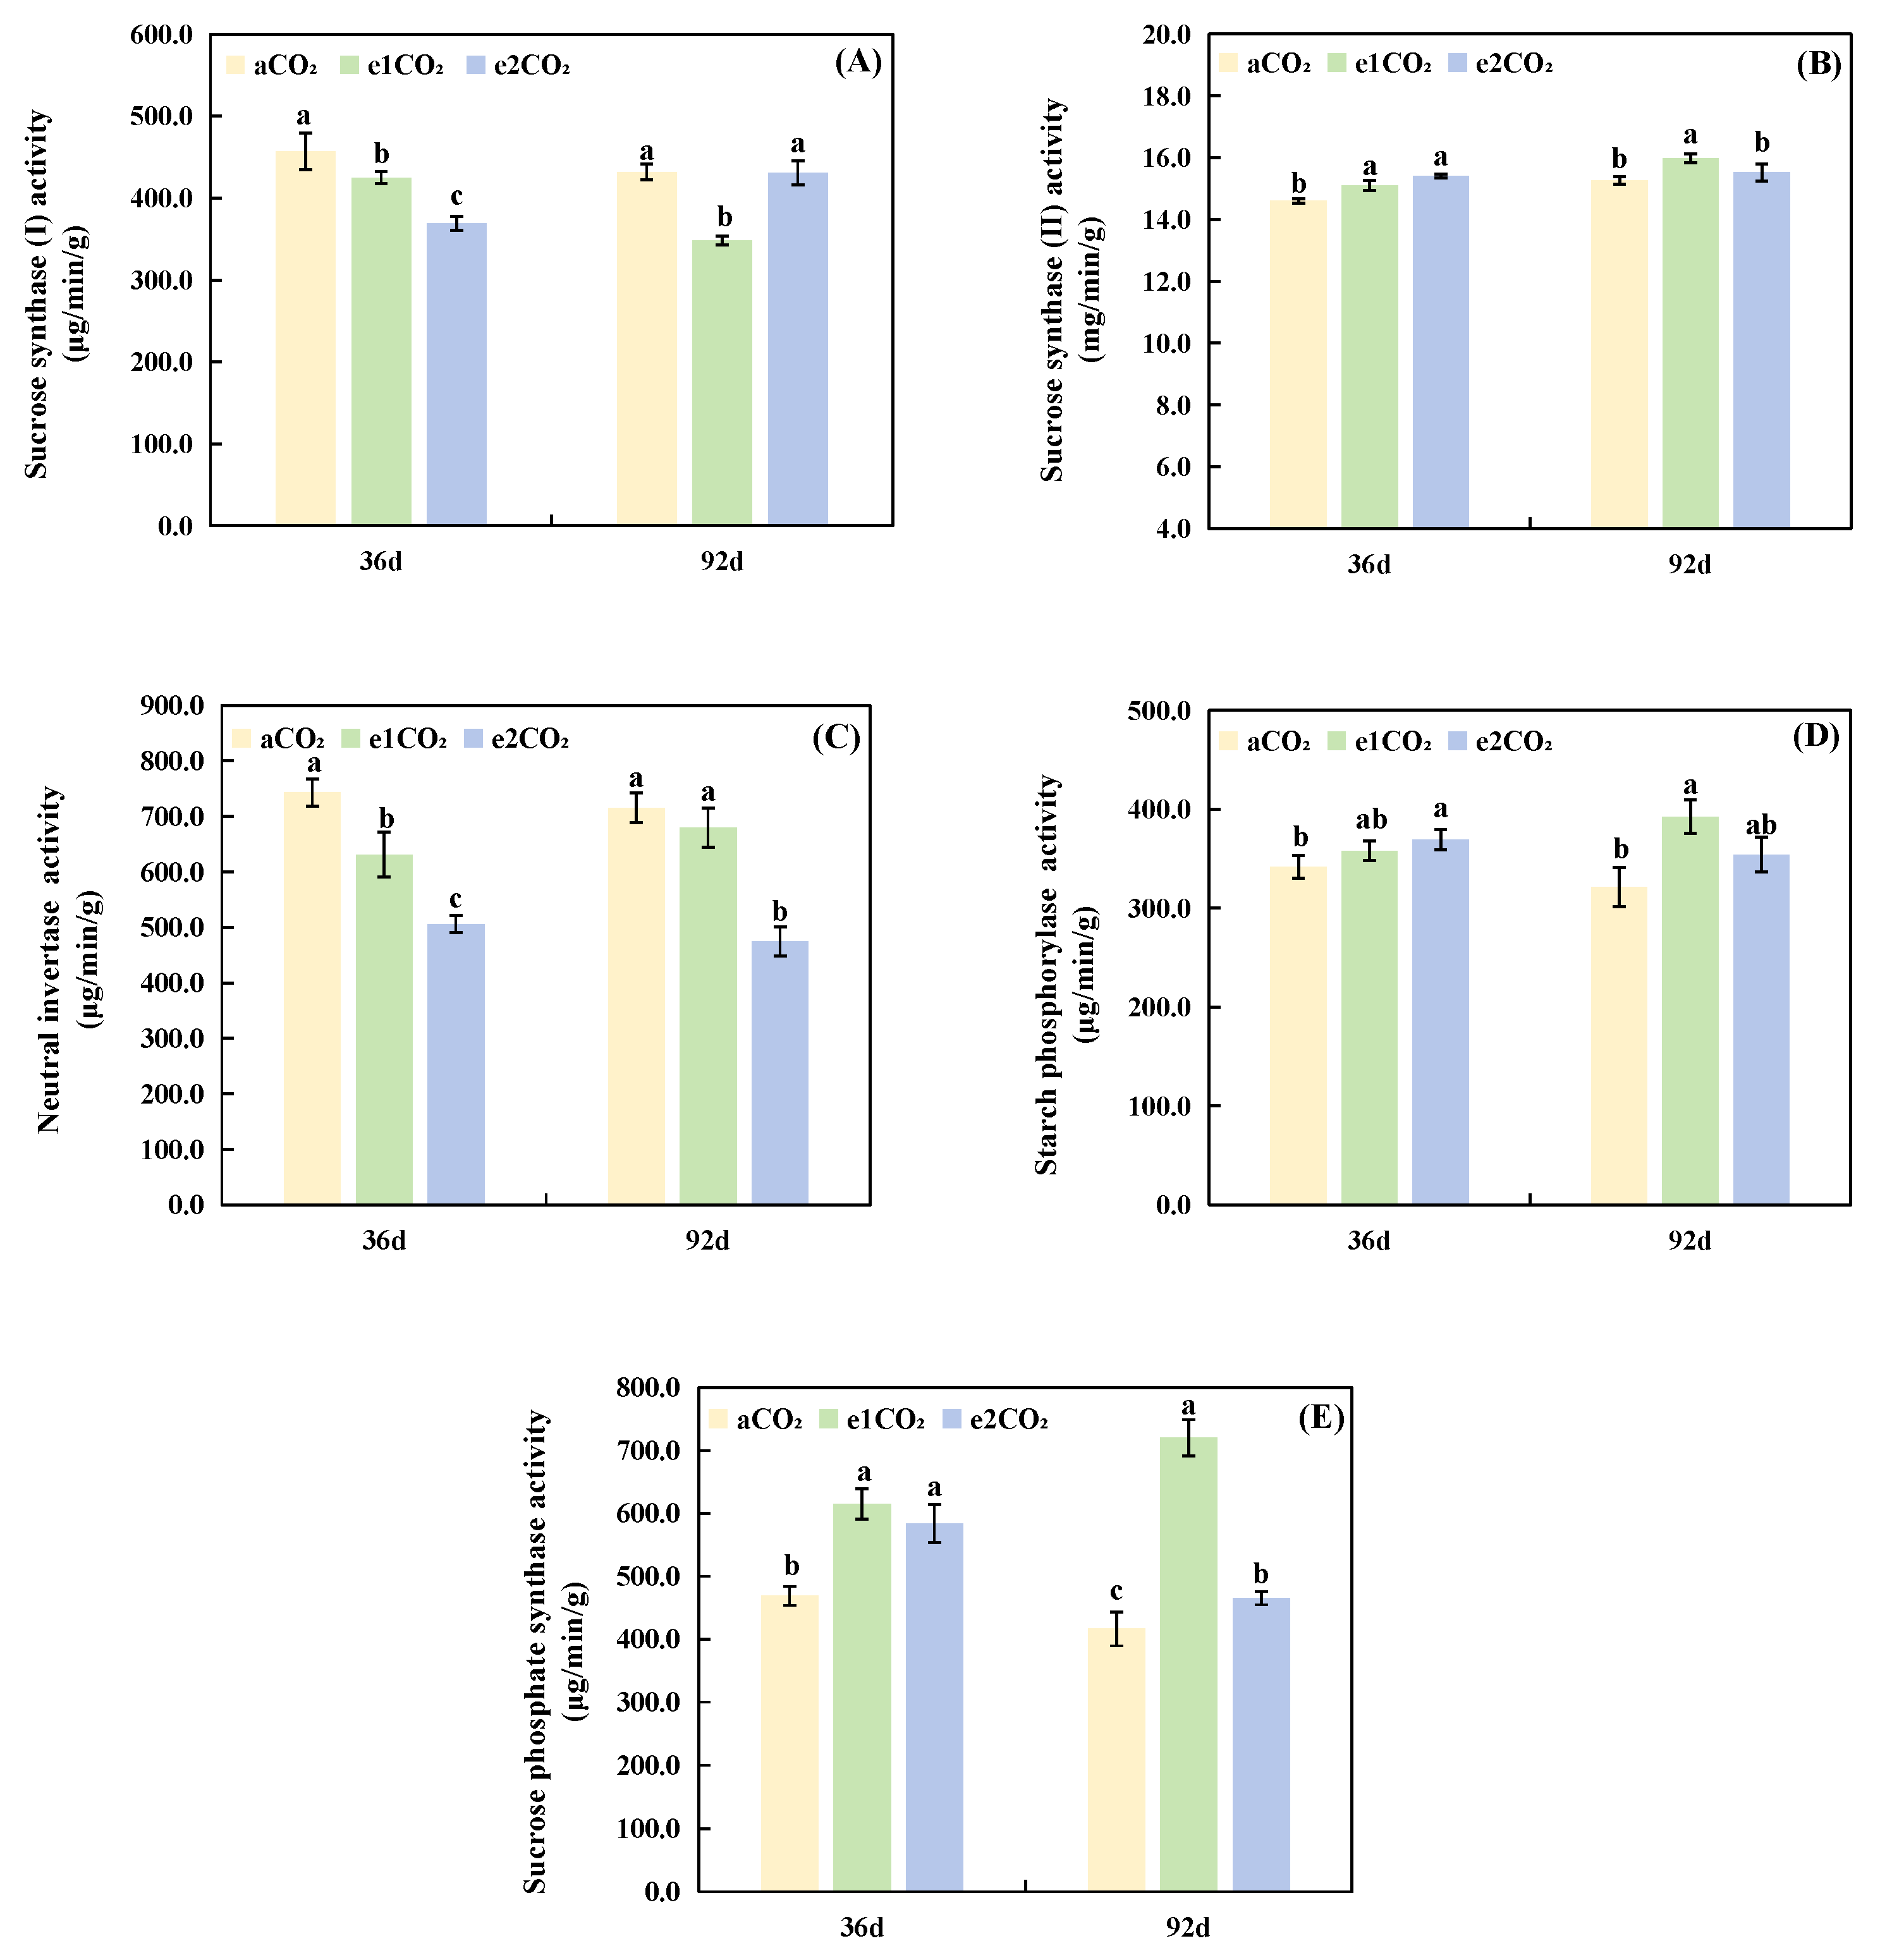
Figure 4: Effects of different treatments on the activities of enzymes related to sucrose metabolism in P. japonicus. The data are expressed as the mean ± standard deviation (n = 5); Different lowercase letters for the same treatment time indicate significant differences (p < 0.05). (A) Sucrose synthase (I) activity. (B) Sucrose synthase (II) activity. (C) Neutral invertase activity. (D) Starch phosphorylase activity. (E) Sucrose phosphate synthase activity.
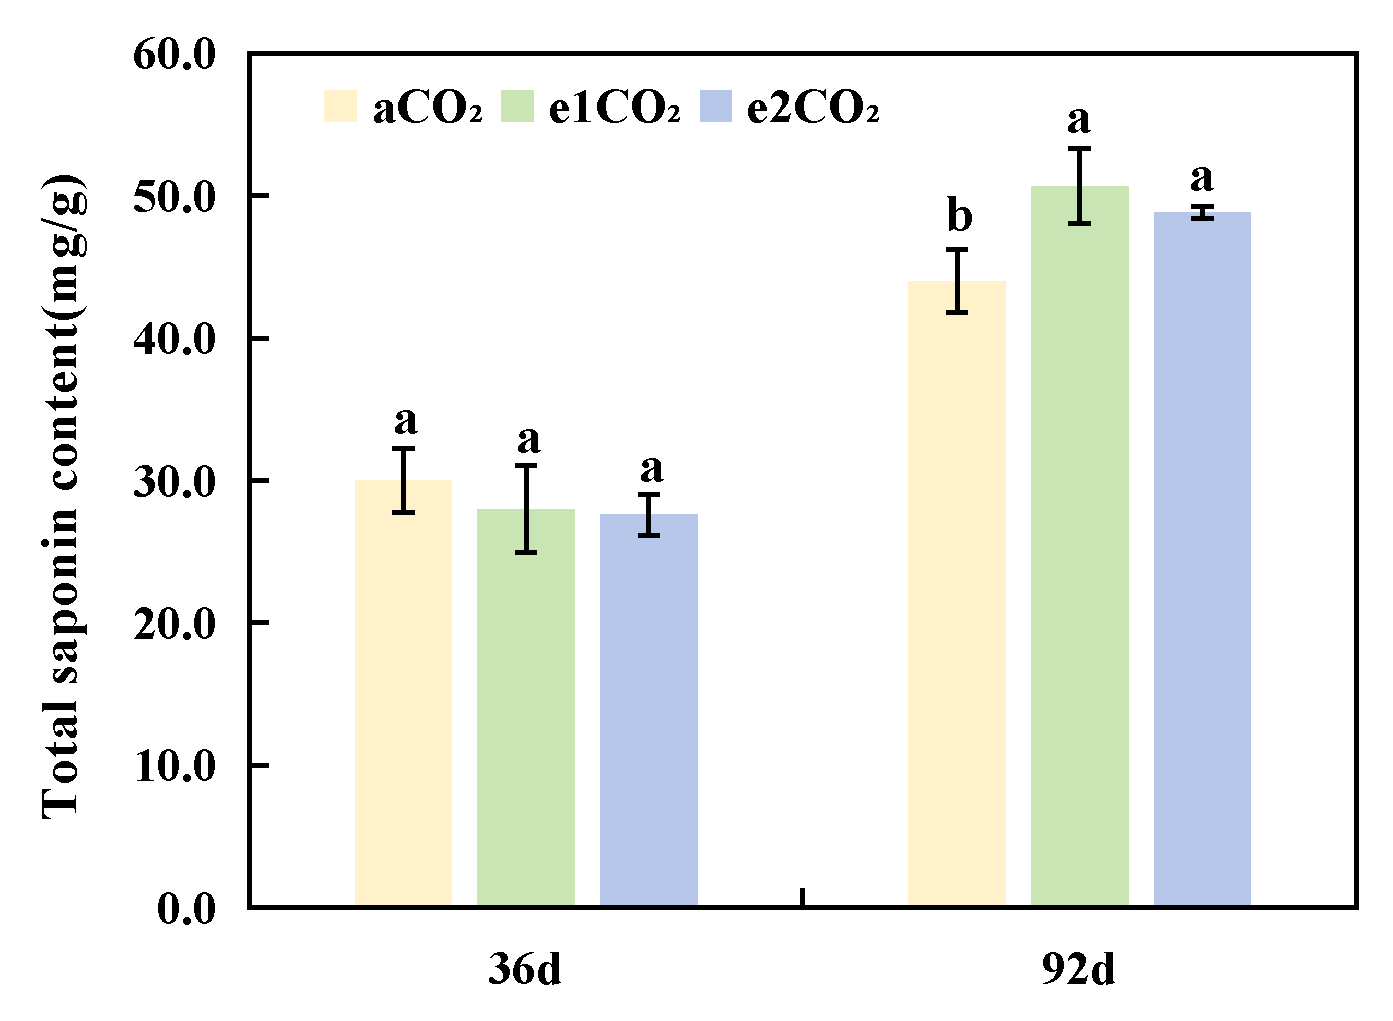
Figure 5: Effects of different treatments on total saponin content in P. japonicus. The data are expressed as the mean ± standard deviation (n = 5); Different lowercase letters for the same treatment time indicate significant differences (p < 0.05).
Correlation analysis between leaf sucrose metabolism indicators and rhizome total saponin content in P. japonicus revealed significant positive correlations between rhizome total saponin content and leaf soluble sugar content, sucrose content, starch content, and SS-II activity (Fig. 5). No significant correlations were observed between rhizome total saponin content and SS-I, NI, SP activity, or SPS activity (Fig. 6).
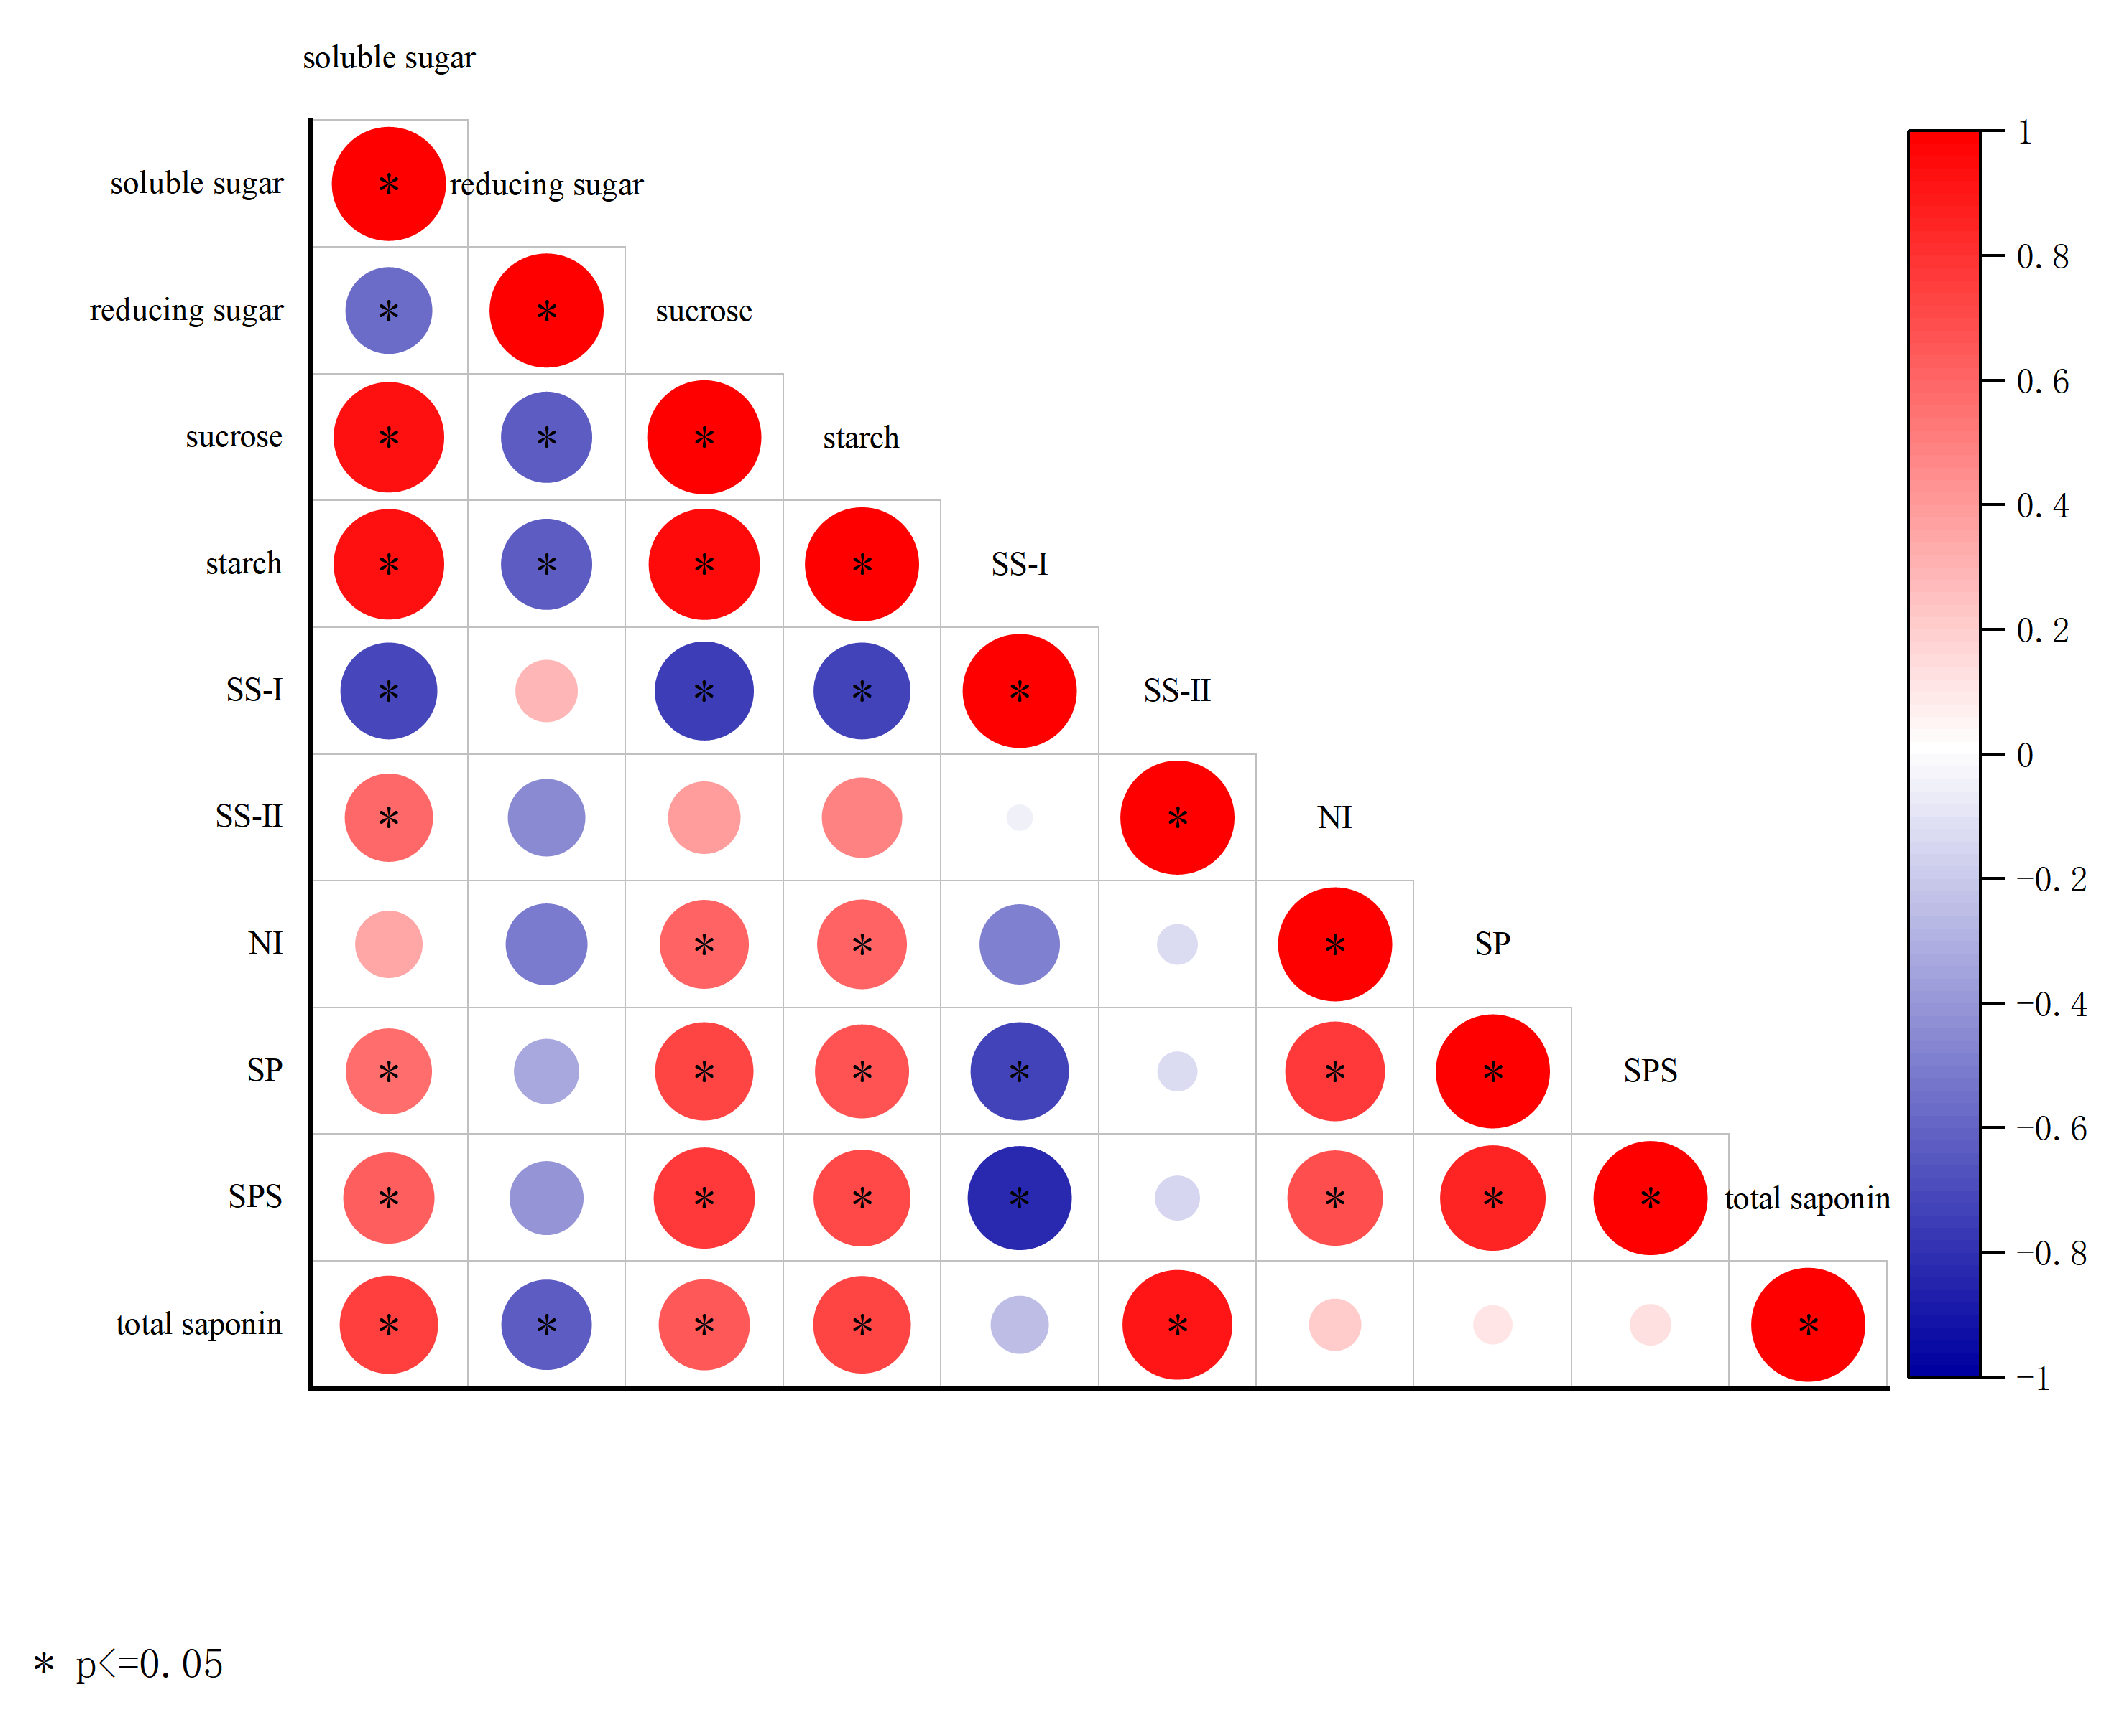
Figure 6: Correlation analysis. Color intensity represents correlation strength, with red indicating positive correlations and blue indicating negative correlations. *p ≤ 0.05.
The effect of eCO2 on plant photosynthetic characteristics depends not only on the concentration but also on the exposure duration, as CO2 serves as the primary substrate for photosynthesis [28]. While short-term eCO2 exposure often promotes growth, its effects can diminish over time due to feedback mechanisms such as carbohydrate accumulation and carbon-nitrogen imbalance [29]. In this study, short-term eCO2 significantly enhanced Pn and chlorophyll content in P. japonicus. However, as the treatment progressed, the two elevated CO2 levels (e1CO2, e2CO2) showed clearly divergent temporal patterns: the moderate elevation (e1CO2) sustained a measurable, though gradually dampened, photosynthetic stimulation, whereas the stimulatory effect of the high concentration (e2CO2) on Pn and chlorophyll content was transient, becoming statistically indistinguishable from aCO2 in the later growth stage (Table 1 and Table 2). This difference indicates that the magnitude of CO2 elevation is a critical factor in determining how rapidly photosynthetic down-regulation occurs. The more rapid and pronounced accumulation of carbohydrates under e2CO2 likely triggered stronger and earlier feedback inhibition, potentially via sugar-signaling pathways and/or an accelerated progression into sink limitation or nitrogen dilution [29,30]. Consequently, although both eCO2 treatments increased final biomass relative to aCO2, the weaker biomass gain under e2CO2 compared with e1CO2 at 92 days corresponds with its earlier and more complete loss of photosynthetic advantage. These findings align with reports in crops such as soybean [31] and the medicinal plant Polygonatum kingianum [4], and underscore the well-documented interaction between CO2 concentration and exposure time in plant responses to eCO2 [32,33]. Together, they demonstrate that the effects of eCO2 are dynamic rather than static, and that predicting CO2-driven growth and metabolic responses requires considering both concentration and duration as interacting variables, with particular attention to the transient nature of the photosynthetic stimulation under high-level, long-term eCO2.
Our results demonstrate a clear temporal dissociation between the initial stimulation of carbon metabolism and the eventual accumulation of saponins in P. japonicus under eCO2, a phenomenon consistent with known plant resource allocation strategies [30]. At 36 days, both e1CO2 and e2CO2 treatments significantly enhanced the net photosynthetic rate (by 17.22% and 37.78%, respectively; Table 1), soluble sugar content (by 15.57% and 35.38%; Fig. 3A), and the activities of key sucrose-metabolizing enzymes, including SS-II and SPS, compared to aCO2 (Fig. 4B,E). This initial boost in photosynthesis and carbohydrate metabolism is a typical plant response to eCO2 [32]. Despite this pronounced upregulation in photosynthetic capacity and carbohydrate availability, the total saponin content in the rhizomes remained unchanged at this early stage (Fig. 5). This suggests a prioritization of photoassimilates towards primary metabolic processes and structural growth [34], reflecting source-sink dynamics where carbon is preferentially allocated to biomass accumulation during the initial vegetative growth phase, thereby delaying significant investment into secondary metabolite biosynthesis. By 92 days, the physiological responses diverged. The e1CO2 treatment sustained its promotional effects, resulting in a 15.16% increase in total saponin content over aCO2 (Fig. 5). In contrast, while the e2CO2 treatment also increased saponin content relative to aCO2, its level was significantly lower than that under e1CO2 (Fig. 5). The eventual saponin accumulation under e1CO2 can be attributed to a sustained surplus of carbon fixation over the longer term, which, after meeting the demands of primary growth, provided ample substrates for secondary metabolism [35]. The correlation analysis provides a mechanistic clue: saponin content exhibited a significant positive correlation with SS-II activity (Fig. 6) but not with SPS activity. This indicates that the SS-catalyzed reaction, which produces UDPG–a direct glycosyl donor for glycosyltransferases [18]—may play a more critical role in directing carbon toward saponin accumulation than does SPS, a pattern observed in other saponin-producing species. We acknowledge that the absence of leaf nitrogen data limits a definitive mechanistic understanding of the attenuated response under prolonged e2CO2, which we hypothesize may involve a carbon-nitrogen imbalance, a common constraint under high CO2 conditions [36]. Furthermore, while total triterpenoid saponins are a key quality metric [10], the lack of individual ginsenoside profiling means shifts in the composition of specific bioactive compounds remain unexplored.
The differential outcomes at 92 days highlight the critical role of above-ground physiology—modulated by CO2 concentration—in determining the medicinal quality of below-ground organs [3]. The superior saponin accumulation under e1CO2 aligns with the sustained upregulation of photosynthetic parameters and sucrose metabolism enzymes observed throughout the experiment. The finding that rhizome saponin content was significantly associated with leaf sucrose content, leaf starch content, and SS-II activity (Fig. 6) strongly supports a model where eCO2-enhanced carbon assimilation in leaves fuels the production and translocation of sucrose to underground sinks [19,37]. The positive association with SS activity is consistent with the established pathway where sucrose cleavage by SS provides UDPG for the glycosylation of triterpenoid aglycones, a critical final step in saponin biosynthesis [18,35]. Therefore, the increased saponin yield under e1CO2 can be interpreted as a direct consequence of a prolonged and balanced enhancement of the source (leaf photosynthesis and sucrose synthesis) and sink (rhizome) strength, facilitating the channeling of carbon precursors into the saponin biosynthetic pathway [38] (Fig. 7). In contrast, the weaker promotion of photosynthesis and sucrose metabolism by e2CO2 at 92 days, suggests a potential constraint, possibly at the metabolic or nutrient level. The observed pattern is consistent with the hypothesis of a developing imbalance in carbon and nitrogen metabolism under long-term, highly elevated CO2, which can lead to photosynthetic acclimation and disrupt optimal resource allocation to secondary metabolites [36,39]. This interpretation is cautious, as it is based on physiological responses without direct nitrogen data. Similar context-dependent effects of eCO2 duration and concentration on secondary metabolism have been reported in other medicinal plants, underscoring the complexity of these interactions [40]. Collectively, our findings demonstrate that the effect of eCO2 on saponin accumulation is not linear but depends critically on both the concentration and of exposure duration, mediated through its integrated effects on source activity and carbon partitioning.
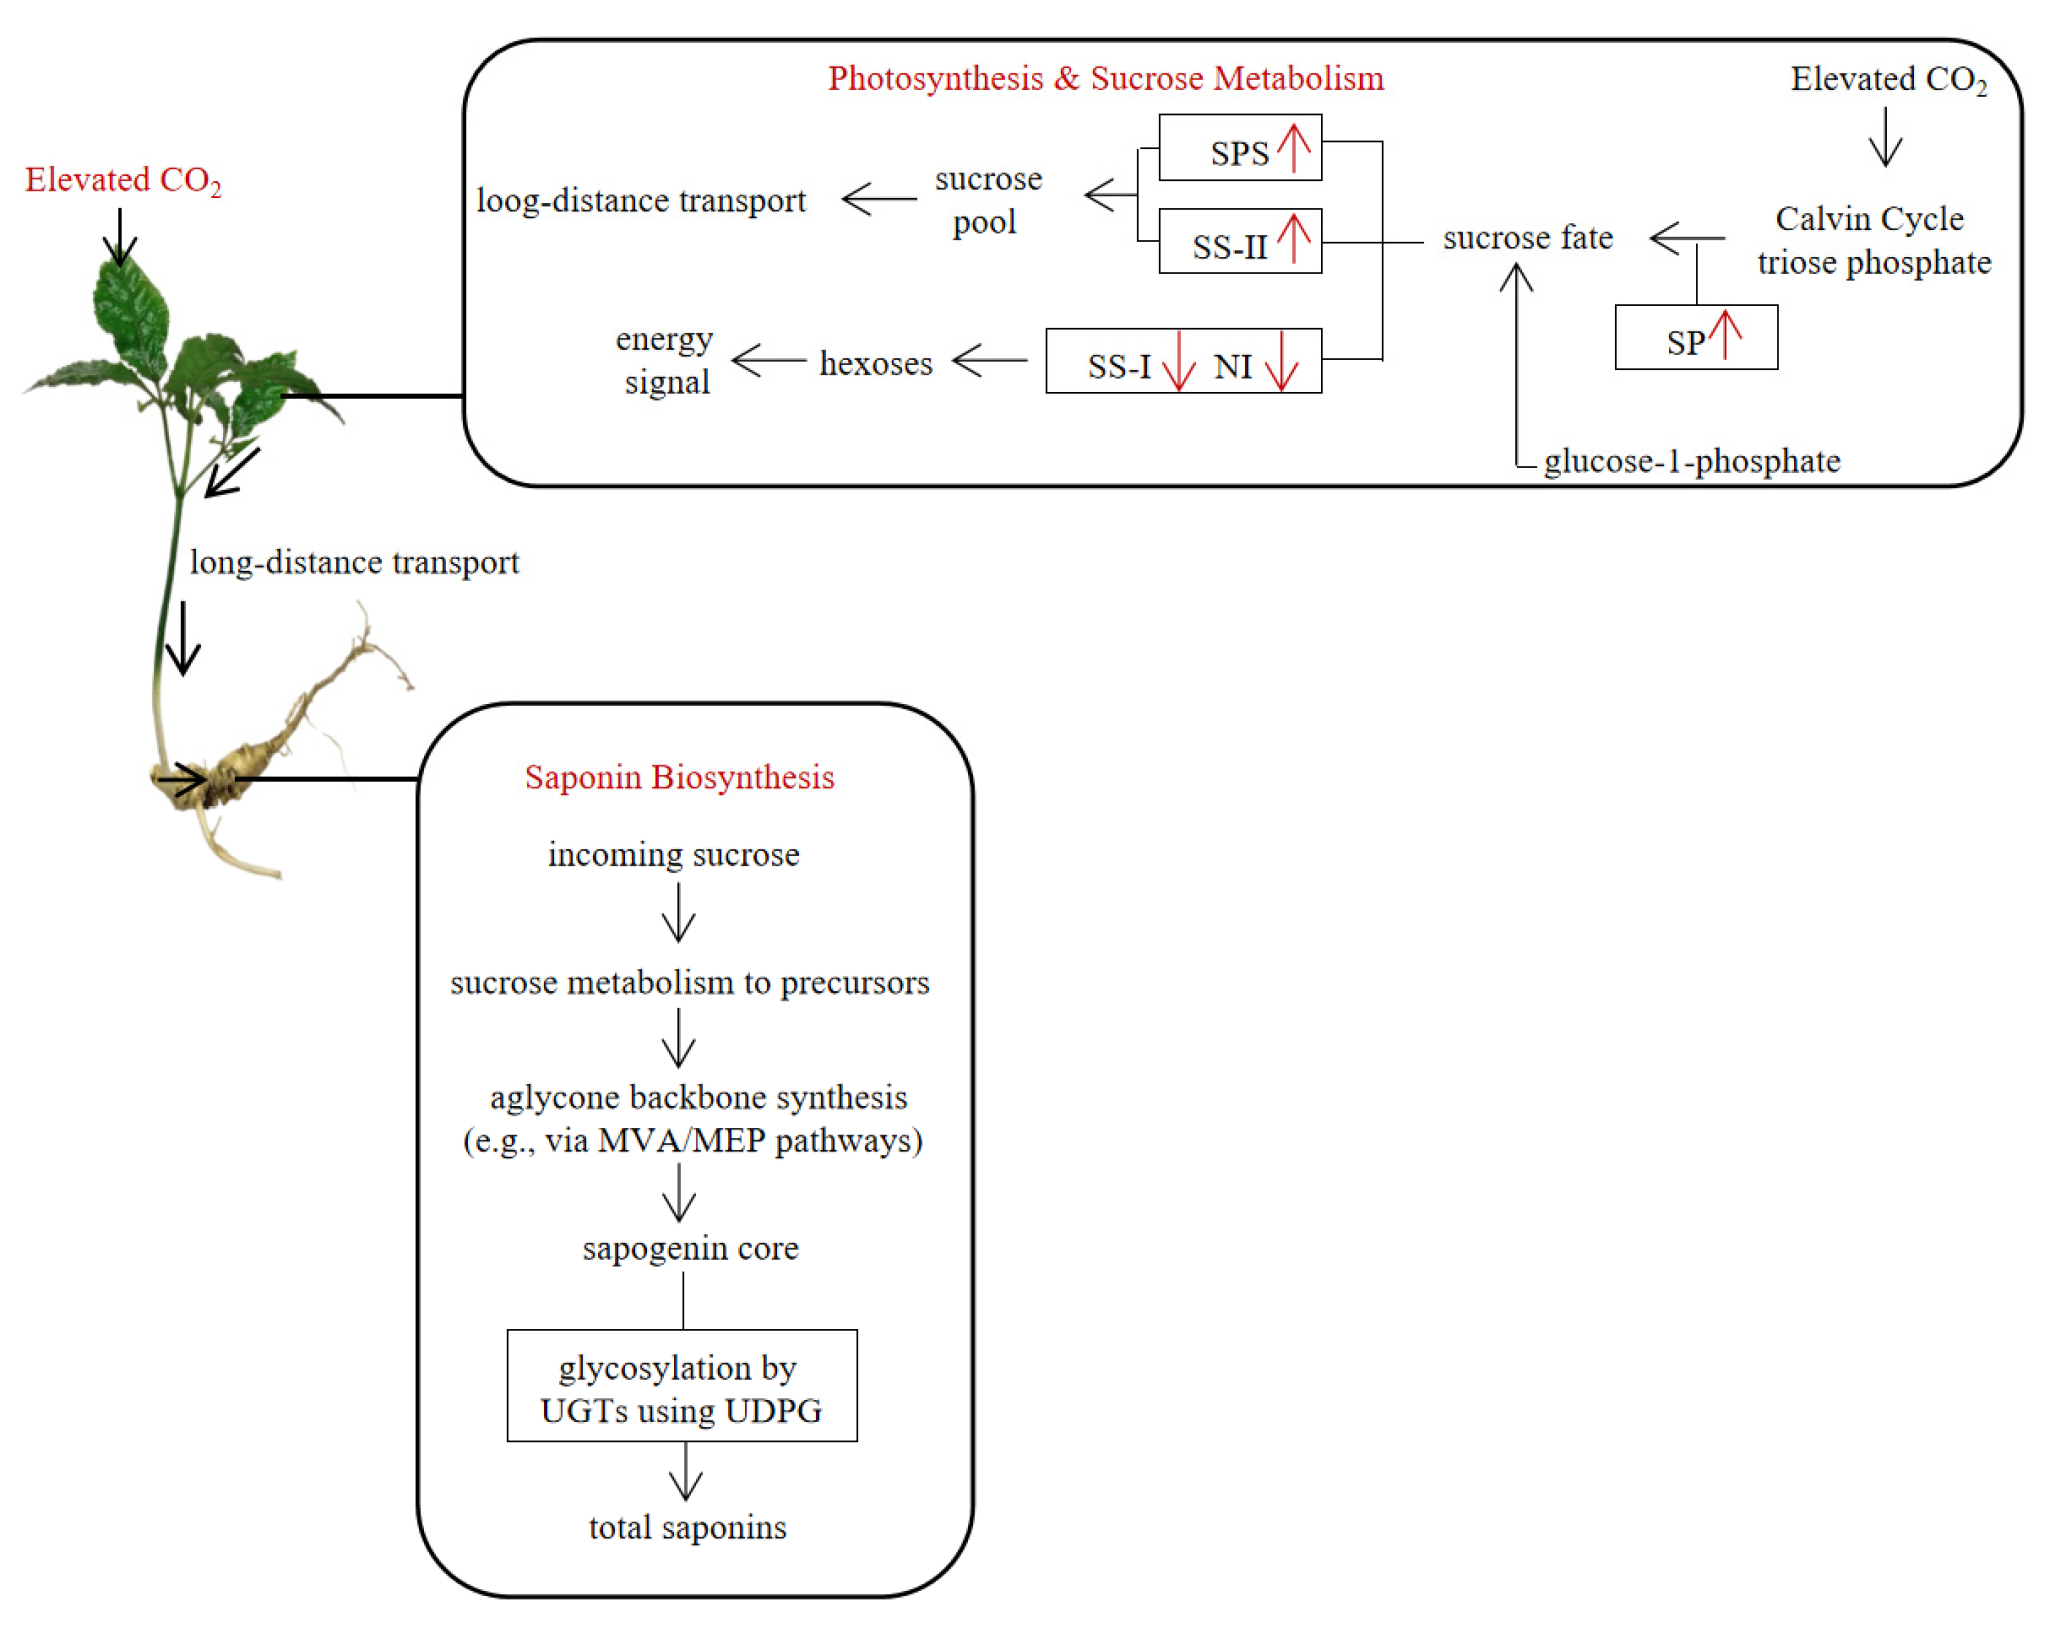
Figure 7: The interrelationship among leaf photosynthesis, sugar metabolism, and rhizome saponin biosynthesis in P. japonicus. An upward-pointing red arrow (↑) indicates an increase in the activity of the corresponding enzyme, a downward-pointing red arrow (↓) indicates a decrease in the activity of the corresponding enzyme.
In summary, a moderate elevation of CO2 significantly enhanced the total saponin content in P. japonicus rhizomes by sustainably improving the net photosynthetic rate and upregulating key sugar-metabolizing enzyme activities, thereby facilitating carbon assimilation and translocation to sink organs. However, a higher CO2 concentration led to diminished promotional effects over time, likely due to feedback inhibition from excessive carbohydrate accumulation. These findings suggest the potential of CO2 management as an agronomic strategy for quality improvement of this medicinal plant under future climate scenarios; from an agronomic perspective, they imply that cultivating P. japonicus under controlled or moderately eCO2 levels could be employed to optimize saponin yield and consistency, provided that excessive carbohydrate buildup is avoided through appropriate canopy management, balanced fertilization (especially N input to match altered C:N ratios), and timely harvesting before feedback inhibition reduces efficacy. Meanwhile, irrigation scheduling may be refined to exploit the increased water-use efficiency associated with eCO2, further supporting stable growth and secondary metabolite production. This highlighting the need for future studies to focus on elucidating the associated molecular mechanisms—particularly the expression of genes involved in sucrose-to-saponin biosynthesis—and to evaluate the response of individual saponin components for a comprehensive quality assessment, and on validating these cultivation strategies under multi-factor field conditions to ensure their practical applicability in future climates.
Acknowledgement:
Funding Statement: This research was funded by the Guizhou Province Technology Plan Project, Qiankehe Basic-ZK [2023] General 023, Key 002 and Guizhou Province Project for the Growth of Young Scientific and Technological Talents in General Higher Education Institutions, QianJiao He Foundation, Grant No. (2022)029.
Author Contributions: Study conception and design: Xiao Wang; data collection: Deyan Li; analysis and interpretation of results: E Liang, Xiaohui Song; draft manuscript preparation: Xiao Wang. All authors reviewed and approved the final version of the manuscript.
Availability of Data and Materials: The authors confirm that the data supporting the findings of this study are available within the article.
Ethics Approval: Not applicable.
Conflicts of Interest: The authors declare no conflicts of interest.
References
1. World Meteorological Organization (WMO) . The State of Greenhouse Gases in the Atmosphere Based on Global Observations through 2022 [Internet]. 2023 [cited 2025 Nov 1]. Available from: https://wmo.int/publication-series/wmo-greenhouse-gas-bulletin-no-19. [Google Scholar]
2. Kimball BA . Crop responses to elevated CO2 and interactions with H2O, N, and temperature. Curr Opin Plant Biol. 2016; 31: 36– 43. doi:10.1016/j.pbi.2016.03.006. [Google Scholar] [CrossRef]
3. Gamage D , Thompson M , Sutherland M , Hirotsu N , Makino A , Seneweera S . New insights into the cellular mechanisms of plant growth at elevated atmospheric carbon dioxide concentrations. Plant Cell Environ. 2018; 41( 6): 1233– 46. doi:10.1111/pce.13206. [Google Scholar] [CrossRef]
4. Zhao M , Jia H , Zhao J , Wang Y , Laraib I , Shi X , et al. Response of cultivation suitability for Polygonatum kingianum to climate change in China. Environ Earth Sci. 2025; 84( 11): 285. doi:10.1007/s12665-025-12304-2 [Google Scholar] [CrossRef]
5. Yang HM , Li LP , Sun M , Chen HY , Li LY , Feng CH . Response of leaf hydraulic traits of Typha orientalis to simulated warming and elevated CO2 concentration. Bull Bot Res. 2023; 43( 5): 729– 40. [Google Scholar]
6. Liang Z , Luo Z , Li W , Yang M , Wang L , Lin X , et al. Elevated CO2 enhanced the antioxidant activity and downregulated cell wall metabolism of wolfberry (Lycium barbarum L.). Antioxidants. 2021; 11( 1): 16. doi:10.3390/antiox11010016. [Google Scholar] [CrossRef]
7. He M , Zhang J , Wang Z , Li J , Ye G , Ye Q . Effects of doubling the CO2 concentration on photosynthetic characteristics and growth of Dendrobium officinale. Guangdong Agric Sci. 2020; 47( 2): 17– 23. doi:10.16768/j.issn.1004-874X.2020.02.003. [Google Scholar] [CrossRef]
8. Al Jaouni S , Saleh AM , Wadaan MA , Hozzein WN , Selim S , AbdElgawad H . Elevated CO2 induces a global metabolic change in basil (Ocimum basilicum L.) and peppermint (Mentha piperita L.) and improves their biological activity. J Plant Physiol. 2018; 224: 121– 31. doi:10.1016/j.jplph.2018.03.016 [Google Scholar] [CrossRef]
9. Qiang Q , Gao Y , Yu B , Wang M , Ni W , Li S , et al. Elevated CO2 enhances growth and differentially affects saponin content in Paris polyphylla var. yunnanensis. Ind Crop Prod. 2020; 147: 112– 24. doi:10.1016/j.indcrop.2020.112124 [Google Scholar] [CrossRef]
10. Chen Y , Liu M , Wen J , Yang Z , Li G , Cao Y , et al. Panax japonicus CA Meyer: a comprehensive review on botany, phytochemistry, pharmacology, pharmacokinetics and authentication. Chin Med. 2023; 18( 1): 148. doi:10.1186/s13020-023-00857-y [Google Scholar] [CrossRef]
11. Chan HH , Sun HD , Reddy MVB , Wu TS . Potent α-glucosidase inhibitors from the roots of Panax japonicus CA Meyer var. major. Phytochemistry. 2010; 71( 11–12): 1360– 64. doi:10.1016/j.phytochem.2010.04.013 [Google Scholar] [CrossRef]
12. Wang XJ , Xie Q , Liu Y , Jiang S , Li W , Li B , et al. Panax japonicus and chikusetsusaponins: a review of diverse biological activities and pharmacology mechanism. Chin Herb Med. 2020; 13( 1): 64– 77. doi:10.1016/j.chmed.2020.12.003. [Google Scholar] [CrossRef]
13. Du Z , Li J , Zhang X , Pei J , Huang L . An integrated LC-MS-based strategy for the quality assessment and discrimination of three Panax species. Molecules. 2018; 23( 11): 2988. doi:10.3390/molecules23112988 [Google Scholar] [CrossRef]
14. Rai A , Yamazaki M , Takahashi H , Nakamura M , Kojoma M , Suzuki H , et al. RNA-seq transcriptome analysis of Panax japonicus, and its comparison with other Panax species to identify potential genes involved in the saponins biosynthesis. Front Plant Sci. 2016; 7: 481. doi:10.3389/fpls.2016.00481. [Google Scholar] [CrossRef]
15. Yao L , Lu J , Wang J , Gao WY . Advances in biosynthesis of triterpenoid saponins in medicinal plants. Chin J Nat Med. 2020; 18( 6): 417– 24. doi:10.1016/S1875-5364(20)30049-2. [Google Scholar] [CrossRef]
16. Börnke F , Sonnewald S . Biosynthesis and metabolism of starch and sugars. In: Plant metabolism biotechnol. Hoboken, NJ, USA: John Wiley & Sons, Inc.; 2011. p. 1– 25. doi:10.1002/9781119991311.ch1. [Google Scholar] [CrossRef]
17. Wittich PE , Willemse MTM . Sucrose utilization during ovule and seed development of Gasteria verrucosa (Mill.) H. Duval as monitored by sucrose synthase and invertase localization. Protoplasma. 1999; 208( 1): 136– 48. doi:10.1007/BF01279084. [Google Scholar] [CrossRef]
18. Zhao J , Wang R , Zhao S , Wang Z . Advance in glycosyltransferases, the important bioparts for production of diversified ginsenosides. Chin J Nat Med. 2020; 18( 9): 643– 58. doi:10.1016/S1875-5364(20)60003-6. [Google Scholar] [CrossRef]
19. Hou M , Wang R , Zhao S , Wang Z . Ginsenosides in Panax genus and their biosynthesis. Acta Pharm Sin B. 2021; 11( 7): 1813– 34. doi:10.1016/j.apsb.2020.12.017. [Google Scholar] [CrossRef]
20. Jang IB , Lee DY , Yu J , Park HW , Mo HS , Park KC , et al. Photosynthesis rates, growth, and ginsenoside contents of 2-yr-old Panax ginseng grown at different light transmission rates in a greenhouse. J Ginseng Res. 2015; 39( 4): 345– 53. doi:10.1016/j.jgr.2015.03.007. [Google Scholar] [CrossRef]
21. Hao L , Liu Y , Dong G , Liu J , Qiu K , Li X , et al. Multi-strategy ugt mining, modification and glycosyl donor synthesis facilitate the production of triterpenoid saponins. Front Plant Sci. 2025; 16: 1586295. doi:10.3389/fpls.2025.1586295. [Google Scholar] [CrossRef]
22. Zhang H , Li G , Zhao C , Zhao P , Jiang M , Wen G , et al. Characterizations of “drumstick-forming” on saponin contents of Notoginseng Radix et Rhizoma and their saccharide metabolism basis of vegetative organs of Panax notoginseng. Ind Crops Prod. 2022; 180: 114699. doi:10.1016/j.indcrop.2022.114699. [Google Scholar] [CrossRef]
23. Qaderi MM , Martel AB , Strugnell CA . Environmental factors regulate plant secondary metabolites. Plants. 2023; 12( 3): 447. doi:10.3390/plants12030447 [Google Scholar] [CrossRef]
24. Zhou J , Xu Z , Yu Z , Mai H , Huang J , Chang X , et al. Growth, development and reproduction of meadow moth Loxostege sticticalis fed on pea seedlings grown under elevated CO2. Agronomy. 2024; 15( 1): 30. doi:10.3390/agronomy15010030 [Google Scholar] [CrossRef]
25. IPCC. Climate Change 2021: the physical science basis. In: Contribution of working group I to the sixth assessment report of the intergovernmental panel on climate change. Cambridge, UK: Cambridge University Press; 2021. p. 1– 13. doi:10.1017/9781009157896. [Google Scholar] [CrossRef]
26. Maness N . Extraction and analysis of soluble carbohydrates. Methods Mol Biol. 2010; 639: 341– 70. doi:10.1007/978-1-60761-702-0_22. [Google Scholar] [CrossRef]
27. Mursaliyeva VK , Sarsenbek BT , Dzhakibaeva GT , Mukhanov TM , Mammadov R . Total content of saponins, phenols and flavonoids and antioxidant and antimicrobial activity of in vitro culture of Allochrusa gypsophiloides (Regel) Schischk compared to wild plants. Plants. 2023; 12( 20): 3521. doi:10.3390/plants12203521 [Google Scholar] [CrossRef]
28. Woodward FI . Potential impacts of global elevated CO2 concentrations on plants. Curr Opin Plant Biol. 2002; 5( 3): 207– 11. doi:10.1016/S1369-5266(02)00253-4. [Google Scholar] [CrossRef]
29. Moore BD , Cheng SH , Sims D , Seemann JR . The biochemical and molecular basis for photosynthetic acclimation to elevated atmospheric CO2. Plant Cell Environ. 1999; 22( 6): 567– 82. doi:10.1046/j.1365-3040.1999.00432.x. [Google Scholar] [CrossRef]
30. Su YX , Zhao P , Jia LJ , Cao YF , Liu GZ , Chen JW , et al. Deep application of controlled-release urea increases the yield and saponin content of Panax notoginseng by regulating soil nitrate distribution. Front Plant Sci. 2025; 15: 1505702. doi:10.3389/fpls.2024.1505702. [Google Scholar] [CrossRef]
31. Kaur R , Durstock M , Prior SA , Runion GB , Ainsworth EA , Baxter I , et al. Investigating the impact of elevated CO2 on biomass accumulation and mineral concentration in foliar and edible tissues in soybeans. Plant Cell Environ. 2025; 48( 12): 8712– 26. doi:10.1111/pce.70141. [Google Scholar] [CrossRef]
32. Ainsworth EA , Long SP . 30 years of free-air carbon dioxide enrichment (FACE): what have we learned about future crop productivity and its potential for adaptation? Glob Chang Biol. 2021; 27( 1): 27– 49. doi:10.1111/gcb.15375. [Google Scholar] [CrossRef]
33. Poorter H , Knopf O , Wright IJ , Temme AA , Hogewoning SW , Graf A , et al. A meta-analysis of responses of C3 plants to atmospheric CO2: dose-response curves for 85 traits ranging from the molecular to the whole-plant level. New Phytol. 2022; 233( 4): 1560– 96. doi:10.1111/nph.17802. [Google Scholar] [CrossRef]
34. Darko E , Heydarizadeh P , Schoefs B , Sabzalian MR . Photosynthesis under artificial light: the shift in primary and secondary metabolism. Philos Trans R Soc Lond B Biol Sci. 2014; 369( 1640): 20130243. doi:10.1098/rstb.2013.0243. [Google Scholar] [CrossRef]
35. Zhang HL . Study on mechanism of high saponin contents of Notoginseng Radix et Rhizoma characterized by “Drumstick-forming” [ dissertation]. Kunming, China: Yunnan University; 2022. doi:10.27458/d.cnki.gynyu.2022.000269. [Google Scholar] [CrossRef]
36. Ainsworth EA , Long SP . What have we learned from 15 years of free-air CO2 enrichment (FACE)? A meta-analytic review of the responses of photosynthesis, canopy properties and plant production to rising CO2. New Phytol. 2005; 165( 2): 351– 71. doi:10.1111/j.1469-8137.2004.01224.x. [Google Scholar] [CrossRef]
37. Jiang N , Jin LF , Teixeira da Silva JA , Islam MZ , Gao HW , Liu YZ , et al. Activities of enzymes directly related with sucrose and citric acid metabolism in Citrus fruit in response to soil plastic film mulch. Sci Hortic. 2014; 168: 73– 80. doi:10.1016/j.scienta.2014.01.021. [Google Scholar] [CrossRef]
38. Ghasemzadeh A , Jaafar HZE . Effect of CO2 enrichment on synthesis of some primary and secondary metabolites in ginger (Zingiber officinale Roscoe). Int J Mol Sci. 2011; 12( 2): 1101– 14. doi:10.3390/ijms12021101. [Google Scholar] [CrossRef]
39. Hamilton JG , Zangerl AR , DeLucia EH , Berenbaum MR . The carbon–nutrient balance hypothesis: its rise and fall. Ecol Lett. 2001; 4( 1): 86– 95. doi:10.1046/j.1461-0248.2001.00192.x. [Google Scholar] [CrossRef]
40. Idso S , Kimball B . Effects of long-term atmospheric CO2 enrichment on the growth and fruit production of sour orange trees. Glob Change Biol. 1997; 3( 2): 89– 96. doi:10.1046/j.1365-2486.1997.00053.x. [Google Scholar] [CrossRef]
Cite This Article
 Copyright © 2026 The Author(s). Published by Tech Science Press.
This work is licensed under a Creative Commons Attribution 4.0 International License , which permits unrestricted use, distribution, and reproduction in any medium, provided the original work is properly cited.
 Downloads
 Citation Tools