
 Login
Login Register
 Submit a Paper
 Propose a Special lssue
 Open Access
ARTICLE
Combined Effects of Plant Biostimulant Strategies on Lettuce Performance under Salinity Stress
1 Department of Plant Protection, Faculty of Agriculture, Adıyaman University, Adıyaman, Türkiye
2 Department of Plant and Animal Production, Adıyaman University Kahta Vocational School, Kahta, Adıyaman, Türkiye
* Corresponding Author: Hasret Güneş. Email:
Phyton-International Journal of Experimental Botany 2026, 95(9), 20 https://doi.org/10.32604/phyton.2026.089702
Received 23 July 2026; Accepted 09 September 2026; Issue published 24 September 2026
 View Full Text
 Download PDF
Abstract
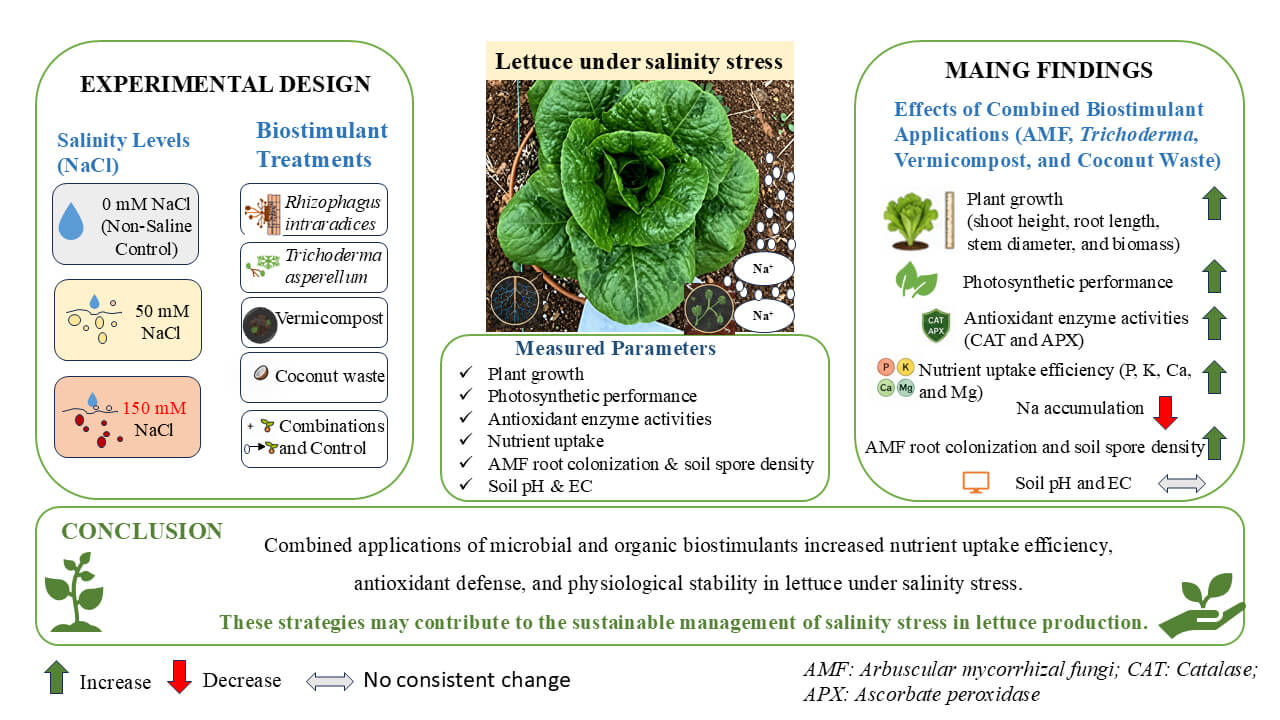
Soil salinity, intensified by climate change, is a major abiotic constraint limiting crop productivity, and the development of sustainable management strategies is therefore essential for resilient agroecosystems. Plant biostimulants, including arbuscular mycorrhizal fungi (AMFs), Trichoderma spp., and organic amendments, are recognized as sustainable tools for enhancing plant tolerance to salinity through physiological and biochemical regulation. This study investigated the responses of lettuce (Lactuca sativa L.) cv. ‘Cospirina’ grown under a non-saline control condition and two salinity levels (50 and 150 mM NaCl) to applications of Rhizophagus intraradices, Trichoderma asperellum, vermicompost, and coconut waste, applied individually and in combination. Plant growth attributes (shoot height, root length, stem diameter, fresh and dry biomass), photosynthetic performance, antioxidant enzyme activities (catalase and ascorbate peroxidase), macro element concentrations (P, K, Na, Ca, and Mg), AMF root colonization, soil spore density, soil pH, and electrical conductivity (EC) were assessed. Compared with salt-stressed plants receiving no biostimulant application, integrated applications of AMFs, Trichoderma, and vermicompost significantly enhanced lettuce performance under salinity stress, resulting in 27–36% increases in shoot length, up to 63–110% increases in fresh and dry biomass, and up to 35–156% increases in antioxidant enzyme (catalase and ascorbate peroxidase) activities. Mycorrhizal inoculation markedly improved root colonization and soil spore density, while combined biostimulant treatments exhibited clear combined effects by improving nutrient uptake efficiency and maintaining physiological stability under saline conditions. These findings indicate that integrated microbial–organic biostimulant strategies represent a promising, sustainable approach for mitigating salinity stress in lettuce.Graphic Abstract
Keywords
Lettuce (Lactuca sativa L.) is one of the most widely consumed leafy vegetables worldwide and represents an important source of dietary fiber, vitamins, minerals, and antioxidant compounds that contribute to human nutrition [1]. Originating from regions encompassing Anatolia, the Caucasus, and Iran–Turkestan [2], lettuce is cultivated as a cool-season crop under both open-field and controlled production systems, including greenhouses and hydroponic systems. Its productivity and quality are strongly influenced by environmental factors such as nutrient availability, irrigation practices, light conditions, and particularly salinity stress [3,4].
Türkiye is among the leading lettuce-producing countries, where lettuce cultivation constitutes an economically significant horticultural activity. However, the expansion of cultivation areas has been accompanied by an increased exposure to abiotic stress factors, among which soil salinity represents a major constraint limiting yield and quality [5]. Lettuce is classified as a salt-sensitive glycophyte, with a salinity threshold of approximately 1.3 dS m−1 [6,7]. Although numerous studies have examined lettuce responses to lower NaCl concentrations (e.g., 50 mM), comprehensive evaluations that combine physiological, biochemical, and symbiotic parameters under high NaCl concentrations (150 mM) remain limited, indicating a critical research gap.
Conventional salinity management practices rely on chemical amendments that increase environmental pressure, reduce soil quality, and pose residue-related risks, particularly in leafy vegetables consumed fresh. In this context, plant biostimulants have emerged as promising tools for enhancing stress tolerance and crop performance by modulating plant metabolism and soil–plant interactions [8,9].
Arbuscular mycorrhizal fungi (AMF) are key components of soil–plant systems, forming mutualistic associations with approximately 72% of terrestrial plant species [10]. Through extensive hyphal networks, AMF enhance water and nutrient uptake, regulate ionic and osmotic balance, and stimulate antioxidant defense systems under salinity stress [11]. Similarly, Trichoderma species, widely recognized for their biocontrol potential, function as microbial biostimulants by modulating phytohormone levels, improving nutrient acquisition, and alleviating oxidative damage under abiotic stress conditions [12]. In addition to microbial inoculants, organic amendments such as vermicompost and coconut waste have gained attention for their ability to improve soil structure, water-holding capacity, and nutrient availability [13,14]. Coconut waste, rich in organic matter and minerals, contributes to ionic buffering and exhibits antimicrobial properties that support plant health under saline conditions [15].
Despite substantial evidence supporting the individual benefits of AMF, Trichoderma, vermicompost, and coconut waste, their combined, multi-component application as an integrated biostimulant strategy in lettuce under salinity stress has received limited attention. Recent studies emphasize that multi-component biostimulant systems capable of simultaneously regulating antioxidant metabolism, nutrient homeostasis, and symbiotic efficiency are essential for sustainable salinity management [16]. However, experimental evidence addressing such integrative approaches, particularly under high NaCl concentrations, remains scarce.
Therefore, the present study aims to evaluate the combined effects of Rhizophagus intraradices, Trichoderma asperellum, vermicompost, and coconut waste on lettuce grown under different salinity levels.
The novelty of this study lies in its holistic assessment of microbial–organic combined through the integration of plant growth, photosynthetic performance, antioxidant regulation, nutrient dynamics, and mycorrhizal development within a single experimental framework.
Based on this framework, it is hypothesized that (i) integrated biostimulant applications induce greater improvements in plant growth than individual applications and physiological performance under salinity stress; (ii) microbial–organic combinations regulate antioxidant defense systems and nutrient dynamics more effectively than individual applications; and (iii) enhanced mycorrhizal colonization and rhizosphere biological activity contribute substantially to improved lettuce salinity tolerance.
2.1 Experimental Site and Growth Conditions
The experiment was conducted under greenhouse conditions at the Adıyaman University Agricultural Application and Research Center (ADYÜTAYAM), southeastern Türkiye, during 2024–2025. The site is located at 37°46′15″ N, 38°26′40″ E, at an altitude of ~622 m. The regional climate is classified as Csa (Mediterranean climate) according to the Köppen–Geiger system, with a mean annual temperature of 15.3°C and annual precipitation of 584 mm [17].
Plants were grown in an unheated plastic greenhouse-oriented north-south under natural daylight conditions at a temperature of 23 ± 2°C and relative humidity of 60–70%. The photoperiod was determined by the natural day-night cycles prevailing during the experiment. Throughout the experiment, the temperature and relative humidity inside the greenhouse were recorded daily. No supplemental or artificial lighting was used; therefore, rather than being maintained and recorded at a constant level, light intensity varied according to seasonal patterns and the day-night cycle.
2.2 Plant Material and Experimental Inputs
Lettuce (Lactuca sativa L.) seedlings of the ‘Cospirina’ cultivar were used. Uniform and healthy seedlings were obtained from a commercial nursery (Çukurova Fide Co., Türkiye).
The arbuscular mycorrhizal fungus (Rhizophagus intraradices) and the beneficial fungus (Trichoderma asperellum) were obtained from the culture collection of the Mycology Laboratory, Department of Plant Protection, Faculty of Agriculture, Van Yüzüncü Yıl University, selected for their documented high colonization efficiency and biostimulant activity [18].
Vermicompost was obtained from Adıyaman University Agricultural Application and Land Management Research Center (ADYÜTAYAM). Coconut waste substrate (Coconut Grow Soil) was supplied by ALTYNBURGUT Co. Sodium chloride (NaCl, Merck) was used to establish salinity treatments.
2.3 Growth Medium and Pot Preparation
The experiment was conducted using 3 L plastic pots (16 × 18 cm). All pots were disinfected with 10% sodium hypochlorite solution before use. The growth medium consisted of a 2:1 (v/v) mixture of peat (TS1 classified peat) and perlite (coarse agricultural perlite). Prior to transplanting, the physicochemical properties of the growth medium were determined (pH = 7.06; EC = 0.03 dS m−1), providing the baseline values against which subsequent salinity-induced changes in substrate pH and EC were evaluated. One seedling was transplanted per pot, and pots were arranged according to a completely randomized design (CRD).
2.4 Experimental Design and Treatments
A CRD was used, comprising 30 treatment combinations and five replicates per treatment, for a total of 150 plants, with each plant considered as an individual experimental unit. Instead of a full factorial design, a set consisting of purposefully selected single, two-component, and three-component combinations was used; this allowed the effects of two microbial inoculants (R. intraradices, T. asperellum), two organic amendments (vermicompost, coconut waste), and two salinity levels (50 and 150 mM NaCl) both individually and in combination—to be compared with a salt-free control group. This design follows the general recommendation that biostimulants should be evaluated both individually and in combination, rather than relying on an empirical “more is better” approach [19].
Treatments consisted of:
Biological inoculants: R. intraradices (AMF, already defined) and T. asperellum
Organic amendments: vermicompost (VC) (200 g pot−1) and coconut waste (CW) (300 g pot−1)
Salinity levels: 50, and 150 mM NaCl
Treatments and their combinations are detailed in Table 1.
Table 1: Experimental design of the project proposal.
| No | Treatment Code | Description |
|---|---|---|
| 1 | Control | Untreated lettuce plants |
| 2 | Tasp | Lettuce plants treated with Trichoderma asperellum |
| 3 | Ri | Lettuce plants inoculated with arbuscular mycorrhizal fungi (Rhizophagus intraradices) |
| 4 | CW | Lettuce plants treated with coconut waste |
| 5 | VC | Lettuce plants treated with vermicompost |
| 6 | T1 | Lettuce plants exposed to 50 mM NaCl salinity |
| 7 | T2 | Lettuce plants exposed to 150 mM NaCl salinity |
| 8 | Tasp + Ri | Lettuce plants treated with Trichoderma asperellum + Rhizophagus intraradices |
| 9 | Tasp + CW | Lettuce plants treated with Trichoderma asperellum + coconut waste |
| 10 | Tasp + VC | Lettuce plants treated with Trichoderma asperellum + vermicompost |
| 11 | Tasp + T1 | Lettuce plants treated with Trichoderma asperellum + 50 mM NaCl |
| 12 | Tasp + T2 | Lettuce plants treated with Trichoderma asperellum + 150 mM NaCl |
| 13 | Ri + CW | Lettuce plants inoculated with Rhizophagus intraradices + coconut waste |
| 14 | Ri + VC | Lettuce plants inoculated with Rhizophagus intraradices + vermicompost |
| 15 | Ri + T1 | Lettuce plants inoculated with Rhizophagus intraradices + 50 mM NaCl |
| 16 | Ri + T2 | Lettuce plants inoculated with Rhizophagus intraradices + 150 mM NaCl |
| 17 | CW + VC | Lettuce plants treated with coconut waste + vermicompost |
| 18 | CW + T1 | Lettuce plants treated with coconut waste + 50 mM NaCl |
| 19 | CW + T2 | Lettuce plants treated with coconut waste + 150 mM NaCl |
| 20 | VC + T1 | Lettuce plants treated with vermicompost + 50 mM NaCl |
| 21 | VC + T2 | Lettuce plants treated with vermicompost + 150 mM NaCl |
| 22 | Tasp + Ri + CW | Lettuce plants treated with Trichoderma asperellum + Rhizophagus intraradices + coconut waste |
| 23 | Tasp + Ri + VC | Lettuce plants treated with Trichoderma asperellum + Rhizophagus intraradices + vermicompost |
| 24 | Tasp + Ri + T1 | Lettuce plants treated with Trichoderma asperellum + Rhizophagus intraradices + 50 mM NaCl |
| 25 | Tasp + Ri + T2 | Lettuce plants treated with Trichoderma asperellum + Rhizophagus intraradices + 150 mM NaCl |
| 26 | Ri + CW + VC | Lettuce plants inoculated with Rhizophagus intraradices + coconut waste + vermicompost |
| 27 | Ri + CW + T1 | Lettuce plants inoculated with Rhizophagus intraradices + coconut waste + 50 mM NaCl |
| 28 | Ri + CW + T2 | Lettuce plants inoculated with Rhizophagus intraradices + coconut waste + 150 mM NaCl |
| 29 | CW + VC + T1 | Lettuce plants treated with coconut waste + vermicompost + 50 mM NaCl |
| 30 | CW + VC + T2 | Lettuce plants treated with coconut waste + vermicompost + 150 mM NaCl |
2.5 Application of Vermicompost and Coconut Waste
Vermicompost was applied at a rate of 200 g per plant, directly into the planting hole at the time of transplanting [20]. Coconut waste was incorporated into the growth medium at 300 g per pot, thoroughly mixed into the peat–perlite substrate prior to pot filling [21].
2.6 AMF and Trichoderma Inoculation
For AMF treatments, 2.5 g of Rhizophagus intraradices inoculum (containing approximately 25–150 spores g−1) was placed directly into the root zone of each pot before transplanting. In non-mycorrhizal treatments, an equal amount of sterilized sand was added to maintain uniform soil volume.
Trichoderma asperellum was cultured on PDA medium, and a spore suspension was prepared at a concentration of 1 × 10⁶ spores mL−1, determined using a hemocytometer. A 15 mL suspension was applied as a soil drench every two days, avoiding saline irrigation days [18]. In treatments without Trichoderma, 15 mL of water was applied at the same two-day intervals to account for the additional water volume and irrigation frequency associated with the T. asperellum treatment.
Salt stress was imposed seven days after transplanting, when seedlings reached the three-leaf stage. NaCl solutions were applied gradually to avoid osmotic shock. Salinity was gradually increased in 25 mM increments every two days until the target concentrations of 50 and 150 mM NaCl were reached. The 50 mM level represents a moderate salinity commonly encountered in salt-affected irrigation waters and soils, whereas the 150 mM level was selected to represent a severe stress threshold, allowing evaluation of the protective capacity of the biostimulant treatments under conditions substantially exceeding the reported salinity tolerance threshold of lettuce (~1.3 dS m−1; [6,7]). Control plants received the same volume of non-saline water.
The experiment was terminated eight weeks after transplanting. Plants were harvested carefully, and samples were collected for physiological, biochemical, soil, and mycorrhizal analyses.
2.9 Growth and Physiological Measurements
Leaf number was recorded as the total leaf count per plant. Shoot height, root length, and stem diameter were measured using a ruler and digital caliper. Plants were washed to remove adhering soil particles.
Total plant fresh weight (FW; shoots and roots combined) was recorded. Samples were then oven-dried at 70°C for 48 h to determine total dry weight (DW). Chlorophyll content was determined using a SPAD-502 chlorophyll meter (Konica Minolta, Japan), while photosynthetic performance parameters were measured using an EARS miniPPM photosynthesis meter (EARS Plant Photosynthesis Monitoring B.V., The Netherlands), which provided values expressed as percent (%) and r. These measurements were based on chlorophyll fluorescence and were not interpreted as direct gas exchange measurements. Color values (L*, a*, and b*) were measured using a WR18/4–8 FRU colorimeter (China) according to the CIELAB color system. In this system, L* represents lightness (0 = black and 100 = white), while a* and b* represent the red–green and yellow–blue color axes, respectively; positive a* and b* values indicate red and yellow, whereas negative values indicate green and blue, respectively [22].
Salt injury symptoms were evaluated visually using a 0–5 scale [23], where 0 represents no visible damage, and 5 indicates severe and irreversible damage or plant death:
0: No visible effect (control plants).
1: Slight effect of salt stress (up to 5%).
2: Initial wilting on lower leaves and mild salt stress symptoms (6–20%).
3: Leaf curling, wilting, and chlorosis on affected leaves (21–50%).
4: Severe wilting, chlorosis, necrosis, and drying observed on 51–80% of leaves.
5: Irreversible wilting affecting more than 80% of the plant, with leaf desiccation or plant death.
2.11 Mineral Nutrient Analysis
Leaf samples were dried at 70°C for 48 h, ground, and analyzed for phosphorus (P), potassium (K), calcium (Ca), magnesium (Mg), and sodium (Na) contents. Phosphorus, potassium, calcium, magnesium, and sodium concentrations were all expressed on a dry-weight basis as mg kg−1 DW.
Element concentrations were determined spectrophotometrically using a Jenway 6505 UV/Vis spectrophotometer (Jenway, UK) with calibration curves prepared from certified reference standards, following the wet-digestion procedure of [24].
2.12 Antioxidant Enzyme Activities and Phenolic Compounds
Catalase (CAT) and ascorbate peroxidase (APX) activities were determined spectrophotometrically [25,26]. Ascorbate peroxidase (APX) activity was determined by monitoring the H2O2-dependent oxidation of ascorbate at 290 nm. The reaction mixture consisted of 50 mM phosphate buffer (KH2PO4, pH 7.0), 0.5 mM ascorbic acid, 0.1 mM EDTA, and 1.5 mM H2O2. Three milliliters of the reaction mixture were combined with 0.1 mL of plant extract, and the reaction was initiated by the addition of the enzyme extract. Absorbance readings were taken at 0 and 60 s at 290 nm, and enzyme activity was calculated from the change in absorbance within this 1-min interval [26]. Catalase (CAT) activity was assayed following the method of based on [27], by monitoring the decomposition of H2O2 at 240 nm. The reaction mixture contained 0.05 M phosphate buffer (KH2PO4, pH 7.0) and 1.5 mM H2O2. To 2.5 mL of reaction mixture, 0.2 mL of plant extract was added, and the reaction was started with the addition of 0.1 mL of enzyme extract. Absorbance was recorded at 0 and 60 s at 240 nm, and activity was calculated from the decrease in absorbance during this 1-min period.
The rate of AMF colonization in root tissues (AC%) was calculated via Eq. (1). This value was expressed as a percentage, based on the ratio of AMF-colonized roots (ACR) to the total number of roots examined (R), following the procedure outlined by Giovannetti and Mosse [28].
AC% = ACR/R × 100(1)AMF spore density in rhizosphere soils was determined using the wet-sieving method [29].
Mycorrhizal dependency (MD %) was calculated based on total dry weight (DW) differences between mycorrhizal and non-mycorrhizal plants following [30]. Then, the mycorrhizal dependence (MD) index was determined according to the results of plant DW using the following Eq. (2). MD (%) = [(A − B)/A] × 100(2) where A represents the DW of each treatment inoculated with AMF, while B represents the DW of the untreated, uninoculated control group—for each combination, the same single reference baseline value was applied to all AMF-containing treatments, rather than using a comparison group without AMF appropriate for each treatment. Consequently, the reported MD values reflect the overall growth response of each AMF-containing combination relative to the untreated control group, rather than the contribution of AMF isolated from the co-applied organic fertilizers or the salinity treatment. Since MD was calculated based on the average DW values of the treatment, it was used as a descriptive measure and was not subjected to statistical analysis.
2.14 Soil Physicochemical Properties
After harvest, samples of the peat + perlite growing medium were collected to determine pH and EC. The soil pH was determined in a 1:2.5 soil-to-water suspension using a JENCO 6173 pH meter (JENCO Instruments, USA), following the method described by [24]. EC, an indicator of soil salinity, was measured using a Thermo Scientific Orion 3-Star Plus conductivity meter (Thermo Fisher Scientific, USA) in accordance with the procedure outlined by [31].
Statistical Analysis
All experimental data were analyzed using analysis of variance (ANOVA). Growth, physiological, biochemical, mineral, and soil parameters were analyzed across all treatment combinations described in Table 1, whereas mycorrhizal parameters (root colonization, soil spore density, and mycorrhizal dependency) were evaluated only among the AMF containing treatments, given their inherent inapplicability to non-inoculated plants. The experiment followed a completely randomized design (CRD), as environmental conditions inside the greenhouse (temperature, humidity, and light) were homogeneous across the pot arrangement; therefore, no blocking factor was applied, and a randomized complete block design (RCBD) was not used in this study. The overall significance of the treatment effect for each variable was first assessed using the ANOVA F-test, and the corresponding p-value is reported at the bottom of each table (p-treatment). Where the treatment effect was significant, pairwise mean comparisons among treatments were subsequently performed using Duncan’s multiple range test at p ≤ 0.05, with results indicated by different letters in the tables.
3.1 Effects of Biostimulant Treatments on Lettuce Growth Parameters under Salinity Stress
Under salinity stress, the application of combined biostimulants significantly altered the evaluated lettuce growth traits compared to the corresponding groups treated with salt alone (Table 2). Under 50 mM NaCl conditions, the highest number of leaves was recorded in the CW + T1 combination (22.0 leaves per plant), which corresponds to an increase of approximately 36% compared to T1 alone; under 150 mM NaCl conditions, the highest number of leaves was obtained in the CW + T2 combination (20.8 leaves per plant), which corresponds to an approximate 22% increase compared to T2 alone. Under salinity stress, the lowest number of leaves was recorded in the T1 treatment, where no biostimulant was applied (16.2 leaves per plant); this corresponds to a 14% decrease compared to the unsalted control group, confirming the inhibitory effect of salinity in the absence of biostimulant addition.
Shoot length reached its lowest value in T2 (16.8 cm), showing a 12% decrease compared to the unsalted control group, thereby confirming the growth-limiting effect of salinity alone. Under salt stress, maximum shoot length was recorded at 50 mM NaCl in the CW + VC + T1 combination (22.88 cm) (a 27% increase compared to T1 alone) and at 150 mM NaCl in the CW + VC + T2 combination (22.90 cm) (a 36% increase compared to T2 alone). Similarly, shoot diameter was significantly affected by the applied treatments; among the treatments under salt stress, the highest values were recorded in the CW + VC + T1 treatment (26.08 mm; a 25% increase compared to T1 alone) and in the Tasp + T2 treatment (25.79 mm; a 12% increase compared to T2 alone). Among the combinations subjected to salt stress, the lowest shoot diameter was recorded in the Ri + T2 treatment (19.37 mm); this corresponds to a marginal 16% decrease compared to T2 alone, indicating a relatively limited inhibitory effect on stem thickening in this specific combination (Table 2).
Root growth was significantly influenced by the treatments applied, and statistically significant differences were observed among the treatments. The shortest roots were observed in the T1 treatment, where no biostimulant was applied (18.8 cm); this represents a significant 52% reduction compared to the unsalted control group and confirms the inhibitory effect of salinity on root growth. Under salt stress, root length was significantly restored thanks to the application of the biostimulant: The Tasp + T1 combination produced the longest roots in 50 mM NaCl (62.2 cm; more than three times longer than T1 alone), while the Tasp + T2 combination produced the longest roots in 150 mM NaCl (54.8 cm; a 75% increase compared to T2 alone). These findings demonstrate that specific combinations of biostimulants significantly enhance root growth under saline conditions (Table 2).
FW gain also followed a similar overall trend, with a significant increase observed in the combined treatments under salt stress conditions. Among the treatments under salt stress, the highest fresh biomass was recorded in the Tasp + Ri + T1 combination at 50 mM NaCl (212.92 g); which corresponded to a 39% increase compared to T1 alone; it was also recorded in the Tasp + Ri + T2 combination at 150 mM NaCl (209.57 g), which corresponded to a 63% increase compared to T2 alone. In contrast, the FW values measured with T2 alone (128.56 g) were slightly lower, showing a decrease of approximately 6% compared to the salt-free control group. Although the magnitude of this decrease was limited, it demonstrates that the biostimulant combinations were significantly more effective than salt stress alone in promoting biomass accumulation under salinity stress (Table 2).
Table 2: Effects of combined biostimulant applications on growth and biomass parameters of lettuce under salinity stress.
| Treatments | Number of Leaves (leaves plant−1) | Shoot Length (cm) | Shoot Diameter (mm) | Root Length (cm) | FW (g) |
|---|---|---|---|---|---|
| Control | 18.80 ± 0.85cd | 19.10 ± 0.61de | 19.72 ± 0.76d | 39.00 ± 3.10cd | 136.10 ± 4.69f |
| Tasp | 21.00 ± 0.85bc | 20.30 ± 0.61cd | 22.58 ± 0.76c | 45.40 ± 3.10bc | 200.87 ± 4.69cd |
| Ri | 21.80 ± 0.85bc | 22.10 ± 0.61ab | 23.23 ± 0.76bc | 24.40 ± 3.10ef | 197.22 ± 4.69cd |
| CW | 20.20 ± 0.85bc | 23.20 ± 0.61ab | 26.56 ± 0.76a | 44.00 ± 3.10bc | 204.58 ± 4.69cd |
| VC | 23.20 ± 0.85ab | 20.00 ± 0.61cd | 22.45 ± 0.76c | 22.60 ± 3.10f | 208.64 ± 4.69c |
| T1 | 16.20 ± 0.85e | 18.00 ± 0.61e | 20.9 ± 0.76d | 18.80 ± 3.10f | 153.14 ± 4.69ef |
| T2 | 17.00 ± 0.85de | 16.80 ± 0.61e | 23.13 ± 0.76bc | 31.40 ± 3.10de | 128.56 ± 4.69f |
| Tasp + Ri | 23.40 ± 0.85ab | 21.40 ± 0.61bc | 21.97 ± 0.76cd | 38.00 ± 3.10cd | 224.58 ± 4.69ab |
| Tasp + CW | 24.20 ± 0.85a | 22.24 ± 0.61ab | 24.17 ± 0.76b | 47.00 ± 3.10bc | 230.98 ± 4.69ab |
| Tasp + VC | 22.40 ± 0.85ab | 24.10 ± 0.61a | 23.41 ± 0.76bc | 50.20 ± 3.10b | 238.14 ± 4.69a |
| Tasp + T1 | 19.80 ± 0.85cd | 20.50 ± 0.61cd | 23.62 ± 0.76bc | 62.20 ± 3.10a | 182.26 ± 4.69de |
| Tasp + T2 | 20.40 ± 0.85bc | 18.30 ± 0.61de | 25.79 ± 0.76ab | 54.80 ± 3.10ab | 173.65 ± 4.69e |
| Ri + CW | 19.40 ± 0.85cd | 21.10 ± 0.61bc | 20.73 ± 0.76d | 42.80 ± 3.10bc | 219.22 ± 4.69bc |
| Ri + VC | 22.40 ± 0.85ab | 21.80 ± 0.61bc | 26.92 ± 0.76a | 20.60 ± 3.10f | 222.52 ± 4.69ab |
| Ri + T1 | 18.80 ± 0.85cd | 20.80 ± 0.61cd | 25.9 ± 0.76ab | 31.00 ± 3.10de | 194.64 ± 4.69cd |
| Ri + T2 | 19.80 ± 0.85cd | 21.60 ± 0.61bc | 19.37 ± 0.76d | 28.20 ± 3.10de | 167.54 ± 4.69ef |
| CW + VC | 22.60 ± 0.85ab | 23.10 ± 0.61ab | 22.38 ± 0.76c | 62.80 ± 3.10a | 219.16 ± 4.69bc |
| CW + T1 | 22.00 ± 0.85bc | 21.10 ± 0.61bc | 23.25 ± 0.76bc | 44.20 ± 3.10bc | 179.22 ± 4.69de |
| CW + T2 | 20.80 ± 0.85bc | 20.60 ± 0.61cd | 22.68 ± 0.76c | 51.80 ± 3.10b | 161.94 ± 4.69ef |
| VC + T1 | 21.80 ± 0.85bc | 17.60 ± 0.61e | 24.76 ± 0.76b | 52.80 ± 3.10b | 176.16 ± 4.69de |
| VC + T2 | 20.80 ± 0.85bc | 20.70 ± 0.61cd | 25.60 ± 0.76ab | 51.20 ± 3.10b | 162.04 ± 4.69ef |
| Tasp + Ri + CW | 22.80 ± 0.85ab | 23.50 ± 0.61ab | 23.89 ± 0.76bc | 36.80 ± 3.10cd | 228.13 ± 4.69ab |
| Tasp + Ri + VC | 23.80 ± 0.85ab | 23.40 ± 0.61ab | 24.83 ± 0.76b | 23.40 ± 3.10ef | 231.49 ± 4.69ab |
| Tasp + Ri + T1 | 20.60 ± 0.85bc | 20.00 ± 0.61cd | 22.58 ± 0.76c | 25.40 ± 3.10ef | 212.92 ± 4.69bc |
| Tasp + Ri + T2 | 19.40 ± 0.85cd | 20.00 ± 0.61cd | 21.11 ± 0.76cd | 23.80 ± 3.10ef | 209.57 ± 4.69c |
| Ri + CW + VC | 21.80 ± 0.85bc | 21.10 ± 0.61bc | 24.04 ± 0.76b | 35.40 ± 3.10cd | 237.24 ± 4.69a |
| Ri + CW + T1 | 19.60 ± 0.85cd | 21.50 ± 0.61bc | 25.53 ± 0.76ab | 33.20 ± 3.10de | 192.57 ± 4.69cd |
| Ri + CW + T2 | 19.40 ± 0.85cd | 17.10 ± 0.61e | 21.63 ± 0.76cd | 30.00 ± 3.10de | 188.67 ± 4.69cd |
| CW + VC + T1 | 19.40 ± 0.85cd | 22.88 ± 0.61ab | 26.08 ± 0.76a | 44.80 ± 3.10bc | 206.53 ± 4.69cd |
| CW + VC + T2 | 19.80 ± 0.85cd | 22.90 ± 0.61ab | 22.93 ± 0.76c | 33.00 ± 3.10de | 199.32 ± 4.69cd |
| ptreatment | p<0.0001 | p<0.0001 | p<0.0001 | p<0.0001 | p<0.0001 |
3.2 Effects of Biostimulant Treatments on Lettuce Growth and Physiological Characteristics under Salinity Stress
Under salinity stress, significant differences were observed between treatments in terms of lettuce DW, chlorophyll content, photosynthetic activity, and salt damage (Table 3). DW decreased from 21.46 g in the salt-free control group to 18.24 g in the T2 group; this corresponds to a reduction of approximately 15% and confirms the growth-inhibiting effect of salinity alone. Under salt stress, biomass accumulation was significantly restored thanks to the application of biostimulants: the CW + VC + T1 combination more than doubled DW compared to T1 alone (19.43 g vs. 40.89 g, a 110% increase), and the CW + VC + T2 combination showed a similar response at 150 mM NaCl (18.24 g vs. 37.71 g, a 107% increase). Combination treatments generally yielded higher DW values than single treatments under equivalent salinity conditions; this demonstrates that combined biostimulant applications were more effective in counteracting the negative effects of salinity on growth (Table 3).
Photosynthetic performance (%) and r values showed statistically significant differences among the treatments. T2 exhibited the lowest photosynthetic performance value (58.36%), indicating that photosynthetic performance decreases under severe salinity conditions. Among the treatments subjected to salt stress, the Ri + CW combination exhibited the highest values at both 50 mM and 150 mM NaCl (72.10% and 71.70%, respectively); in contrast, these values were 60.40% and 58.36%, respectively, in the corresponding treatments with salt alone. The same treatments exhibited lower r values (5.20 and 4.40, respectively) compared to the corresponding treatments containing only salt (26.80 and 25.60, respectively). Since these values were parameters obtained from the instrument, the differences in r values were interpreted as changes in the measured instrument response and were not evaluated as direct measurements of photosynthetic induction kinetics or gas exchange rates. Overall, the biostimulant combinations improved the photosynthetic performance measured under salinity stress (Table 3).
Salt damage scale scores increased significantly only under salinity stress (T1 = 2.8, T2 = 3.2) compared to the salt-free control group (1.0). The application of biostimulants significantly alleviated this visual damage: the Tasp + Ri + T1 combination reduced the damage score to the control level (1.0) at 50 mM NaCl; representing a 64% reduction compared to T1 alone; the CW + VC + T2 combination reduced the score to 1.2 at 150 mM NaCl; this represents a 63% reduction compared to T2 alone.
The application of biostimulants under salt stress conditions did not result in a consistent increase in chlorophyll content compared to the corresponding controls treated with salt alone (53.44 and 53.50 SPAD units, respectively, for the best-performing combinations under T1 and T2 conditions, compared to 55.14 and 54.10 for the T1 and T2 treatments alone). Consequently, the higher instrument-measured photosynthetic performance values observed with some biostimulant applications were not accompanied by a corresponding increase in SPAD values; this indicates that these responses are not solely related to higher chlorophyll content (Table 3).
Table 3: Effects of combined plant biostimulant applications on DW, chlorophyll content, instrument-derived photosynthetic performance parameters, and salt damage scale of lettuce under salinity stress.
| Treatments | DW (g) | Chlorophyll (SPAD) | Photosynthetic Performance (%) | r Value | 0–5 Salt Scale |
|---|---|---|---|---|---|
| Control | 21.46 ± 0.82p | 46.5 ± 2.74a | 62.92 ± 0.77j | 28.00 ± 2.77c | 1.00 ± 0.23e |
| Tasp | 28.95 ± 0.82l | 51.00 ± 2.74a | 64.08 ± 0.77i | 40.00 ± 2.77b | 1.00 ± 0.23e |
| Ri | 26.55 ± 0.82m | 50.36 ± 2.74a | 64.17 ± 0.77i | 41.00 ± 2.77b | 1.00 ± 0.23e |
| CW | 38.93 ± 0.82f | 37.70 ± 2.74h | 64.90 ± 0.77h | 54.40 ± 2.77a | 1.40 ± 0.23d |
| VC | 40.38 ± 0.82e | 54.44 ± 2.74a | 66.00 ± 0.77g | 60.20 ± 2.77a | 1.20 ± 0.23e |
| T1 | 19.43 ± 0.82q | 55.14 ± 2.74a | 60.40 ± 0.77m | 26.80 ± 2.77c | 2.80 ± 0.23b |
| T2 | 18.24 ± 0.82r | 54.10 ± 2.74a | 58.36 ± 0.77n | 25.60 ± 2.77c | 3.20 ± 0.23a |
| Tasp + Ri | 30.95 ± 0.82k | 49.22 ± 2.74a | 65.72 ± 0.77h | 45.40 ± 2.77b | 1.00 ± 0.23e |
| Tasp + CW | 32.43 ± 0.82j | 53.40 ± 2.74a | 66.96 ± 0.77g | 44.20 ± 2.77b | 1.20 ± 0.23e |
| Tasp + VC | 35.94 ± 0.82h | 52.30 ± 2.74a | 68.16 ± 0.77f | 41.80 ± 2.77b | 1.00 ± 0.23e |
| Tasp + T1 | 26.60 ± 0.82m | 45.32 ± 2.74b | 62.44 ± 0.77j | 26.20 ± 2.77c | 1.20 ± 0.23e |
| Tasp + T2 | 24.28 ± 0.82n | 46.72 ± 2.74a | 61.72 ± 0.77k | 21.20 ± 2.77c | 1.80 ± 0.23c |
| Ri + CW | 41.83 ± 0.82d | 40.08 ± 2.74f | 73.92 ± 0.77a | 11.80 ± 2.77e | 1.20 ± 0.23e |
| Ri + VC | 43.31 ± 0.82c | 49.14 ± 2.74a | 75.08 ± 0.77a | 13.60 ± 2.77d | 1.00 ± 0.23e |
| Ri + T1 | 24.31 ± 0.82n | 47.50 ± 2.74a | 62.92 ± 0.77j | 13.20 ± 2.77d | 1.20 ± 0.23e |
| Ri + T2 | 23.51 ± 0.82o | 53.50 ± 2.74a | 61.88 ± 0.77k | 12.60 ± 2.77d | 1.40 ± 0.23d |
| CW + VC | 43.59 ± 0.82c | 46.32 ± 2.74a | 71.62 ± 0.77c | 17.40 ± 2.77d | 1.40 ± 0.23d |
| CW + T1 | 35.75 ± 0.82h | 53.44 ± 2.74a | 62.80 ± 0.77j | 16.00 ± 2.77d | 2.40 ± 0.23b |
| CW + T2 | 33.93 ± 0.82i | 47.92 ± 2.74a | 60.76 ± 0.77l | 14.80 ± 2.77d | 2.00 ± 0.23c |
| VC + T1 | 37.88 ± 0.82g | 52.04 ± 2.74a | 63.08 ± 0.77j | 14.80 ± 2.77d | 1.40 ± 0.23d |
| VC + T2 | 34.09 ± 0.82i | 50.74 ± 2.74a | 62.70 ± 0.77j | 12.80 ± 2.77d | 2.00 ± 0.23c |
| Tasp + Ri + CW | 45.06 ± 0.82b | 42.54 ± 2.74d | 73.94 ± 0.77a | 9.20 ± 2.77e | 1.40 ± 0.23d |
| Tasp + Ri + VC | 46.26 ± 0.82a | 54.56 ± 2.74a | 74.54 ± 0.77a | 8.60 ± 2.77e | 1.20 ± 0.23e |
| Tasp + Ri + T1 | 28.63 ± 0.82l | 45.20 ± 2.74b | 63.08 ± 0.77j | 8.00 ± 2.77f | 1.00 ± 0.23e |
| Tasp + Ri + T2 | 27.47 ± 0.82m | 48.02 ± 2.74a | 62.56 ± 0.77j | 8.00 ± 2.77f | 1.60 ± 0.23d |
| Ri + CW + VC | 47.64 ± 0.82a | 43.26 ± 2.74c | 74.26 ± 0.77a | 7.80 ± 2.77f | 1.20 ± 0.23e |
| Ri + CW + T1 | 39.64 ± 0.82e | 41.92 ± 2.74e | 72.10 ± 0.77b | 5.20 ± 2.77g | 1.60 ± 0.23d |
| Ri + CW + T2 | 37.39 ± 0.82g | 51.90 ± 2.74a | 71.70 ± 0.77c | 4.40 ± 2.77g | 2.00 ± 0.23c |
| CW + VC + T1 | 40.89 ± 0.82f | 39.62 ± 2.74g | 70.54 ± 0.77d | 3.80 ± 2.77h | 1.00 ± 0.23e |
| CW + VC + T2 | 37.71 ± 0.82g | 48.40 ± 2.74a | 69.36 ± 0.77e | 4.80 ± 2.77g | 1.20 ± 0.23e |
| ptreatment | p<0.0001 | p<0.0001 | p<0.0001 | p<0.0001 | p<0.0001 |
3.3 Biostimulant Applications and Antioxidant Enzyme Activities and Leaf Color Responses of Lettuce under Salt Stress
The antioxidant enzyme activities and leaf color parameters (L*, a*, and b*) of lettuce under salt stress showed significant differences between treatments (Table 4). L* values ranged from 35.50 to 49.24, with the CW + T2 treatment exhibiting the highest lightness value (49.24), a 16% increase relative to T2 alone (42.27) (Table 4).
The green color persisted across all treatments, as indicated by the a* parameter, which was predominantly negative. However, a clear change was observed in certain combinations; the highest negative a* value was recorded in the Tasp + CW treatment, while the least negative a value (−2.07), representing the smallest magnitude of green coloration among the treatments, was recorded in Ri + T1. The b* values showed significant variation; the value of 11.19 in the control increased to 30.34 in CW + T1. This indicates a pronounced enhancement in the yellow–blue color components in combinations based on CW (Table 4).
Catalase (CAT) and ascorbate peroxidase (APX) activities exhibited treatment-specific, significant responses to salinity and biostimulant application (Table 4). Under salt stress, CAT activity increased most significantly at 50 mM NaCl with the CW + VC + T1 combination (3.33 mmol g−1, a 156% increase compared to T1 alone) and at 150 mM NaCl with the Ri + T2 combination (2.75 mmol g−1, a 67% increase compared to T2 alone).
Similarly, APX activity was highest at a 50 mM NaCl concentration with the CW + T1 combination (7.53 mmol g−1, a 52% increase compared to T1 alone) and at 150 mM NaCl with the CW + T2 combination (6.71 mmol g−1, a 35% increase compared to T2 alone); which demonstrates that CW-based combinations are particularly effective in enhancing antioxidant enzyme activity under both moderate and severe salinity stress. In contrast, treatments combining T. asperellum with salinity generally exhibited lower CAT and APX activities compared to corresponding treatments containing only salt (for example, 57% and 65% lower APX activity in Tasp + T1 and Tasp + T2, respectively), suggesting that this inoculant has a relatively limited antioxidant-inducing effect under salt stress when applied without a co-inoculant.
Table 4: Effects of combined plant biostimulant treatments on leaf color parameters (L*, a*, b*) and antioxidant enzyme activities (CAT and APX) in lettuce under salinity stress.
| Treatments | L* | a* | b* | Catalase (CAT) Activity (mmol g−1) | Ascorbate Peroxidase (APX) Activity (mmol g−1) |
|---|---|---|---|---|---|
| Control | 36.11 ± 1.08l | −9.03 ± 0.45e | 11.19 ± 1.12h | 0.73 ± 0.05n | 2.82 ± 0.07m |
| Tasp | 36.65 ± 1.08l | −9.32 ± 0.45d | 21.43 ± 1.12g | 1.84 ± 0.05e | 3.70 ± 0.07k |
| Ri | 40.31 ± 1.08g | −6.52 ± 0.45h | 23.71 ± 1.12d | 1.80 ± 0.05e | 2.50 ± 0.07n |
| CW | 39.11 ± 1.08h | −10.13 ± 0.45b | 23.54 ± 1.12d | 0.74 ± 0.05n | 5.09 ± 0.07ı |
| VC | 38.22 ± 1.08j | −10.16 ± 0.45b | 23.25 ± 1.12e | 0.90 ± 0.05m | 6.38 ± 0.07e |
| T1 | 41.95 ± 1.08d | −9.97 ± 0.45b | 24.49 ± 1.12c | 1.30 ± 0.05k | 4.96 ± 0.07ı |
| T2 | 42.27 ± 1.08d | −9.94 ± 0.45b | 25.07 ± 1.12c | 1.65 ± 0.05h | 4.96 ± 0.07ı |
| Tasp + Ri | 39.37 ± 1.08h | −10.39 ± 0.45b | 21.61 ± 1.12g | 2.34 ± 0.05d | 3.76 ± 0.07k |
| Tasp + CW | 40.75 ± 1.08f | −12.33 ± 0.45a | 27.05 ± 1.12a | 1.73 ± 0.05f | 3.87 ± 0.07k |
| Tasp + VC | 41.44 ± 1.08d | −6.10 ± 0.45h | 23.93 ± 1.12d | 1.49 ± 0.05j | 3.23 ± 0.07l |
| Tasp + T1 | 44.55 ± 1.08b | −10.20 ± 0.45b | 26.29 ± 1.12b | 0.89 ± 0.05m | 2.16 ± 0.07o |
| Tasp + T2 | 43.19 ± 1.08c | −10.08 ± 0.45b | 22.89 ± 1.12f | 1.49 ± 0.05j | 1.75 ± 0.07p |
| Ri + CW | 44.23 ± 1.08b | −9.74 ± 0.45c | 26.85 ± 1.12a | 3.41 ± 0.05a | 8.59 ± 0.07a |
| Ri + VC | 35.50 ± 1.08m | −8.18 ± 0.45f | 20.93 ± 1.12h | 2.35 ± 0.05d | 6.51 ± 0.07d |
| Ri + T1 | 42.45 ± 1.08d | −2.07 ± 0.45ı | 26.34 ± 1.12b | 0.84 ± 0.05m | 5.67 ± 0.07f |
| Ri + T2 | 39.73 ± 1.08g | −10.24 ± 0.45b | 23.59 ± 1.12d | 2.75 ± 0.05c | 5.06 ± 0.07ı |
| CW + VC | 41.35 ± 1.08d | −10.78 ± 0.45b | 26.15 ± 1.12b | 1.89 ± 0.05e | 2.49 ± 0.07n |
| CW + T1 | 47.28 ± 1.08a | −9.97 ± 0.45b | 30.34 ± 1.12a | 1.62 ± 0.05h | 7.53 ± 0.07b |
| CW + T2 | 49.24 ± 1.08a | −9.42 ± 0.45c | 27.66 ± 1.12a | 0.85 ± 0.05m | 6.71 ± 0.07d |
| VC + T1 | 39.73 ± 1.08g | −9.81 ± 0.45c | 24.36 ± 1.12c | 0.52 ± 0.05o | 5.35 ± 0.07h |
| VC + T2 | 39.07 ± 1.08h | −10.03 ± 0.45b | 23.16 ± 1.12e | 1.86 ± 0.05e | 2.54 ± 0.07n |
| Tasp + Ri + CW | 43.15 ± 1.08c | −10.71 ± 0.45b | 26.08 ± 1.12b | 2.33 ± 0.05d | 5.37 ± 0.07h |
| Tasp + Ri + VC | 36.85 ± 1.08k | −10.38 ± 0.45b | 22.69 ± 1.12d | 1.56 ± 0.05i | 2.84 ± 0.07m |
| Tasp + Ri + T1 | 39.12 ± 1.08h | −9.92 ± 0.45b | 22.90 ± 1.12f | 3.21 ± 0.05b | 2.50 ± 0.07n |
| Tasp + Ri + T2 | 38.37 ± 1.08ı | −9.80 ± 0.45c | 23.67 ± 1.12d | 2.41 ± 0.05d | 1.77 ± 0.07p |
| Ri + CW + VC | 41.01 ± 1.08e | −10.96 ± 0.45b | 25.72 ± 1.12b | 1.62 ± 0.05h | 7.20 ± 0.07c |
| Ri + CW + T1 | 45.95 ± 1.08a | −9.34 ± 0.45c | 28.40 ± 1.12a | 1.04 ± 0.05l | 5.79 ± 0.07f |
| Ri + CW + T2 | 44.74 ± 1.08b | −10.43 ± 0.45b | 28.55 ± 1.12a | 1.66 ± 0.05g | 5.48 ± 0.07g |
| CW + VC + T1 | 46.08 ± 1.08a | −10.74 ± 0.45b | 29.11 ± 1.12a | 3.33 ± 0.05a | 2.60 ± 0.07n |
| CW + VC + T2 | 41.66 ± 1.08d | −10.86 ± 0.45b | 26.76 ± 1.12a | 0.76 ± 0.05m | 4.62 ± 0.07j |
| ptreatment | p<0.0001 | p<0.0001 | p<0.0001 | p<0.0001 | p<0.0001 |
3.4 Effects of Biostimulant Treatments on Mineral Nutrient Uptake and Ion Ratios under Salinity Stress
Table 5 shows that salinity treatments caused significant changes in leaf mineral composition. Sodium (Na) concentration increased gradually with salinity and reached its highest levels in T1 and T2 (241.26 and 322.21 mg kg−1 DW, respectively), representing an approximately eight- and tenfold increase compared to the control (7.6- and 10.1-fold, respectively).
In contrast, combinations containing biostimulants generally reduced Na accumulation by approximately 30–32% relative to the corresponding 50 mM NaCl treatment, with more modest reductions (approximately 3–15%) relative to the 150 mM NaCl treatment, compared to salinity alone. Combinations of Ri, Tasp, CW, or VC with T1 or T2 maintained moderate Na levels under both salinity conditions.
The potassium (K) content decreased only under salinity conditions, showing an approximately 23–45% reduction compared to the control; however, several biostimulant combinations maintained or even increased K concentrations. Specifically, Ri and Tasp-based combination treatments showed treatment-specific K responses when combined with salinity: some combinations (e.g., Ri + T2, Tasp + Ri + T1) showed 2- to 4.3-fold higher K values than the corresponding salinity-alone treatment, whereas others (e.g., Ri + T1, Tasp + T1, Tasp + T2, Tasp + Ri + T2) showed lower K values than salinity alone, indicating that K nutrition preservation was combination-specific rather than uniformly enhanced (Table 5).
Salt treatments alone (T1 and T2) markedly reduced the K/Na ratio relative to the control (0.0072 and 0.0039, respectively); notably, several biostimulant-salinity combinations exhibited even lower ratios (e.g., VC + T2 = 0.0002, Ri + T1 = 0.0003), indicating that the suppression of K uptake relative to Na was combination-specific rather than unique to salinity alone. The Tasp + Ri + T1 combination achieved the highest K/Na ratio at 50 mM NaCl (0.026; a 3.6-fold increase compared to T1 alone), while the Ri + T2 combination achieved the highest K/Na ratio at 150 mM NaCl (0.0179; a 4.6-fold increase compared to T2 alone).
Phosphorus (P) concentrations also reflected treatment-specific effects. Salinity alone reduced P by approximately 25% and 36% at 50 and 150 mM NaCl, respectively, compared to the control group. Treatments combining mycorrhizal inoculation with salinity significantly restored these nutrients: the Tasp + Ri + T1 combination increased P by 120% compared to T1 alone, while the Ri + T2 combination increased P by 200% compared to T2 alone.
Table 5: Effects of combined plant biostimulant applications on sodium and potassium content (mg kg−1 DW), the K/Na ratio, and phosphorus content (mg kg−1 DW) of lettuce leaves under salinity stress.
| Treatments | Na (mg kg−1) | K (mg kg−1) | K/Na | P (mg kg−1) |
|---|---|---|---|---|
| Control | 31.78 ± 1.39m | 22,700 ± 300e | 0.0716 ± 0.0004c | 7500 ± 900d |
| Tasp | 39.96 ± 1.39k | 10,700 ± 300j | 0.0268 ± 0.0011f | 4700 ± 900f |
| Ri | 39.36 ± 1.39l | 13,100 ± 300i | 0.0332 ± 0.0011d | 4500 ± 900f |
| CW | 43.20 ± 1.39j | 14,500 ± 300h | 0.0336 ± 0.0011d | 3900 ± 900g |
| VC | 40.88 ± 1.39k | 9900 ± 300k | 0.0242 ± 0.0011g | 2000 ± 900h |
| T1 | 241.26 ± 1.39g | 17,400 ± 300f | 0.0072 ± 0.0011j | 5600 ± 900e |
| T2 | 322.21 ± 1.39a | 12,600 ± 300i | 0.0039 ± 0.0011k | 4800 ± 900f |
| Tasp + Ri | 43.75 ± 1.39i | 11,300 ± 300j | 0.0258 ± 0.0011f | 5100 ± 900e |
| Tasp + CW | 46.26 ± 1.39i | 6200 ± 300m | 0.0133 ± 0.0011i | 6500 ± 900d |
| Tasp + VC | 45.43 ± 1.39i | 8200 ± 300l | 0.0181 ± 0.0011h | 4600 ± 900f |
| Tasp + T1 | 164.02 ± 1.39h | 6700 ± 300m | 0.0041 ± 0.0011k | 5500 ± 900e |
| Tasp + T2 | 303.24 ± 1.39c | 7900 ± 300l | 0.0026 ± 0.0011l | 5600 ± 900e |
| Ri + CW | 46.62 ± 1.39i | 700 ± 300n | 0.0015 ± 0.0011l | 3200 ± 900g |
| Ri + VC | 46.08 ± 1.39i | 2500 ± 300o | 0.0055 ± 0.0011k | 3200 ± 900g |
| Ri + T1 | 163.59 ± 1.39h | 600 ± 300n | 0.0003 ± 0.0011m | 3600 ± 900g |
| Ri + T2 | 301.07 ± 1.39e | 53,900 ± 300a | 0.0179 ± 0.0011h | 14,400 ± 900a |
| CW + VC | 47.12 ± 1.39i | 6700 ± 300m | 0.0142 ± 0.0011i | 4500 ± 900f |
| CW + T1 | 167.42 ± 1.39h | 22,600 ± 300e | 0.0134 ± 0.0011i | 4100 ± 900f |
| CW + T2 | 310.91 ± 1.39b | 12,600 ± 300i | 0.0041 ± 0.0011k | 8500 ± 900c |
| VC + T1 | 166.53 ± 1.39h | 13,400 ± 300i | 0.0080 ± 0.0011j | 5300 ± 900e |
| VC + T2 | 308.06 ± 1.39b | 600 ± 300n | 0.0002 ± 0.0011m | 2600 ± 900g |
| Tasp + Ri + CW | 47.70 ± 1.39i | 40,700 ± 300c | 0.0853 ± 0.0011a | 14,500 ± 900a |
| Tasp + Ri + VC | 47.42 ± 1.39i | 39,200 ± 300d | 0.0827 ± 0.0011b | 13,700 ± 900a |
| Tasp + Ri + T1 | 163.53 ± 1.39h | 42,700 ± 300b | 0.0260 ± 0.0011f | 12,300 ± 900b |
| Tasp + Ri + T2 | 274.81 ± 1.39f | 7900 ± 300l | 0.0029 ± 0.0011l | 3500 ± 900g |
| Ri + CW + VC | 48.17 ± 1.39i | 13,400 ± 300i | 0.0277 ± 0.0011e | 10,800 ± 900b |
| Ri + CW + T1 | 164.55 ± 1.39h | 17,000 ± 300f | 0.0103 ± 0.0011j | 800 ± 900h |
| Ri + CW + T2 | 304.54 ± 1.39c | 16,300 ± 300g | 0.0053 ± 0.0011k | 8700 ± 900c |
| CW + VC + T1 | 165.11 ± 1.39h | 4800 ± 300m | 0.0029 ± 0.0011l | 7700 ± 900d |
| CW + VC + T2 | 306.41 ± 1.39c | 6000 ± 300m | 0.0019 ± 0.0011l | 10,900 ± 900b |
| ptreatment | p<0.0001 | p<0.0001 | p<0.0001 | p<0.0001 |
Table 6 shows the effects of salinity and combined biostimulant applications on the ion composition of lettuce leaves. Salt treatments alone (T1 and T2) sharply reduced the Ca/Na ratio relative to the control (0.0157 and 0.0150, respectively), reflecting significant disruption of ion homeostasis under salinity stress; several biostimulant-salinity combinations, however, showed even lower ratios (e.g., Ri + CW + T1 = 0.0094, Tasp + T2 = 0.0111), indicating that this imbalance was not unique to salinity alone. Magnesium concentrations under T1 and T2 (19,600 and 19,400 mg kg−1 DW, respectively) were also markedly lower than the control (23,800 mg kg−1 DW); notably, several biostimulant combinations without added salinity—most prominently Ri + VC (9600 mg kg−1 DW)—showed even greater Mg reductions, indicating that Mg depletion in this dataset was not exclusively linked to salt stress.
Calcium (Ca) concentrations also reflected treatment-specific effects. Salinity alone reduced Ca by up to 28% at 50 mM NaCl, with a smaller reduction (~8%) at 150 mM NaCl, compared to the control group. Calcium was similarly recovered; the Tasp + T1 combination increased Ca by 37% compared to T1 alone, while the Ri + T2 combination increased Ca by 65% compared to T2 alone.
Combined applications of biostimulants mitigated the adverse ionic effects of salinity compared to corresponding treatments using salt alone. In addition, Ri + T1 and Ri + T2 combinations maintained the highest Ca/Na ratios (0.0317; a 2.0-fold increase compared to T1; and 0.0266; a 1.8-fold increase compared to T2) and the highest Mg concentrations (21,300 mg kg−1 DW; a 9% increase compared to T1; and 33,600 mg kg−1 DW, a 73% increase compared to T2); this demonstrates that R. intraradices-based applications are particularly effective in supporting foliar ion homeostasis under both moderate and severe salinity stress (Table 6). Applications containing VC and CW also markedly improved the Ca/Na ratio, with CW + VC and Ri + CW + VC producing an approximately 8.5- to 9-fold increase compared to T2 alone, further indicating coordinated regulation of divalent cations under salinity stress.
Table 6: Effects of combined plant biostimulant applications on calcium content (mg kg−1 DW), the Ca/Na ratio, and magnesium content (mg kg−1 DW) in lettuce under salinity stress.
| Treatments | Ca (mg kg−1) | Ca/Na | Mg (mg kg−1) |
|---|---|---|---|
| Control | 52,500 ± 200h | 0.1653 ± 0.0007b | 23,800 ± 100d |
| Tasp | 52,000 ± 200h | 0.1301 ± 0.0007d | 19,300 ± 100g |
| Ri | 47,100 ± 200l | 0.1196 ± 0.0007e | 22,800 ± 100e |
| CW | 54,500 ± 200g | 0.1262 ± 0.0007d | 20,800 ± 100f |
| VC | 77,300 ± 200b | 0.1893 ± 0.0007a | 22,000 ± 100e |
| T1 | 37,800 ± 200o | 0.0157 ± 0.0007h | 19,600 ± 100g |
| T2 | 48,500 ± 200k | 0.0150 ± 0.0007h | 19,400 ± 100g |
| Tasp + Ri | 48,600 ± 200k | 0.1111 ± 0.0007f | 18,500 ± 100h |
| Tasp + CW | 57,100 ± 200e | 0.1235 ± 0.0007e | 15,700 ± 100i |
| Tasp + VC | 40,200 ± 200p | 0.0886 ± 0.0007g | 16,600 ± 100i |
| Tasp + T1 | 51,800 ± 200h | 0.0316 ± 0.0007h | 15,700 ± 100i |
| Tasp + T2 | 33,600 ± 200u | 0.0111 ± 0.0007i | 14,500 ± 100j |
| Ri + CW | 55,200 ± 200f | 0.1185 ± 0.0007e | 24,300 ± 100d |
| Ri + VC | 8600 ± 200v | 0.0187 ± 0.0007h | 9600 ± 100k |
| Ri + T1 | 51,800 ± 200h | 0.0317 ± 0.0007h | 21,300 ± 100f |
| Ri + T2 | 79,900 ± 200a | 0.0266 ± 0.0007h | 33,600 ± 100a |
| CW + VC | 63,500 ± 200c | 0.1350 ± 0.0007d | 17,500 ± 100h |
| CW + T1 | 36,500 ± 200r | 0.0218 ± 0.0007h | 15,800 ± 100i |
| CW + T2 | 35,200 ± 200s | 0.0113 ± 0.0007i | 15,500 ± 100j |
| VC + T1 | 34,500 ± 200t | 0.0207 ± 0.0007h | 15,500 ± 100j |
| VC + T2 | 44,500 ± 200m | 0.0145 ± 0.0007i | 20,900 ± 100f |
| Tasp + Ri + CW | 29,400 ± 200w | 0.0617 ± 0.0007g | 19,600 ± 100g |
| Tasp + Ri + VC | 31,700 ± 200v | 0.0668 ± 0.0007g | 19,300 ± 100g |
| Tasp + Ri + T1 | 27,500 ± 200x | 0.0168 ± 0.0007h | 17,600 ± 100h |
| Tasp + Ri + T2 | 55,700 ± 200f | 0.0202 ± 0.0007h | 25,400 ± 100c |
| Ri + CW + VC | 61,300 ± 200d | 0.1272 ± 0.0007d | 23,600 ± 100d |
| Ri + CW + T1 | 15,500 ± 200y | 0.0094 ± 0.0007i | 10,300 ± 100k |
| Ri + CW + T2 | 41,600 ± 200o | 0.0137 ± 0.0007i | 16,200 ± 100i |
| CW + VC + T1 | 49,500 ± 200j | 0.0300 ± 0.0007h | 15,600 ± 100j |
| CW + VC + T2 | 42,400 ± 200n | 0.0139 ± 0.0007i | 16,500 ± 100i |
| ptreatment | p<0.0001 | p<0.0001 | p<0.0001 |
3.5 Mycorrhizal Colonization, Soil Spore Density, and Mycorrhizal Dependency under Salinity Stress
Table 7 shows the effects of combined plant biostimulant treatments on root colonization, soil spore density, and MD in lettuce under salinity stress. Applications containing only R. intraradices or combined with salinity (Ri, Ri + T1, Ri + T2) showed the highest root colonization rates above 90%, indicating strong AMF formation. In contrast, combinations containing both organic substrates, particularly Ri + CW + VC, exhibited the lowest colonization rate (52%) despite the presence of AMF, highlighting the effect of organic amendments on colonization patterns (Table 7).
Soil spore density followed a similar trend; Ri + T2 (14.6 spores g−1) and Tasp + Ri + T2 (14 spores g−1) showed the highest densities, while Ri + CW + VC (6.6 spores g−1) showed the lowest density (Table 7).
MD was highest in treatments combining AMF with organic substrates, including Ri + VC (50.45%), Tasp + Ri + CW (52.36%), Tasp + Ri + VC (53.57%), and Ri + CW + VC (54.92%), with the highest value observed in Ri + CW + VC (54.92%), compared with 18.99% in Ri alone. This indicates that lettuce growth under salinity conditions is more dependent on the functional contribution of mycorrhizal associations than on colonization density (Table 7).
Table 7 shows that some applications, particularly those containing organic substrates (Ri + VC, Tasp + Ri + CW, Tasp + Ri + VC, and Ri + CW + VC), exhibit high MD despite variable root colonization and spore density values.
Table 7: Effects of combined plant biostimulant treatments on root colonization, soil spore density, and mycorrhizal dependency in lettuce under salinity stress.
| Treatments | Root Colonization (%) | Soil Spore Density (spores g−1 soil) | Mycorrhizal Dependence Rate (%) |
|---|---|---|---|
| Ri | 92.00 ± 2.04ab | 13.00 ± 1.27ab | 18.99 |
| Tasp + Ri | 59.00 ± 2.04h | 7.00 ± 1.27e | 30.27 |
| Ri + CW | 80.00 ± 2.04e | 9.80 ± 1.27c | 48.57 |
| Ri + VC | 91.00 ± 2.04a-c | 10.40 ± 1.27c | 50.45 |
| Ri + T1 | 92.00 ± 2.04ab | 13.60 ± 1.27ab | 11.85 |
| Ri + T2 | 96.00 ± 2.04a | 14.60 ± 1.27a | 8.78 |
| Tasp + Ri + CW | 72.00 ± 2.04f | 9.60 ± 1.27cd | 52.36 |
| Tasp + Ri + VC | 80.00 ± 2.04e | 7.80 ± 1.27de | 53.57 |
| Tasp + Ri + T1 | 66.00 ± 2.04g | 13.60 ± 1.27ab | 24.29 |
| Tasp + Ri + T2 | 85 ± 2.04c-e | 14.00 ± 1.27a | 21.84 |
| Ri + CW + VC | 52.00 ± 2.04ı | 6.60 ± 1.27e | 54.92 |
| Ri + CW + T1 | 82.00 ± 2.04de | 11.60 ± 1.27bc | 45.36 |
| Ri + CW + T2 | 87.00 ± 2.04b-d | 13.80 ± 1.27a | 42.33 |
| ptreatment | p<0.0001 | p<0.0001 |
3.6 Effects of Biostimulant Treatments on Soil Chemical Properties
Table 8 shows the effects of combined plant biostimulant applications on substrate EC and soil pH under salinity stress. Most biostimulant-based combinations remained below an EC of 4.83 dS m−1, while salt treatments applied alone (T1 and T2) resulted in the highest EC values, reaching 2.20 dS m−1 for T1 and 6.03 dS m−1 for T2. EC values were kept close to the control level (1.41–1.70 dS m−1) in applications such as Tasp + Ri, Ri + VC, and CW + VC, indicating limited accumulation of soluble salts in the soil. Under high salinity, combined applications (Ri + CW + T2 and CW + VC + T2) showed significantly lower EC values compared to T2 applied alone, indicating that biostimulant combinations partially reduced salt-induced EC increases (Table 8).
While the pH values of most combination treatments remained within the moderate EC range, the salinity treatments (T1 and T2) were associated with higher substrate pH values compared to the untreated control group (4.66); the final pH values of these treatments were measured at 7.60 and 7.32, respectively. The initial pH of the growing medium was 7.06.
Therefore, the final pH value of T1 (7.60) was higher than the initial substrate pH rather than being the same. In contrast, treatments containing organic substrates—particularly combinations involving VC and CW, such as CW + VC, Tasp + Ri + CW, and Ri + CW + VC—maintained pH values close to those of the untreated control group (4.59–4.72) (Table 8).
Table 8: Effects of combined plant biostimulant applications on substrate EC and soil pH under salinity stress.
| Treatments | EC (dS m−1) | Soil pH |
|---|---|---|
| Control | 1.42 ± 0.16f | 4.66 ± 0.05f |
| Tasp | 1.44 ± 0.16f | 4.68 ± 0.05f |
| Ri | 1.44 ± 0.16f | 4.68 ± 0.05f |
| CW | 1.70 ± 0.16ef | 4.68 ± 0.05f |
| VC | 1.58 ± 0.16f | 4.59 ± 0.05f |
| T1 | 2.20 ± 0.16d | 7.60 ± 0.05a |
| T2 | 6.03 ± 0.16a | 7.32 ± 0.05a |
| Tasp + Ri | 3.19 ± 0.16cd | 4.64 ± 0.05f |
| Tasp + CW | 3.53 ± 0.16c | 6.73 ± 0.05bc |
| Tasp + VC | 3.47 ± 0.16c | 6.80 ± 0.05b |
| Tasp + T1 | 2.51 ± 0.16d | 5.78 ± 0.05de |
| Tasp + T2 | 4.61 ± 0.16b | 6.17 ± 0.05cd |
| Ri + CW | 1.76 ± 0.16ef | 5.59 ± 0.05e |
| Ri + VC | 1.41 ± 0.16f | 6.10 ± 0.05cd |
| Ri + T1 | 2.44 ± 0.16d | 5.89 ± 0.05de |
| Ri + T2 | 4.54 ± 0.16b | 6.12 ± 0.05cd |
| CW + VC | 1.70 ± 0.16ef | 4.72 ± 0.05f |
| CW + T1 | 2.65 ± 0.16d | 6.01 ± 0.05de |
| CW + T2 | 4.70 ± 0.16b | 6.35 ± 0.05bc |
| VC + T1 | 2.57 ± 0.16d | 6.01 ± 0.05de |
| VC + T2 | 4.64 ± 0.16b | 6.26 ± 0.05c |
| Tasp + Ri + CW | 1.64 ± 0.16ef | 5.91 ± 0.05de |
| Tasp + Ri + VC | 2.57 ± 0.16d | 6.33 ± 0.05bc |
| Tasp + Ri + T1 | 1.94 ± 0.16e | 6.29 ± 0.05c |
| Tasp + Ri + T2 | 4.51 ± 0.16b | 6.61 ± 0.05bc |
| Ri + CW + VC | 2.71 ± 0.16d | 6.23 ± 0.05c |
| Ri + CW + T1 | 3.90 ± 0.16c | 5.64 ± 0.05e |
| Ri + CW + T2 | 4.74 ± 0.16b | 5.88 ± 0.05de |
| CW + VC + T1 | 4.03 ± 0.16c | 5.67 ± 0.05e |
| CW + VC + T2 | 4.83 ± 0.16b | 5.70 ± 0.05e |
| ptreatment | p<0.0001 | p<0.0001 |
Salt stress is a major limiting factor for lettuce growth and productivity, primarily through disruption of water uptake, ionic balance, and photosynthetic efficiency, ultimately leading to reduced biomass accumulation and quality deterioration [32]. While previous studies have demonstrated that individual biostimulants such as plant growth–promoting rhizobacteria (PGPR), AMF, amino acids, or organic fertilizers can partially alleviate salt-induced damage by enhancing nutrient acquisition and reducing oxidative stress [33,34], the present study provides a comprehensive evaluation of multi-component biostimulant combinations, offering novel insights into their combined effects under salinity stress.
The superior performance of combination treatments applied under salinity stress—particularly the CW + VC, Ri + CW, and Tasp + Ri combinations when combined with 50 or 150 mM NaCl—was clearly evident in both morphological and physiological characteristics; this finding is consistent with the fact that, compared to the corresponding salt-only treatments, these combinations consistently exhibited the highest DW, biomass, and photosynthetic performance values (Table 2, Table 3).
These treatments consistently enhanced shoot and root development and maintained higher photosynthetic performance under saline conditions (Table 3). In contrast to the moderate benefits typically reported for single biostimulant applications [35], the observed responses indicate that microbial–organic interactions operate through complementary and reinforcing mechanisms.
Improved photosynthetic efficiency in the most effective combinations further supports this interpretation. The maintenance of chlorophyll content and photosynthetic activity under salinity stress reflects enhanced protection of the photosynthetic apparatus, which is particularly sensitive to ionic toxicity and osmotic imbalance [36]. The present results confirm that multi-component biostimulant strategies are more effective than single inputs in preserving photosynthetic integrity, thereby sustaining biomass production under adverse conditions.
Leaf color parameters (L*, a*, b*) provided additional evidence of improved physiological status in lettuce subjected to combined treatments. The highest L values were recorded in treatments combining CW with salinity or vermicompost (e.g., CW + T2, CW + T1, Ri + CW + T1, CW + VC + T1; Table 4), suggesting that coconut-waste-based combinations were particularly associated with increased leaf lightness under salt stress. Ri + CW + VC and Tasp + Ri + VC, in contrast, maintained L values closer to the control range, indicating that leaf lightness responses were treatment-specific rather than uniformly enhanced across all high-performing combinations. These visual quality improvements are directly linked to chlorophyll preservation and metabolic balance and represent an important agronomic advantage, as market acceptance of leafy vegetables is strongly influenced by leaf appearance [37].
The pronounced increase in antioxidant enzyme activities (CAT and APX) under combination treatments highlights the central role of oxidative stress regulation in salinity tolerance. The increased reactive oxygen species (ROS) scavenging capacity under salt stress was most pronounced in the CW + VC combination at a 50 mM NaCl concentration; this combination exhibited the highest catalase activity among all salt-stressed groups (a 156% increase compared to T1 alone), and the CW combination, which exhibited the highest ascorbate peroxidase activity at both 50 and 150 mM NaCl concentrations (a 52% and 35% increase compared to T1 and T2 alone, respectively).
When evaluated together, these findings indicate that combinations based on CW coordinate enzymatic defense pathways more efficiently than salinity applied alone (Table 4). This coordinated activation of antioxidant systems reduces membrane damage and supports metabolic continuity under high salinity, in agreement with recent reports emphasizing the importance of integrated stress mitigation pathways [38].
Ion homeostasis emerged as another critical mechanism underlying the observed stress tolerance. Under salinity stress, the Tasp + Ri + T1 combination reduced Na+ accumulation by 32% and increased the K+/Na+ ratio by 3.6-fold compared to T1 alone, while the Ri + T2 combination reduced Na+ accumulation by 7% and increased the K+/Na+ ratio 4.6-fold compared to T2 alone (Table 5, Table 6). The combinations containing the same R. intraradices most effectively maintained the Ca2+/Na+ ratio and Mg concentration at both salinity levels; this indicates that Rhizophagus intraradices plays a central role in regulating cation selectivity and ion transport under salt stress.
This selective ion regulation is consistent with the known roles of AMF and organic amendments in enhancing membrane selectivity, root absorption efficiency, and rhizosphere buffering capacity [39]. Such improvements in ionic balance are essential for maintaining enzymatic activity and cellular integrity under saline environments. While root colonization rates were generally highest in treatments containing R. intraradices alone or combined with salinity (Ri, Ri + T1, Ri + T2; Table 7), the organic-amendment-containing combination Ri + CW + VC exhibited the lowest colonization percentage (52%) despite showing the highest MD (54.92%). This apparent decoupling may be explained by reduced host carbon allocation to fungal colonization under conditions of elevated nutrient availability, a mechanism consistent with field-based evidence that phosphorus enrichment suppresses AMF colonization [40]. It should be noted that the MD was calculated relative to an untreated control group, rather than a treatment-appropriate control group that did not receive AMF; therefore, the reported dependence values reflect the combined growth response of organic fertilizers and/or salinity treatment applied alongside AMF, rather than the contribution of AMF alone. Consequently, the current findings should be interpreted as an indicator suggesting that the root colonization percentage may not always reflect the overall growth benefit associated with AMF-containing combinations, rather than serving as a direct measure of the isolated functional contribution of AMF symbiosis alone.
At the end of the growing period, a value of 1.42 dS m−1 was reached in the unsalted control group. This increase may be related to the residual nutrient load in the commercial peat substrate and the gradual accumulation of dissolved ions through irrigation and fertilization under the limited drainage conditions of the pots; this phenomenon has been previously reported for peat-based growing media [41]. Although the final EC value of the control group was slightly above the salinity threshold of approximately 1.3 dS m−1 reported for lettuce, this value was not caused by the applied NaCl treatments. In contrast, the EC value rose to 2.20 dS m−1 with the 50 mM NaCl (T1) treatment and to 6.03 dS m−1 with the 150 mM NaCl (T2) treatment; this corresponds to net increases of 0.78 and 4.61 dS m−1 compared to the control group, respectively. These results indicate a significant additional increase in substrate EC associated with increasing NaCl concentration.
Finally, improvements in soil physicochemical properties highlight the indirect but essential role of biostimulant combinations in salinity mitigation. Under conditions below 150 mM NaCl, combined treatments resulted in lower EC values (4.51–4.83 dS m−1) compared to the T2 treatment alone (6.03 dS m−1); in contrast, the response observed under conditions below 50 mM NaCl was more variable. These results indicate that biostimulant combinations reduce the increase in substrate EC associated with NaCl application, particularly at higher salinity levels. Stabilization of soil pH and EC within favorable ranges under combined treatments not subjected to salinity (Table 8) confirms that integrated biostimulants can modify the rhizosphere environment, reduce salt accumulation, and enhance nutrient availability. A marked change was also observed in substrate pH during the growing period. The initial pH of the peat + perlite growing medium was 7.06, whereas the final pH of the untreated control was 4.66. Since no NaCl was applied to the control, this decrease occurred independently of the imposed salinity treatments. The observed change may reflect alterations in the growing medium during the cultivation period under the irrigation and fertilization conditions of the experiment. However, the specific processes responsible for the pH decrease were not directly measured in the present study, and therefore no single mechanism can be assigned to this change. In contrast, the higher final pH values observed in T1 (7.60) and T2 (7.32) indicate that the pH response of the salinity treatments differed from that of the untreated control. These findings align with previous reports demonstrating that organic amendments and AMF jointly improve soil structure and buffering capacity under saline conditions [42].
Overall, the discussion demonstrates that the effectiveness of multi-component biostimulant strategies arises from the simultaneous regulation of growth, photosynthesis, antioxidant defense, ion homeostasis, symbiotic efficiency, and soil properties. This integrated response explains the superior performance of lettuce under salinity stress and highlights the potential of combined microbial–organic biostimulants as sustainable tools for salt-affected production systems.
This study demonstrates that combined biostimulant applications effectively enhance structural growth, physiological performance, antioxidant defense capacity, ion balance, soil properties, and leaf quality in lettuce exposed to salinity stress. Unlike previous studies that primarily focused on individual inputs, the present findings clearly reveal the advantages of combining multiple components in biostimulant strategies.
Carefully formulated combinations of microbial agents (AMF and Trichoderma asperellum) and organic amendments (vermicompost and coconut waste) represent a promising and sustainable approach to improving lettuce resilience in salt-affected growing conditions. The consistent improvements observed in morphological, physiological, and biochemical characteristics under salinity stress—particularly in the CW + VC, Ri + CW, and Tasp + Ri combinations applied with 50 or 150 mM NaCl—provide a solid foundation for the development of optimized and field-applicable biostimulant formulations. Future research should focus on elucidating the underlying molecular and metabolomic mechanisms and validating these results under field conditions to support broader agricultural applications.
Acknowledgement:
Funding Statement: This work was supported by the Adıyaman University Scientific Research Projects Coordination Unit under Project No. ZFMAP/2024-0001.
Author Contributions: Conceptualization: Hasret Güneş, Methodology: Hasret Güneş and Ceren Ayşe Bayram, Formal analysis and investigation: Hasret Güneş and Ceren Ayşe Bayram, Data curation: Hasret Güneş, Writing—original draft preparation: Hasret Güneş, Writing—review and editing: Hasret Güneş and Ceren Ayşe Bayram. All authors reviewed and approved the final version of the manuscript.
Availability of Data and Materials: The data that support the findings of this study are available from the corresponding author upon reasonable request.
Ethics Approval: This study did not involve any human participants or animals; therefore, ethical approval was not required.
Conflicts of Interest: The authors declare no conflicts of interest.
References
1. Shin YK , Bhandari SR , Jo JS , Song JW , Cho MC , Yang EY , et al. Response to salt stress in lettuce: changes in chlorophyll fluorescence parameters, phytochemical contents, and antioxidant activities. Agronomy. 2020; 10( 11): 1627. doi:10.3390/agronomy10111627. [Google Scholar] [CrossRef]
2. Balkaya A , Özgen R . The role and economic importance of lettuce cultivation in agricultural production in Turkey. In: Marul Tarımı (Özel Sayı). Ankara, Türkiye: Nobel Akademik Yayıncılık; 2019. [Google Scholar]
3. Al-Maskri A , Al-Kharusi L , Al-Miqbali H , Khan MM . Effects of salinity stress on growth of lettuce (Lactuca sativa) under closed-recycle nutrient film technique. Int J Agric Biol. 2010; 12( 3): 377– 80. [Google Scholar]
4. Sofo A , Lundegårdh B , Mårtensson A , Manfra M , Pepe G , Sommella E , et al. Different agronomic and fertilization systems affect polyphenolic profile, antioxidant capacity and mineral composition of lettuce. Sci Hortic. 2016; 204: 106– 15. doi:10.1016/j.scienta.2016.04.003. [Google Scholar] [CrossRef]
5. Altın U . Agronomic, physiological, and root morphological responses of different lettuce (Lactuca sativa L.) genotypes to salt stress [ master’s thesis]. Kayseri, Turkey: Erciyes University; 2023. [Google Scholar]
6. Ekmekçi E , Apan M , Kara T . The effect of salinity on plant growth. Anadolu J Agric Sci. 2005; 20( 3): 118– 25. [Google Scholar]
7. Güneş A , Alpaslan M , İnal A . Plant nutrition and fertilization. Ankara, Türkiye: Ankara Üniversitesi Ziraat Fakültesi; 2010. [Google Scholar]
8. Van Oosten MJ , Pepe O , De Pascale S , Silletti S , Maggio A . The role of biostimulants and bioeffectors as alleviators of abiotic stress in crop plants. Chem Biol Technolog Agric. 2017; 4( 1): 5. doi:10.1186/s40538-017-0089-5. [Google Scholar] [CrossRef]
9. del Buono D . Can biostimulants be used to mitigate the effect of anthropogenic climate change on agriculture? It is time to respond. Sci Total Environ. 2021; 751: 141763. doi:10.1016/j.scitotenv.2020.141763. [Google Scholar] [CrossRef]
10. Lanfranco L , Bonfante P , Genre A . The mutualistic interaction between plants and arbuscular mycorrhizal fungi. Microbiol Spectr. 2016; 4( 6): 1– 20. doi:10.1128/microbiolspec.FUNK-0012-2016. [Google Scholar] [CrossRef]
11. Evelin H , Devi TS , Gupta S , Kapoor R . Mitigation of salinity stress in plants by arbuscular mycorrhizal symbiosis: current understanding and new challenges. Front Plant Sci. 2019; 10: 470. doi:10.3389/fpls.2019.00470. [Google Scholar] [CrossRef]
12. Ahmad P , Hashem A , Abd-Allah EF , Alqarawi AA , John R , Egamberdieva D , et al. Role of Trichoderma harzianum in mitigating NaCl stress in Indian mustard (Brassica juncea L) through antioxidative defense system. Front Plant Sci. 2015; 6: 868. doi:10.3389/fpls.2015.00868. [Google Scholar] [CrossRef]
13. Yang F , Tian J , Fang H , Gao Y , Xu M , Lou Y , et al. Functional soil organic matter fractions, microbial community, and enzyme activities in a mollisol under 35 years manure and mineral fertilization. J Soil Sci Plant Nutr. 2019; 19( 2): 430– 9. doi:10.1007/s42729-019-00047-6. [Google Scholar] [CrossRef]
14. Singh P , Dubey P , Younis K , Yousuf O . A review on the valorization of coconut shell waste. Biomass Convers Biorefinery. 2024; 14( 7): 8115– 25. doi:10.1007/s13399-022-03001-2. [Google Scholar] [CrossRef]
15. Oliveira FDA , Marques IDS , Targino ADO , Cordeiro CJX , de Oliveira MKT , Régis LDL , et al. Effect of saline stress and calcium nitrate on lettuce grown on coconut fiber. J Agric Sci. 2021; 10( 11): 259. doi:10.5539/jas.v10n11p259. [Google Scholar] [CrossRef]
16. Witzel K , Acosta Motos JR , Atay E , Çiçek N , Mistríková V , Oney-Birol S , et al. Leveraging microorganisms and biostimulants: mitigating salinity stress in crops with agricultural biologicals. Plant Soil. 2026; 523( 2): 851– 73. doi:10.1007/s11104-025-07578-1. [Google Scholar] [CrossRef]
17. Büyük G , Bayram CA , İnan M , Kırpık M . The effect of organic and inorganic fertilizers on plant nutrient content and agronomic performance of stevia. J Plant Nutr. 2022; 45( 15): 2303– 14. doi:10.1080/01904167.2022.2063739. [Google Scholar] [CrossRef]
18. Güneş H , Durak ED , Demir S . Effects of some biocontrol agents and organic materials against Verticillium dahliae in lettuce (Lactuca sativa). Int J Agric Wildl Sci. 2022; 8( 2): 245– 55. [Google Scholar]
19. Rouphael Y , Colla G . Synergistic biostimulatory action: designing the next generation of plant biostimulants for sustainable agriculture. Front Plant Sci. 2018; 9: 1655. doi:10.3389/fpls.2018.01655. [Google Scholar] [CrossRef]
20. Nonthapa A , Iwai CB , Chankaew S , Falab S . Dual-purpose vermicompost for the growth promotion and suppression of damping-off disease on potted vegetable soybean. Plants. 2024; 13( 12): 1607. doi:10.3390/plants13121607. [Google Scholar] [CrossRef]
21. Awang Y , Shaharom AS , Mohamad RB , Selamat A . Chemical and physical characteristics of cocopeat-based media mixtures and their effects on the growth and development of Celosia cristata. Am J Agric Biol Sci. 2009; 4( 1): 63– 71. [Google Scholar]
22. McGuire RG . Reporting of objective color measurements. HortScience. 1992; 27( 12): 1254– 5. doi:10.21273/hortsci.27.12.1254. [Google Scholar] [CrossRef]
23. Güneş H . Effect of arbuscular mycorrhizal fungus (AMF) and biochar on Verticillium dahliae Kleb. and plant growth in pepper (Capsicum annuum L.) grown under salt stress [ dissertation]. Van, Türkiye: Van Yüzüncü Yıl University; 2022. [Google Scholar]
24. Jackson ML . Soil chemical analysis. Englewood Cliffs, NJ, USA: Prentice-Hall; 1958. [Google Scholar]
25. Havir EA , McHale NA . Regulation of catalase activity in leaves of Nicotiana sylvestris by high CO2. Plant Physiol. 1989; 89( 3): 952– 7. doi:10.1104/pp.89.3.952. [Google Scholar] [CrossRef]
26. Jebara S , Jebara M , Limam F , Aouani ME . Changes in ascorbate peroxidase, catalase, guaiacol peroxidase and superoxide dismutase activities in common bean (Phaseolus vulgaris) nodules under salt stress. J Plant Physiol. 2005; 162( 8): 929– 36. doi:10.1016/j.jplph.2004.10.005. [Google Scholar] [CrossRef]
27. Lück H . Catalase. In: Methods of enzymatic analysis. Cambridge, MA, USA: Academic Press; 1965. p. 885– 94. doi:10.1016/b978-0-12-395630-9.50158-4. [Google Scholar] [CrossRef]
28. Giovannetti M , Mosse B . An evaluation of techniques for measuring vesicular arbuscular mycorrhizal infection in roots. New Phytol. 1980; 85: 489– 500. doi:10.1111/J.1469-8137.1980.TB04556.X. [Google Scholar] [CrossRef]
29. Gerdemann JW , Nicolson TH . Spores of mycorrhizal Endogone species extracted from soil by wet sieving and decanting. Trans Br Mycol Soc. 1963; 46( 2): 235– 44. doi:10.1016/S0007-1536(63)80079-0. [Google Scholar] [CrossRef]
30. Declerck S , Plenchette C , Strullu DG . Mycorrhizal dependency of banana (Musa acuminata, AAA group) cultivar. Plant Soil. 1995; 176( 1): 183– 7. doi:10.1007/BF00017688. [Google Scholar] [CrossRef]
31. Richards LA . Diagnosis and improvement of saline and alkali soils. Washington, DC, USA: US Government Printing Office; 1954. doi:10.1097/00010694-195408000-00012. [Google Scholar] [CrossRef]
32. Breś W , Kleiber T , Markiewicz B , Mieloszyk E , Mieloch M . The effect of NaCl stress on the response of lettuce (Lactuca sativa L.). Agronomy. 2022; 12( 2): 244. doi:10.3390/agronomy12020244. [Google Scholar] [CrossRef]
33. Sun W , Shahrajabian MH . The application of arbuscular mycorrhizal fungi as microbial biostimulant, sustainable approaches in modern agriculture. Plants. 2023; 12( 17): 3101. doi:10.3390/plants12173101. [Google Scholar] [CrossRef]
34. Dere S . Mitigating the adverse effects of salt stress on pepper plants through arbuscular mycorrhizal fungi (AMF) and beneficial bacterial (PGPR) inoculation. Horticulturae. 2024; 10( 11): 1150. doi:10.3390/horticulturae10111150. [Google Scholar] [CrossRef]
35. Gedeon S , Ioannou A , Balestrini R , Fotopoulos V , Antoniou C . Application of biostimulants in tomato plants (Solanum lycopersicum) to enhance plant growth and salt stress tolerance. Plants. 2022; 11( 22): 3082. doi:10.3390/plants11223082. [Google Scholar] [CrossRef]
36. Li J , Forghieri G , Geelen D , Du Jardin P , Brown PH . The optimization of crop response to climatic stress through modulation of plant stress response mechanisms. Opportunities for biostimulants and plant hormones to meet climate challenges. New Phytol. 2026; 249( 1): 130– 51. doi:10.1111/nph.70701. [Google Scholar] [CrossRef]
37. Yang J , Song J , Liu J , Dong X , Zhang H , Jeong BR . Prolonged post-harvest preservation in lettuce (Lactuca sativa L.) by reducing water loss rate and chlorophyll degradation regulated through lighting direction-induced morphophysiological improvements. Plants. 2024; 13( 18): 2564. doi:10.3390/plants13182564. [Google Scholar] [CrossRef]
38. Rady MM , Elkelish A , Nady NM , Kusvuran S , Kusvuran A , Shaaban A , et al. Role of seed priming using natural biostimulants in reducing salt stress effects by reshaping physio-biochemical and antioxidant defense systems in glycine max seedlings. Front Plant Sci. 2025; 16: 1630537. doi:10.3389/fpls.2025.1630537. [Google Scholar] [CrossRef]
39. Kapadia C , Sayyed RZ , Ali El Enshasy H , Vaidya H , Sharma D , Patel N , et al. Halotolerant microbial consortia for sustainable mitigation of salinity stress, growth promotion, and mineral uptake in tomato plants and soil nutrient enrichment. Sustainability. 2021; 13( 15): 8369. doi:10.3390/su13158369. [Google Scholar] [CrossRef]
40. Treseder KK . A meta-analysis of mycorrhizal responses to nitrogen, phosphorus, and atmospheric CO2 in field studies. New Phytol. 2004; 164( 2): 347– 55. doi:10.1111/j.1469-8137.2004.01159.x. [Google Scholar] [CrossRef]
41. Rathier TM , Frink CR . Nitrate in runoff water from container grown juniper and Alberta spruce under different irrigation and N fertilization regimes. J Environ Hortic. 1989; 7( 1): 32– 5. doi:10.24266/0738-2898-7.1.32. [Google Scholar] [CrossRef]
42. Yu D , Miao Q , Shi H , Feng Z , Feng W . Effects of combined application of organic and inorganic fertilizers on physical and chemical properties in saline–alkali soil. Agronomy. 2024; 14( 10): 2236. doi:10.3390/agronomy14102236. [Google Scholar] [CrossRef]
Cite This Article
 Copyright © 2026 The Author(s). Published by Tech Science Press.
This work is licensed under a Creative Commons Attribution 4.0 International License , which permits unrestricted use, distribution, and reproduction in any medium, provided the original work is properly cited.
 Downloads
 Citation Tools
