
 Submit a Paper
 Propose a Special lssue
 Open Access
ARTICLE

A Monitoring Method for Transmission Tower Foots Displacement Based on Wind-Induced Vibration Response
1 School of Electronics and Information, Xi’an Polytechnic University, Xi’an, 710048, China
2 Xi’an Qinchuang Electric Co., Ltd., Xi’an, 710000, China
* Corresponding Author: Long Zhao. Email:
Structural Durability & Health Monitoring 2023, 17(6), 541-555. https://doi.org/10.32604/sdhm.2023.029760
Received 07 March 2023; Accepted 03 July 2023; Issue published 17 November 2023
 View Full Text
 Download PDF
Abstract
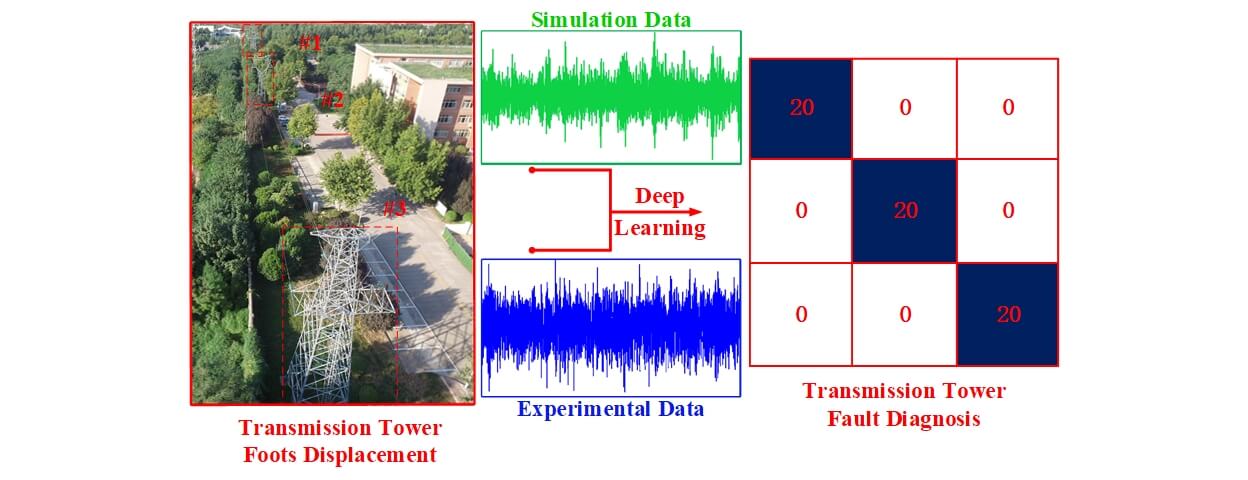
The displacement of transmission tower feet can seriously affect the safe operation of the tower, and the accuracy of structural health monitoring methods is limited at the present stage. The application of deep learning method provides new ideas for structural health monitoring of towers, but the current amount of tower vibration fault data is restricted to provide adequate training data for Deep Learning (DL). In this paper, we propose a DT-DL based tower foot displacement monitoring method, which firstly simulates the wind-induced vibration response data of the tower under each fault condition by finite element method. Then the vibration signal visualization and Data Transfer (DT) are used to add tower fault data samples to solve the problem of insufficient actual data quantity. Subsequently, the dynamic response test is carried out under different tower fault states, and the tower fault monitoring is carried out by the DL method. Finally, the proposed method is compared with the traditional online monitoring method, and it is found that this method can significantly improve the rate of convergence and recognition accuracy in the recognition process. The results show that the method can effectively identify the tower foot displacement state, which can greatly reduce the accidents that occurred due to the tower foot displacement.Graphic Abstract
Keywords
Ensuring the safe operation of transmission towers is crucial for maintaining a reliable power transmission network. Nonetheless, the demanding topography and adverse environmental circumstances frequently result in tower base displacement, structural modifications, and other malfunctions. Regrettably, current tower monitoring techniques exhibit their own constraints. Conventional manual inspection approaches encounter delays in information gathering, impeding the prompt identification of potential concerns. The effectiveness of online monitoring techniques employing dip and stress sensors in detecting minor damages is limited. The deformation monitoring system relying on satellite image processing is limited by terrain, which affects the accuracy of the monitoring process [1].
The analysis of vibration response presents a valuable means of detecting structural impairments in transmission towers by capturing variations in key parameters such as natural frequency. The domain of health monitoring for transmission towers, centered around vibration-based techniques, holds immense potential, with a multitude of effective approaches devised and validated in controlled laboratory environments [2]. Scholars have explored various approaches, including vibration testing on scaled-down transmission tower models, revealing how the presence of transmission wires affects tower performance. Furthermore, the authors have conducted a comparative analysis with fault detect methods based on numerical model [3]. In addition, researchers have proposed a tower leg settlement monitoring system based on structural inherent property analysis, which utilizes SSI method to analyze the impact of tower faults on frequency [4]. In order to improve the accuracy of Structural health monitoring, some scholars proposed a new method that combines simulation research with sensor fusion. Subsequently, the effectiveness and accuracy of this method were verified through a large number of numerical simulations and experiments. This method can also diagnose minor faults such as tower bolt looseness [5].
In vibration-based structural health monitoring, the careful choice and examination of fault features play a pivotal role. Signal processing techniques widely utilized include the peak value method [6], stochastic subspace identification [7], and variational mode decomposition [8], which are employed to extract distinctive parameters. These parameters are then compared under different working conditions to diagnose faults. In a recent study, researchers explored the potential of combining real-time modal identification with a localized approximation of a damage feature known as the interpolation error, proved effective in detecting and localizing damage caused by stiffness loss [9]. However, these methods lack robust “intelligent” processing capabilities, which hampers their online real-time diagnostic performance. Fortunately, the emergence of deep learning has revolutionized structural health monitoring [10]. Deep learning methods offer advantages over traditional data processing techniques by reducing manual intervention and improving monitoring speed and accuracy. Despite its potential, deep learning has yet to be applied in tower vibration monitoring due to challenges in obtaining sufficient labeled data from service towers and a lack of comprehensive tower failure databases [11].
This paper presents several notable contributions and novel findings, which can be summarized as follows:
(1) To address the challenge of tower foot displacement monitoring, a novel approach combining deep learning and data transfer methods has been proposed. This method simulates the actual data by building a simulation model, and expands the fault database through the data migration method. This not only ensures the accuracy of the data, but also enhances the model’s ability to resist noise interference. By integrating these techniques, a comprehensive monitoring solution for tower foot displacement is achieved.
(2) By leveraging the Continuous Wavelet Transform (CWT), it becomes feasible to visualize fault data and construct a comprehensive database for tower faults. This powerful technique enables the representation of fault data in a comprehensive manner, facilitating the creation of a robust and informative database for tower faults.
(3) During the training process, the input images from the database are fed into a Convolutional Neural Network (CNN) model, allowing the model to acquire knowledge and extract pertinent features. Additionally, the model can be utilized for visualized fault detection by inputting actual measurement data. By integrating the capabilities of CNN with real-time data, this approach synergistically enhances the precision and efficacy of fault detection.
2.1 Vibration Monitoring and CWT
The lattice structure of transmission towers makes them highly susceptible to wind-induced vibrations, as their dynamic nature causes vibrations when exposed to wind forces. These vibrations result from the tower’s response to wind load, which encompasses various degrees of freedom, ultimately forming a complex vibration system. Mathematically, the motion of a transmission tower can be described using a set of differential equations.
Vibration serves as a crucial indicator of the structural condition, reflecting changes in the tower’s vibration state such as frequency, mode shape, and damping ratio. To extract the tower’s vibration signal and analyze potential faults, a vibration monitoring method is employed. This approach enables structural health monitoring while the tower is in operation [12], allowing for continuous assessment of its condition as it undergoes structural changes.
This paper utilizes Continuous Wavelet Transform (CWT) to convert vibration signals into time-frequency images. These images encapsulate the combined distribution details of the original signal in both the time and frequency domains. Subsequently, these images are fed into a Convolutional Neural Network (CNN) for feature extraction and model training. Wavelet transform, as opposed to Fourier transform, employs a finite and decaying wavelet base to represent the time and frequency domain characteristics of the original signal. This method involves translating and scaling the wavelet base function [13]. For any function f(t)∈L2(R), CWT can be defined as:
where, α is the scale factor, τ is the displacement factor, ψ* is the conjugate complex of ψ.
The crucial aspect of the CWT method lies in the choice of the wavelet basis function, which should closely resemble the fault signal to a significant extent.
2.2 Convolution Neural Network
This paper focuses on the analysis and categorization of time-frequency images derived from wind-induced vibration response signals of the tower using a CNN. The ultimate objective is to classify the structural health condition of the tower. A Convolutional Neural Network (CNN) is a deep, feedforward neural network that incorporates convolution calculations. As a notable algorithm in the realm of deep learning, CNN holds significant prominence and finds extensive utilization across diverse domains like image recognition. Notably, in recent times, CNN has also emerged as a valuable tool for fault diagnosis in the field [14].
Fig. 1 illustrates the architecture of a CNN, comprising distinct layers such as the input layer, convolution layer, pooling layer, expansion layer, fully connected layer, and output layer. At the input layer, the RGB three-channel time-frequency image generated by CWT serves as the input. The convolution layer convolves the characteristic image from the preceding layer using specific convolution kernels and an offset value. The resulting characteristic image of this layer is obtained through the activation function relu. The pooling layer downsamples the computation and employs maximum pooling as the pooling method. The expansion layer transforms the last pooling layer into a one-dimensional vector [15]. This vector is then utilized as the input for the fully connected layer, which establishes the relationship between the input and output vectors. Finally, the flattened data passes through a fully connected layer and undergoes decision classification of samples using a softmax classifier.
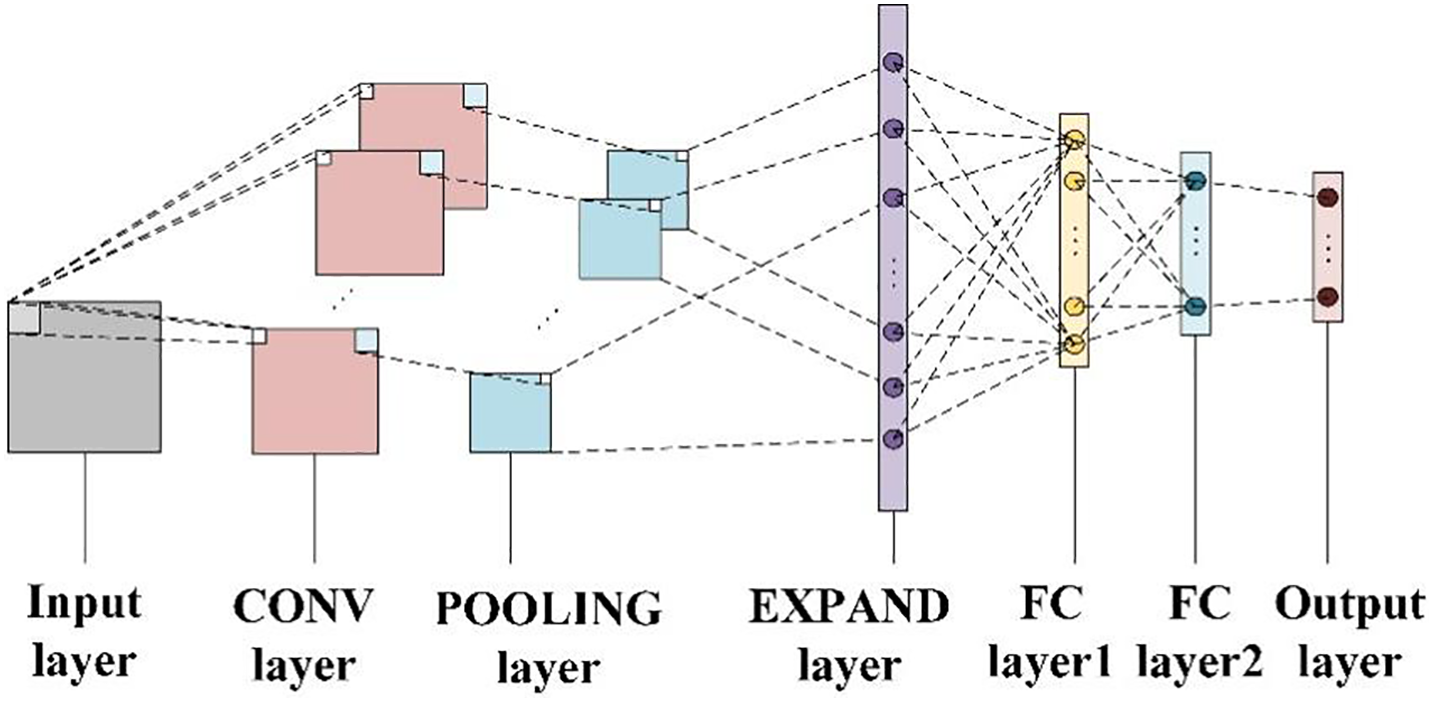
Figure 1: Convolution neural network structure diagram
2.3 Parameter Setting and Verification
In this study, we enhance the feature extraction process within the CNN network by incorporating two feature extraction layers. Each layer employs convolutional kernels of varying sizes, thereby enhancing the capability to extract features from time-frequency maps. This modification addresses the issue of potentially missing small feature quantities present in vibration signal time-frequency maps, which may occur when using large convolutional kernels in the original network model. The feature values obtained from different convolutional kernels exhibit variations. During feature fusion in the fully connected layer, these distinct feature values, pertaining to the same fault, can conditionally complement each other. This refinement in the convolutional neural network model enhances its effectiveness in tower fault diagnosis, leading to improved model accuracy.
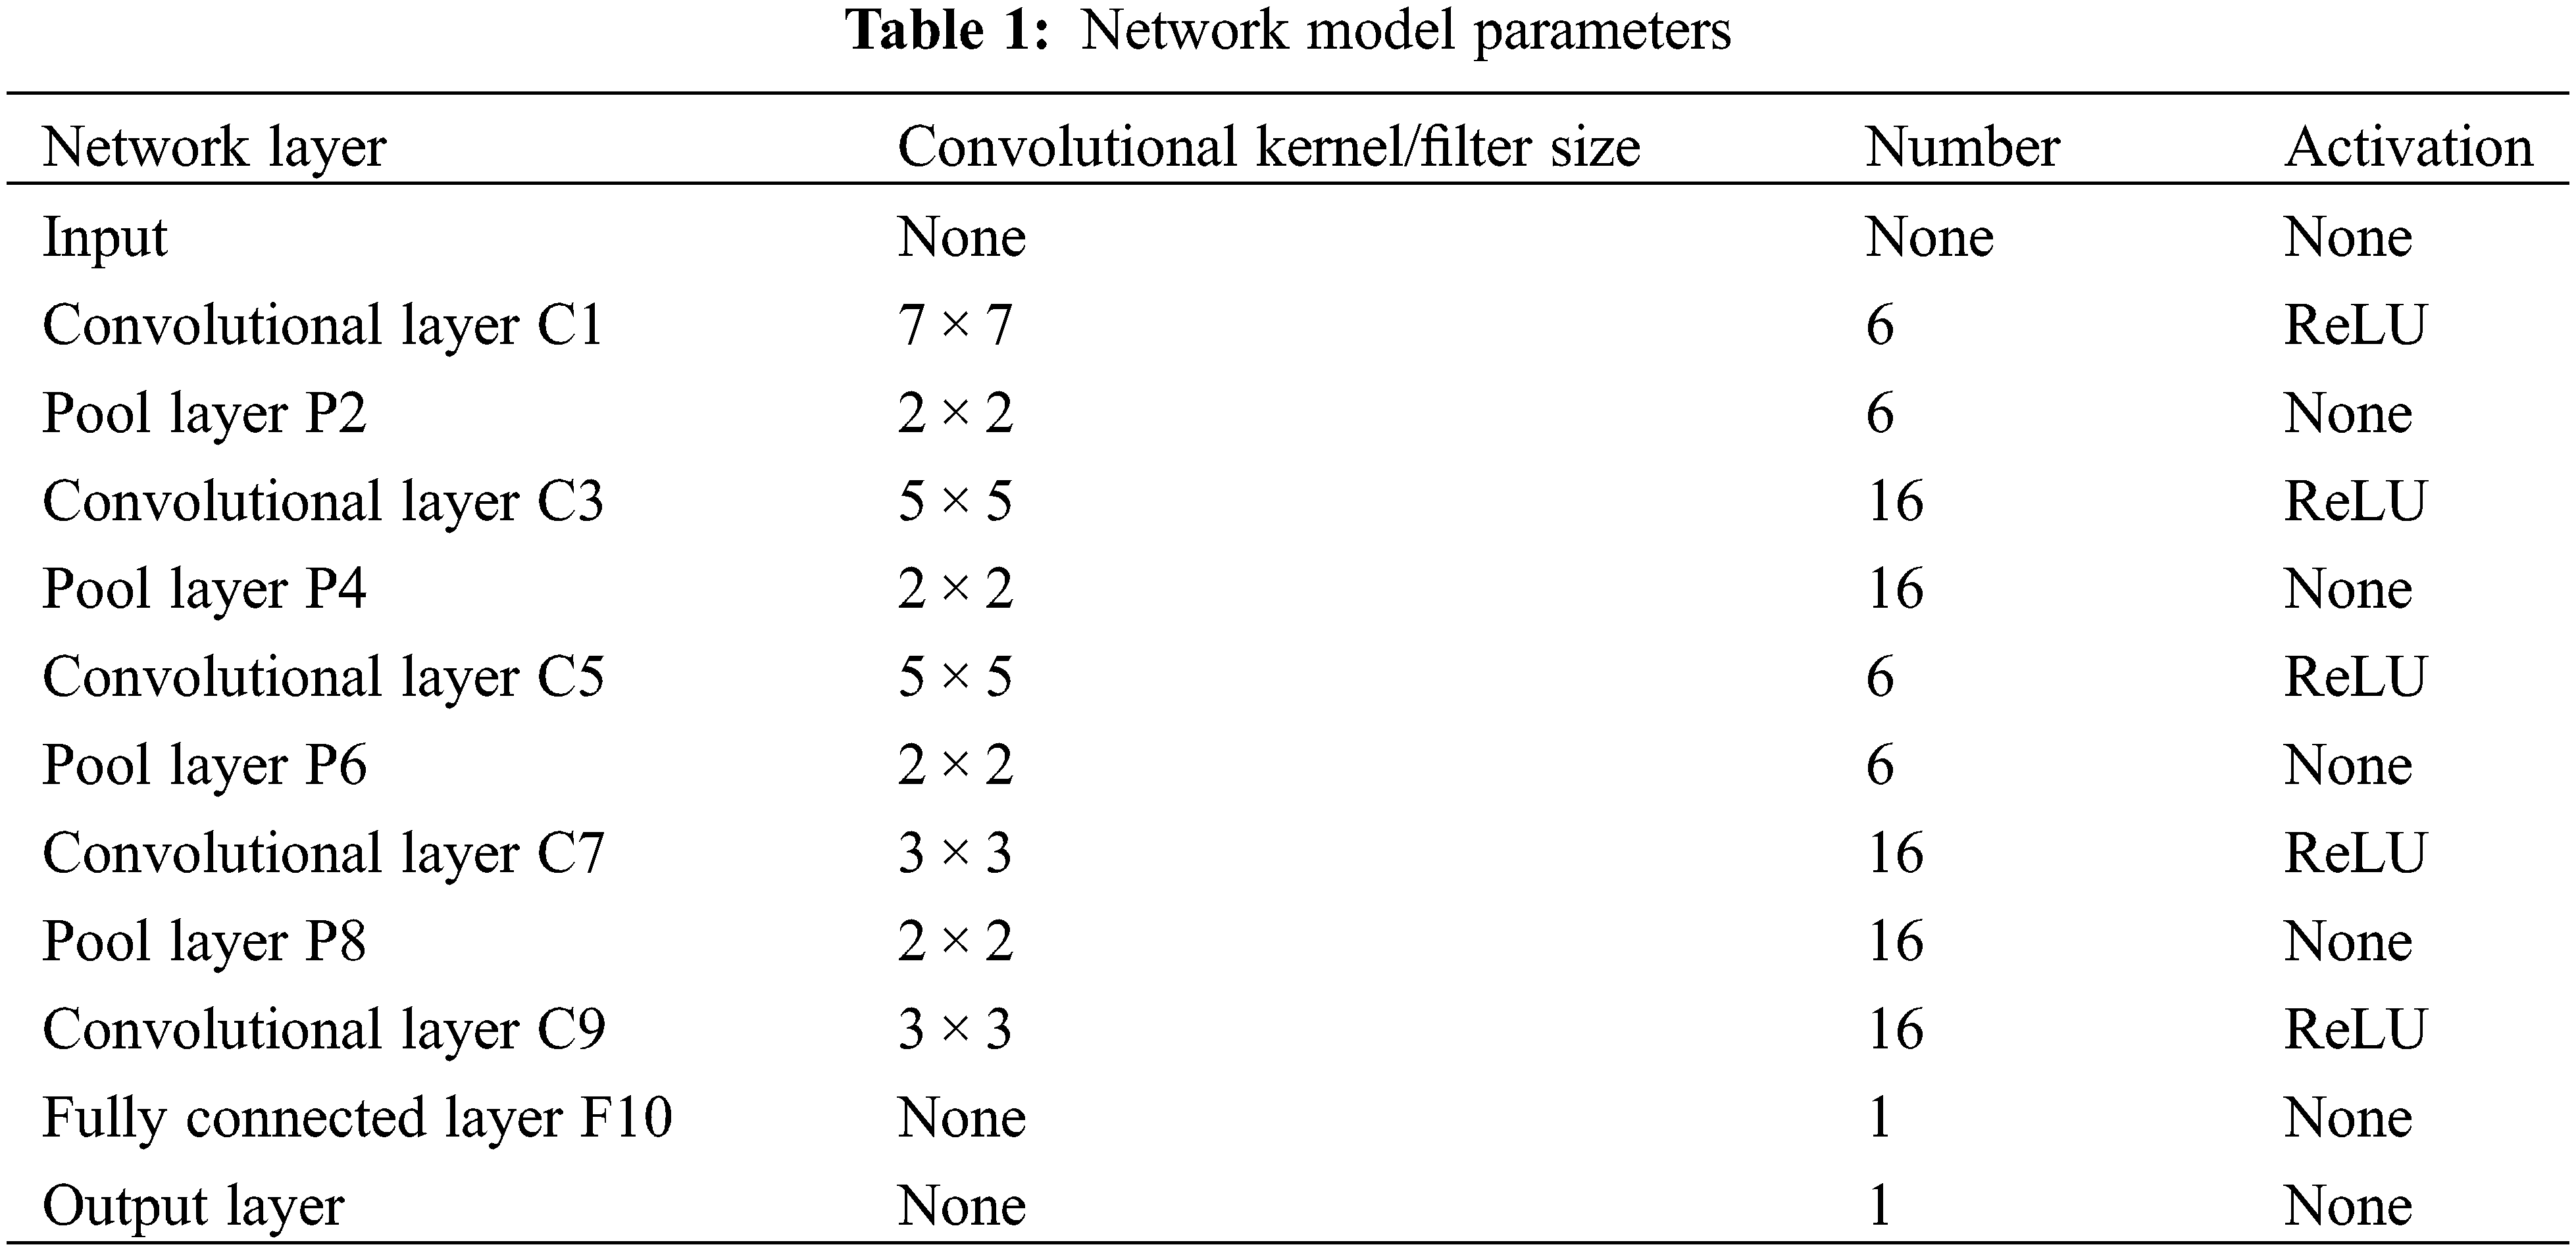
When deciding on the size of the convolutional kernel, it is crucial to consider the direct processing of the vibration signal’s time-frequency map by the initial convolutional layer. To mitigate the influence of noise energy on the network within the time-frequency map, a larger convolutional kernel is chosen for the C1 layer. This choice facilitates a broader perception field and effectively mitigates the impact of noise. Conversely, opting for smaller convolutional kernels in the C5 layer enables improved extraction of minute features from the time-frequency map of bearing vibration signals, thereby enhancing the network’s capacity for feature expression. The network model parameters are detailed in Table 1.
The research presented in this paper utilizes a test platform consisting of three towers and two stages, as depicted in Fig. 2, which is located at Xi’an Polytechnic University. Specifically, the tower fault data from Tower #2 was collected and subsequently compared with the numerical simulation data.
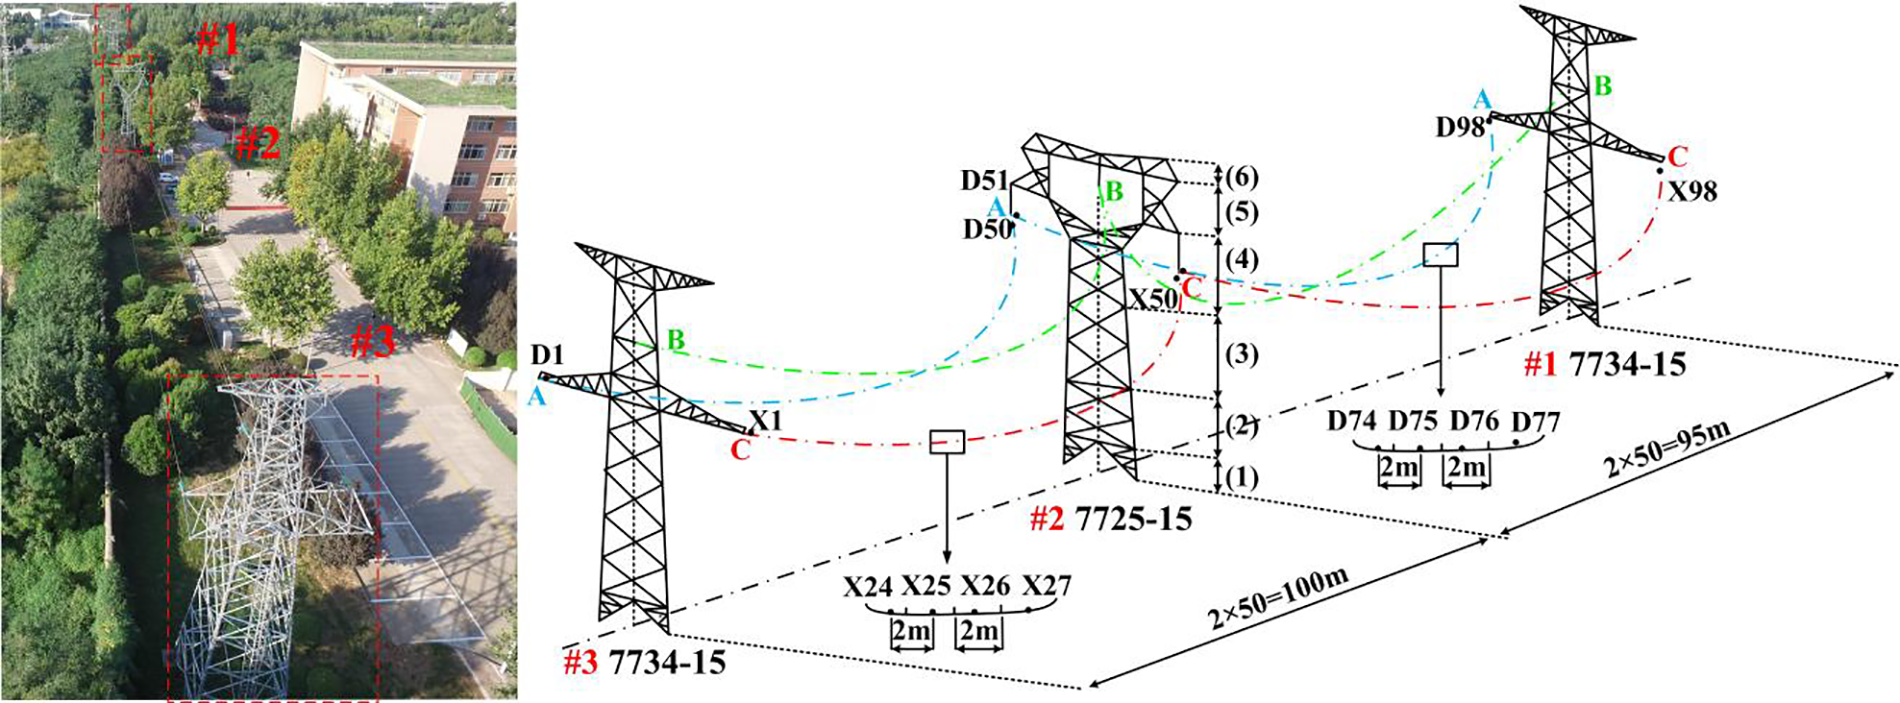
Figure 2: The testing facility at Xi’an Polytechnic University comprises three tower and two line platforms
The monitoring approach can be categorized into four distinct stages: (1) Utilizing the finite element method, wind-induced vibrations are simulated to generate tower vibration signals under different fault scenarios. (2) Data augmentation techniques are employed to enhance the vibration signals, thereby expanding the fault database for transmission towers. (3) The vibration signals are visualized using Continuous Wavelet Transform (CWT), and the fault database is established through data transformation. (4) The employed Convolutional Neural Network (CNN) model, which has undergone training, is employed to evaluate the tower’s foot displacement, and the obtained assessment outcomes are subsequently compared and analyzed for further examination.
3 Finite Element Analysis of Transmission Tower
3.1 Establishment of Numerical Model
In this research paper, a numerical model of a three-tower and two-gear system is constructed using the 110 kV tower as a foundation at Xi’an Polytechnic University. The significance of this model lies in its consideration of the coupling effect between the tower and the transmission line, thereby enhancing the accuracy of the fault database using actual test data. The tower’s overall height measures around 19 meters, featuring a root opening of approximately 3.103 meters along both the cross arm and the line’s direction. The tower structure predominantly utilizes angle steel, with Q345 and Q235 steel serving as the primary materials. To ensure an accurate representation of the stiffness of each constituent element in the real transmission line, a hybrid modeling approach that combines beam and rod elements is employed. This approach allows for a more precise depiction of the system’s characteristics. In particular, a hybrid model comprising beam-truss elements is established [16], where components subjected to axial force, shear force, bending moment, and torque are simplified as spatial beams. This approach allows for an effective representation of the various forces and moments experienced by the components. These beams represent members connected by flanges and welds, ensuring high-end stiffness. On the other hand, components and wires solely subjected to axial force are simplified as rods [17], representing members connected by bolts with lower-end stiffness, and are modeled using truss elements. During normal operation, the tower’s base is connected to a concrete ground pile through anchor bolts, creating a rigid connection that constrains all six degrees of freedom at the tower leg nodes.
To address the issue of differences between the numerical model and the actual situation, we accounted for the mass differences between the initial numerical model and the real structure. We simplified these components by representing them as equivalent concentrated masses, which were then incorporated into the initial finite element model. Through mass tuning, significant reductions in mode errors were achieved. Additionally, we divided the transmission tower into six sections and adjusted the material properties of each section accordingly. Drawing upon engineering insight and intuition, we identified the elastic modulus of all components as the parameter requiring updating. Consequently, we modified the elastic modulus of the primary and secondary materials for each section of the tower. Furthermore, we also adopted optimization methods to improve the quality of the model [18]. The model is depicted in Fig. 3.
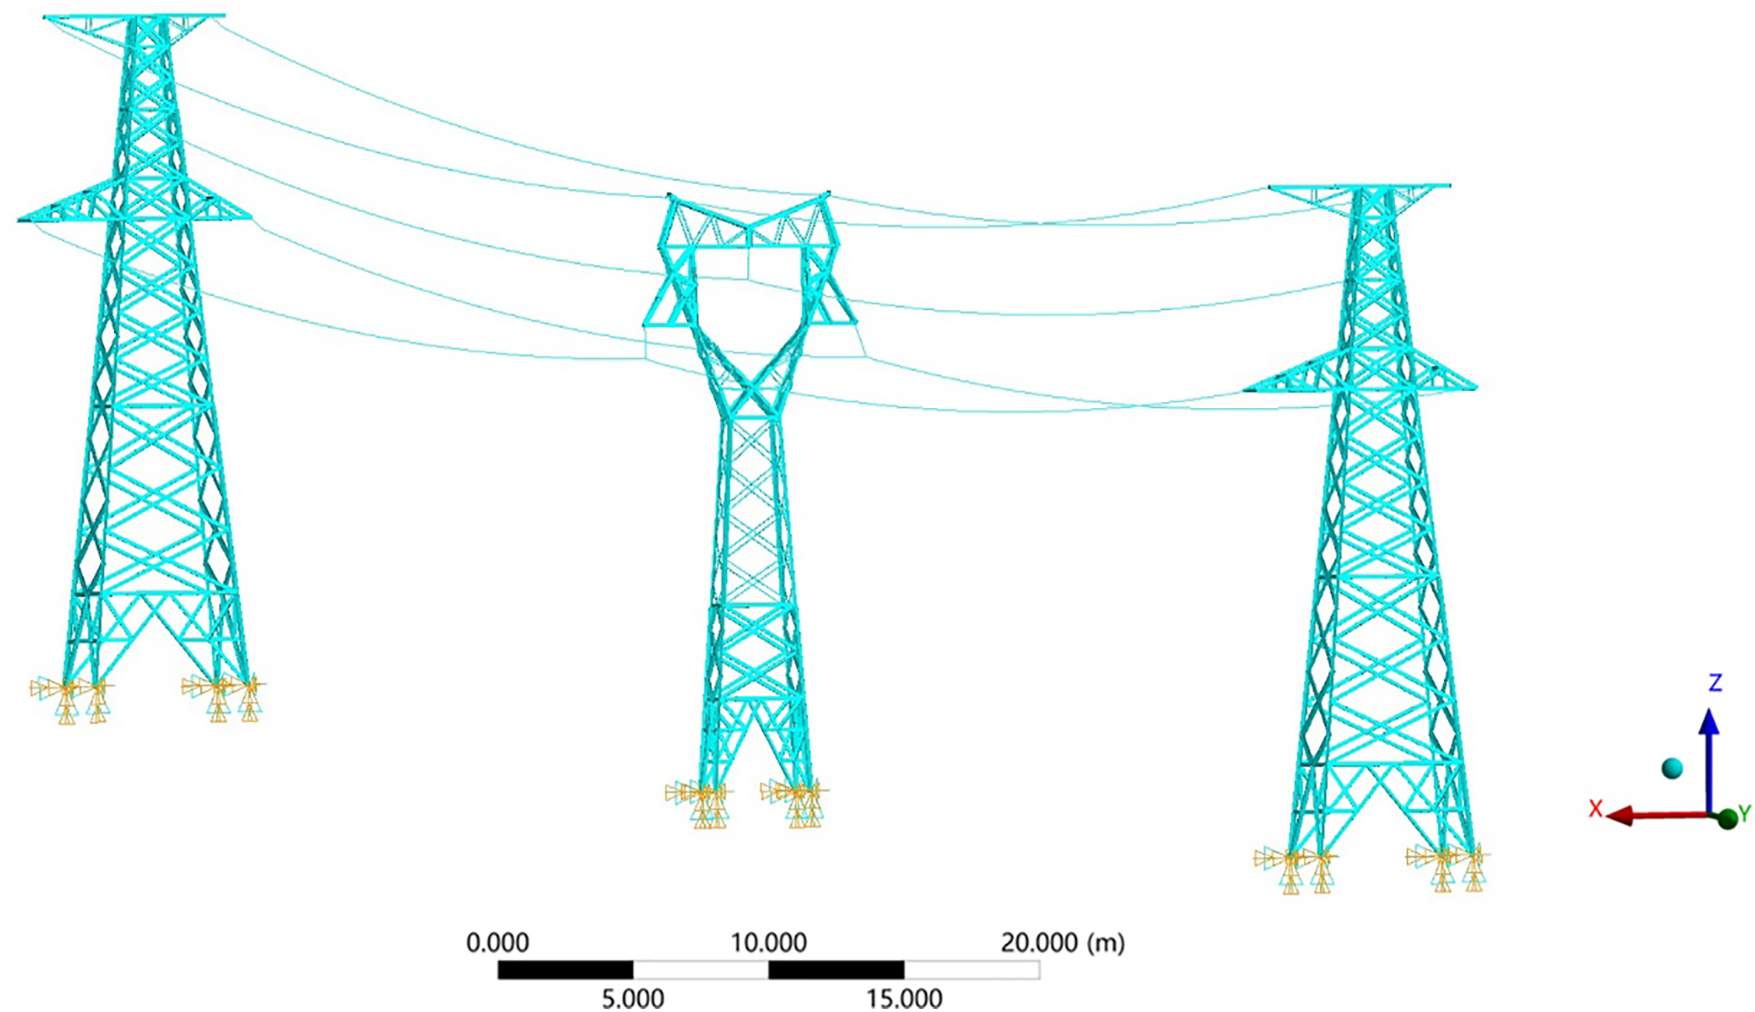
Figure 3: A finite element model of Xi’an Polytechnic University consisting of three towers and two spans is developed
Wind load consists of two components: average wind and fluctuating wind. The average wind has a period typically exceeding 10 min, which is significantly longer than the natural vibration period of most engineering structures. Consequently, its impact can be deemed comparable to a static load. This element serves as the main catalyst for structural oscillations. In Chinese load regulations and wind engineering practices, the Davenport spectrum is frequently employed [19]. It postulates that the fluctuating wind velocity spectrum represents the mean measurements obtained at different elevations above the surface. Its mathematical representation is as follows:
As illustrated in Fig. 2, the tower is partitioned into six segments, while the individual transmission line is divided into 50 segments. Employing the Davenport spectrum, a time series of fluctuating wind speed is generated for each segment [20]. To exemplify, Fig. 4 exhibits the time series curve of wind speed for Section 1 of the tower.
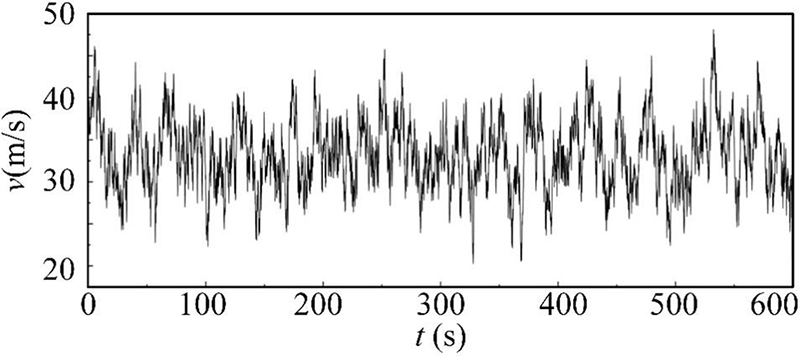
Figure 4: Wind speed time history curve
Fig. 5 shows the self-power Spectral density of the above fluctuating wind speed. The results validate the effectiveness of our proposed wind load model [21].
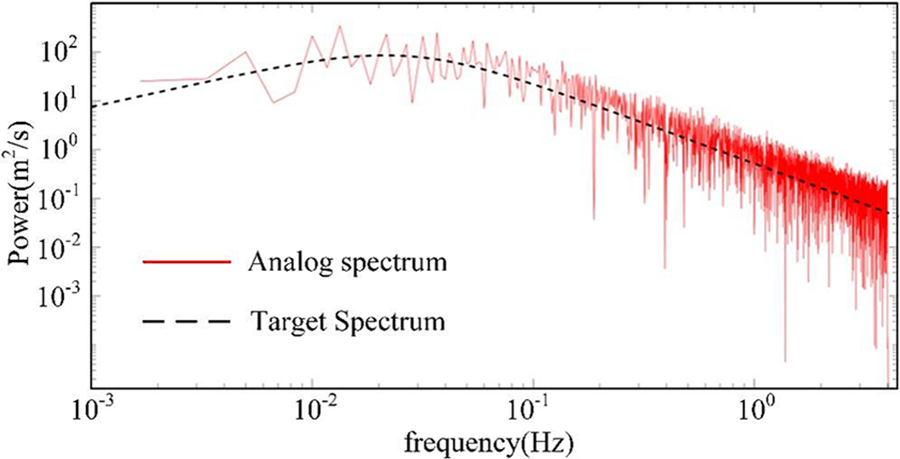
Figure 5: Self power spectral density of fluctuating wind
The wind speed in each section is transformed into wind-induced load and then applied to the finite element model [22]. The equation is as follows:
where, W is the standard value of wind load force on the tower at the target height, is the projected area of wind load.
The expression of wind load on the transmission line is:
where, α is the wind pressure non-uniformity coefficient,
Reliability adjustments were made to the model’s vibration response by employing several techniques. Firstly, a median filtering method was utilized to eliminate noise from the original vibration signal. Additionally, VKF technology was employed to perform feature decomposition and frequency tracking on the vibration signal, ensuring that the reconstructed signal remains unaffected by wind excitation. The statistical process of the median filter offers the advantages of speed and robustness in detecting and correcting outliers. Following these processing steps, the free vibration response signal of the tower can be obtained through numerical simulation and actual observation. This signal is closely related to the inherent characteristics of the tower itself and remains unaffected by external natural excitation.
3.3 Numerical Simulation Results
The vibration data obtained from simulation is subjected to the Continuous Wavelet Transform (CWT) method to generate a time-frequency diagram of the original signal (refer to Fig. 6). The CWT time-frequency diagram enables clear identification of the frequency components present in the original signal along with their corresponding time intervals [23].
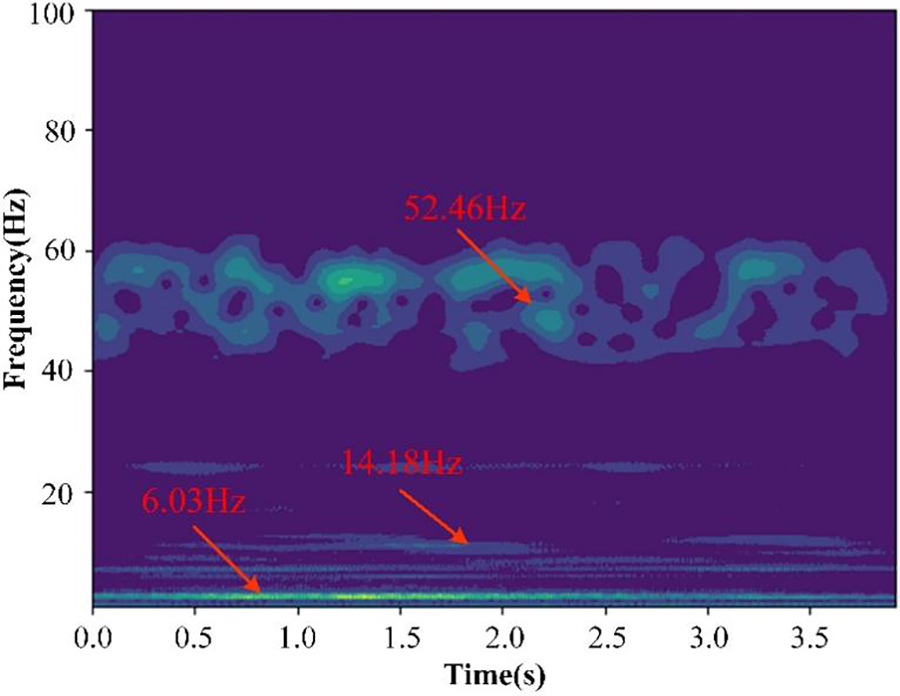
Figure 6: CWT time-frequency diagram of tower wind-induced vibration signal
This method exhibits window adaptation, providing high frequency resolution for low frequency signals and high time resolution for high frequency signals. The frequency resolution is demonstrated by the width of the frequency domain fringes in the image, with narrower fringes indicating higher resolution [24]. Conversely, the time resolution follows an opposite trend, aligning with the focus on occurrence times of both low and high frequency components in structural health monitoring. As depicted in Fig. 6, low frequency values such as 6.03 and 14.18 Hz exhibit higher resolution and wider time coverage, while high frequencies like 52.46 Hz display greater time resolution and a more distinct distribution of vibration response intensity.
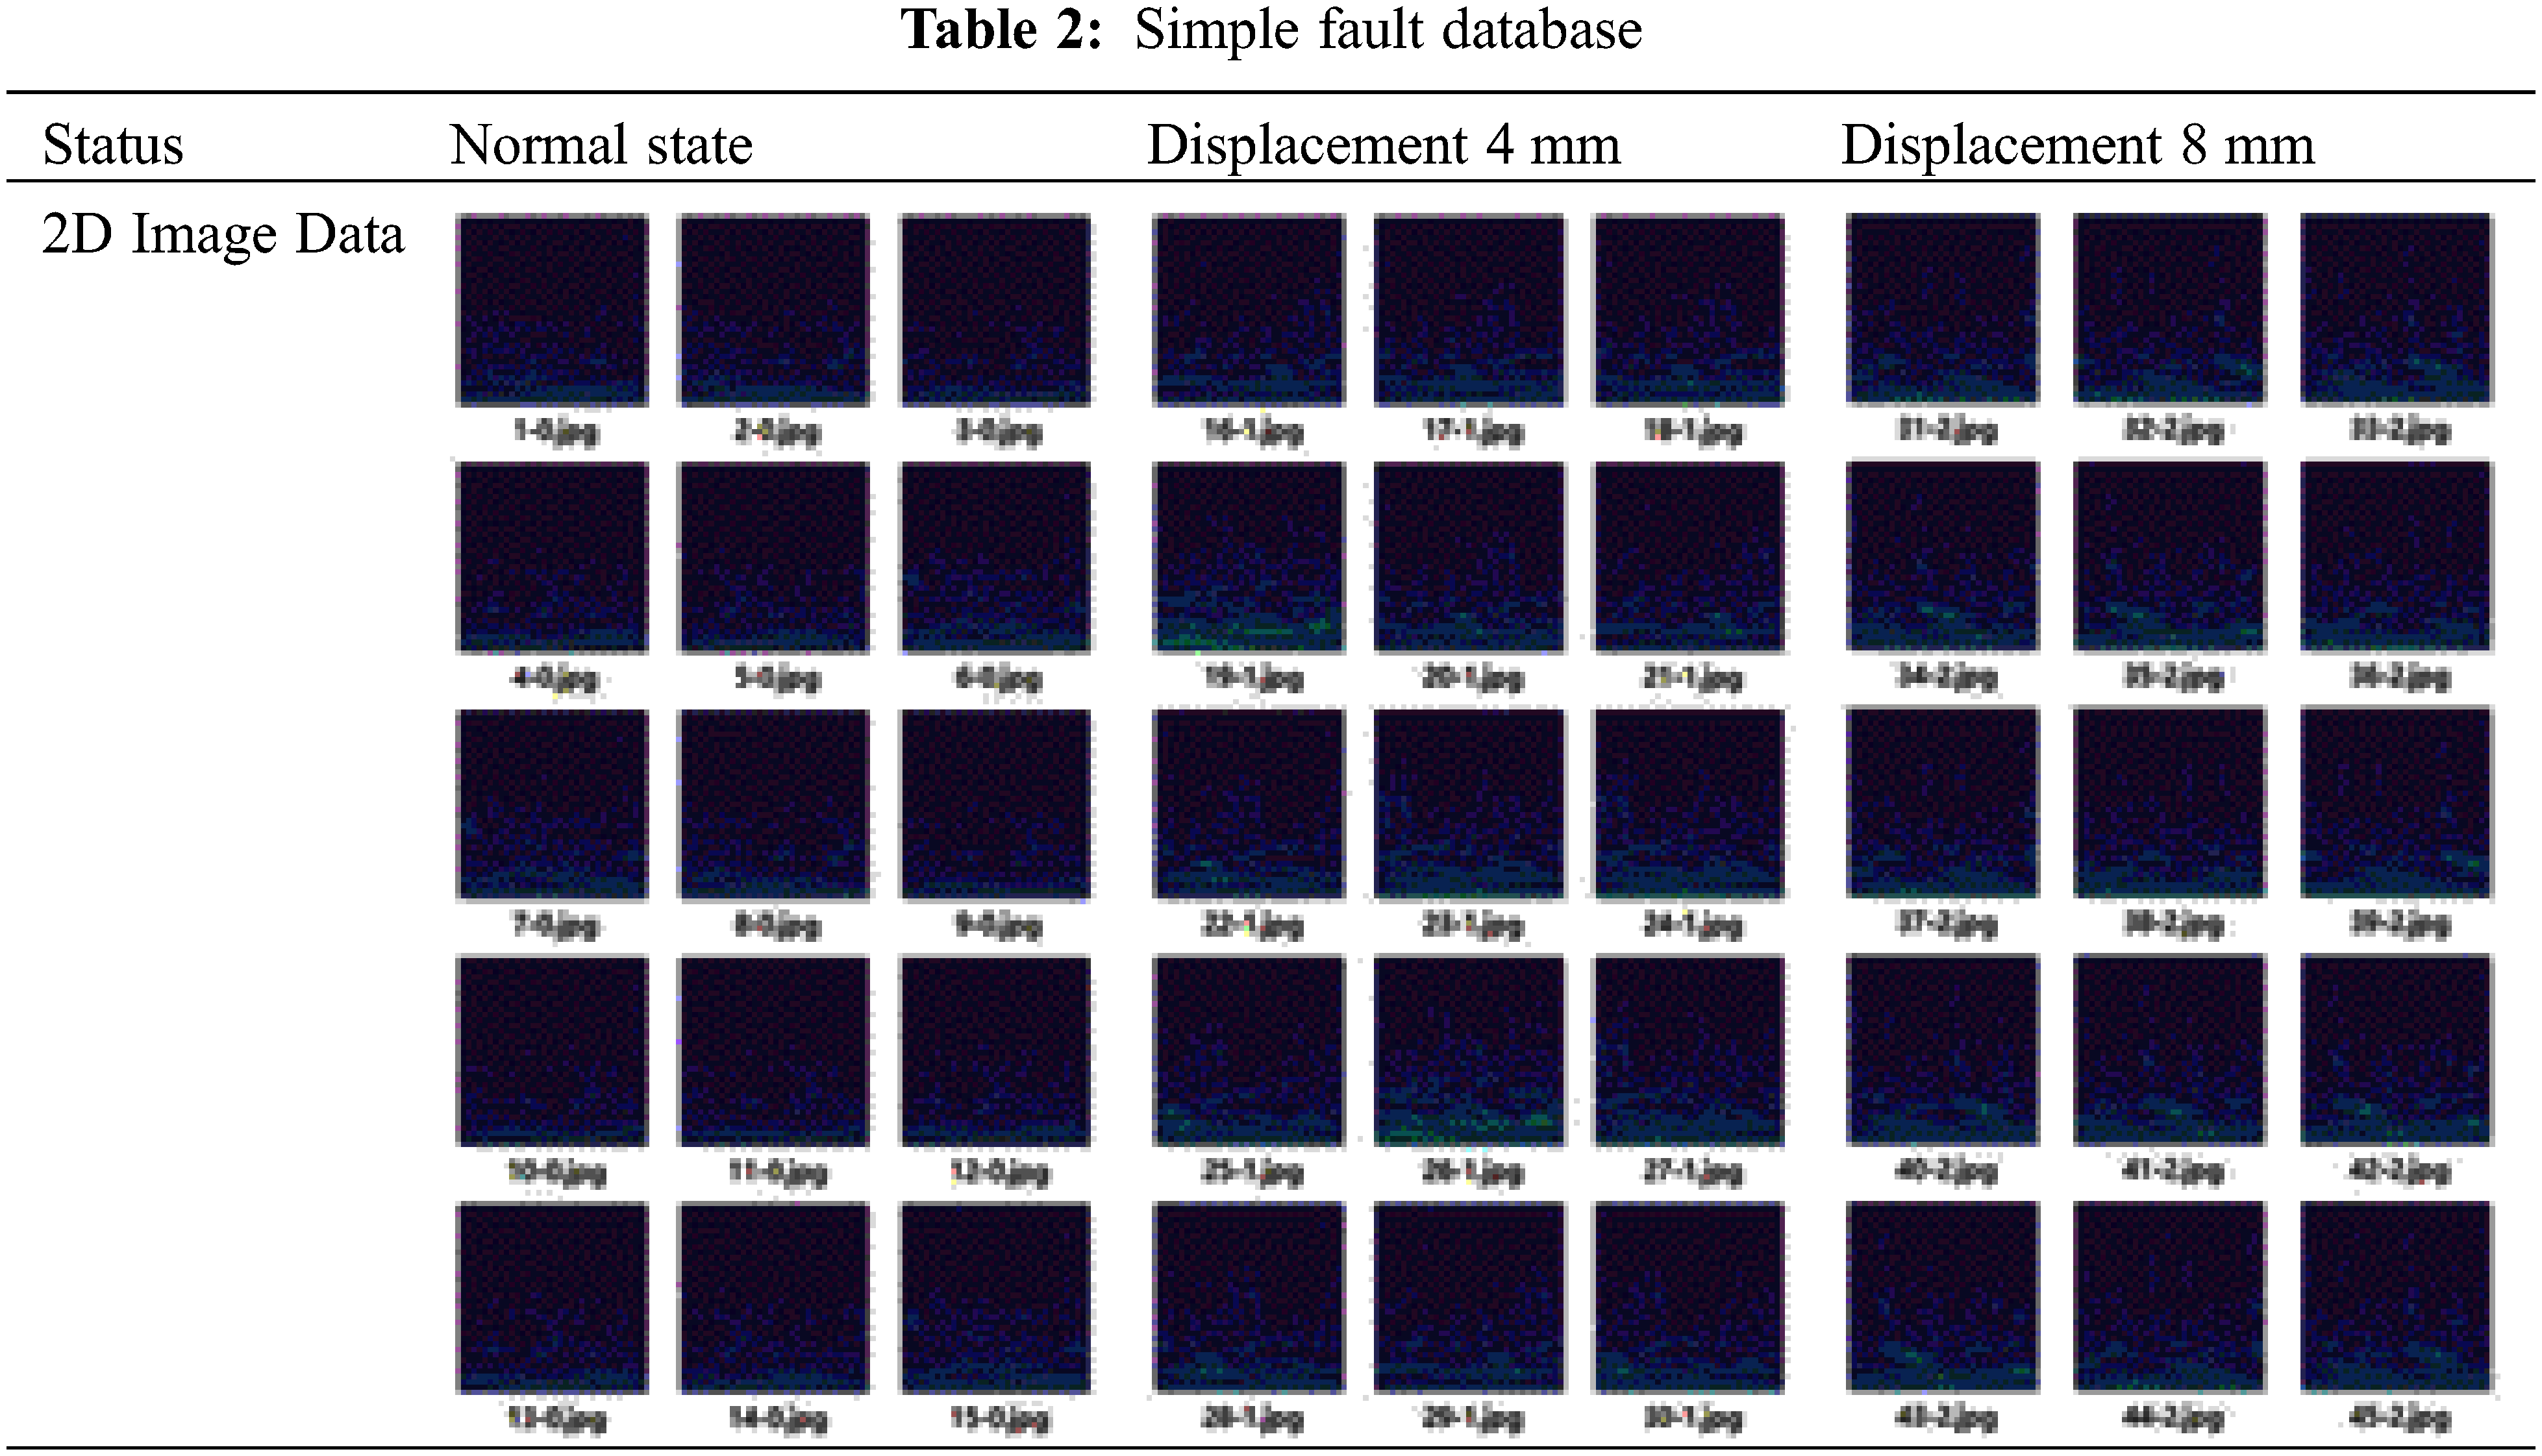
The tower’s wind-induced vibration data undergoes preprocessing of the CWT time-frequency diagram under various operational conditions. This preprocessing involves information deletion and image compression to create a fault database (Table 2 serves as a concise representation of this database). Due to the abundance of fault image data as CNN training sets, it is impractical to include all of them in the paper. Consequently, we randomly selected 15 time-frequency maps for each fault scenario to serve as representatives of the complete dataset. Two-dimensional image data, as opposed to the original one-dimensional time series signal, can convey a greater amount of information. It provides a comprehensive depiction of the tower’s operational conditions from multiple dimensions. For instance, the wavelet time-frequency map exhibits the time, frequency, energy, and other characteristics of the vibration signal on a single map [25]. Therefore, the CWT-generated wavelet time-frequency map is utilized as input for CNN-based fault diagnosis.
4 Tower Foot Displacement Test
4.1 Test Platform and Device Installation
This section collects wind vibration response data during actual tower failures through on-site tests. During the conducted experiment, a variety of instruments were employed, encompassing an accelerometer, a wind velocity and direction sensor, an analyzer, and a hydraulic jack. The configuration and respective installation locations of these instruments are depicted in Fig. 7. In order to capture the tower’s oscillation induced by wind-induced load, accelerometers were positioned at both the apex of the tower and the intersection of the primary and inclined components of the tower structure [26]. The sampling rate of the sensors was configured at 200 Hz. The wind velocity and direction sensor utilized an ultrasonic device and transmitted data to the analyzer through RS485 communication. Equipped with an STM32F407 processor, the analyzer functioned at a maximum operating frequency of 168 MHz, facilitating signal preprocessing and initial analysis. Moreover, the hydraulic jack was employed to replicate the displacement condition of the tower’s foundation by elevating it [27].
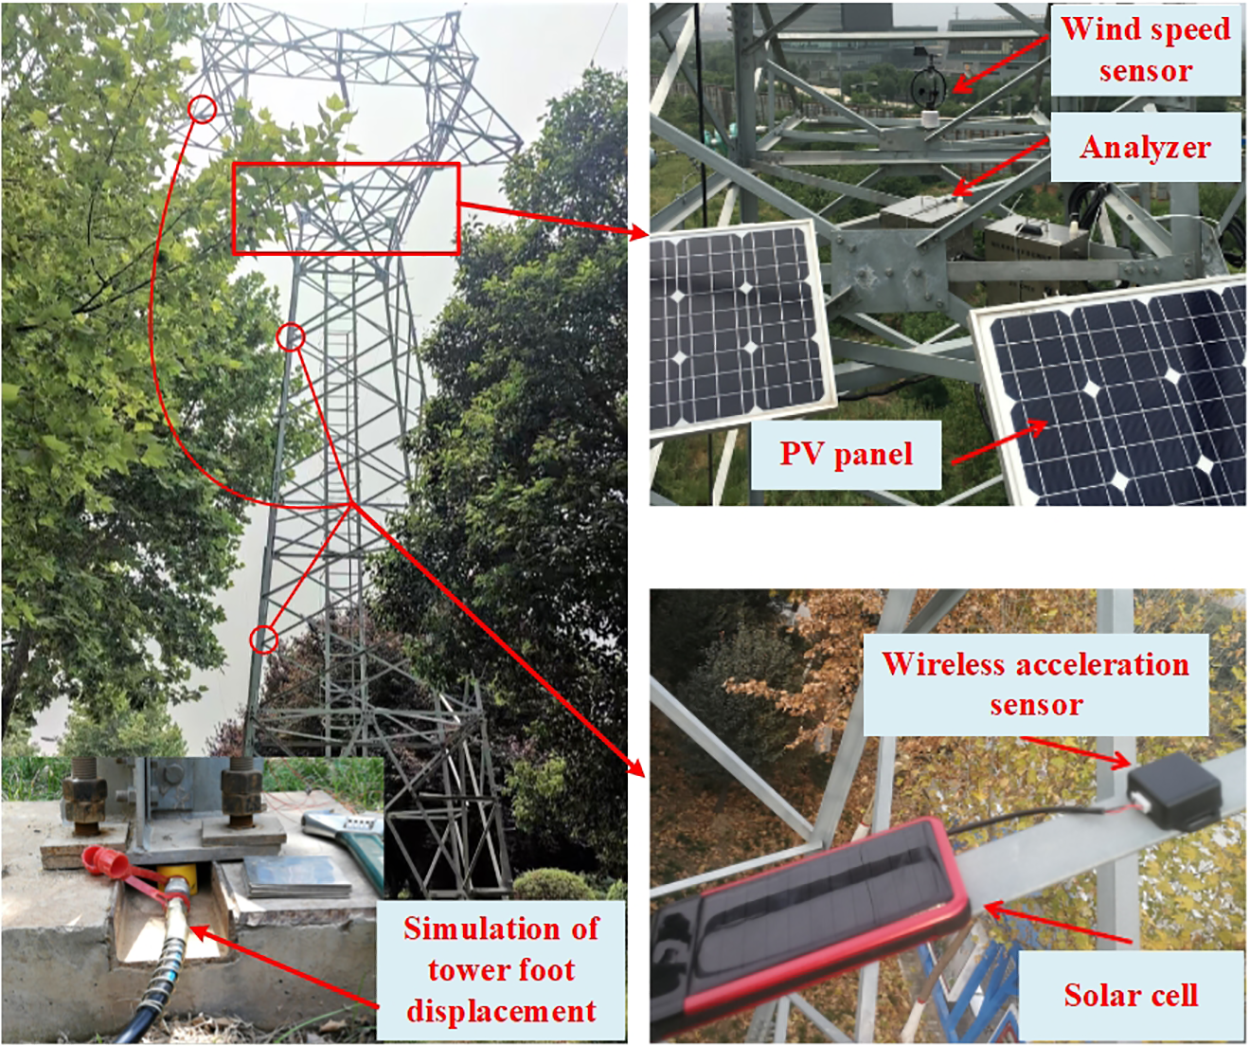
Figure 7: Tower foot displacement test platform
4.2 Acquisition and Analysis of Experimental Data
The acceleration waveform of the tower under typical circumstances is extracted amidst wind stimulation. In order to imitate the displacement of the tower’s foundation, the hydraulic jack is utilized, enabling the acquisition of the tower’s acceleration waveform. Distinct experiments were carried out with tower foot displacements of 4 and 8 mm, and the corresponding measurement data were gathered throughout these occurrences.
Within the realm of structural health monitoring, the frequency-domain attributes of natural frequency showcase remarkable discernment in detecting structural impairment. Nevertheless, depending solely on signal identification from a solitary sensor may lead to the omission of structural modal properties owing to the influence of environmental noise disturbance during testing, particularly when contrasted with simulated data. To address this limitation, this paper utilizes three acceleration sensors strategically placed to capture wind-induced vibrations. Each sensor captures unique modal information components [28]. The correlation variance contribution (CVC) algorithm considers the duplication [29], supplementation, and interdependence among the signals obtained from numerous sensors in a dynamic fusion fashion, guaranteeing the faithful representation of the tower’s comprehensive vibration traits through the merged signals. The fundamental principle of this algorithm can be outlined as follows.
We assume that there are m autonomous and uniform vibration sensors that capture m vibration signals simultaneously, all sampled at the identical frequency during the sampling duration. Normalized signal yi(h) is obtained through energy normalization, as shown below:
At this juncture, ki(q) is the considering the fusion coefficient associated from sensor i, the amalgamated data as follows:
After using CVC algorithm and the CWT for fault feature visualization. The resultant data will be partitioned in a ratio of 1:2, fulfilling the dual role of both the validation set and the testing set for the subsequent DT-DL approach.
5 Verify Effectiveness of Proposed Method
After visualizing the data, namely the training set, verification set, and test set (refer to Table 1), we proceed to calibrate them. The samples representing the tower’s normal state are calibrated as 0, while the samples with a tower foot displacement of 4 mm are calibrated as 1, and those with a tower foot displacement of 8 mm are calibrated as 2. Subsequently, we will input the divided data into the model for training. Finally, we will input the test data under various fault conditions into the trained model for fault classification and detection.
The performance of the network can be evaluated based on loss and accuracy metrics. The progression of model training and the loss assessment for validation are illustrated in Figs. 8a and 8b, correspondingly. During the training phase, a learning rate of 0.001 was employed, and 100 iterations were executed [30]. Fig. 8a illustrates that the accuracy rate experiences significant fluctuations in the early stages of model training, indicating an initial phase of convergence. After the 47th iteration, the model’s accuracy stabilizes and reaches a final value of 100%. Fig. 8b demonstrates a rapid decrease in the model’s loss value during the first 68 iterations. Subsequently, the accuracy rate of the model tends to stabilize after each iteration, reaching a final value of 100%. Beyond 68 iterations, the loss value approaches 0.023, indicating that the model has essentially converged. These results indicate that the CNN achieves rapid convergence, maintains a high and stable accuracy, and exhibits low training loss during the later stages of training. In summary, this model exhibits high modeling accuracy and good fault diagnosis stability.
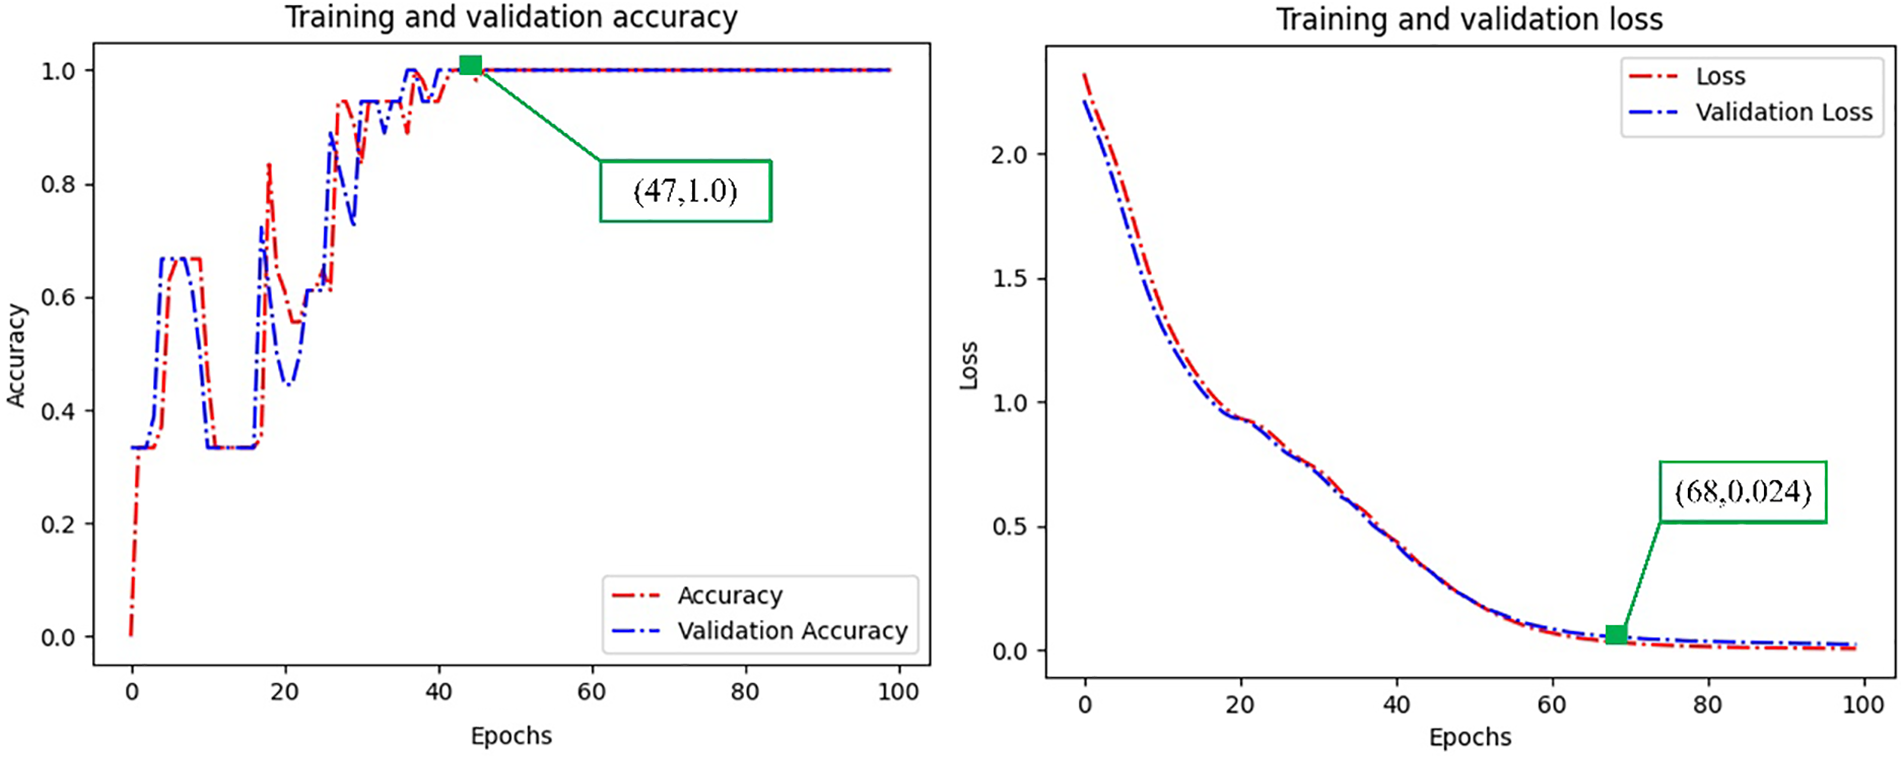
Figure 8: Results of model training
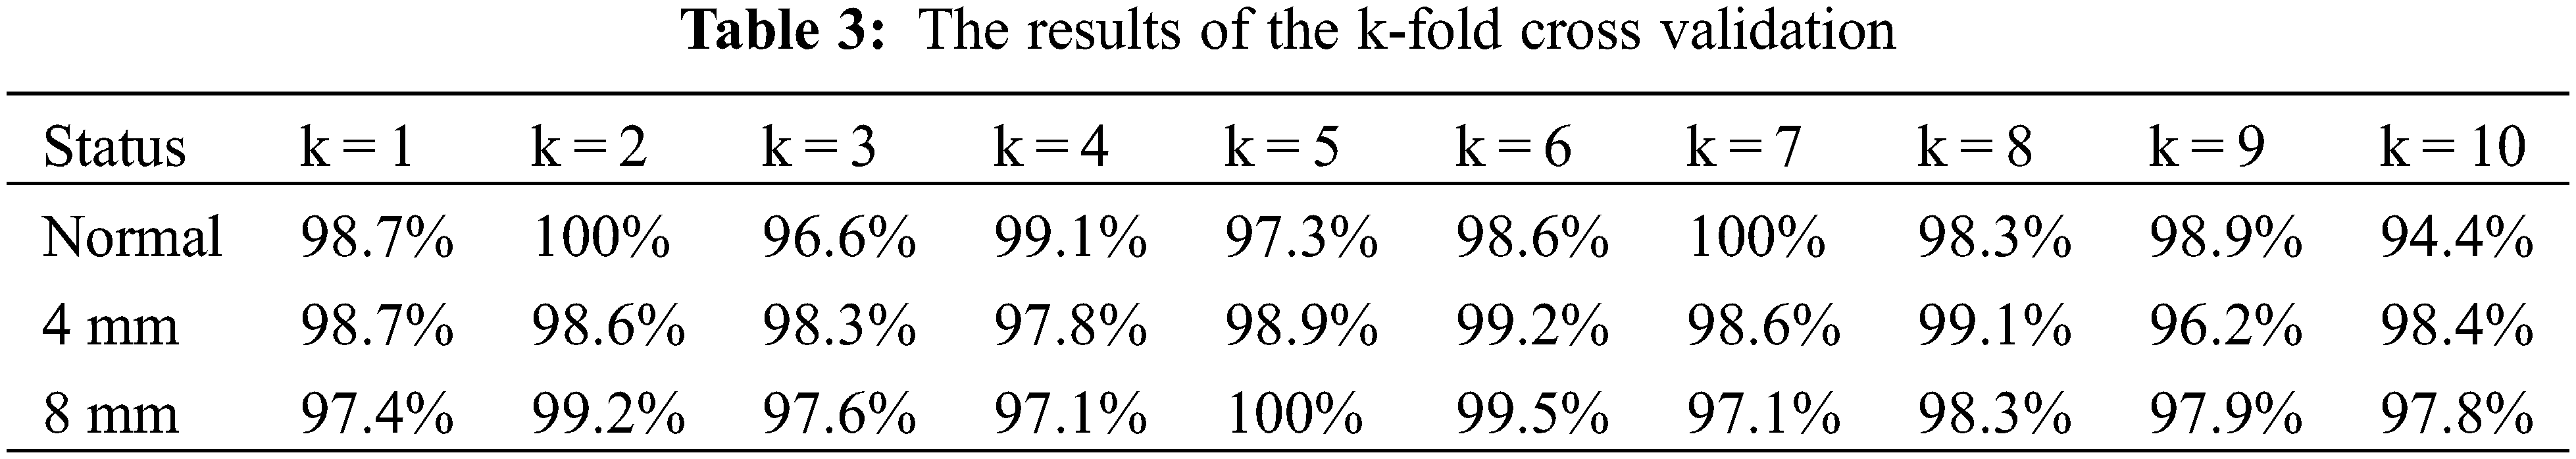
To assess the universality of the numerical models built on DT technology and the stability of the trained CNN, this study employs k-fold cross-validation (k = 10). The validation outcomes, presented in Table 3, encompass normal state samples as well as those with tower foot displacements of 4 and 8 mm. The results demonstrate that all samples yield satisfactory detection results, surpassing a 95% accuracy threshold. Thus, it is verified that the trained CNN exhibits stability, and the numerical models relying on DT technology are deemed reliable.
5.2 Model Test and t-SNE Visualization Analysis
The depiction of the confusion matrix offers a visual and intuitive portrayal of the quantity and categories of misclassifications pertaining to various fault types [31]. As shown in Fig. 9, the suggested approach for proposed method attains a flawless accuracy rate of 100% during the testing conditions. This indicates the method’s exceptional capability to discern the structural health state of the tower. However, achieving a 100% success rate during validation does not necessarily imply a favorable outcome, as it may be indicative of overfitting. To address this concern, we employ k-fold cross-validation technology to validate the method’s accuracy and ensure its reliability.
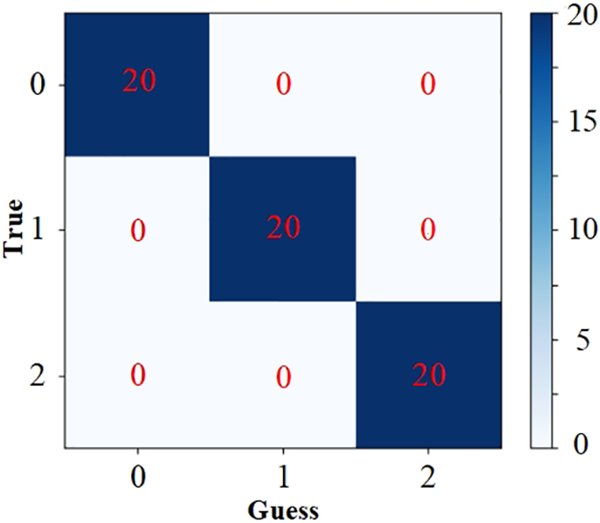
Figure 9: Confusion matrix of tower fault diagnosis
In order to acquire a deep understanding of the feature extraction process, we employed t-distributed stochastic neighbor embedding (t-SNE) [32] as a technique to visually depict the learning traits of the convolutional neural network (CNN). To delve into data with extensive dimensions, we utilized t-SNE, an algorithm renowned for its visual capabilities. By projecting the data onto a two-dimensional space, t-SNE provides valuable insights into the organization of data in a vast-dimensional space, granting visibility into the intricacies of the high-dimensional data. As depicted in Fig. 10, failures of different types are observed to cluster together at the network’s input, resulting in their failure to be recognized. On the contrary, when it comes to the network’s output, failures of the identical category are clustered together, whereas different types of failures are clearly distinguished. This observation underscores the robustness of the method in extracting distinctive features.
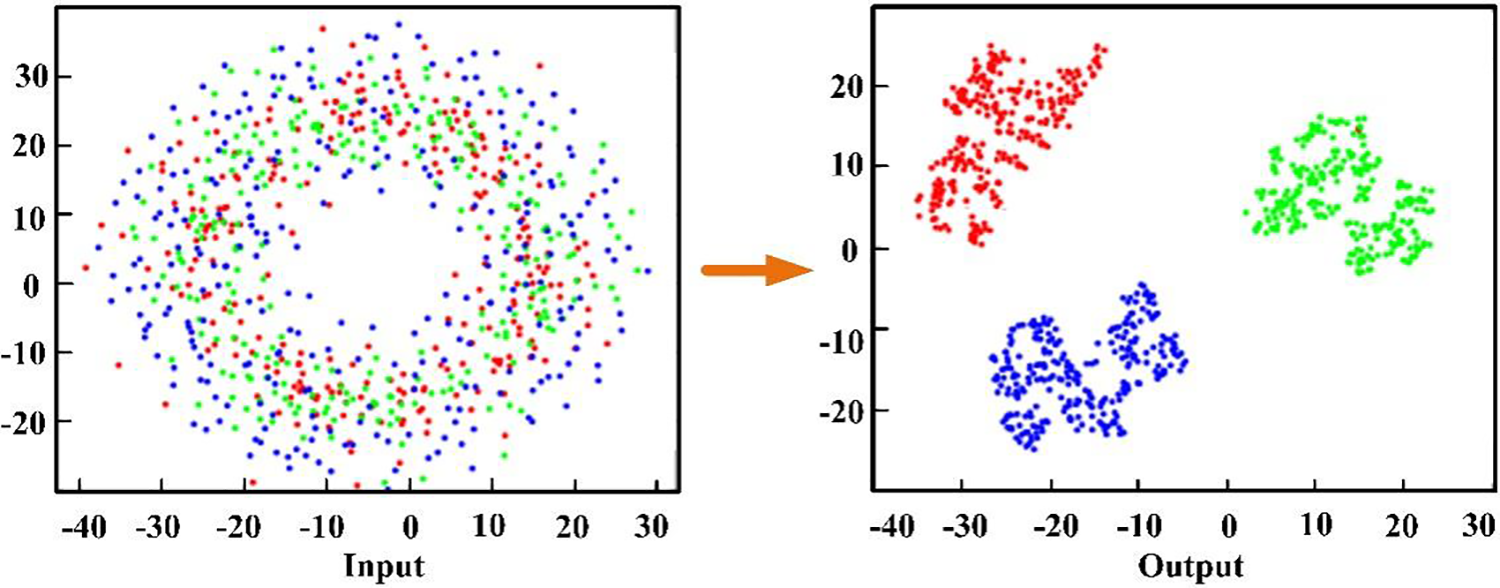
Figure 10: Visual analysis of the proposed method
5.3 Comparison of Different Methods
In this section, we evaluate and compare the speed and accuracy of fault diagnosis for three tower states using various methods. The selected comparison methods encompass the DT-DL technology proposed in this study, a CNN-based approach solely identifying working conditions, stochastic subspace identification with SVM technology, and the VMD method combined with SVM technology. The identification results are presented in Table 4.
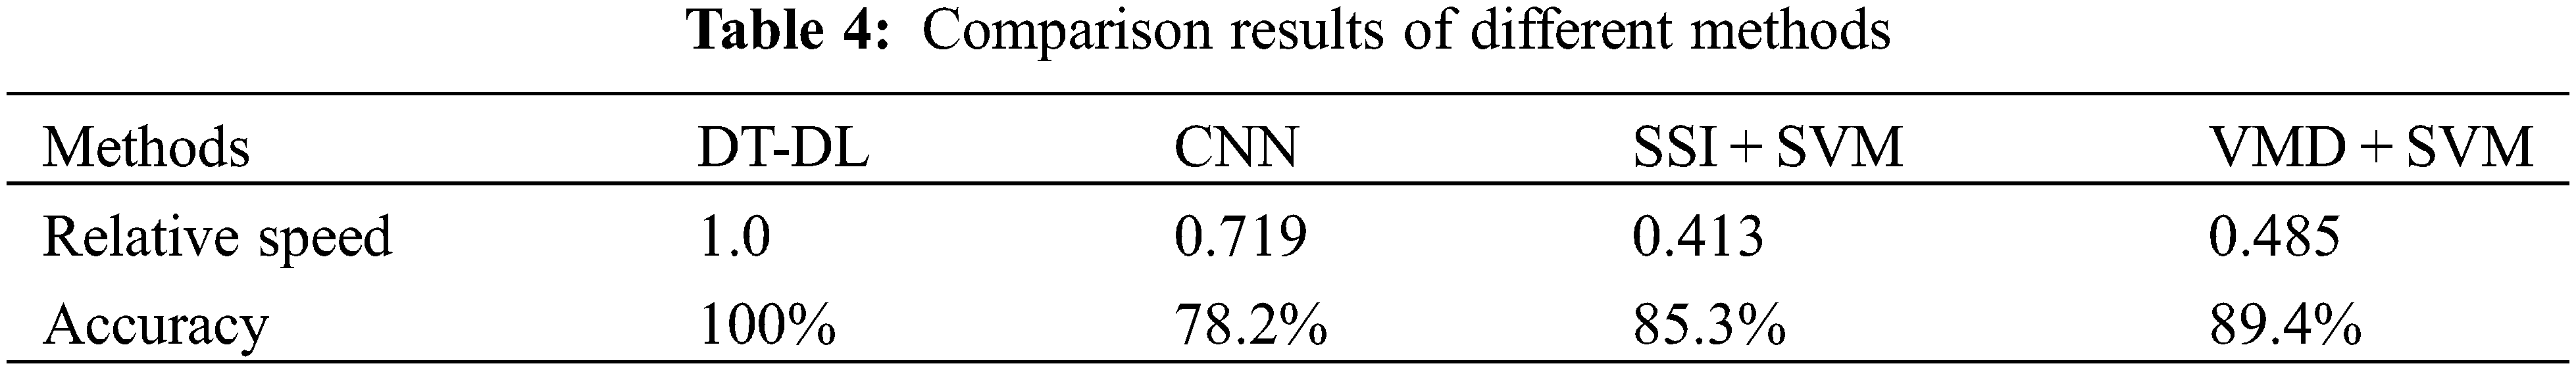
To begin with, we conduct a comparative analysis of the recognition speed among different methods under varying conditions. The findings indicate that the deep learning-based approach exhibits notably faster recognition speed compared to traditional methods. Specifically, the DT-DL method proposed in this paper demonstrates the highest recognition speed. The convergence rate of the DT-DL method surpasses other methods (solely CNN, SSI + SVM, and VMD + SVM) by 28.1%, 58.7%, and 51.5%, respectively. Consequently, the proposed DT-DL method significantly enhances the convergence speed during the recognition process.
Lastly, we evaluate the recognition accuracy of each method across various conditions. The findings reveal that the DT-DL method achieves the highest recognition accuracy. Notably, the traditional recognition method outperforms the deep learning-based approach in terms of recognition accuracy. The recognition accuracy of the DT-DL method surpasses other methods (solely CNN, SSI + SVM, and VMD + SVM) by 21.8%, 14.7%, and 10.6%, respectively.
In this research, we introduce an innovative method for monitoring the displacement of the foot by utilizing vibrations induced by wind. The suggested technique utilizes continuous wavelet transformation to visually represent the data on vibrations and establishes a database of faults by migrating the data. Subsequently, deep learning techniques are employed to diagnose the tower’s foot displacement.
This manuscript presents the establishment of a numerical model for the system consisting of towers. The model is optimized using virtual damping technology, which effectively controls the wind-induced vibration response of the tower. To accurately simulate this response, we employ the Davenport spectrum. Additionally, the data is visualized using continuous wavelet transform, and a data migration technique is employed to construct the fault database for the tower.
In this study, a tower fault monitoring test was conducted on the actual tower. The collected data encompasses the vibration response of the tower induced by natural stimulation. CVC algorithm is thoroughly analyze the data and obtain comprehensive information about the dynamic characteristics.
In this study, deep learning methods were used to monitor tower faults. Experimental results substantiate that the suggested model attains a monitoring precision of 100% within the specified circumstances. The results affirm the exceptional capability of this method in discerning the structural health state of the tower.
Acknowledgement: Funding from the Shaanxi Province Key R&D Program, Natural Science Foundation of Shaanxi Province and Graduate Scientific Innovation Fund for Xi’an Polytechnic University.
Funding Statement: This work was supported by the Key Projects of Shaanxi Province Key R&D Program (2018ZDXM-GY-040), and supported by Natural Science Foundation of Shaanxi Province, Basic Research Program Project (2019JQ-843), supported by Graduate Scientific Innovation Fund for Xi’an Polytechnic University (chx2023012).
Author Contributions: Conceptualization, Zhicheng Liu; methodology, Long Zhao; validation, Guanru Wen; investigation, Peng Yuan; resources, Zhicheng Liu; data curation, Long Zhao; writing—original draft preparation, Zhicheng Liu; writing—review and editing, Guanru Wen; visualization, Peng Yuan; project administration, Zhicheng Liu; funding acquisition, Guanru Wen. All authors have read and agreed to the published version of the manuscript.
Availability of Data and Materials: The data used in this paper cannot be open access, because the authors need to use these data for subsequent research.
Conflicts of Interest: The authors declare that they have no conflicts of interest to report regarding the present study.
References
1. Liu, L., Du, R., Liu, W. (2019). Flood distance algorithms and fault hidden danger recognition for transmission line towers based on sar images. Remote Sensing, 11(14), 1642. [Google Scholar]
2. Lian, J., Cai, O., Dong, X., Jiang, Q., Zhao, Y. (2019). Health monitoring and safety evaluation of the offshore wind turbine structure: A review and discussion of future development. Sustainability, 11(2), 494. [Google Scholar]
3. Tufan, T., Akalp, S. (2019). Modal plot—System identification and fault detection. Structural Control and Health Monitoring, 26(5), e2347.1–e2347.15. [Google Scholar]
4. Zhao, L., Huang, X., Zhang, Y., Tian, Y., Zhao, Y. (2019). A Vibration-based structural health monitoring system for transmission line towers. Electronics, 8(5), 515. [Google Scholar]
5. Nord, T. S., Petersen, Ø. W., Hendrikse, H., Hayo, H. (2019). Stochastic subspace identification of modal parameters during ice-structure interaction. Philosophical transactions of the Royal Society. Mathematical, Physical, and Engineering Sciences, 377(2155), 20190030. [Google Scholar] [PubMed]
6. Li, H. N., Wang, J. X., Fu, X., Ren, L., Zhang, Q. (2020). Field measurements of typhoon effects on a transmission tower and its modal parameter identification. Advances in Structural Engineering, 23(8), 1548–1561. [Google Scholar]
7. Reynders, E., Maes, K., Lombaert, G., Roeck, G. D. (2016). Uncertainty quantification in operational modal analysis with stochastic subspace identification: Validation and applications. Mechanical Systems & Signal Processing, 66, 13–30. [Google Scholar]
8. Zhang, M., Xu, F. (2019). Variational mode decomposition based modal parameter identification in civil engineering. Frontier of Structural and Civil Engineering, 13(5), 1082–1094. [Google Scholar]
9. Quqa, S., Giordano, P. F., Limongelli, M. P., Landi, L., Diotallevi, P. P. et al. (2021). Clump interpolation error for the identification of damage using decentralized sensor networks. Smart Structures and Systems, 27(2), 351–363. [Google Scholar]
10. Liu, D., Tang, Z., Bao, Y., Li, H. (2021). Machine-learning-based methods for output-only structural modal identification. Structural Control and Health Monitoring, 28(12), e2843. [Google Scholar]
11. Xue, J., Ou, G. (2021). Predicting wind-induced structural response with LSTM in transmission tower-line system. Smart Structures and Systems, 28(3). [Google Scholar]
12. Yang, Y., Nagarajaiah, S. (2016). Harnessing data structure for recovery of randomly missing structural vibration responses time history: Sparse representation versus low-rank structure. Mechanical Systems and Signal Processing, 74, 165–182. [Google Scholar]
13. Wu, Z., Chen, H., Lei, Y. (2021). Application of convolutional neural networks in radio station link establishment behaviors recognition. Journal of Physics: Conference Series, 1757(1), 012063. [Google Scholar]
14. Razafimbelo, T. (2021). Using a one-dimensional convolutional neural network on visible and near-infrared spectroscopy to improve soil phosphorus prediction in Madagascar. Remote Sensing, 13(8), 1519. [Google Scholar]
15. Zhang, W., Peng, G., Li, C., Chen, Y., Zhang, Z. (2017). A new deep learning model for fault diagnosis with good anti-noise and domain adaptation ability on raw vibration signals. Sensors, 17(2), 425. [Google Scholar] [PubMed]
16. Lakshmi, S., Philip, P. M. (2022). Numerical analysis of transmission line tower with connection beam on pile foundation. In: Recent advances in structural engineering and construction management, pp. 375–391. Singapore: Springer Nature Singapore. [Google Scholar]
17. Ji, B., Xiong, Q., Xing, P., Qiu, P., Qu, W. (2021). Bolt loosening localization at flange joints using wind-induced response for high-rise tower. International Journal of Steel Structures, 21(5), 1790–1803. [Google Scholar]
18. Biswal, S., Chryssanthopoulos, M. K., Wang, Y. (2022). Condition identification of bolted connections using a virtual viscous damper. Structural Health Monitoring, 21(2), 731–752. [Google Scholar]
19. Duan, Z., Xu, F., Yan, G., Nie, M., Luo, X. et al. (2022). Evaluation of wind loads on square transmission towers with angle members under skewed winds. Journal of Wind Engineering and Industrial Aerodynamics, 229, 105134. [Google Scholar]
20. Guo, S., Li, Y., Chen, W. (2021). Analysis on dynamic interaction between flexible bodies of large-sized wind turbine and its response to random wind loads. Renewable Energy, 163, 123–137. [Google Scholar]
21. Qu, B., Liao, P., Huang, Y. (2022). Outlier detection and forecasting for bridge health monitoring based on time series intervention analysis. Structural Durability & Health Monitoring, 16(4), 323–341. https://doi.org/10.32604/sdhm.2022.021446 [Google Scholar] [CrossRef]
22. Chou, J. S., Chiu, C. K., Huang, I. K., Chi, K. N. (2013). Failure analysis of wind turbine blade under critical wind loads. Engineering Failure Analysis, 27, 99–118. [Google Scholar]
23. Moghadam, F. K., Nejad, A. R. (2022). Online condition monitoring of floating wind turbines drivetrain by means of digital twin. Mechanical Systems and Signal Processing, 162, 108087. [Google Scholar]
24. Ahmed, S., Mohammad, N., Wael, A., Ramin, G., Zhishen, W. (2021). Comparative analysis of wavelet transform for time-frequency analysis and transient localization in structural health monitoring. Structural Durability & Health Monitoring, 15(1), 1–22. https://doi.org/10.32604/sdhm.2021.012751 [Google Scholar] [CrossRef]
25. Gdeisat, M. A., Burton, D. R., Lalor, M. J. (2006). Spatial carrier fringe pattern demodulation by use of a two-dimensional continuous wavelet transform. Applied Optics, 45(34), 8722–8732. [Google Scholar] [PubMed]
26. Szopa, K., Iwaniec, M., Iwaniec, J. (2020). Modelling and identification of bolted truss structure with the use of design of experiment approach. Structures, 27, 462–473. [Google Scholar]
27. Li, X. Y., Guan, Y. H., Law, S. S., Zhao, W. (2022). Monitoring abnormal vibration and structural health conditions of an in-service structure from its SHM data. Journal of Sound and Vibration, 537, 117185. [Google Scholar]
28. Zhang, J., Zhang, J., Teng, S., Chen, G., Teng, Z. (2022). Structural damage detection based on vibration signal fusion and deep learning. Journal of Vibration Engineering & Technologies, 10(4), 1205–1220. [Google Scholar]
29. Dhillon, B. (2011). Weighted multi-sensor data level fusion method of vibration signal based on correlation function. Chinese Journal of Mechanical Engineering, 24(5), 899–904. [Google Scholar]
30. He, C., Kang, H., Yao, T., Li, X. (2019). An effective classifier based on convolutional neural network and regularized extreme learning machine. Mathematical Biosciences and Engineering, 16(5), 8309–8321. [Google Scholar] [PubMed]
31. Zhang, T., Xu, F., Jia, M. (2022). A centrifugal fan blade damage identification method based on the multi-level fusion of vibro-acoustic signals and CNN. Measurement, 199, 111475. [Google Scholar]
32. Wang, Y., Chen, L., Jo, J., Wang, Y. (2021). Joint t-SNE for comparable projections of multiple high-dimensional datasets. IEEE Transactions on Visualization and Computer Graphics, 28(1), 623–632. [Google Scholar] [PubMed]
Cite This Article
 Copyright © 2023 The Author(s). Published by Tech Science Press.
This work is licensed under a Creative Commons Attribution 4.0 International License , which permits unrestricted use, distribution, and reproduction in any medium, provided the original work is properly cited.
 Downloads
 Citation Tools