
 Submit a Paper
 Open Access
ARTICLE
Sensitivity Analysis of Contact Type Vibration Measuring Sensors
1 School of Engineering, Indian Institute of Technology, Mandi, 175005, India
2 National Institute of Technology, Hamirpur, 177001, India
3 School of Computing and Electrical Engineering, Indian Institute of Technology, Mandi, 175005, India
* Corresponding Author: Arpan Gupta. Email:
Sound & Vibration 2022, 56(3), 235-243. https://doi.org/10.32604/sv.2022.015615
Received 31 December 2020; Accepted 10 December 2021; Issue published 10 August 2022
 View Full Text
 Download PDF
Abstract
With the Internet of Things (IoT) era dawning in, we are surrounded by a plethora of sensors. The present paper focuses on MEMS-based vibration measuring accelerometers, which are ubiquitously present in smartphones, tablets, smartwatches/bands, etc. These contact type vibration sensors have the unique advantage of being very small, low cost, low power, less weighing, and easily accommodatable in electronics. However, the accuracy of these sensors needs to be quantified with respect to more accurate sensors. With this objective, the paper presents a comparison of the relative sensitivity of a MEMS-based accelerometer (MPU 6050), a Geophone, and a sensor from Xiaomi Y2 smartphone with respect to a more standard Piezoelectric ICP based accelerometer, when all sensors are tested on a shaker table. Data are measured with harmonic excitation over a frequency range of 2–184 Hz. The relative sensitivity of MPU 6050 was 90% accurate in the frequency range 18–116 Hz for RMS measurements. Other sensors such as the one used in the Xiaomi Y2 smartphone and the Geophone were less accurate. The relative sensitivity measured in this work can be used to obtain sensitivity and hence more accurate data from these low-cost accelerometers.Keywords
The advent of the Micro-electromechanical System (MEMS) has revolutionized the field of sensors [1]. These sensors have a mechanical sensing element and an electronic circuit to transform the small mechanical changes into electric signals [2,3]. At the micron level, these devices are very small and occupy less space, consume minimum power, and are low weight. With the improvement of manufacturing technology, these sensors’ production cost has also decreased dramatically [4]. As a result, some of these sensors are now ubiquitously present in all smartphones, watches, tablets, etc. Further, with the IoT catching up, more and more of these sensors are expected to be a part of the living habitat [5].
The present paper focuses specifically on a low-cost accelerometer. The smartphone senses the orientation based on the measurement of the acceleration due to gravity through the accelerometer. Similarly, these small MEMS-based accelerometers are used for air-bag deployment in modern cars for passengers safety [6]. These sensors come in various forms, and a recent development is the MPU 6050 MEMS-based accelerometer which is widely available and is used in multiple applications [7]. MPU 6050 is one of the first integrated 6-axis motion tracking devices, which functions as a 3-axis gyroscope, 3-axis accelerometer, and Digital Motion Processor. This sensor works on the VDD power supply with a voltage range from 2.375 V–3.46 V and is interfaced with I2C.
MEMS-based accelerometers have been recently introduced. One of the earliest studies of the MEMS accelerometer performance was reported by Albarbar et al. in 2009 [8]. Three different types of excitation, i.e., sinusoidal, random, and impulse, are used to carry out the performance tests on the capacitive type MEMS accelerometer. Further, Jimenez et al. studied theoretically and experimentally the wireless MEMS-based accelerometer’s capability to observe rotor vibration at externally inaccessible rotor locations [9]. This study highlighted the extended functionality afforded by internal accelerometers. It demonstrated the likelihood of internal sensor topologies, which can provide improved observability of rotor vibration at externally remote rotor locations. Rana et al. [10] have also used MEMS based sensors for designing active suspension system. These sensors can also be used for acoustic levitation by flexural vibrations [11].
Performance degradation of MEMS sensors due to temperature variation was studied by Yang et al. [12]. They proposed a modular and generic micromachined oven-control system for miniature microelectromechanical system (MEMS) transducers with a six-axis MEMS inertial measurement unit. The assembly accounted for the performance degradation of MEMS sensors due to temperature variation. Dong et al. [13] investigated parasitic capacitance and demonstrated how temperature changes can affect MEMS sensor performance. Chan et al. [14] performed a fascinating study in 2017 to measure the large machines’ vibrations by setting the sensors at different points within the machine. Varanis et al. [15] have performed two experiments, amplitude measurement using MEMS sensor and standard accelerometer, acceleration measurement using three MEMS, and Piezoelectric accelerometer. Time-domain operational modal analysis in machine tools has been studied with MPU 6050 by Chan et al. [16]. Al-Madani et al. [17] showed that the same sensor has been deployed for the drone parachute system for fall detection. These sensors can be used as teaching aids/demonstrations, such as for the Wilberforce pendulum [18]. Vibration sensors can also be used for testing and monitoring of vehicles with alternate fuels [19]. The main component of earthquake vibration or landslide vibration is a low-frequency component (2–20 Hz) [20,21]. In hilly terrain prone to landslides or earthquake-prone zones, various low-cost applications and inventions have developed using MEMS-based sensors such as MPU6050 for structural health monitoring [22–24]. Therefore, these sensors’ accuracy is particularly critical at the low-frequency range, as the measured data is used for decision-making in life-threatening situations. Hence it becomes necessary to check the accuracy of this cheap sensor in such adverse conditions. Moreover, there is less experimental data available in literature when these sensors are subjected to discrete harmonic excitation. The present paper tries to study relative sensitivity experimentally for a more accurate scientific ICP based piezoelectric accelerometer and obtain a frequency range in which these sensors can work satisfactorily.
In the present paper, two different accelerometers, viz., MPU6050, the sensor on Xiaomi Y2, and a velocity sensor Geophone, are tested against a standard ICP based piezoelectric accelerometer (PCB make, model no: 352C03 with a sensitivity of 9.82 mV/g). The accelerometers were mounted on a shaker (Micron, 200 Kgf, model no: MEV-0200) and provided with discrete harmonic excitation from 2 to 184 Hz. Low-frequency response from these sensors is more critical, and low frequency is prone to more errors. Therefore, many frequency points were used in the low-frequency range (2–23 Hz) to get a more accurate estimation of the low-frequency response of these sensors. The response from all these sensors for each frequency was measured for 6 s, and then a comparison was carried out based on this time data. Two parameters were extracted from time-domain data for comparison: 1) RMS value of the acceleration 2) The peak value of acceleration. The idea is that even for a 2 Hz signal, over 6-s measurement, the RMS will be averaged over 12 cycles. For higher frequency, it will be even higher and hence more accurate. The second measurement (peak acceleration) indicated maximum instantaneous acceleration, as indicated by different sensors. However, RMS value has more significance because all the data point has their contribution in the calculation. In contrast, in the case of peak acceleration data, only a single point is considered. The experimental setup showing the arrangement of different sensors on the shaker table is shown in Fig. 1.
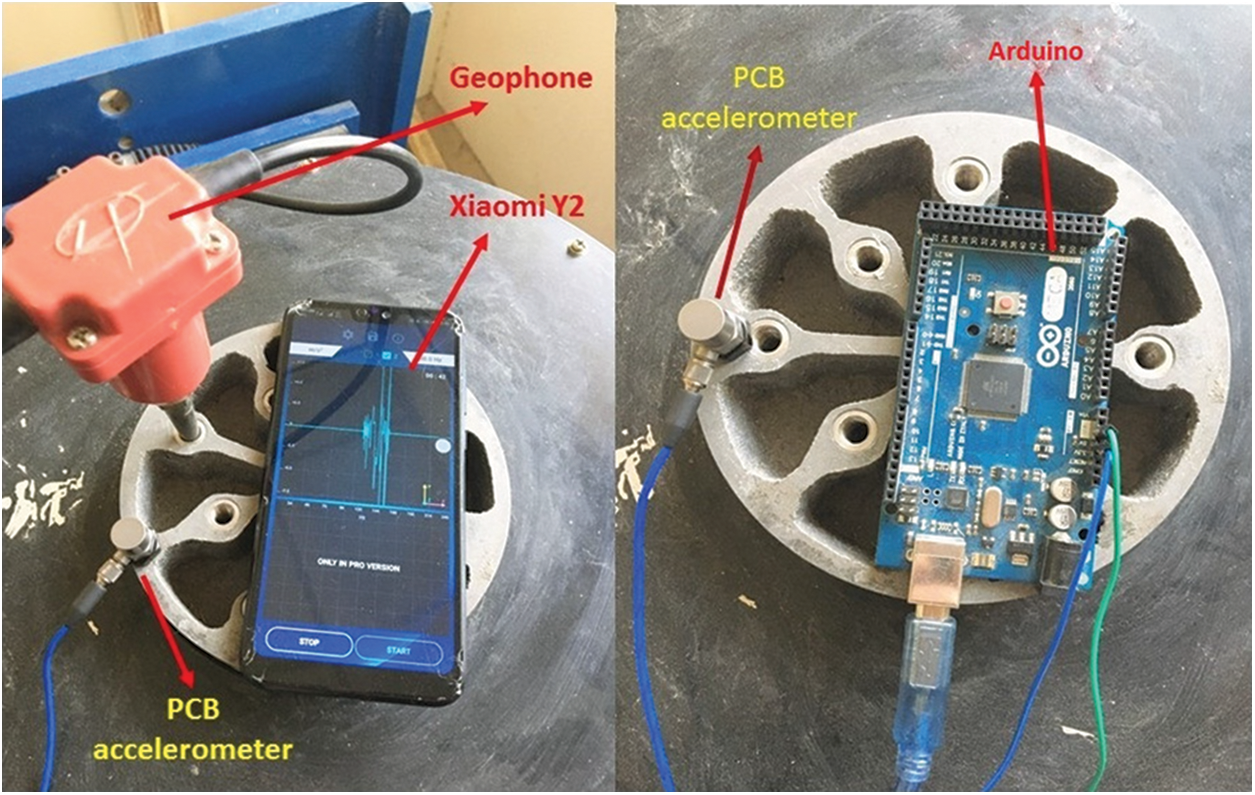
Figure 1: Experimental setup showing the arrangements of Geophone, PCB accelerometer, Xiaomi Y2 smartphone, and Arduino (MPU 6050 is connected with Arduino and placed underneath it) attached on vibration shaker
All three sensors were mounted on a vertical shaker table using a very thin layer of adhesive (double side tape of thickness around one micron so that the system’s stiffness remains the least altered). The shake table was given sinusoidal excitation in the vertical direction, and acceleration data was recorded using National Instrument (NI) data acquisition system (NAT-USB 4432) in NI software Lab View for PCB accelerometer. The velocity and acceleration data from Geophone and MPU 6050 were acquired using Arduino (Model no. Mega 2560). The acceleration data from the smartphone Xiaomi Y2 was recorded using the ‘My Frequency’ android application [25]. The sampling rate of PCB accelerometer, Geophone, Xiaomi Y2, and MPU 6050 was 1000, 342, 200, and 342 samples per second. Since the Geophone is a velocity sensor and acceleration data is computed from a different sensor, the Geophone velocity data at each frequency was converted into acceleration by numerically differentiating the acquired experimental data [26].
For the first time data point, Newton’s forward difference was used:
For all the intermediate points, Newton’s central difference formula was used (due to higher accuracy):
For the last data point, Newton’s backward difference formula was used:
where, f is the velocity data, t is the time variable, and h is the time step.
The convergence study of acceleration-time data after numerical differentiation of velocity-time data for Geophone at 23 Hz frequency is shown in Fig. 2. The time step used for the convergence study was 3, 6 and 9 milliseconds (ms). Fig. 2 shows the zoomed portion of the acceleration-time graph from 1600 ms to 2000 ms. As shown in Fig. 2, the same pattern is observed for the complete time interval of 6 s at 23 Hz frequency. It can be concluded that the acceleration time data converge across different time steps. We used the minimum time step of 3-ms for further calculations.
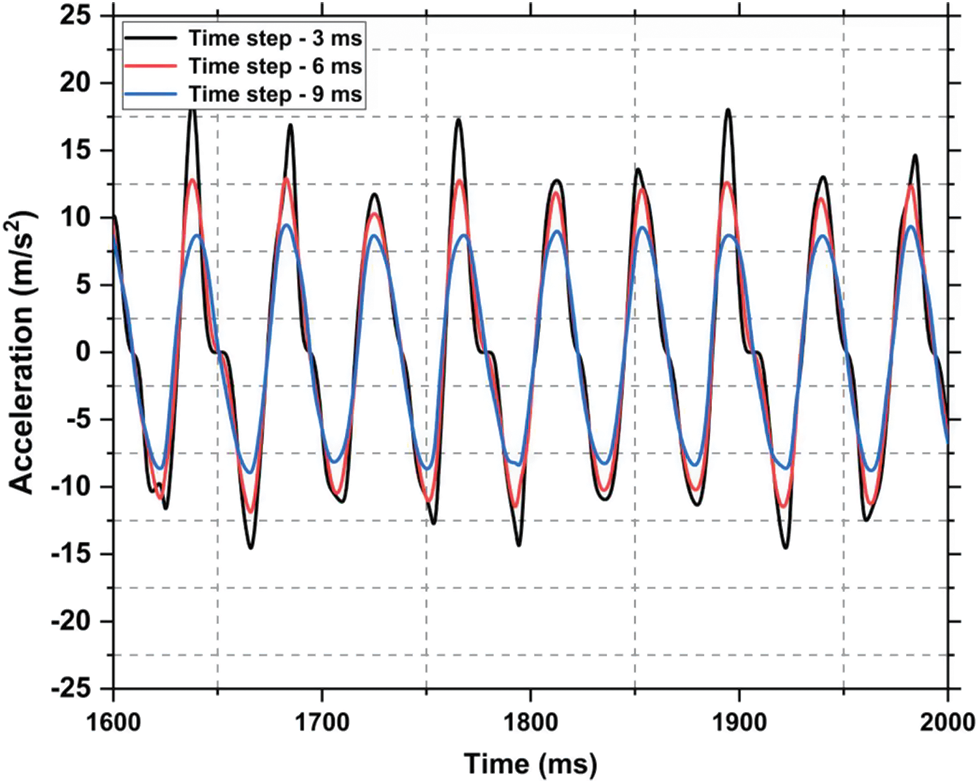
Figure 2: Acceleration-time data showing the convergence study for Geophone by taking time steps as 3 ms, 6 ms and 9 ms
Since the experiment was done by harmonic excitation with sine sweep, each frequency mentioned in the manuscript was excited and acceleration vs. time data was obtained. We have computed the Fast Fourier Transformation (FFT) of time data. The dominant frequency of excitation signal matched well with the excitation provided. The exact frequency calculated from FFT is used in this work. The FFT of time data for MPU 6050 at 18 Hz is shown in Fig. 3.
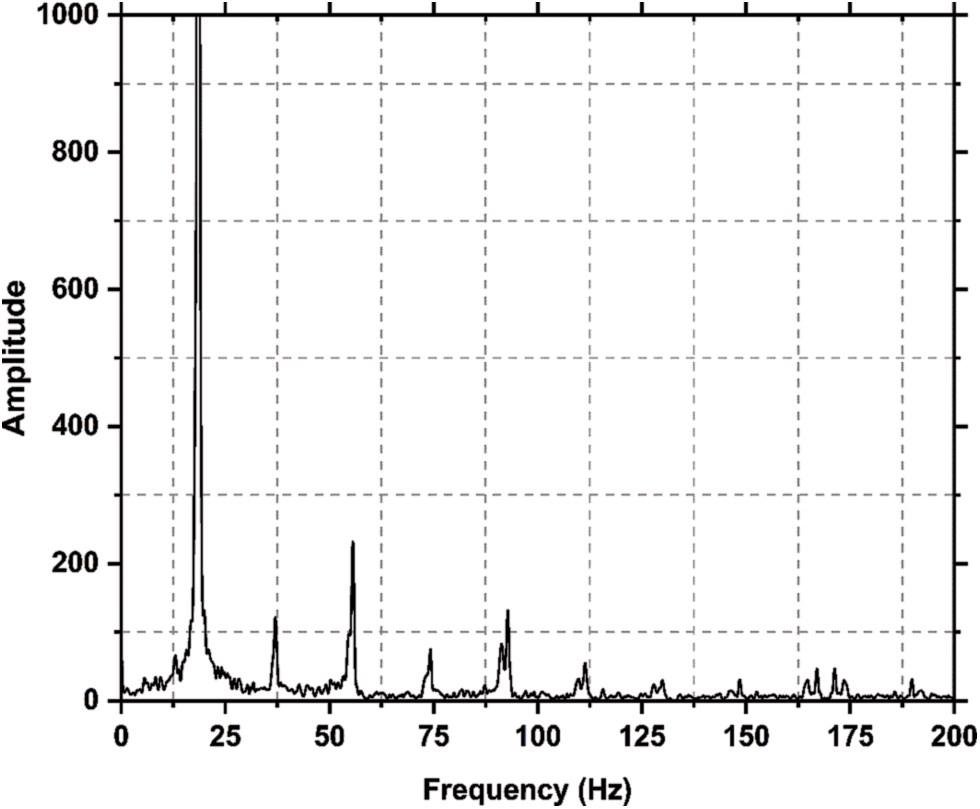
Figure 3: Fast Fourier Transformation (FFT) of the acceleration time data for MPU 6050 sensor at 18 Hz excitation frequency
The accelerations measured (RMS and peak) are normalized with respect to the scientific piezoelectric accelerometer (PCB). This is referred to as relative sensitivity, which should be unity ideally. Thus, relative sensitivity close to one indicates that the tested sensor is as accurate as of the scientific PCB accelerometer. The plot of the relative sensitivity of three sensors (MPU 6050, Xiaomi Y2 smartphone, and Geophone) RMS values and peak values are shown in Figs. 4a and 4b, respectively. The tabulated data for RMS’s mean relative sensitivity and peak value after experimenting ten times is given in Tables 1 and 2. Tables 1 and 2 show that the relative sensitivity of the MPU 6050 is very low in the frequency range from 2–5 Hz, but with increasing the frequency, it gets more accurate. In Xiaomi Y2 smartphone using my frequency application, it has very low relative sensitivity (based on RMS value) at only 2 Hz; however, the relative sensitivity is almost unity from 5 to 46 Hz. Also, relative sensitivity (based on the Peak to Peak value) approaches unity from the frequency range of 9–116 Hz. As shown by the graph and tabulated data, it is found that MPU 6050 sensor has around 90% accuracy in the frequency range of 9 to 116 Hz for RMS value, while it is 90% accurate in the range of 37–116 Hz for both RMS and peak data measurement.
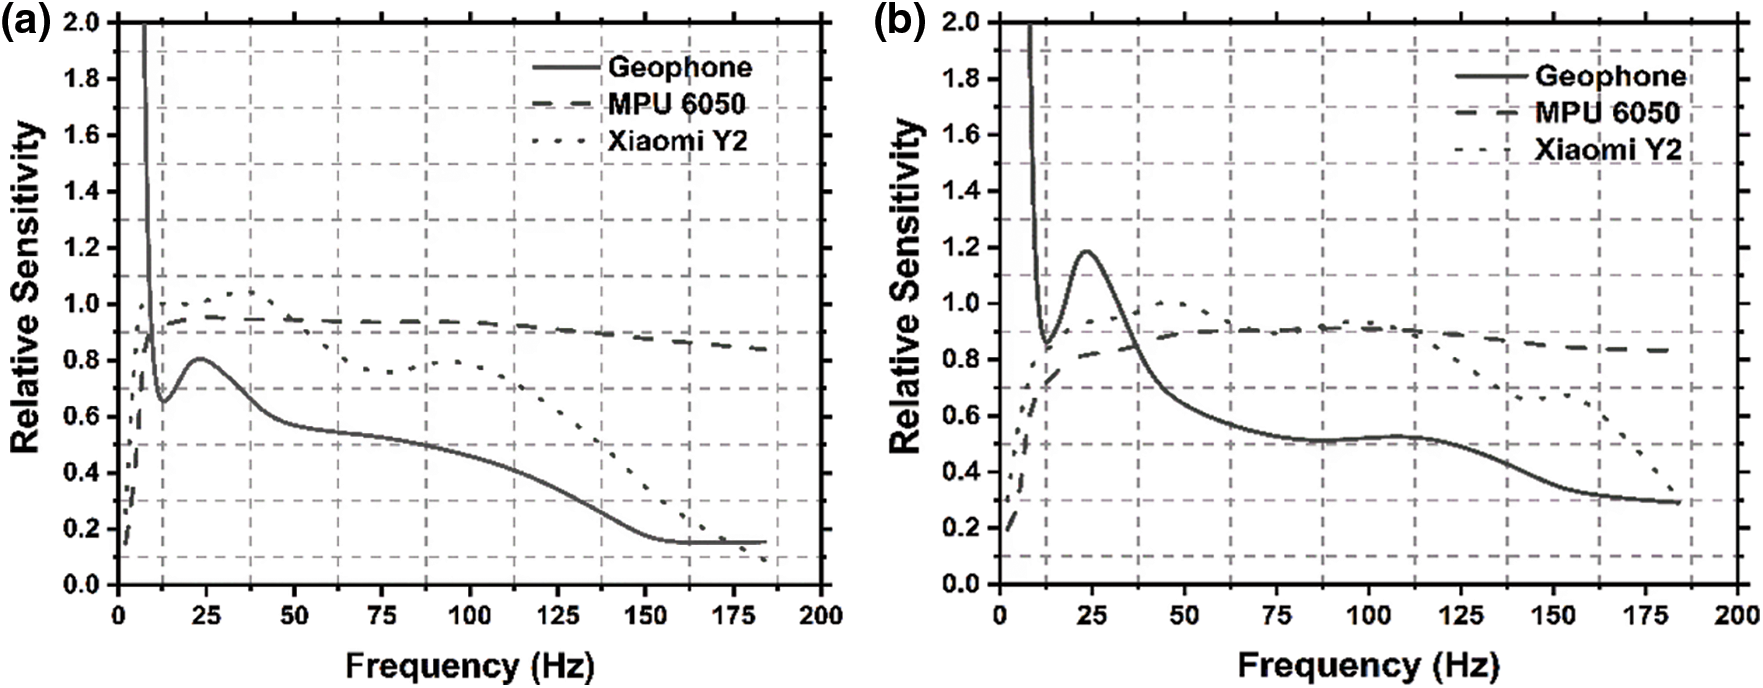
Figure 4: Relative sensitivity (RS) of three sensors (Geophone, MPU 6050, and Xiaomi Y2 smartphone) with respect to PCB accelerometer as a frequency function. (a) and (b) show the RMS and peak acceleration values, respectively
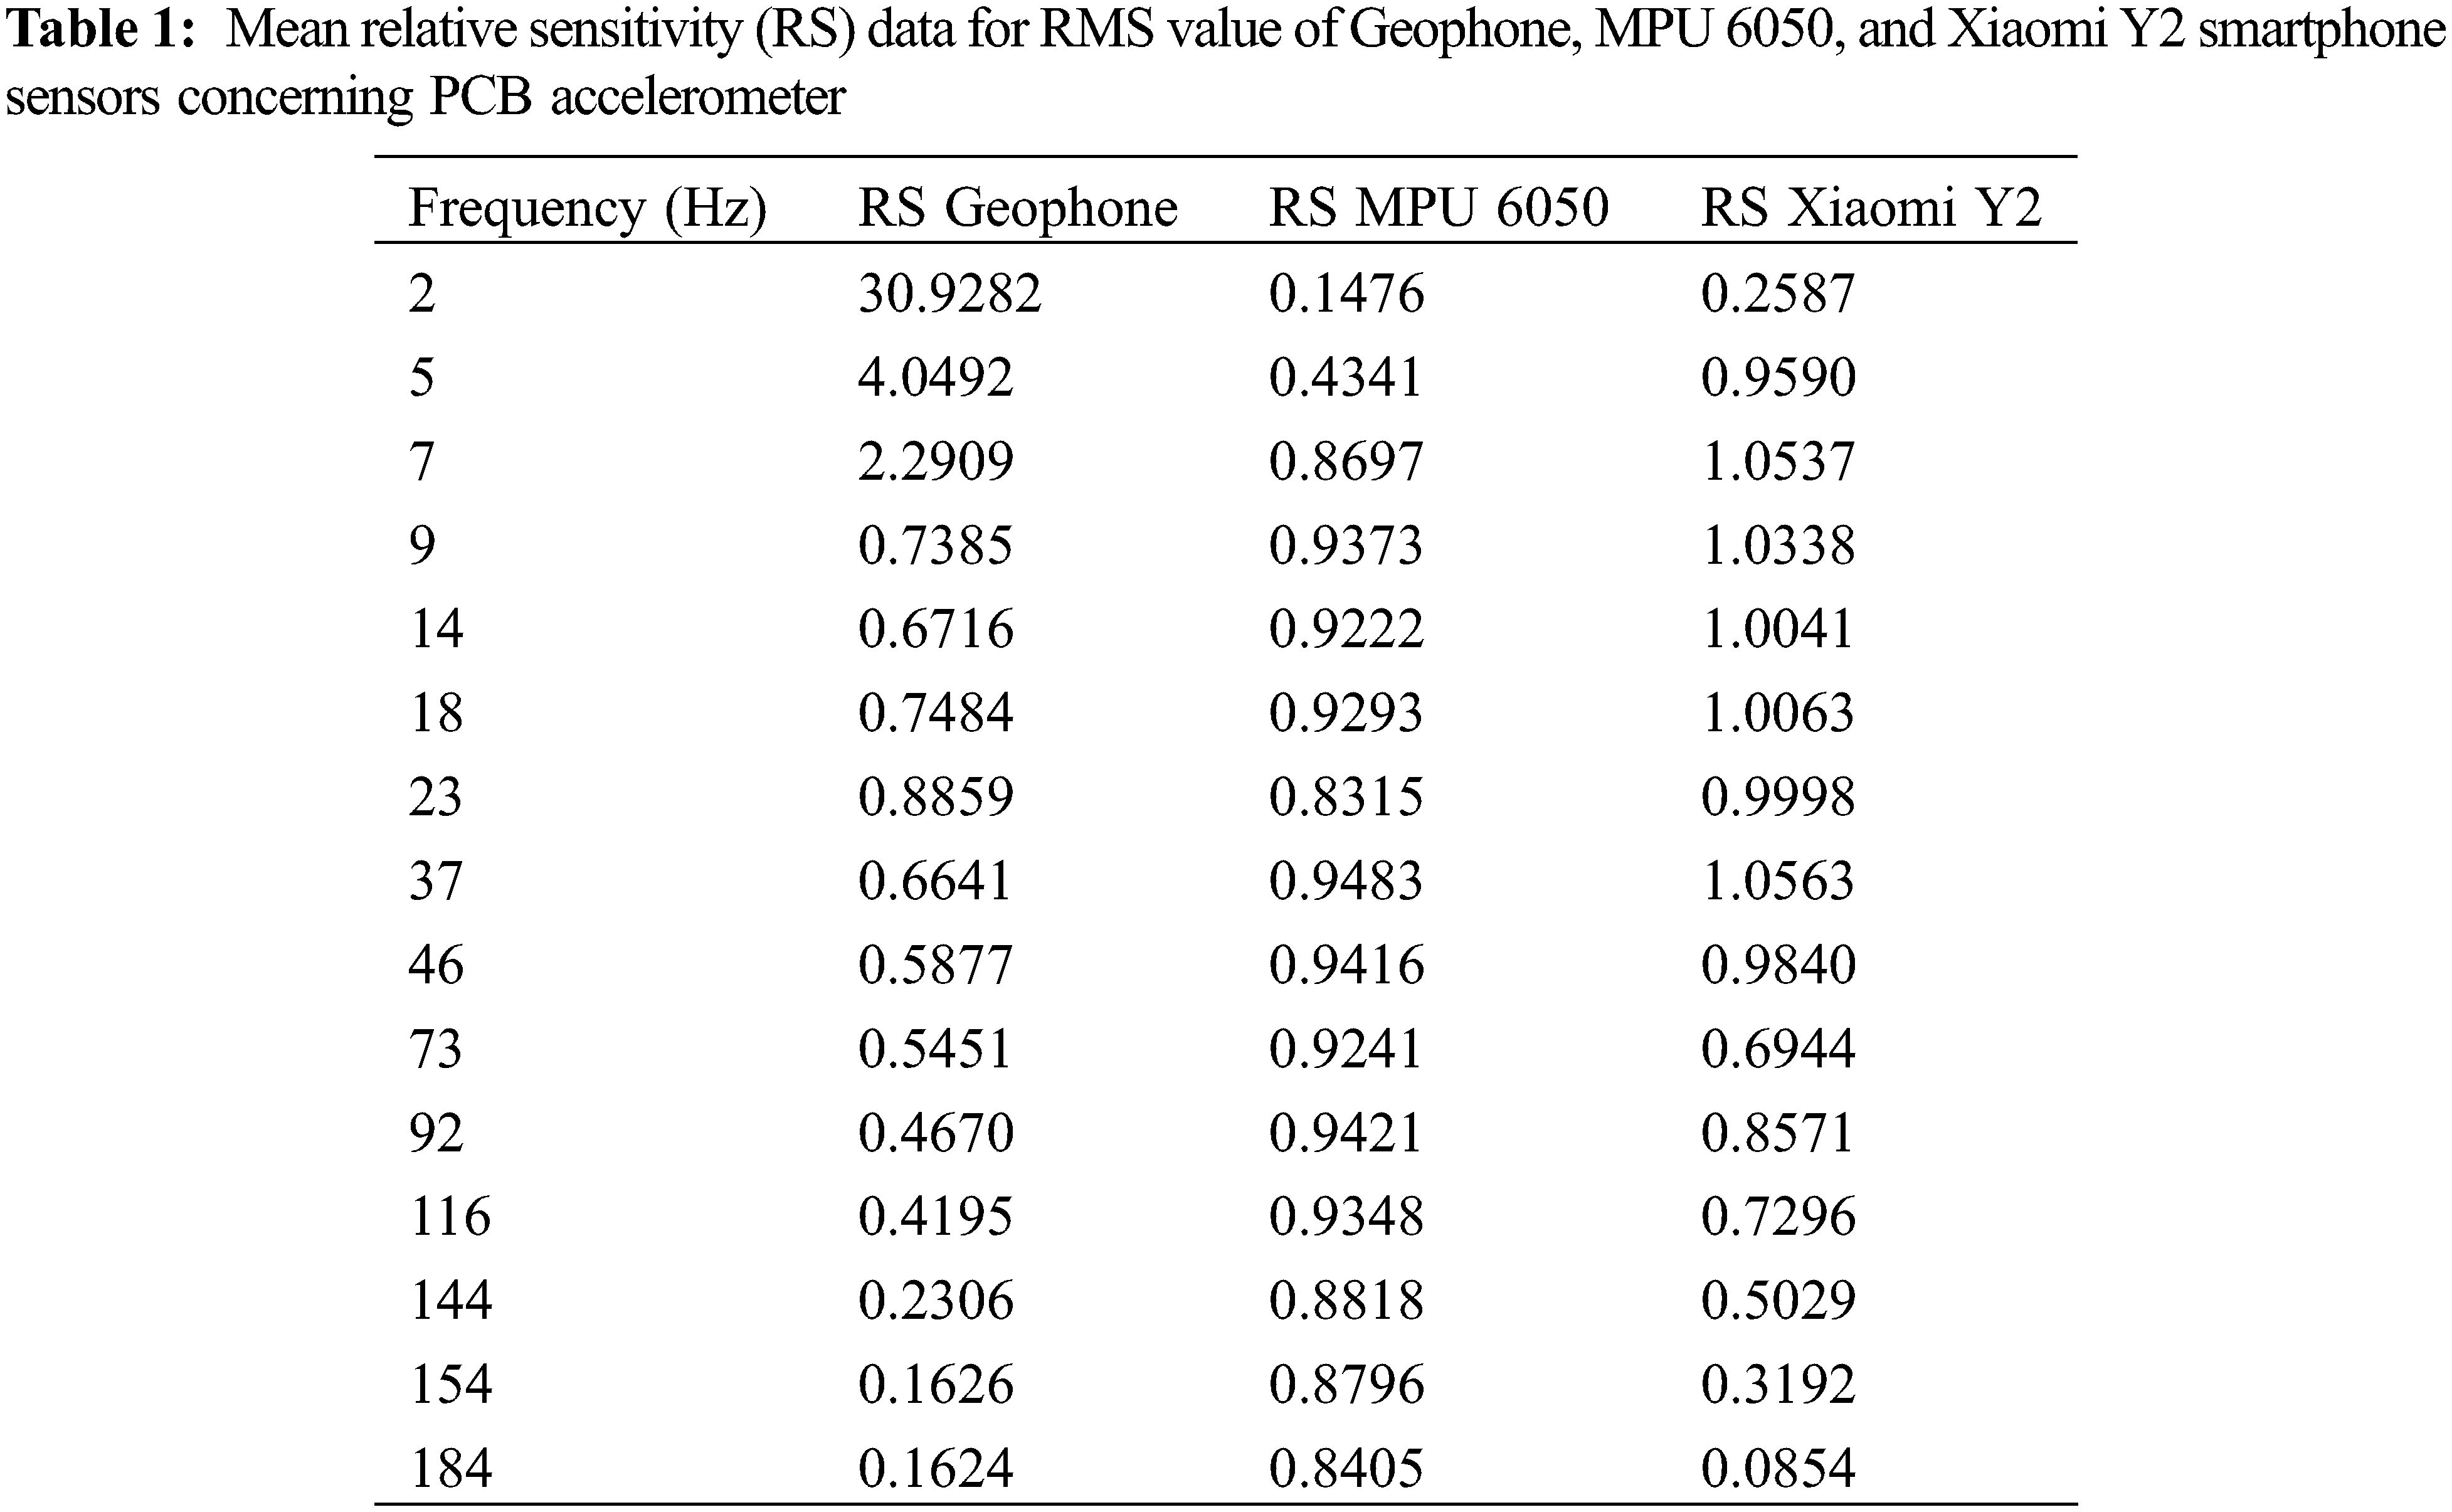
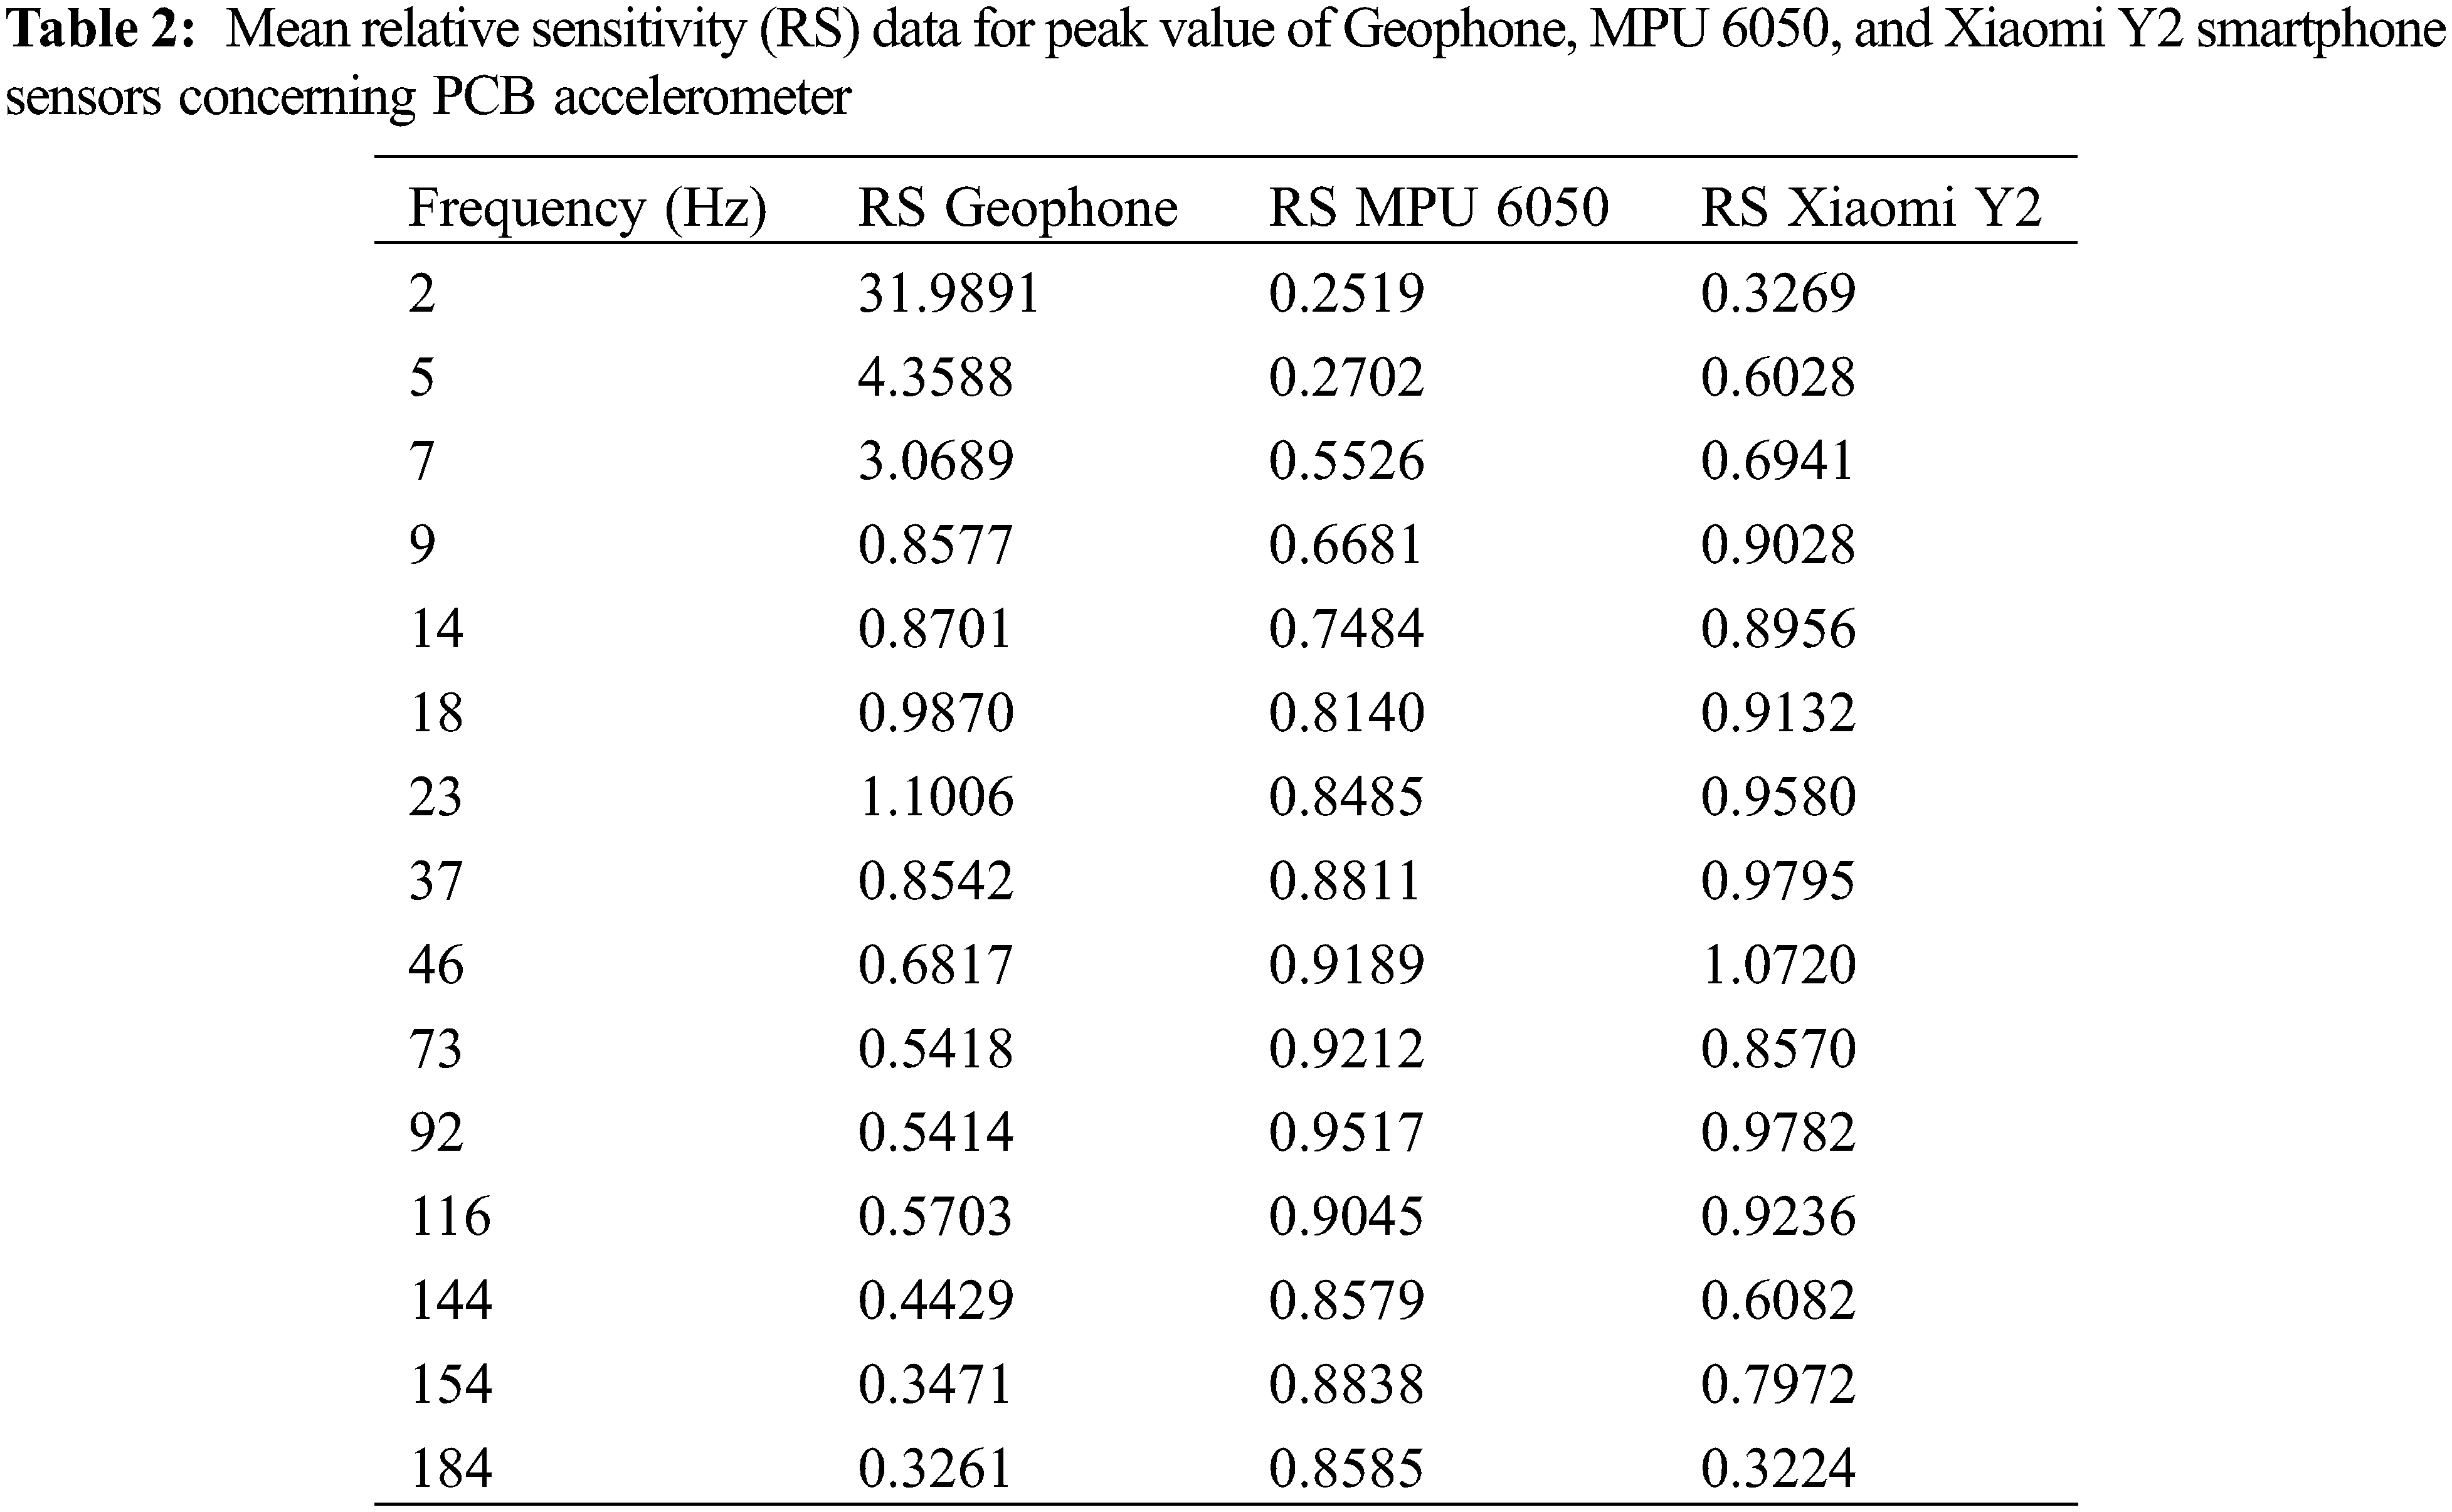
On the other hand, the sensor from Xiaomi Y2 was very accurate (more than 96%) but in a shorter frequency interval from 5 to 46 Hz for RMS values. However, Geophone was not much accurate at low frequency, but the Geophone’s trend for the relative sensitivity in terms of RMS value and the peak value is quite similar. In comparison, Geophone is around 70% accurate in the frequency range of 9–23 Hz. The low accuracy of the Geophone can be to the vertical misalignment of the large length of the tail of the sensor while performing the experiments, which may induce some errors in acquiring the velocity data from Geophone.
The experiment is repeated ten times, and a similar trend is observed for the relative sensitivity of all three sensors as a function of the excitation frequency. Figs. 5a–5c show the spread of relative sensitivity of the three sensors for the RMS value in terms of standard deviation from ten sets of experiments. Overall, the spread of results shows that experiments are repeatable. MPU 6050 is more repeatable and accurate than the Xiaomi Y2 sensor. For Geophone, low-frequency data is an outlier. The errors can be due to numerical differentiation or mutual magnetic induction between the shaker system and Geophone, which work on similar principles.
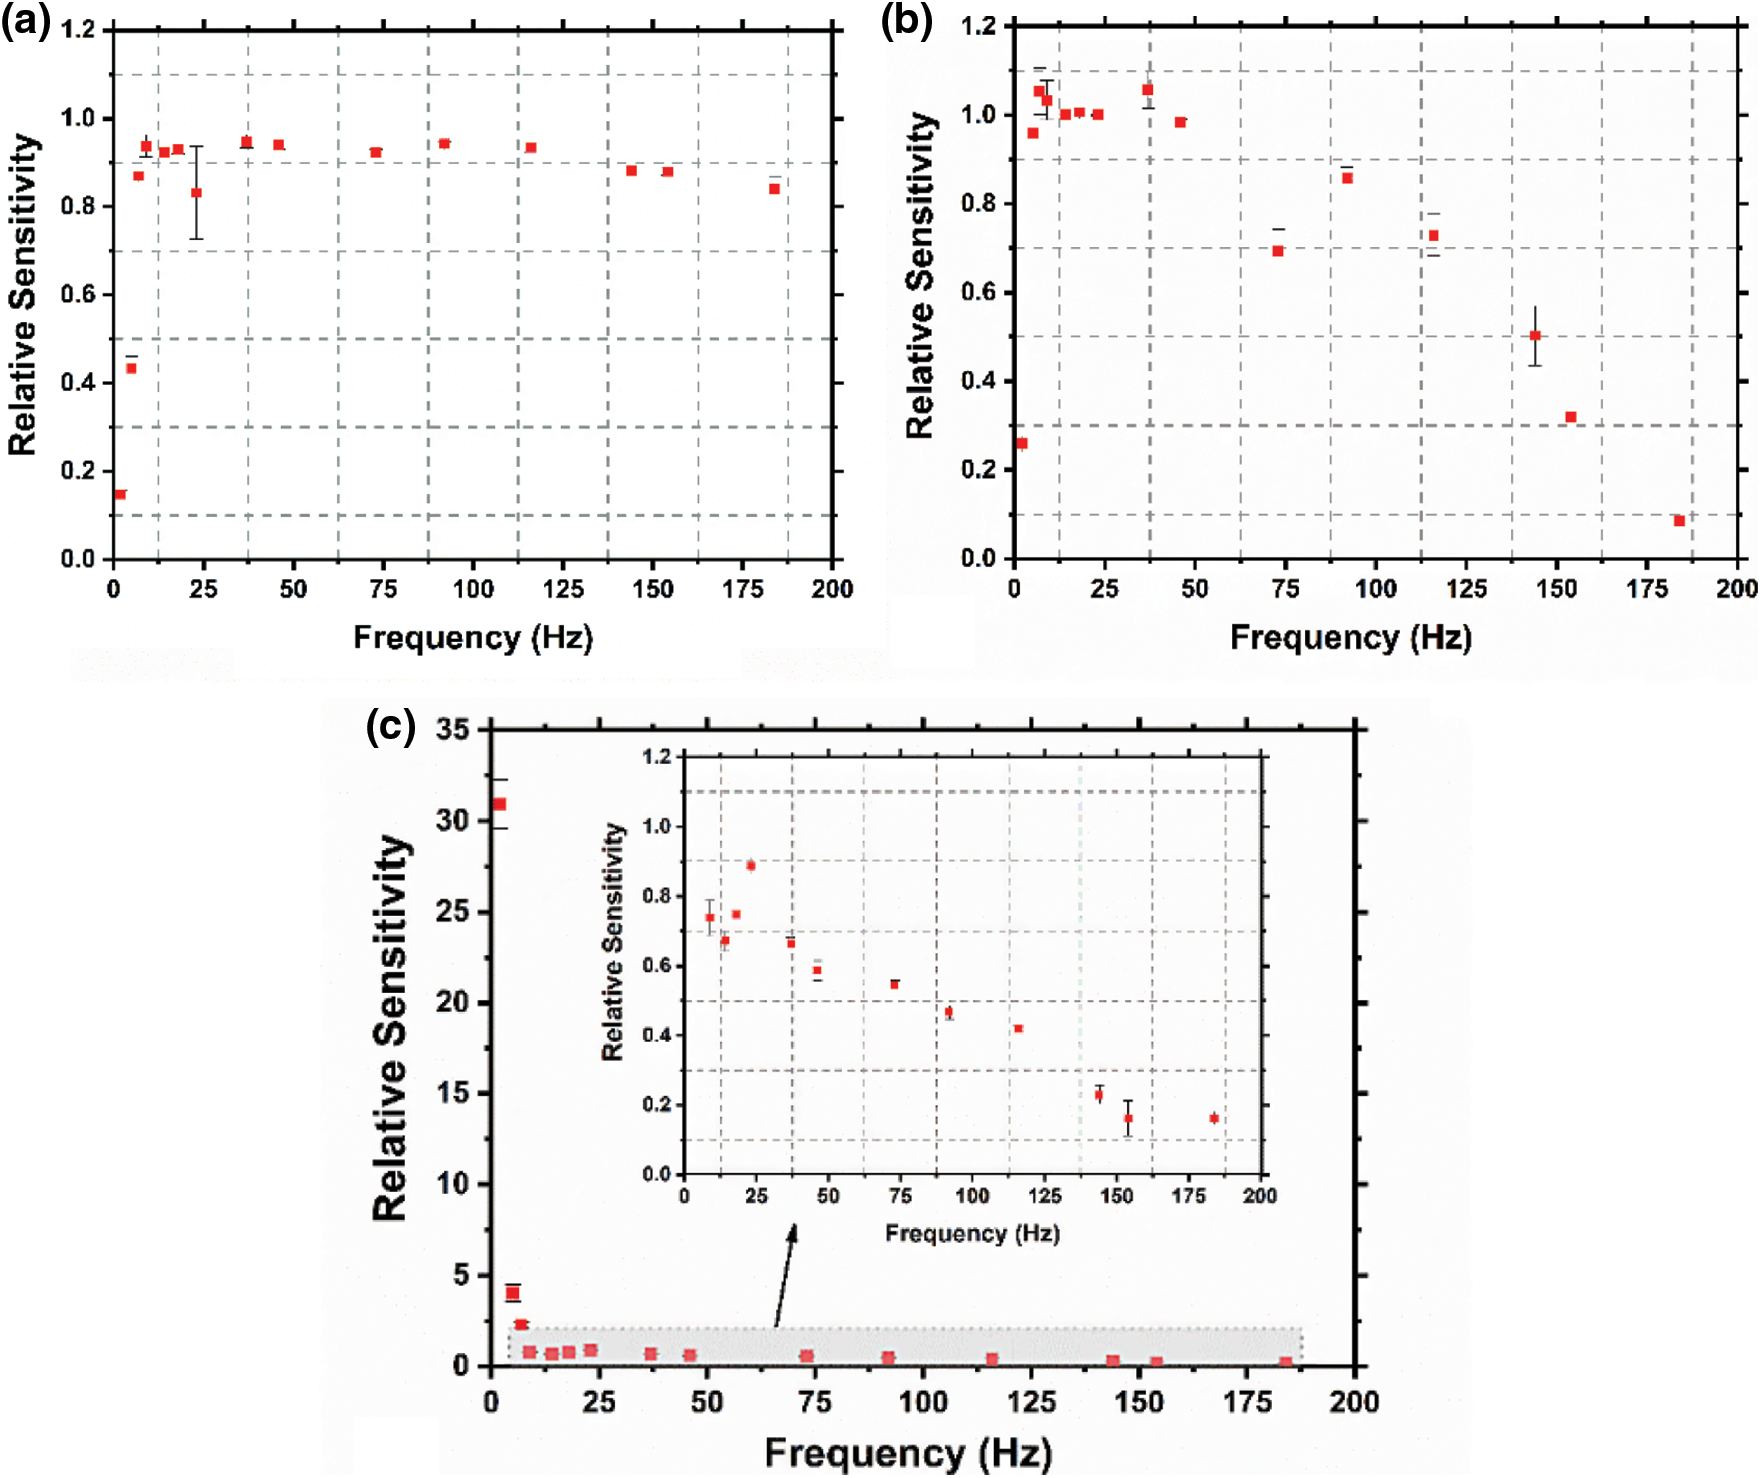
Figure 5: Relative sensitivity (RS) of sensors MPU 6050, Xiaomi Y2 smartphone, and Geophone in figure (a), (b), and (c) respectively with respect to PCB accelerometer as a function of frequency showing the repeatability of the experiment with standard deviation for RMS value
The present work compared three different sensors accuracy to measure acceleration/velocity with a more accurate piezoelectric accelerometer (PCB). The three sensors tested are MEMS MPU 6050, Xiaomi Y2 smartphone sensor, and Geophone. The sensors are mounted on the shaker table and given harmonic excitation in the frequency range from 2–184 Hz. Each sensor’s relative sensitivity is defined as acceleration measured by the sensor with respect to acceleration by a scientific accelerometer. It has been observed that MEMS-based sensor MPU 6050 and sensor from MI Xiaomi Y2 have an accuracy of more than 90% in the broader frequency range 46–116 Hz and 18–46 Hz, respectively. The sensors have low accuracy at lower frequency range (say below 15 Hz). This finding can be due to built-in features of sensors that may not work well at low frequency. For example, MEMS sensors have tiny parts/cantilever, which may not pick up very-low-frequency signals due to high stiffness. There can also be errors due to signal distortion at low frequency (below 20 Hz) generated by the shaker. The first reason for the sensor’s-built limitation can be overcome by providing an external gain/factor in the data measurement system.
The low accuracy of Geophone can also be due to the mutual induction between the Geophone and the shaker. Both Geophone and vibration shaker contains a magnetic coil and work on the principle of mutual induction. When an electric current is passed through the stator coil in a vibration shaker, a strong magnetic field is produced, producing a strong magnetic force. When this magnetic force interacts with the magnetic coil in Geophone, mutual induction may occur between the Geophone and vibration shaker, leading to some errors.
These sensors can find their applications, structural health monitoring fault diagnosis, etc. Out of the three sensors, MPU 6050 seems to be the most accurate and can find practical applications in sensing vibrations measurements and low-frequency excitation due to the landslide monitoring system. The relative sensitivity data presented in this paper can be used to convert less accurate data from these low-cost sensors to more accurate data using some machine learning algorithm. This investigation forms a part of future research.
Funding Statement: The authors would like to acknowledge the support received from DST under the Project DST/INT/CAN/P-04/2020 to support the present work.
Conflicts of Interest: The authors declare that they have no conflicts of interest to report regarding the present study.
References
1. Bogue, R. (2013). Recent developments in MEMS sensors: A review of applications, markets, technologies. Sensor Review, 33(4), 300–304. DOI 10.1108/SR-05-2013-678. [Google Scholar] [CrossRef]
2. Smith, C. S. (1954). Piezoresistance effect in germanium and silicon. Physics Review, 94(1), 42–49. DOI 10.1103/PhysRev.94.42. [Google Scholar] [CrossRef]
3. D’Alessandro, A., Scudero, S., Vitale, G. (2019). A review of the capacitive MEMS for seismology. Sensors, 19(14), 1–22. [Google Scholar]
4. Lawes, R. (2013). MEMS cost analysis from laboratory to industry. CRC Press. [Google Scholar]
5. Research, M. (2019). Global instrumentation sensors research review. https://www.businesswire.com/news/home/20191015005507/en/Global-Instrumentation-Sensors-Research-Review. [Google Scholar]
6. Bhatt, G., Manoharan, K., Chauhan, P. S., Bhattacharya, S. (2019). A review of micromachined sensors for automotive applications. Singapore: Springer. [Google Scholar]
7. InvenSense Inc. (2013). MPU-6050 datasheet. [Google Scholar]
8. Albarbar, A., Badri, A., Sinha, J. K., Starr, A. (2009). Performance evaluation of MEMS accelerometers. Measurement Journal of International Measurement Confederation, 42(5), 790–795. DOI 10.1016/j.measurement.2008.12.002. [Google Scholar] [CrossRef]
9. Jimenez, S., Cole, M. O. T., Keogh, P. S. (2016). Vibration sensing in smart machine rotors using internal MEMS accelerometers. Journal of Sound and Vibration, 377, 58–75. DOI 10.1016/j.jsv.2016.05.014. [Google Scholar] [CrossRef]
10. Rana, N., Varshan, A., Gupta, A. (2022). System identification of two wheelers using a smartphone. In: Recent advances in computational and experimental mechanics, vol. II, pp. 557–566. DOI 10.1007/978-981-16-6490-8. [Google Scholar] [CrossRef]
11. Yadav, S., Gupta, A. (2021). Levitating force and stability analysis of near-field acoustic levitation using flexural vibrations of the plate. Acoustical Physics, 67, 120–127. DOI 10.1134/S1063771021020123. [Google Scholar] [CrossRef]
12. Yang, D., Woo, K., Lee, S., Mitchell, J., Challoner, D. et al. (2017). A micro oven-control system for inertial sensors. Journal of Microelectromechanical System, 26(3), 507–518. DOI 10.1109/JMEMS.2017.2692770. [Google Scholar] [CrossRef]
13. Dong, X., Huang, Q., Xu, W., Tang, B., Yang, S. et al. (2019). Research on temperature characteristic of parasitic capacitance in MEMS capacitive accelerometer. Sensors and Actuators, 285, 581–587. DOI 10.1016/j.sna.2018.12.001. [Google Scholar] [CrossRef]
14. Chan, J., Huang, W. (2017). Multiple-point vibration testing with micro-electromechanical accelerometers and micro-controller unit. Mechatronics, 44, 84–93. DOI 10.1016/j.mechatronics.2017.04.006. [Google Scholar] [CrossRef]
15. Varanis, M., Silva, A., Mereles, A., Pederiva, R. (2018). MEMS accelerometers for mechanical vibrations analysis: A comprehensive review with applications. Journal of Brazilian Society of Mechanical Science and Engineering, 40(11), 1–18. DOI 10.1007/s40430-018-1445-5. [Google Scholar] [CrossRef]
16. Chan, J., Huang, W. (2018). Time-domain operational modal analysis in machine tools: Optimal parameters and practical issues. International Journal of Precise Engineering and Manufacturing, 19(6), 889–897. DOI 10.1007/s12541-018-0105-0. [Google Scholar] [CrossRef]
17. Al-Madani, B., Svirskis, M., Narvydas, G., Maskeliunas, R., Damasevicius, R. (2018). Design of fully automatic drone parachute system with temperature compensation mechanism for civilian and military applications. Journal of Advanced Transportation, 2018(4), 1–11. DOI 10.1155/2018/2964583. [Google Scholar] [CrossRef]
18. Kos, B., Grodzicki, M., Wasielewski, R. (2018). Electronic system for the complex measurement of a wilberforce pendulum. European Journal of Physics, 39(3), 035804-035811. DOI 10.1088/1361-6404/aaa56e. [Google Scholar] [CrossRef]
19. Nag, S., Dhar, A., Gupta, A. (2021). Hydrogen-diesel co-combustion characteristics, vibro-acoustics and unregulated emissions in EGR assisted dual fuel engine. Fuel, 307, 121925. DOI 10.1016/j.fuel.2021.121925. [Google Scholar] [CrossRef]
20. Huang, X., Li, Z., Fan, J., Yu, D., Xu, Q. (2020). Frequency characteristics and numerical computation of seismic records generated by a giant debris flow in Zhouqu. Pure Applied Geophysics, 177(1), 347–358. DOI 10.1007/s00024-019-02177-5. [Google Scholar] [CrossRef]
21. Tsujiura, M. (1983). Characteristic frequencies for earthquake families and their tectonic implications: Evidence from earthquake swarms in the Kanto district, Japan. Pure Applied Geophysics, 121(4), 573–600. DOI 10.1007/BF02590156. [Google Scholar] [CrossRef]
22. Ribeiro, R., Lameiras, R. (2019). Evaluation of Low-cost MEMS accelerometers for SHM: Frequency and damping identification of civil structures. Latin American Journal of Solids and Structure, 16(7), 1–24. DOI 10.1590/1679-78255308. [Google Scholar] [CrossRef]
23. Kumar, P., Sihag, P., Pathania, A., Chaturvedi, P., Uday, V. K. et al. (2021). Comparison of moving-average, lazy, and information gain methods for predicting weekly slope-movements: A case-study in Chamoli, India. In: Casagli, N., Tofani, V., Sassa, K., Bobrowsky, P. T., Takara, K. (Eds.Understanding and reducing landslide disaster risk, pp. 321–330. Cham: Springer. DOI 10.1007/978-3-030-60311-3_38. [Google Scholar] [CrossRef]
24. Pathania, A., Kumar, P., Priyanka, Maurya, A., Uday, K. V. et al. (2021). Development of an ensemble gradient boosting algorithm for generating alerts about impending soil movements. In: Gopi, E. S. (Eds.Lecture notes in electrical engineering, vol. 749. Singapore: Springer. DOI 10.1007/978-981-16-0289-4_28. [Google Scholar] [CrossRef]
25. Goodrich, M., Chapman, D. (2021). https://play.google.com/store/apps/details?id=apptodate.myFrequency&hl=en&gl=US. [Google Scholar]
26. Chapra, S., Canale, R. (2015). Numerical methods for engineers. Boston: McGraw-Hill Higher Education. [Google Scholar]
Cite This Article
 Copyright © 2022 The Author(s). Published by Tech Science Press.
This work is licensed under a Creative Commons Attribution 4.0 International License , which permits unrestricted use, distribution, and reproduction in any medium, provided the original work is properly cited.
 Downloads
 Citation Tools