
 Submit a Paper
 Open Access
ARTICLE

A Sound Quality Evaluation Method for Vehicle Interior Noise Based on Auditory Loudness Model
1 School of Mechatronic Engineering, China University of Mining and Technology, Xuzhou, 221116, China
2 School of Mechanical and Automotive Engineering, Shanghai University of Engineering Science, Shanghai, 201620, China
3 Auto Engineering Research Institute, BYD Auto Industry Co., Ltd., Shenzhen, 518118, China
* Corresponding Author: Houguang Liu. Email:
(This article belongs to the Special Issue: Passive and Active Noise Control for Vehicle)
Sound & Vibration 2024, 58, 47-58. https://doi.org/10.32604/sv.2024.045470
Received 28 August 2023; Accepted 22 January 2024; Issue published 27 February 2024
 View Full Text
 Download PDF
Abstract
When designing and optimizing the hull of vehicles, their sound quality needs to be considered, which greatly depends on the psychoacoustic parameters. However, the traditional psychoacoustic calculation method does not consider the influence of the real human ear anatomic structure, even the loudness which is most related to the auditory periphery. In order to introduce the real physiological structure of the human ear into the evaluation of vehicle sound quality, this paper first carried out the vehicle internal noise test to obtain the experimental samples. Then, the physiological loudness was predicted based on an established human ear physiological model, and the noise evaluation vector was constructed by combining the remaining four psychoacoustic parameters. Finally, the evaluation vector was fitted into the subjective evaluation results of vehicle interior noise by a deep neural network. The results show that our proposed method can estimate the human subjective perception of vehicle interior noise well.Keywords
With the improvement of people’s requirements for vehicle comfort, vehicle sound quality assessment has attracted much attention [1,2]. Sound quality assessment aims to quantitatively assess the characteristics and quality of vehicle interior noise to provide a more comfortable and pleasant driving environment [3]. Vehicle interior noise is caused by many factors such as engine, wheel, and wind resistance, which can alter the comfort of the people in the car and affect the safety of the car [4]. Therefore, in-depth study and accurate evaluation of vehicle sound quality have become a common concern of automobile manufacturers, R&D personnel, and consumers [5,6]. Given the expenses related to both time and manpower in conducting subjective assessments, the establishment of a precise objective evaluation model for vehicle sound quality holds immense importance.
Within the realm of objective evaluation, certain measurable criteria are frequently employed to assess the sound quality (SQ) of automobiles [7,8]. Zwicker et al. quantified some psychoacoustic indicators that created an annoyance model, including loudness, sharpness, roughness, and fluctuation strength [9]. Di et al. introduced tonality to improve model performance [10]. However, these troubles are caused by the fact that the model fitting process is based on the linear regression algorithm. Considering the nonlinear relationship between psychoacoustic parameters and subjective perception, Wang et al. introduced neural networks to predict sound quality [11].
Although previous research has achieved great success, these traditional calculation methods do not consider the physiological structure of the human ear, although SQ is largely related to the human auditory pathway [12]. This neglect of the physiological structure of the human ear makes it impossible for the model to study the loudness perception characteristics of people with different hearing conditions by changing the disease attributes of ear tissues such as the ossicular chain [13] and hair cells [14].
The loudness model built by Piper et al. based on physiological models provides an idea to solve this problem [15]. However, the physiological model he used did not consider the real middle ear structure. In this paper, we introduce the middle ear equivalent circuit model into the human ear physiological model and construct a loudness model based on the physiological model. Based on physiological loudness and other psychoacoustic parameters (sharpness, roughness, strength fluctuation, and tonality), a deep neural network (DNN) is employed to predict the subjective evaluation of interior vehicle noise. By comparing these prediction outcomes against experimental results, the model’s precision is validated. This method introduces a novel approach to physiologically assessing interior vehicle noise. The construction of a sound quality model based on physiological structure also laid the foundation for later changing the physiological tissue parameters in the model and theoretically studying the sound quality perception characteristics of people with different hearing conditions.
2.1 Noise Collection Experiment
Following the acoustic measurement conditions outlined in ISO 5128-1980, the structure of the artificial human head was modified, and the internal noise of the vehicle was collected on the flat asphalt pavement with a small traffic flow [16]. The test vehicle was a B-class car, and the load on the vehicle was sound test equipment, one driver, and two surveyors. During the test, the doors and windows of the car were all turned off, and the air conditioning and electronic products in the car were all turned off. The test equipment used in the experiment mainly included Aihua microphones (AWA14423) and an NI acquisition card (NI USB-4431).
Firstly, the microphones were arranged in the car according to the international standard requirements, and the microphones were calibrated before the test. After the background noise was measured, the sample collection could be started. The four positions of the driver’s seat, the co-driver seat, and the left and right passenger seats in the rear row were selected for sampling experiments. The test diagram layout is shown in Fig. 1 below.
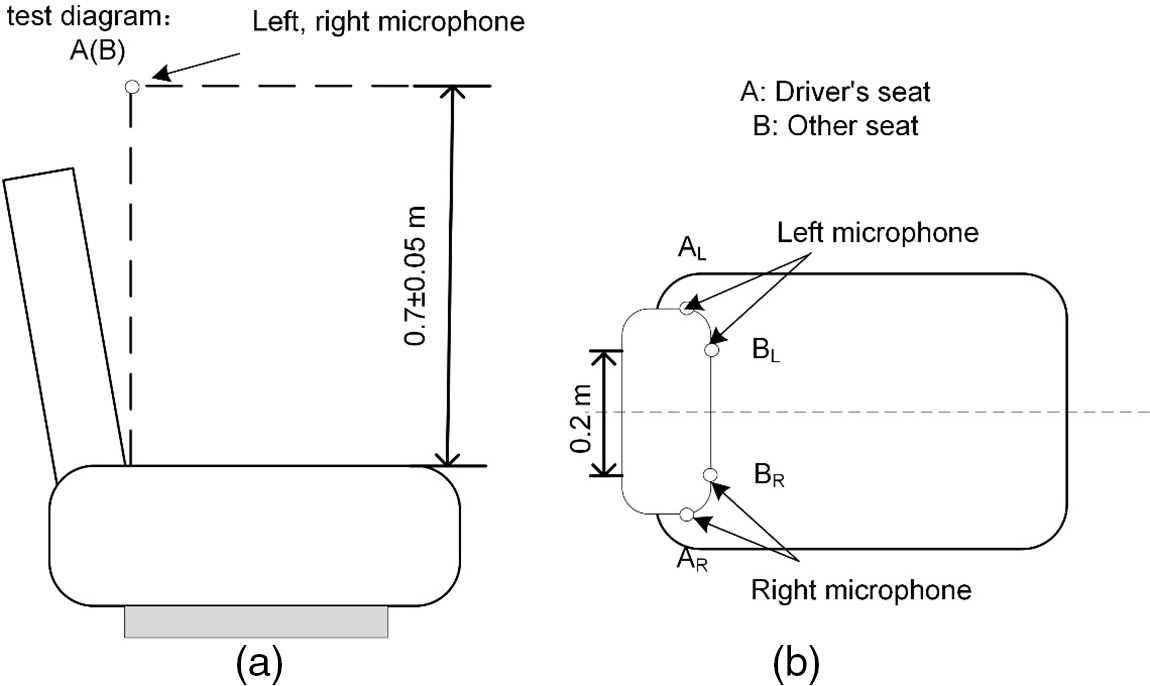
Figure 1: Microphone measuring point layout diagram (a) Microphone measuring point layout diagram, right view; (b) Microphone measuring point layout diagram, top view
The acoustic environment within the vehicle was evaluated across four distinct operational scenarios: uniform speed condition, acceleration condition, fixed condition, and braking condition. The sampling frequency was set to 44100 Hz. The noise collected at four different locations in the vehicle under these four working conditions was intercepted, and a total of 40 noises were obtained, each of which lasted 5 s.
2.2 Subjective Evaluation Experiment
When conducting advantage experiments, twenty-eight evaluators were selected, all of whom were hearing-impaired. The ratio of men to women is about 2:1, with 19 men and 9 men, respectively, ranging in age from 20 to 36 years old, with an average age of 27.8 years. Before the evaluation, the evaluators will be randomly played several noise samples to familiarize themselves with the evaluation.
Adaptive grouped paired comparison method was used to assess the subjective sound quality evaluation values (SEVs) of the noise samples [12]. Relevant research showed that for most psychoacoustic subjective evaluation tests, 20 evaluators had been able to meet the requirements [17]. In the evaluation process, 40 samples were divided into 3 groups: group 1 contained 14 samples, group 2 had 13 samples, and group 3 also consisted of 13 samples. The comparison was formed by the combination of the above groups. The comparison contains two noises A and B. When the subject scores it, if A was more irritated than B, B was counted as two points, and vice versa. If A and B were equally irritated, each was counted as one point.
In order to remove misjudged data, the weighted consistency coefficient (ζw) is used to judge the validity of the evaluation results. If ζw is less than 0.7, the data will be submitted. The calculation formula is shown in Eq. (1):
where Ei is the number of times the i-th misjudgment occurs, and Ci is the actual misjudgment rate of the i-th misjudgment. There are three forms of misjudgment: AA misjudgment, AB misjudgment, and ABC misjudgment [12].
In addition, the weighted consistency coefficients of three evaluators in this test were lower than 0.7, and the evaluation results were considered invalid and they were removed. Therefore, only the results of the remaining 25 evaluators are used.
The subjective evaluation test was conducted in a double-layer anechoic chamber with a background noise of 17 dB. The Sennheiser HD650 high-fidelity headphones and laptop was used as sound playback devices. In subjective evaluation and model calculation, the ear tissue that the playback sound passes through is the same. Therefore, the inaccuracy in collecting sound samples caused by not using an artificial head (failing to reflect the influence of the auricle, head and trunk) has the same impact on both, and will not affect whether the sound quality model constructed in this article can be compared. Conclusions that predict subjective evaluation results well.
Based on the physiological anatomy of the human ear, this paper established a physiological loudness perception model including the outer ear, middle ear, inner ear and nerve firing. Based on this physiological loudness perception model, a further construction of a vehicle interior noise sound quality prediction model was carried out. The inputs of this sound quality prediction model are 5 psychoacoustic parameters, and the outputs are SEVs of vehicle noise. One of the five psychoacoustic parameters is loudness based on the physiological structure of the human ear.
3.1 Loudness Model Based on Physiological Model
Fig. 2 illustrates the loudness perception model grounded in the physiological structure of the human ear. The model primarily comprises two main components: the auditory peripheral module and the back-end processing module that simulates the neural firing related to loudness perception. The auditory peripheral module includes three parts: the external auditory canal part, which emulates sound transmission characteristics from the front of the human head to the tympanic membrane; and the middle ear part, which simulates the vibration transmission characteristics from the tympanic membrane to the stapes footplate; along with the inner ear segment, which replicates the vibration transmission characteristics from the stapes to the basilar membrane.
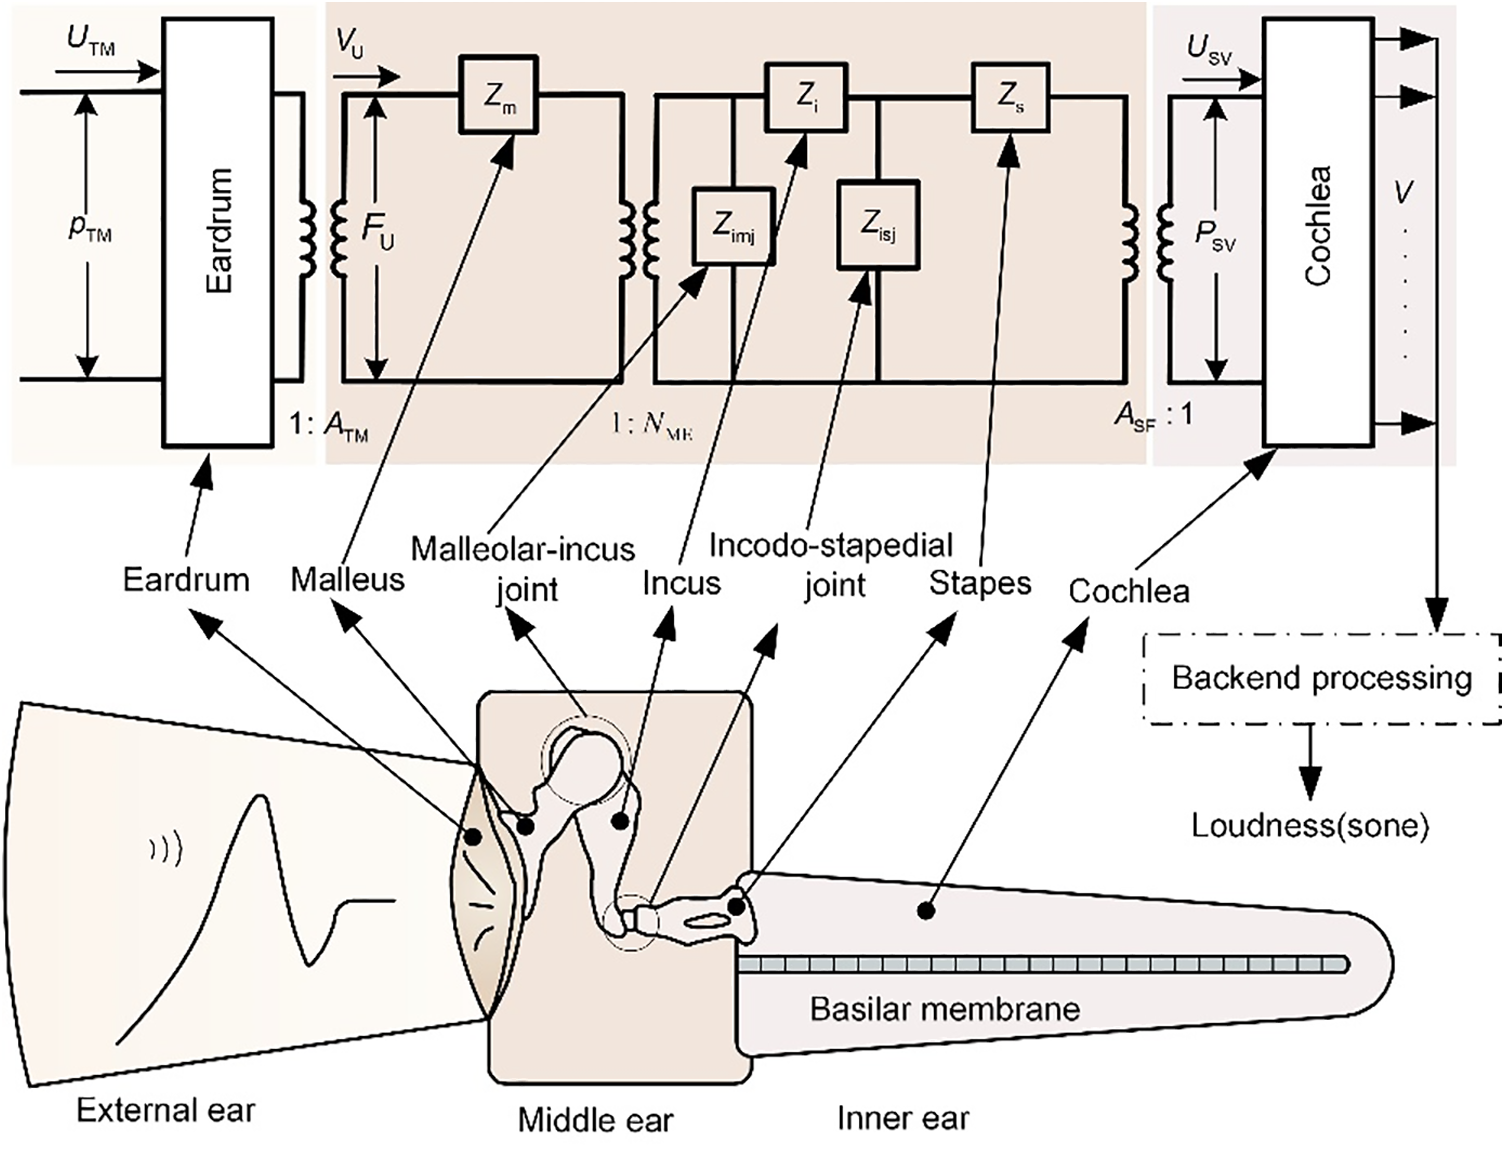
Figure 2: Physiological loudness model structure
The external auditory canal part is simplified by transfer function simulation [18], the middle ear was simulated using the equivalent circuit model which we previously established [19]. The equivalent impedances of the malleus, incus-malleus joint, incus, incus-stapes joint, and stapes were as follows:
To transform the physical excitation of the basilar membrane response calculated by the auditory peripheral model into the loudness related to nerve firing, a back-end processing module for loudness perception calculation is constructed. First, the absolute value of the response speed of each position of the basilar membrane at different times is taken to form a two-dimensional auditory signal matrix. Then it is divided into 23 excitation segments according to the longitudinal position of the basilar membrane so that the auditory signal matrix is decomposed into 23 micro-auditory signal matrices. All the basilar membrane segments with characteristic frequencies of 80–11180 Hz are divided into 21 excitation segments according to 1/3 octave. Moreover, the basilar membrane segments with characteristic frequencies greater than 11180 Hz and less than 80 Hz are used as an excitation segment respectively. This reduces the loudness fitting optimization time while minimizing the loss of basilar membrane output information.
Then, the auditory signal matrix generated by each excitation segment is integrated on the time axis by the RC integral circuit. The sampling frequency is consistent with the sampling frequency of the noise signal, which is 44100 Hz, and the time constant τ is 25 ms. The duration of the input signal of the model is selected to be 0.2 s, and the distinction between a finite-duration signal and an infinite-duration signal caused by the integrator is not more than 5%. The initial physiological excitations obtained by integrating the response speed of the basilar membrane by the integrator:
If all the initial physiological excitations are averaged at each time node m, a one-dimensional array of mean physiological excitations can be obtained; then take the maximum value of this array to get the excitation generated by the xth excitation segment:
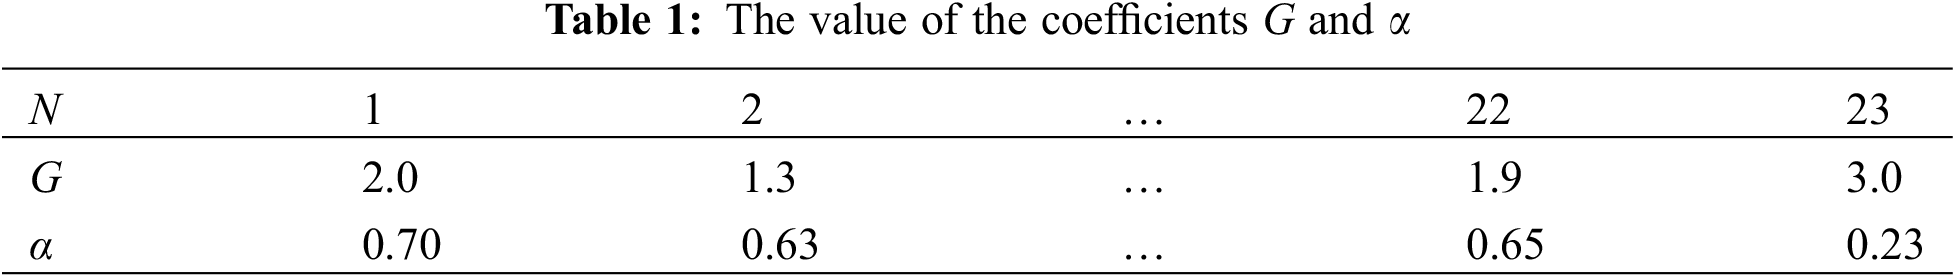
N is the number of segments of the basilar membrane in the xth excited segment. Then the power-law function is used to transform the excitement into physiological loudness:
The particle swarm optimization algorithm is used to calculate the coefficients
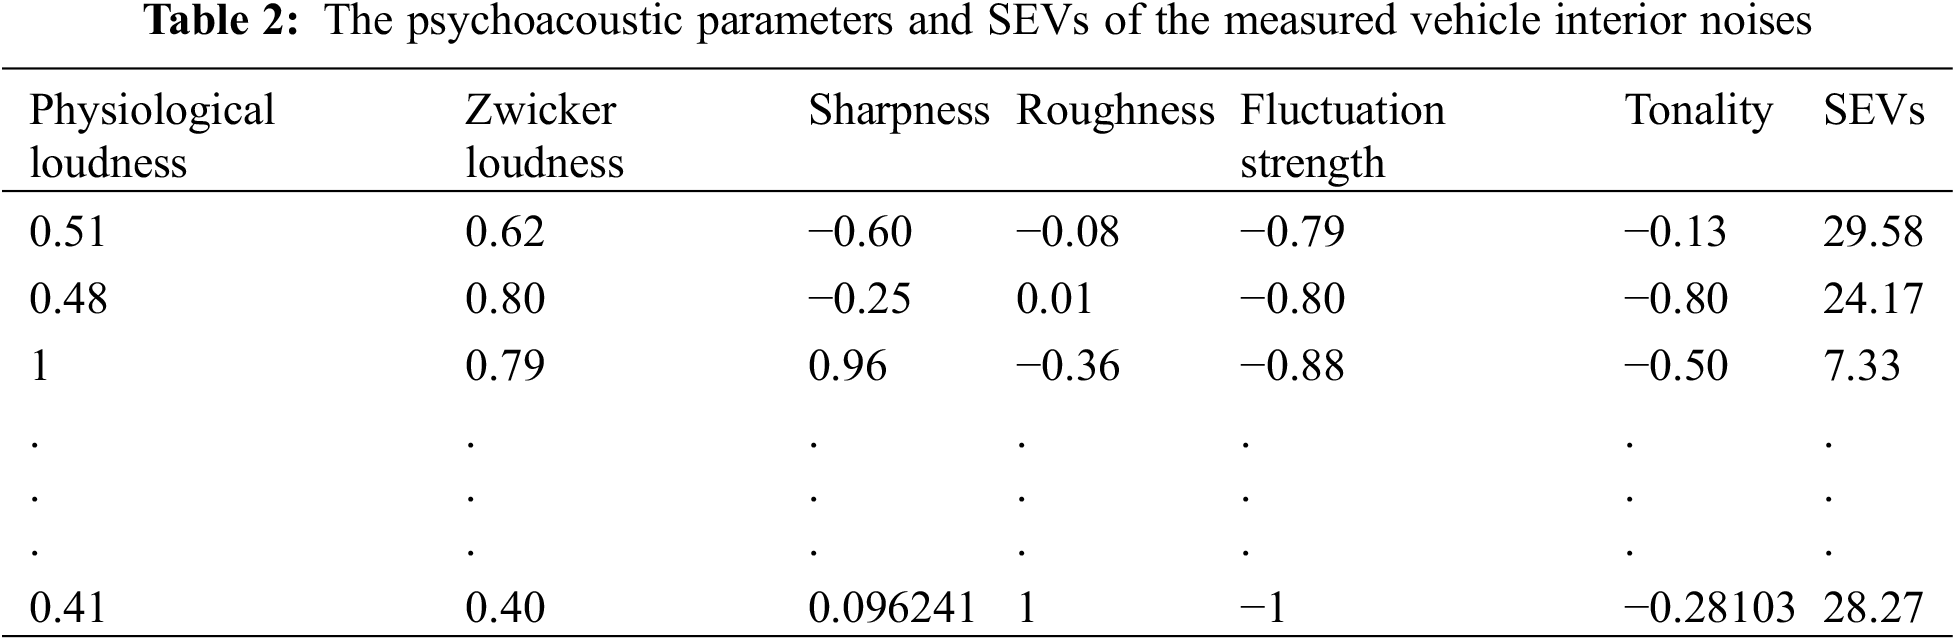
The physiological loudness of the noise sample calculated according to the constructed loudness model (after normalization) is shown in Table 2 below:
3.2 The Rest Model of the Index for Sound Quality Evaluation
The study found that in addition to loudness, other acoustical parameters (AP) which include sharpness, roughness, tone, and fluctuation strength also influence sound quality [10,23]. Sharpness is an objective measure that signifies the presence of high-frequency elements within sound, offering an objective depiction of sound signal’s sharp or jarring qualities. In this study, we calculated the sharpness according to DIN45692 [24]. Roughness is a psychoacoustic parameter that reflects the distribution characteristics of sound modulation amplitude, modulation degree, and modulation frequency. We use Daniel et al.’s improved Zwicker roughness model to predict roughness [25]. The tonality is calculated from the model proposed by Aures and Terhardt. According to them, tonality is an objective measure denoting the ratio of pure tone components within the spectrum of a sound signal [26,27]. Fluctuation strength is an objective parameter to describe the fluctuation intensity of sound signal, which signifies the extent of human ear perception towards slowly varying modulated sounds. Its calculation model proposed by Osses et al. at the 22nd International Congress on Acoustics is utilized for predicting the index [28].
3.3 Topology of Deep Neural Networks
The deep feedforward neural network to fitting the SEVs that the input head dimension is 5 APs (physiological loudness, sharpness, roughness, fluctuation strength and tonality). The network structure is shown in Fig. 3, which is stacked by n basic layers, and the number of n is determined by ablation experiments. Each layer of the network is a fully connected layer. Except for the linear layer output node outside the nth base layer, which is 1, the input and output nodes of all linear layers in the base layer are 5.
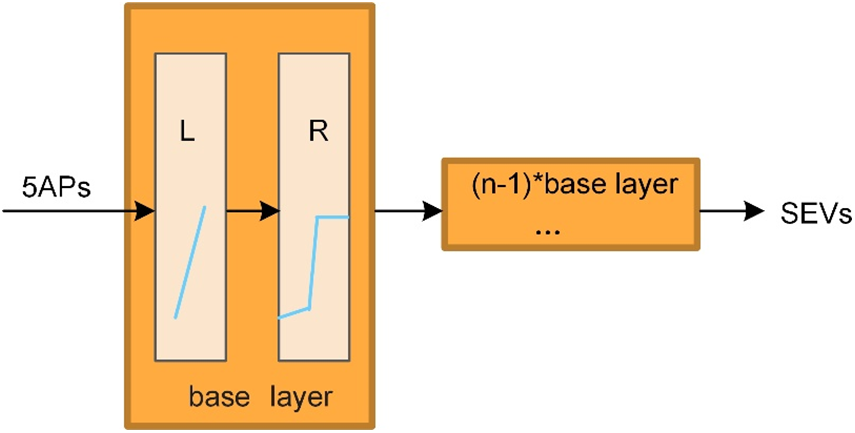
Figure 3: Deep feedforward neural network data flow transportation. L is the linear layer, R is the LeakyReLU activation function. The combination of linear layer and LeakyReLU fully connected layer is the base layer
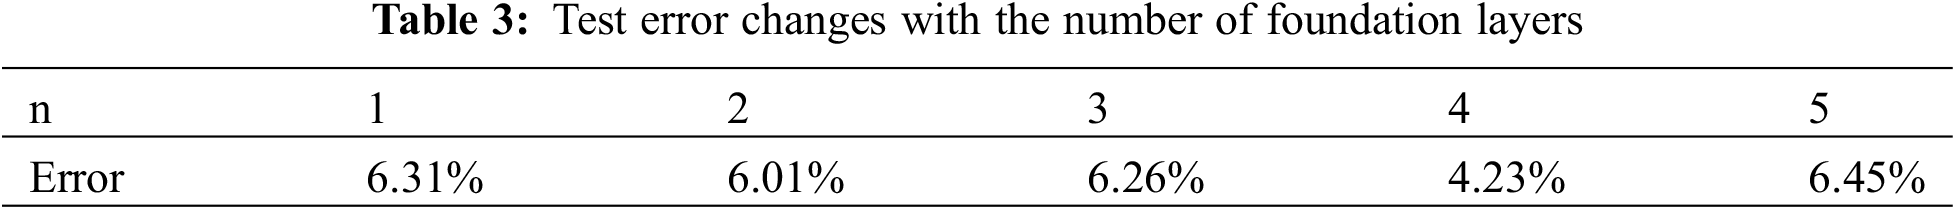
Here, ablation experiments are used to determine the number of base layers n. The noise sample was collected with 40 samples obtained. 80% of the noise of these 40 samples is used as the training set, and the remaining 20% is used as the test set and does not participate in the training process. The ablation experiment table design is shown in the following Table 3, n is the number of base layers, and error is the absolute percentage error of SEVs predicted by the model.
The change of the mean square error (MSE) with the number of training rounds during the training process is shown in the Fig. 4 below. The maximum number of rounds is 300 epochs, and the MSE is the smallest in the 104th epoch.
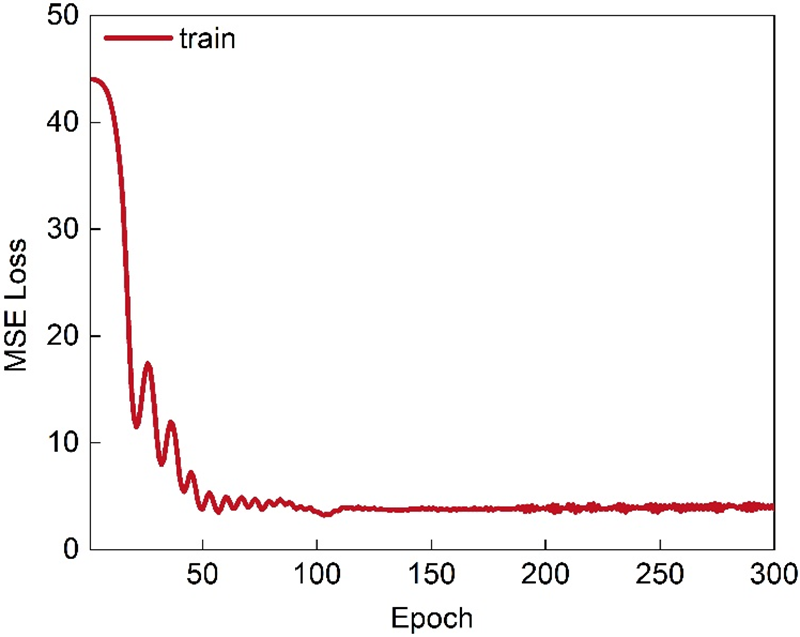
Figure 4: Training performance of the artificial neural network
4.1 Middle Ear Pressure Gain Transfer Characteristics
To validate the predictive capability of the developed loudness model for simulating the sound transmission attributes of the physiological and anatomical structure of the human ear, the sound transmission properties of the model’s middle ear segment are initially examined. The model computes the middle ear pressure gain, which indicates the sound transmission characteristics of the middle ear. Specifically, the ratio of the output pressure at the stapes to the input pressure at the tympanic membrane are compared with the experimental values measured by Aibara et al. [29,30]. The curve of middle ear pressure gain calculated by the model aligns with the experimental findings by Nakajima et al. [30], which is displayed in Fig. 5. In the trend, the value is also close to the above experimental results. Therefore, the middle ear component within the developed loudness model effectively predicts the sound transmission attributes of the real physiological middle ear structure.
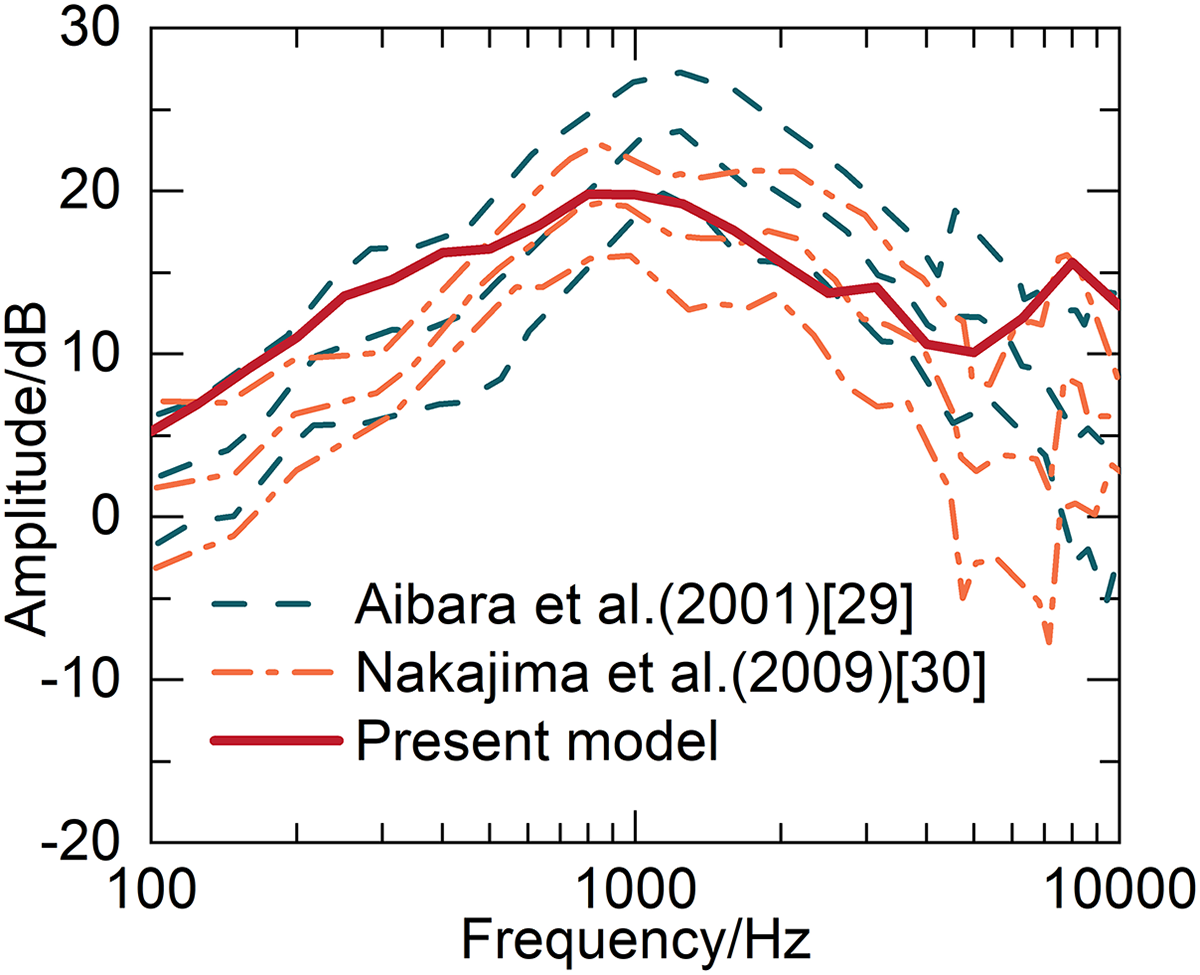
Figure 5: Contrast between middle ear pressure gain characteristics and previously reported experimental data
4.2 Prediction of Human Ear Loudness Perception
To verify the reliability of the constructed physiological loudness model, we compared it with the isotonic curve, and the results are shown in Fig. 6. Among them, the comparative experimental curve is taken from the ISO 226-2003 standard [22]. The graph illustrates the notable concurrence between the computed outcomes of the physiological loudness model and the ISO 226-2003 experimental findings within the low and medium frequency ranges. The average error between the model prediction results and the international standard is 0.9 dB.
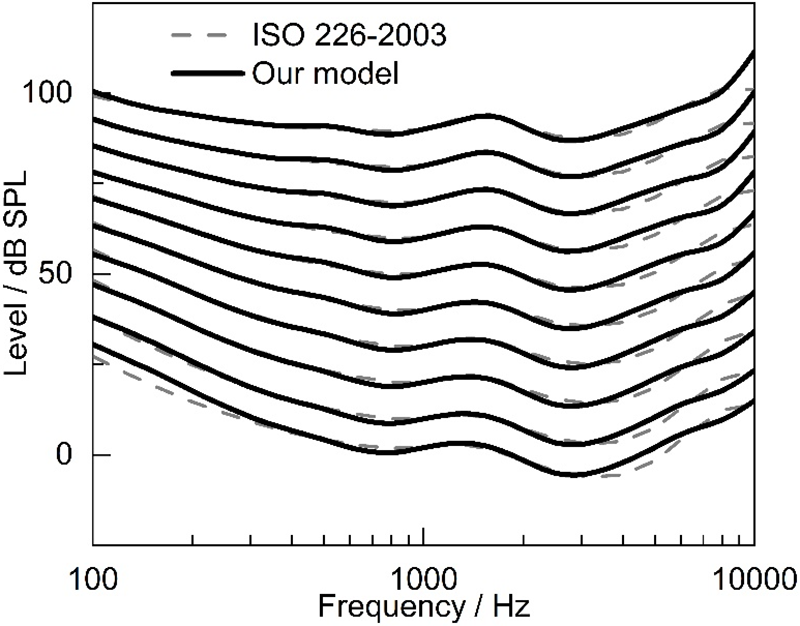
Figure 6: Comparison of equal loudness curves prediction with standard
4.3 Feasibility Analysis of Physiological Loudness Prediction of Sound Quality
To confirm that physiological loudness has possibility for sound quality assessment than traditional loudness, we performed correlation analysis between them and SEVs respectively. The traditional loudness selects the Zwicker loudness because it is widely used in the field of SQ analysis. As shown in Fig. 7, it shows that the correlation between physiological loudness and SEVs is significantly higher than that between Zwicker’s loudness and SEVs.
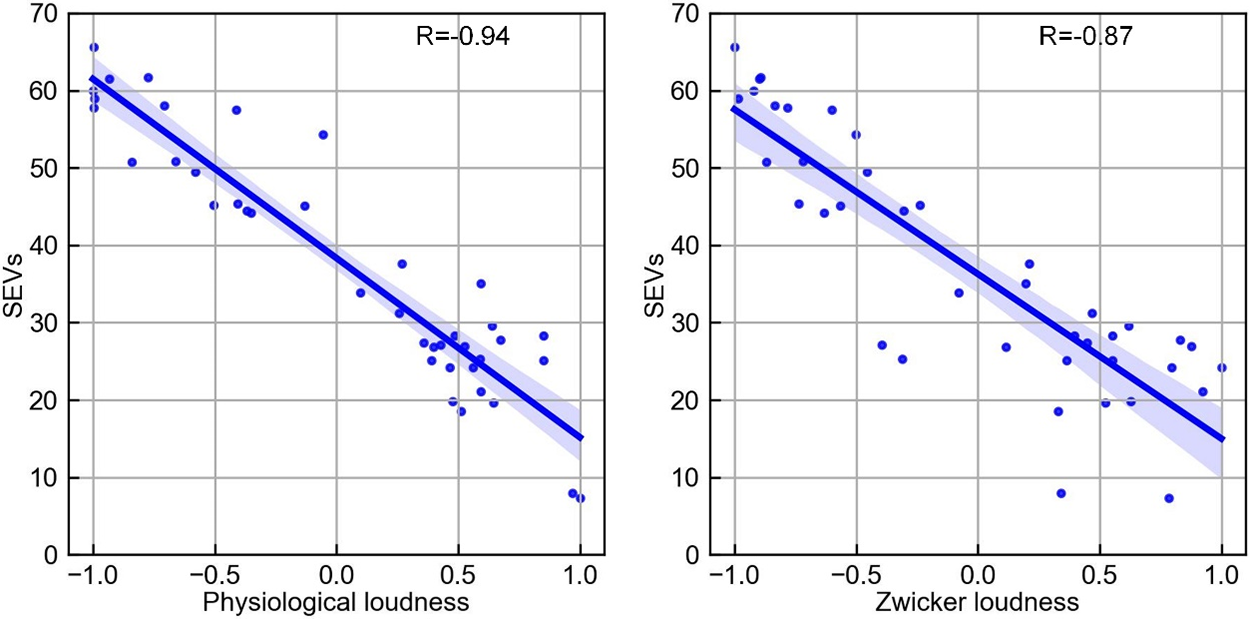
Figure 7: The correlation between physiological loudness and SQ vs. the correlation between Zwicker loudness and SQ
Fig. 8 shows the prediction results for a DNN model with four base layers and its comparison with the prediction results for a ANN model from Wang et al. [11]. The difference between the predicted results and the original experimental results was compared with the standard deviation of the subjective evaluation experimental values, as shown in Fig. 8a. Fig. 8b is a comparison of the model prediction results and the experimental values, and Fig. 8c is the absolute percentage error of the test noise sample prediction results. Obviously, the predicted results of our model will be slightly stronger than the ANN of Wang et al. and the predicted standard deviation is within the experimental standard deviation.
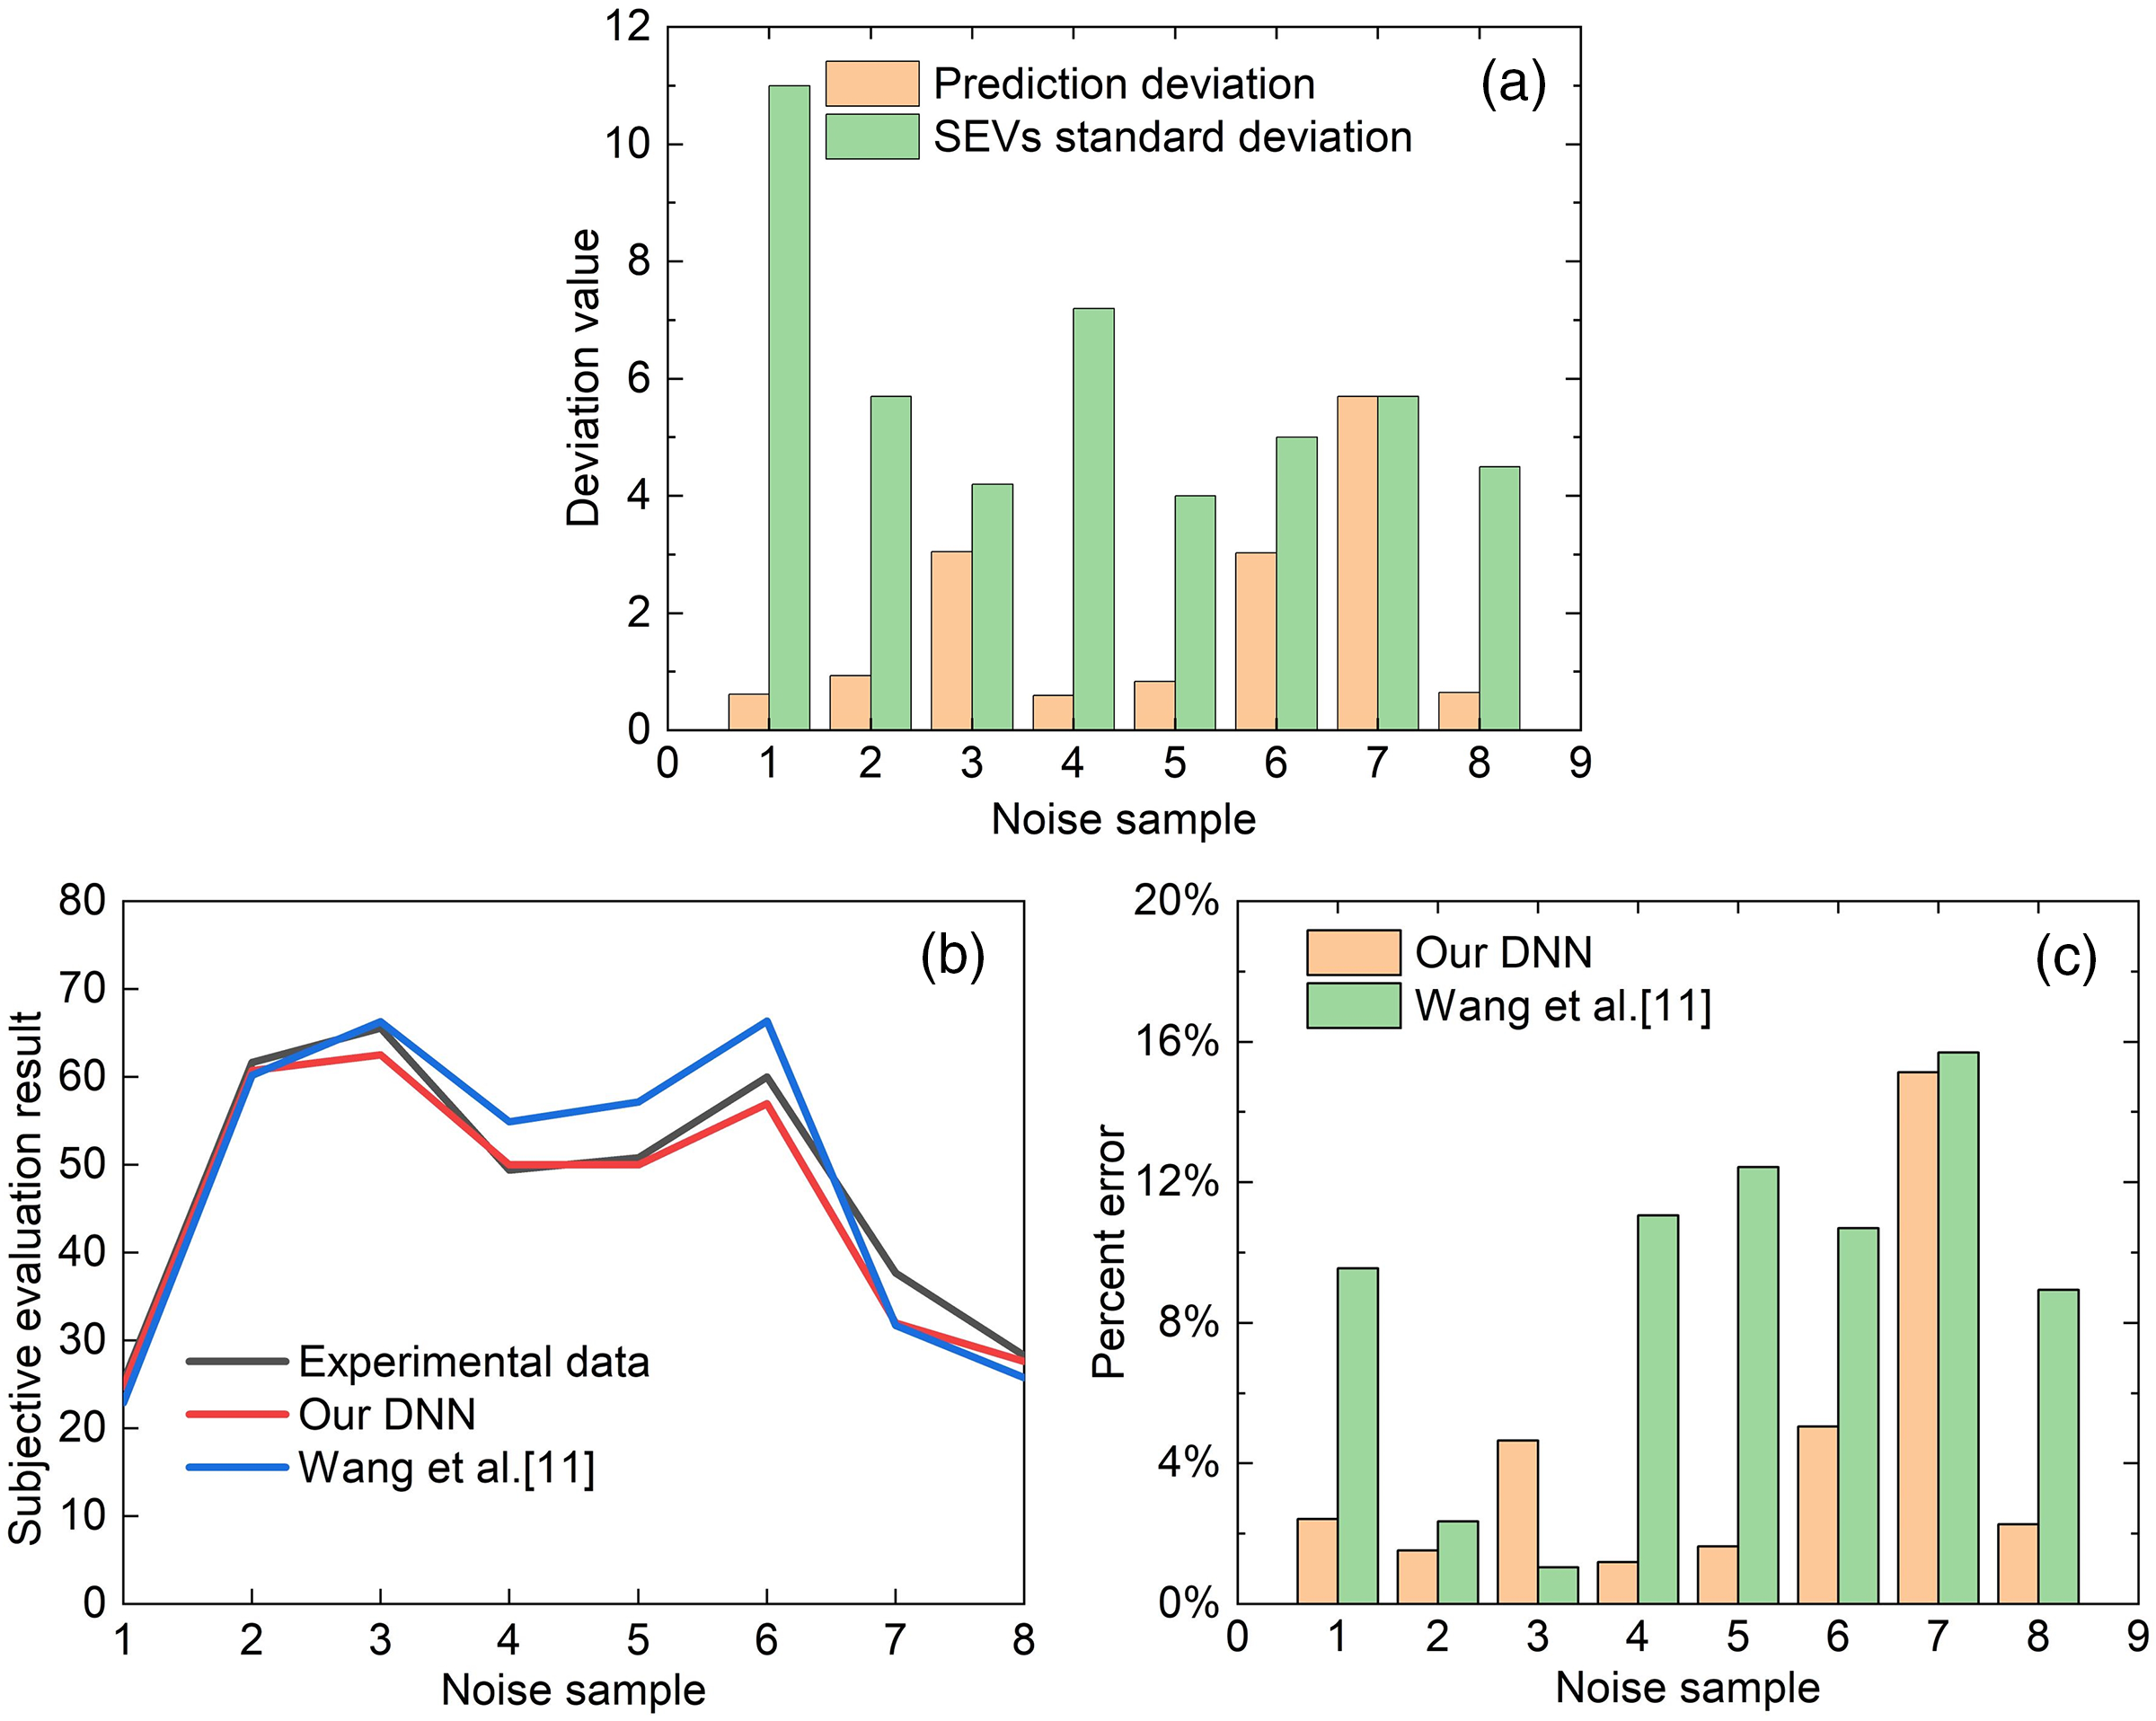
Figure 8: DNN test sample prediction results
Model prediction results are lower than experimental results. This may be due to the fact that the distribution range of the original sample data is too large and the model cannot predict such a large range. Nonetheless, based on the percentage error predicted by the model, it can still be considered that the model correctly predicts the SEVs of vehicle noise.
In addition, we predicted the results directly using constructed psychological loudness based on DNN, as shown in Fig. 9 below. When the input is only physiological loudness, the number of input layer nodes of the topology of DNN is 1, which is different from the input of 5AP.
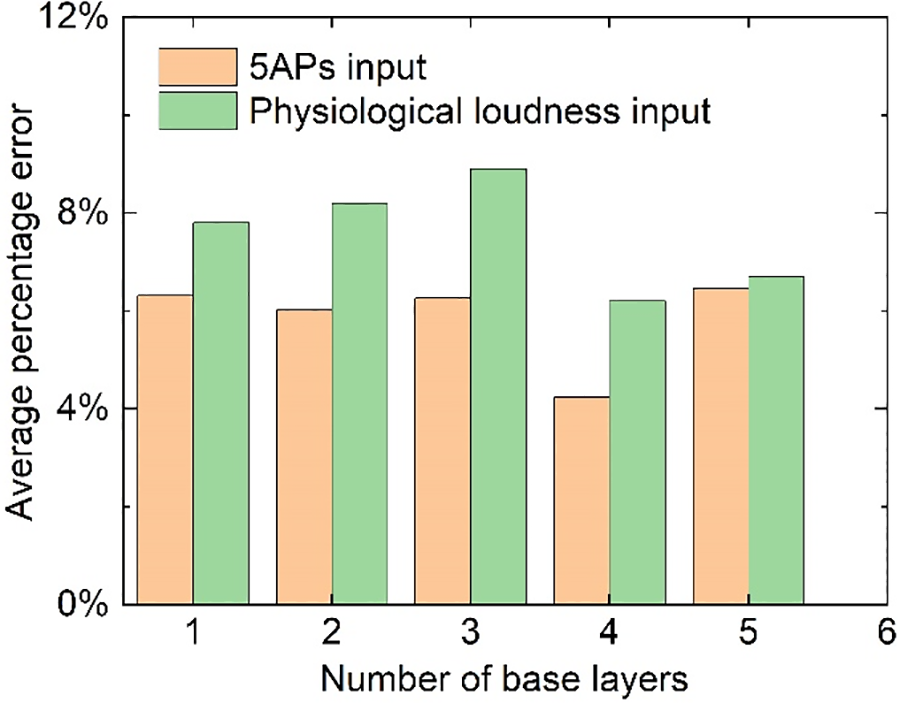
Figure 9: Comparison of DNN prediction results corresponding to different inputs. The abscissa is the number of base layers, and the ordinate is the average percentage error of the prediction results
In this paper, a vehicle sound quality prediction model with physiological loudness as the core is constructed. The model can predict loudness perception well. In addition, compared with the traditional loudness calculation method, the correlation between physiological loudness and raw quality is higher, so it is more conducive to sound quality analysis. Finally, leveraging the deep neural network, we integrated physiological loudness with four additional psychoacoustic parameters to establish a sound quality prediction model. This model exhibited a high degree of accuracy in forecasting subjective experimental data.
Acknowledgement: None.
Funding Statement: This work is supported by the National Natural Science Foundation of China (Nos. 52275296, 52172371, and 52274162), the Top-Notch Academic Programs Project of Jiangsu Higher Education Institutions, the Priority Academic Program Development of Jiangsu Higher Education Institutions, and Jiangsu Provincial Postgraduate Practice Innovation Plan (No. SJCX23_1283).
Author Contributions: The authors confirm contribution to the paper as follows: study conception and design: He Zhiheng, Liu Houguang; data collection: Zhao Yu; analysis and interpretation of results: He Zhiheng, Zhang Zipeng; draft manuscript preparation: Guo Hui,Yang Shanguo. All authors reviewed the results and approved the final version of the manuscript.
Availability of Data and Materials: The data underlying this article cannot be shared publicly due to the privacy ofindividuals that participated in the study. The data will be shared onreasonable request to the corresponding author.
Conflicts of Interest: The authors declare that they have no conflicts of interest to report regarding the recent study.
References
1. Singh, S., Mohanty, A. (2018). HVAC noise control using natural materials to improve vehicle interior sound quality. Applied Acoustics, 140, 100–109. [Google Scholar]
2. Ye, S. G., Zhang, J. H., Xu, B. (2018). Noise reduction of an axial piston pump by valve plate optimization. Chinese Journal of Mechanical Engineering, 31(1), 1–16. [Google Scholar]
3. Pamucar, D., Ecer, F., Deveci, M. (2021). Assessment of alternative fuel vehicles for sustainable road transportation of United States using integrated fuzzy FUCOM and neutrosophic fuzzy MARCOS methodology. Science of the Total Environment, 788, 147763. [Google Scholar] [PubMed]
4. Qiu, Y., Zhou, E., Xue, H., Tang, Q., Wang, G. et al. (2021). Analysis on vehicle sound quality via deep belief network and optimization of exhaust system based on structure-SQE model. Applied Acoustics, 171, 1–13. [Google Scholar]
5. Liang, K., Zhao, H. (2019). Automatic evaluation of internal combustion engine noise based on an auditory model. Shock and Vibration, 2019, 298219. [Google Scholar]
6. Moon, S., Park, S., Park, D., Yun, M., Chang, K. et al. (2020). Active sound design development based on the harmonics of main order from engine sound. Journal of the Audio Engineering Society, 68(7/8), 532–544. [Google Scholar]
7. Xie, X., Ma, Z., Ye, J., Zeng, F., Fan, W. et al. (2019). Research and development of sound quality in portable testing and evaluation system based on self-adaptive neural network. Applied Acoustics, 154, 138–147. [Google Scholar]
8. Feng, T., Sun, Y., Wang, Y., Zhou, P., Guo, H. et al. (2019). Sound feature space effects on the performance of annoyance evaluation model based on support vector machine. Applied Acoustics, 154, 99–113. [Google Scholar]
9. Zwicker, E., Fastl, H. (2013). Psychoacoustics: Facts and models. Germany: Springer Science & Business Media. [Google Scholar]
10. Di, G. Q., Chen, X. W., Song, K., Zhou, B., Pei, C. M. (2016). Improvement of Zwicker’s psychoacoustic annoyance model aiming at tonal noises. Applied Acoustics, 105, 164–170. [Google Scholar]
11. Wang, Y., Shen, G., Xing, Y. (2014). A sound quality model for objective synthesis evaluation of vehicle interior noise based on artificial neural network. Mechanical Systems and Signal Processing, 45(1), 255–266. [Google Scholar]
12. Wang, Z., Li, P., Liu, H., Yang, J., Liu, S. et al. (2021). Objective sound quality evaluation for the vehicle interior noise based on responses of the basilar membrane in the human ear. Applied Acoustics, 172, 107619. [Google Scholar]
13. Feng, B., Gan, R. Z. (2004). Lumped parametric model of the human ear for sound transmission. Biomechanics and Modeling in Mechanobiology, 3, 33–47. [Google Scholar] [PubMed]
14. Pieper, I., Mauermann, M., Oetting, D., Kollmeier, B., Ewert, S. D. (2018). Physiologically motivated individual loudness model for normal hearing and hearing impaired listeners. The Journal of the Acoustical Society of America, 144(2), 917–930. [Google Scholar] [PubMed]
15. Pieper, I., Mauermann, M., Kollmeier, B., Ewert, S. D. (2016). Physiological motivated transmission-lines as front end for loudness models. The Journal of the Acoustical Society of America, 139(5), 2896–2910. [Google Scholar] [PubMed]
16. ISO (1980). ISO 5128:1980. In: Acoustics-measurement of noise inside motor vehicles. Geneva: International Organization for Standardization. [Google Scholar]
17. Jiang, J., Li, Y. (2018). Review of active noise control techniques with emphasis on sound quality enhancement. Applied Acoustics, 136, 139–148. [Google Scholar]
18. ANSI (2007). ANSI S3.4-2007. In: Procedure for the computation of loudness of steady sounds. New York: American National Standard Insitute. [Google Scholar]
19. Xue, L., Liu, H., Wang, W., Yang, J., Zhao, Y. et al. (2020). The role of third windows on human sound transmission of forward and reverse stimulations: A lumped-parameter approach. The Journal of the Acoustical Society of America, 147(3), 1478–1490. [Google Scholar] [PubMed]
20. Verhulst, S., Altoe, A., Vasilkov, V. (2018). Computational modeling of the human auditory periphery: Auditory-nerve responses, evoked potentials and hearing loss. Hearing Research, 360, 55–75. [Google Scholar] [PubMed]
21. Hossen, M. S., Rabbi, F., Rahman, M. M. (2009). Adaptive particle swarm optimization (APSO) for multimodal function optimization. International Journal of Engineering and Technology, 1(3), 98–103. [Google Scholar]
22. ISO 226 (2003). Acoustics-normal equal-loudness contours. Geneva: International Organization for Standardization. [Google Scholar]
23. Pastor-Aparicio, A., Segura-Garcia, J., Lopez-Ballester, J., Felici-Castell, S., Garcia-Pineda, M. et al. (2019). Psychoacoustic annoyance implementation with wireless acoustic sensor networks for monitoring in smart cities. IEEE Internet of Things Journal, 7(1), 128–136. [Google Scholar]
24. DIN (2009). DIN 45692:2009-08. In: Measurement technique for the simulation of the auditory sensation of sharpness. German: German Institute for Standardisation (Deutsches Institut für Normung). [Google Scholar]
25. Daniel, P., Weber, R. (1997). Psychoacoustical roughness: Implementation of an optimized model. Acta Acustica United with Acustica, 83(1), 113–123. [Google Scholar]
26. Aures, W. (1985). Berechnungsverfahren für den sensorischen Wohlklang beliebiger Schallsignale. Acta Acustica United with Acustica, 59(2), 130–141. [Google Scholar]
27. Terhardt, E., Stoll, G., Seewann, M. (1982). Algorithm for extraction of pitch and pitch salience from complex tonal signals. The Journal of the Acoustical Society of America, 71(3), 679–688. [Google Scholar]
28. Osses Vecchi, A., García León, R., Kohlrausch, A. (2016). Modelling the sensation of fluctuation strength. Proceedings of Meetings on Acoustics, pp. 1–8. Buenos Aires, Argentina. [Google Scholar]
29. Aibara, R., Welsh, J. T., Puria, S., Goode, R. L. (2001). Human middle-ear sound transfer function and cochlear input impedance. Hearing Research, 152(1–2), 100–109. [Google Scholar] [PubMed]
30. Nakajima, H. H., Dong, W., Olson, E. S., Merchant, S. N., Ravicz, M. E. et al. (2009). Differential intracochlear sound pressure measurements in normal human temporal bones. Journal of the Association for Research in Otolaryngology, 10(1), 23–36. [Google Scholar] [PubMed]
Cite This Article
 Copyright © 2024 The Author(s). Published by Tech Science Press.
This work is licensed under a Creative Commons Attribution 4.0 International License , which permits unrestricted use, distribution, and reproduction in any medium, provided the original work is properly cited.
 Downloads
 Citation Tools