
 Submit a Paper
 Propose a Special lssue
 Open Access
ARTICLE
Nonlinear association between estimated glucose disposal rate and kidney stones: a cross-sectional study
1 Department of Clinical Laboratory, Nanchong Central Hospital, The Second Clinical Medical College of North Sichuan Medical College, Nanchong, 637007, China
2 Department of Laboratory Medicine, The Second Affiliated Hospital of Chengdu Medical College, China National Nuclear Corporation 416 Hospital, Chengdu, 610051, China
3 Department of Urology, Affiliated Hospital of North Sichuan Medical College, Nanchong, 637000, China
* Corresponding Author: Shan Yin. Email:
# These authors contributed equally to this work
Canadian Journal of Urology 2026, 33(2), 261-270. https://doi.org/10.32604/cju.2025.069717
Received 29 June 2025; Accepted 04 November 2025; Issue published 20 April 2026
 View Full Text
 Download PDF
Abstract
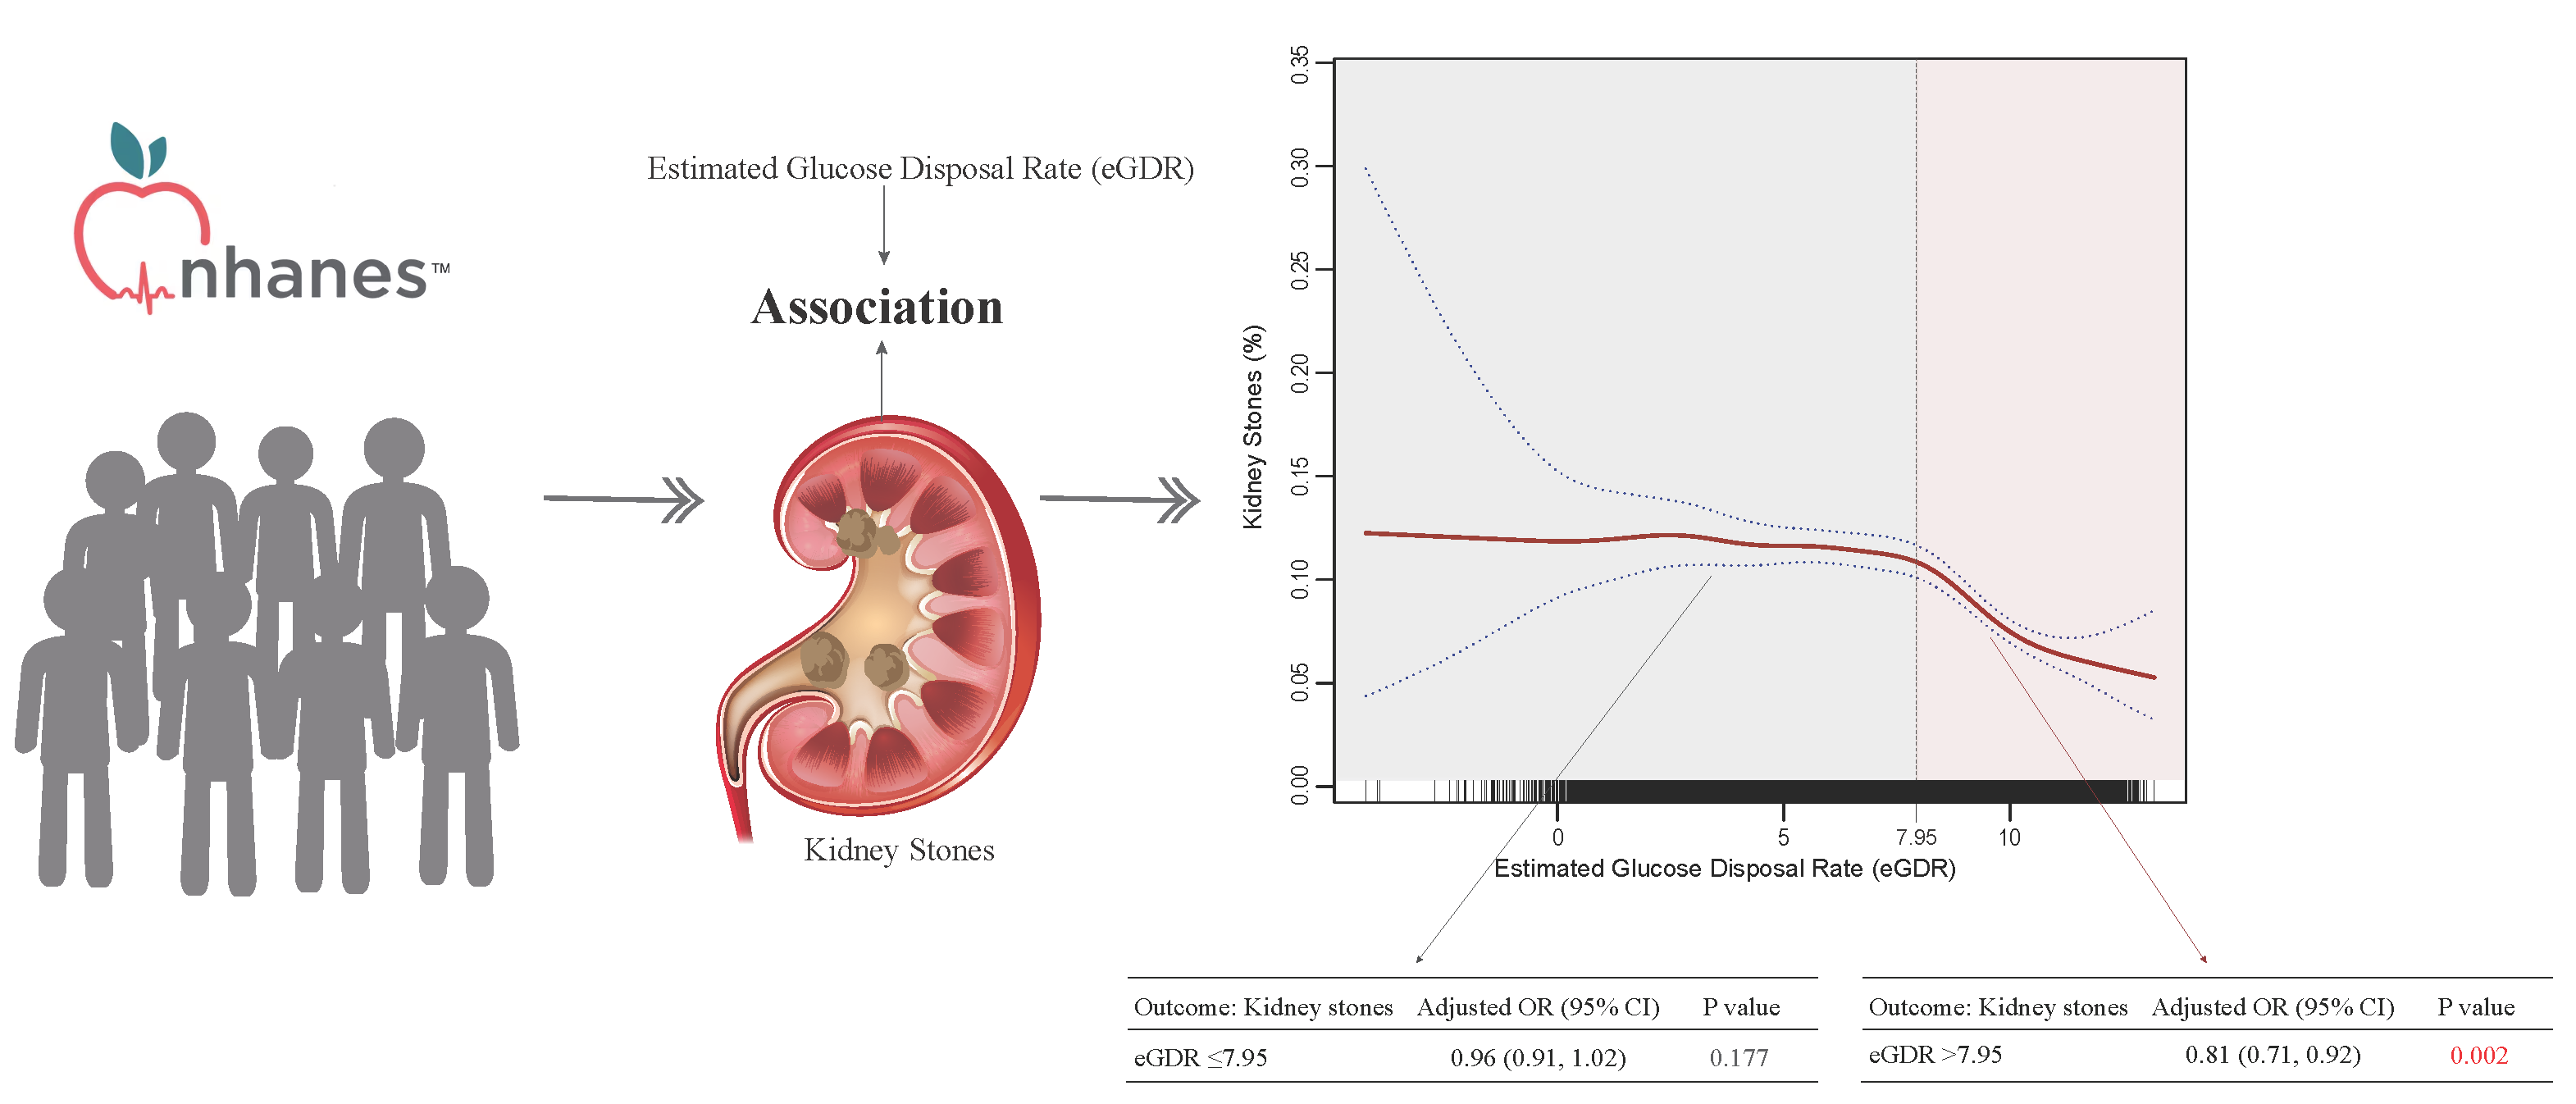
Objectives: Kidney stone disease is increasingly prevalent and may be linked to metabolic factors such as insulin resistance, but there is currently no direct evidence connecting estimated glucose disposal rate (eGDR) to kidney stones. This study aimed to investigate the relationship between eGDR and kidney stone prevalence. Methods: We conducted a cross-sectional analysis utilizing data from the National Health and Nutrition Examination Survey (NHANES) from 2007–2018, including 29,753 participants aged 20 years and older. Weighted multivariable logistic regression and nonlinear models were employed to assess the relationship between eGDR and self-reported kidney stone history. Results: Among participants, 9.90% reported having kidney stones. Multivariable analysis revealed that higher eGDR values were associated with decreased odds of kidney stones (odds ratio [OR] = 0.92, 95% CI: 0.89–0.94). Participants in the highest eGDR tertile demonstrated approximately half the odds of kidney stones compared to those in the lowest tertile (adjusted OR = 0.52, 95% CI: 0.43–0.64). Nonlinear analysis identified a threshold effect at eGDR = 7.95, with significant inverse associations only observed above this threshold (OR = 0.81, 95% CI: 0.71–0.92). Conclusions: This study identifies a nonlinear relationship between eGDR and kidney stones, with a threshold effect at eGDR = 7.95. The inverse association was significant only when eGDR exceeded this threshold, suggesting the potential utility of eGDR as a clinical indicator for kidney stone risk assessment. Prospective studies are needed to establish causal relationships.Graphic Abstract
Keywords
Kidney stone disease represents a significant global health burden, with a reported prevalence of 1.7%–14.8% worldwide and demonstrating an increasing trend over recent decades.1–5 This condition not only substantially impacts patients’ quality of life but also poses a considerable economic burden on healthcare systems, with annual costs exceeding $10 billion in the United States.6,7 Studies have highlighted the complex relationship between glucose metabolism disorders and kidney stone formation.8–12 Notably, insulin resistance (IR) has emerged as a significant pathophysiological factor potentially contributing to stone formation through various mechanisms.13–15
While the hyperinsulinemic-euglycemic clamp remains the benchmark for evaluating IR,16 its clinical applicability is constrained by its invasive procedure and significant expense. The estimated glucose disposal rate (eGDR), originally developed for insulin sensitivity assessment in type 1 diabetes, has become acknowledged as an effective and practical proxy for insulin sensitivity.17,18 This metric demonstrates strong correlation with clamp-based measurements and offers distinct advantages over traditional indices such as the homeostasis model assessment of insulin resistance (HOMA-IR). While HOMA-IR relies primarily on fasting insulin and glucose concentrations—posing challenges for individuals undergoing insulin therapy—eGDR is derived from glycosylated hemoglobin (HbA1c), waist circumference (WC), and hypertension status. This makes eGDR more clinically applicable and less affected by insulin treatment.
However, direct evidence linking eGDR to kidney stones is currently lacking. This cross-sectional study aims to address this knowledge gap by investigating the relationship between eGDR and kidney stone disease, hypothesizing that lower eGDR values (indicating greater insulin resistance) are associated with a higher probability of kidney stone prevalence. Our findings could potentially identify eGDR as a novel risk predictor for kidney stone disease and inform targeted preventive strategies. Despite these advantages, the potential relationship between eGDR and nephrolithiasis remains unexplored. Our investigation addresses this knowledge gap through a comprehensive cross-sectional analysis, hypothesizing that lower eGDR values (indicating greater insulin resistance) are associated with a higher probability of kidney stone prevalence. We propose that this research could establish eGDR as an innovative predictor of stone risk and guide the development of preventive interventions based on metabolic parameters.
We performed a cross-sectional analysis of six consecutive cycles (2007–2018) of the National Health and Nutrition Examination Survey (NHANES), a continuous, nationally representative health surveillance program that collects interview and examination data.
The study targeted participants aged ≥20 years and initially included 34,770 adults. After excluding pregnant participants (n = 372) and those with incomplete data on kidney stone history or eGDR (n = 4645), the analytic sample comprised 29,753 individuals, with detailed selection parameters illustrated in Figure 1. Reporting followed STROBE guidelines for observational studies,19 and all data were collected under the National Center for Health Statistics (NCHS) ethics board approvals with participants’ informed consent (Protocol #2005-06; Protocol #2011-17; Protocol #2018-01).

FIGURE 1. Flowchart of the study population
Outcome and exposure assessment
The dependent variable was self-reported kidney stone history, determined by affirmative responses to stone occurrence queries in NHANES questionnaires “Have you/Has sample person (SP) ever had kidney stones?”.
The primary exposure factor, eGDR, was calculated using: eGDR (mg/kg/min) = 21.158 − (0.09 × WC) − (3.407 × hypertension) − (0.551 × HbA1c),20 where WC stands for waist circumference (in cm), hypertension coded as yes = 1 or no = 0, and HbA1c represents the glycohemoglobin percentage. Hypertension classification required any of: systolic blood pressure ≥140 mmHg, diastolic blood pressure ≥90 mmHg, antihypertensive medication use, or physician diagnosis. We stratified participants into eGDR tertiles, with the lowest representing maximum IR serving as the reference group.
Our analysis incorporated numerous adjustment variables across several domains: Demographics characteristics included age (dichotomized at 60 years), sex, racial/ethnic background, marital status, education attainment, poverty income ratio (PIR; categorized as ≤1.3, >1.3 & ≤3.5, >3.5); Anthropometric measurements encompassed body mass index (BMI; stratified as <25, 25–30, and ≥30 kg/m2); Behavioral factors comprised smoking history (defined as “current” for participants reporting >100 lifetime cigarettes with ongoing use either daily or on some days; “former” for those with >100 lifetime cigarettes but current abstinence; and “never” for individuals with <100 lifetime cigarettes), alcohol intake (classified as drinker: ≥12 drinks annually; non-drinker: <12 drinks annually), physical activity (<500 or ≥500 metabolic equivalent of tasks [METs]) per week); Dietary patterns utilized the healthy eating index 2015 scores (HEI-2015, divided into tertiles using the methodology described previously21); Medical comorbidities (coded dichotomously) encompassed gout, stroke, diabetes mellitus (established via clinical diagnosis, glycohemoglobin ≥6.5%, fasting glucose ≥7.0 mmol/L, random glucose ≥11.1 mmol/L, abnormal oral glucose tolerance test (OGTT) results (≥11.1 mmol/L), or current use of glucose-lowering medications. Participants with self-reported prediabetes, impaired glucose tolerance, and impaired fasting glycaemia were classified under “pre-diabetes”), cardiovascular disease (CVD; established by presence of coronary heart disease, angina, or congestive heart failure), chronic kidney disease (CKD; characterized by estimated glomerular filtration rate <60 mL/min per 1.73 m2 and/or albuminuria ≥30 mg/g22) and cancer. Survey cycle served as an additional controlling factor. Missing data indicators were created when incomplete information exceeded 2% for any covariate.
Statistical analyses employed NHANES complex survey weighting methodology as specified by the Centers for Disease Control and Prevention (CDC). Survey weights were combined across six sequential cycles according to established NHANES analytical guidelines. Descriptive data are reported as weighted means with 95% confidence intervals (CIs) for continuous measures and weighted percentages with 95% CIs for categorical variables.
Three sequential regression frameworks were developed to examine associations between eGDR and kidney stones. Model 1 served as the unadjusted baseline analysis. Model 2 controlled for basic demographic parameters (age, sex, ethnicity). The comprehensive third model (model 3) accounted for multiple variables: demographic characteristics, socioeconomic indicators (PIR, education, marital status), lifestyle factors (smoking, alcohol consumption, physical activity, HEI-2015), and comorbid conditions (gout, CVD, CKD, diabetes, stroke, and cancer). eGDR was evaluated both continuously and categorized into tertiles for a complete assessment of kidney stone associations. Trend testing utilized ordinal treatment of tertile classifications. Non-linear relationship detection employed a generalized additive model (GAM) with spline smoothing techniques and segmented regression analysis. Additionally, we performed subgroup analyses using stratified logistic models based on all potential confounders included in the fully adjusted model (model 3), excluding the stratifying variable itself.
Statistical computations utilized R software version 4.2.0 and EmpowerStats (http://www.empowerstats.com; X&Y Solutions, Inc., Wilmington, DE, USA), with statistical significance defined as p < 0.05 (two-tailed).
Study population characteristics
Our analysis included 29,753 U.S. adults (Figure 1 describes the detailed inclusion and exclusion criteria), with a weighted mean age of 47.52 years (95% CI: 47.08–47.97) and female representation of 51.11% (95% CI: 50.51–51.72). Table 1 displays participant characteristics stratified by eGDR tertiles. The sample-weighted kidney stone prevalence was 9.90% (95% CI: 9.42–10.41), with a mean eGDR of 7.83 (95% CI: 7.75–7.90).

Association between eGDR and kidney stones
Multivariable analyses revealed an inverse relationship between eGDR and kidney stone prevalence after comprehensive covariate adjustment (odds ratio [OR] = 0.92, 95% CI: 0.89–0.94). When examining eGDR tertiles, participants in the highest tertile demonstrated substantially lower odds of kidney stone compared to those in the lowest tertile (adjusted OR = 0.52, 95% CI: 0.43–0.64). All regression models consistently showed significant negative trends (p < 0.001) across tertiles (Table 2).

Stratified analyses (Figure 2) identified several effect modifiers in the eGDR-nephrolithiasis relationship, including age, educational attainment, kidney function status, and diabetes diagnosis. Notably, while the magnitude of association varied across subgroups, the inverse relationship remained consistent (OR < 1.0) throughout all stratifications.

FIGURE 2. Subgroup analysis of the association between kidney stones and estimated glucose disposal rate (eGDR). Note: BMI, body mass index; HEI-2015, healthy eating index 2015 scores; CKD, chronic kidney disease; CVD, cardiovascular disease; CI, confidence interval
This forest plot demonstrates the heterogeneous associations between kidney stones and eGDR across various demographic and clinical subgroups. The OR and 95% CI indicate the strength and statistical significance of the relationship in different strata. Notably, significant interactions were observed in age, educational status, CKD, and diabetes (p for interaction <0.05), suggesting that the impact of kidney stones on eGDR varies across these characteristics. A value below 1.0 indicates a negative association between kidney stones and eGDR.
Smooth curve fitting analysis uncovered a nonlinear pattern between eGDR and stone occurrence (Figure 3). The analysis indicated a fully adjusted smooth curve. A likelihood-ratio test was employed to compare the piecewise linear regression model with the binary logistic regression model. The results indicated a significant difference between the two models, with a p-value of less than 0.001, as shown in Table 3.

FIGURE 3. Nonlinear relationship between kidney stones and estimated glucose disposal rate (eGDR)

Smooth curve fitting analysis revealing the potential nonlinear correlation between kidney stones and eGDR. The curve illustrates the complex, potentially dose-dependent relationship, showing how the glucose disposal rate may change with variations in kidney stone prevalence.
Our findings demonstrated a threshold effect, with the inflection point identified at eGDR = 7.95. Specifically, when eGDR ≤ 7.95, no significant correlation was observed between eGDR and the prevalence of kidney stones. In contrast, an eGDR greater than 7.95 was significantly negatively associated with the prevalence of kidney stones.
We further divided the dataset into two segments based on the inflection point derived from the piecewise linear regression model and conducted weighted multivariable logistic regression analyses for each subset. The results (Table 4) showed that, for eGDR ≤ 7.95, there was still no significant correlation between eGDR and the prevalence of kidney stones (OR = 0.96, 95% CI: 0.91–1.02), whereas for eGDR > 7.95, a significant negative association was found (OR = 0.81, 95% CI: 0.71–0.92).

In this large-scale cross-sectional study of 29,753 American adults, we found that the overall prevalence of kidney stones was 9.90%, and we identified a significant inverse relationship between eGDR and kidney stone prevalence, with a threshold effect observed at an eGDR value of 7.95. Specifically, we observed that the negative association between eGDR and kidney stones was only significant when eGDR exceeded 7.95 (OR = 0.81, 95% CI: 0.71–0.92), while no significant association was found below this threshold. Our findings suggest that individuals with higher insulin sensitivity, as indicated by higher eGDR values, were associated with a lower kidney stones prevalence.
Previous studies have investigated the association between insulin resistance and kidney stones.9,23–26 Cross-sectional analyses of NHANES data have provided compelling evidence for this relationship. Specifically, an analysis of NHANES 2007–2010 demonstrated that after adjusting for relevant factors, individuals in the highest tertile of HOMA-IR had significantly higher odds of kidney stones compared to those in the lowest tertile (OR = 1.50, 95% CI: 1.09–2.07).23 Similarly, a subsequent study using NHANES 2015–2018 data revealed even stronger associations, with participants in the highest quartile of HOMA-IR showing more than twice the odds of kidney stones compared to those in the lowest quartile (OR = 2.36, 95% CI: 1.55–3.61).9 Our findings, which demonstrate an inverse relationship between insulin sensitivity and kidney stone formation, align with these previous observations. However, it is noteworthy that not all studies have reached consistent conclusions. For instance, a cross-sectional study involving 2171 Japanese participants found no significant association between fasting serum insulin or HOMA-IR and kidney stone risk.24 These inconsistent results highlight that the link between insulin resistance and kidney stones is complex, and different markers of insulin resistance may vary in their predictive value.
The mechanistic relationship between insulin resistance and kidney stone formation has been well-documented in the literature. Insulin resistance has been shown to induce several pathophysiological changes that promote stone formation, including decreased urinary pH, impaired ammoniagenesis, altered sodium reabsorption, and hypocitraturia.8,15,27,28 Some studies elaborated on these mechanisms, demonstrating that insulin resistance leads to alterations in 24-h urinary electrolyte excretion patterns, resulting in more acidic urine, impaired renal acid excretion, and hypocitraturia.8,15,28 The impact of insulin resistance on renal ammonium production occurs through both direct and indirect pathways.28 Insulin resistance directly compromises renal tubular ammonia production and increases sodium reabsorption, which leads to more acidic urine.27,28 This acidic environment promotes kidney stone formation.29
These findings provide important insights into the metabolic aspects of kidney stone disease, though the direct clinical applicability of eGDR requires careful consideration. While the identification of an eGDR threshold at 7.95 represents a novel epidemiological finding, it is important to recognize that eGDR is derived from waist circumference, blood pressure status, and HbA1c—parameters that are already well-established independent predictors of both metabolic health and stone risk. For practicing clinicians, these individual components already provide actionable information for patient assessment and management without requiring additional calculations. Currently, eGDR should be viewed primarily as a research tool and epidemiological construct that integrates multiple metabolic parameters into a single continuous variable, allowing for more standardized risk stratification across populations in research settings. The main value of eGDR lies in its ability to provide a unified measure of insulin sensitivity that facilitates comparative studies and population-level analyses. However, its superiority over individual component variables in predicting stone risk in clinical practice remains to be established. Future studies would need to demonstrate that eGDR provides incremental predictive value beyond its individual components before recommending its routine use in frontline clinical practice. Moreover, it’s important to consider that this relationship may be bidirectional. While eGDR might affect kidney stone risk, treating stone disease may also change eGDR components. For example, interventions like exercise and diabetes management—both important for stone prevention—can reduce waist circumference and HbA1c levels, thereby increasing eGDR values. For eGDR values below 7.95, no correlation was observed, which may indicate the presence of a threshold effect. There could be a critical point of insulin sensitivity above which protective effects against kidney stones become evident. Alternatively, reverse causation may play a role: individuals with lower eGDR may already have multiple metabolic abnormalities, with kidney stones being a consequence rather than a cause. Additionally, residual confounding may be a factor, as individuals with lower eGDR may have more unmeasured confounders. These underscore the need for a comprehensive approach that accounts for the potential interplay between eGDR, metabolic factors, and kidney stone formation.
Future research should focus on prospective studies to establish causality between eGDR and kidney stone formation. Investigations incorporating stone composition analysis and detailed metabolic profiling could help elucidate the underlying mechanisms. Additionally, intervention studies targeting insulin sensitivity improvement could evaluate whether this approach effectively reduces stone risk. Validation studies in diverse populations are needed to confirm the generalizability of the eGDR threshold effect.
Our study has several strengths, including its large sample size, nationally representative population, and comprehensive adjustment for potential confounders. The use of NHANES data ensures high-quality standardized measurements and general applicability to the U.S. adult population. However, several limitations should be acknowledged. First, the cross-sectional design precludes causal inference regarding the relationship between eGDR and kidney stones. Second, the reliance on self-reported kidney stone history may introduce recall and misclassification bias. Third, we lacked information on stone composition and stone recurrence status, and could not assess whether the observed associations differ by stone type and recurrence status. And, the absence of urinary biochemical data to support the mechanisms. Additionally, although this study adjusted for a number of relevant covariates, there may still be other confounding factors, such as detailed diet, genetics, etc. Finally, the single time-point measurement of eGDR may not fully capture the dynamic nature of insulin sensitivity. Furthermore, the threshold effect observed at eGDR = 7.95 should be interpreted as an exploratory finding that requires validation in independent cohorts before clinical application.
In conclusion, this large cross-sectional study demonstrates a novel nonlinear relationship between eGDR and kidney stones, with a significant threshold effect at eGDR = 7.95. The inverse association between eGDR and kidney stone prevalence was only observed above this threshold, suggesting a complex relationship between insulin sensitivity and stone formation. These findings provide new insights into the metabolic aspects of kidney stone disease and suggest potential strategies for risk assessment and prevention. While causality needs to be established through prospective studies, our results support the importance of metabolic health in kidney stone disease and suggest that eGDR could be a valuable clinical tool for stone risk assessment.
Acknowledgement
We thank the staff of the National Center for Health Statistics (NCHS) of the Centers for Disease Control (CDC) and Prevention and the participants who contributed to NHANES.
Funding Statement
This work was supported by the Doctoral Fund Project of North Sichuan Medical College (grant number: CBY22-QDA26) and the Opening Project of the Medical Imaging Key Laboratory of Sichuan Province (grant number: MIKL202408).
Author Contributions
Conceptualization and methodology: Shan Yin; data acquisition: Shan Yin, Zhenzhen Yang, Linxin Jiang; software and formal analysis: Zhenzhen Yang, Linxin Jiang, Shan Yin; writing—original draft: Zhenzhen Yang, Linxin Jiang; writing—review & editing: all authors; data curation and supervision: Shan Yin. All authors reviewed the results and approved the final version of the manuscript.
Availability of Data and Materials
The data presented in this study are available on the NHANES website (https://wwwn.cdc.gov/nchs/nhanes/default.aspx, accessed on 01 January 2025).
Ethics Approval
Data for this study were collected under the National Center for Health Statistics (NCHS) ethics board approval with participants’ informed consent (Protocols #2005-06, #2011-17, and #2018-01).
Conflicts of Interest
The authors declare no conflicts of interest to report regarding the present study.
References
1. Scales CDJr., Smith AC, Hanley JM, Saigal CS. Prevalence of kidney stones in the United States. Eur Urol. 2012;62(1):160–165. doi:10.1016/j.eururo.2012.03.052. [Google Scholar] [PubMed] [CrossRef]
2. Khan SR, Pearle MS, Robertson WG et al. Kidney stones. Nat Rev Dis Primers. 2016;2(1):16008. doi:10.1038/nrdp.2016.8. [Google Scholar] [PubMed] [CrossRef]
3. Romero V, Akpinar H, Assimos DG. Kidney stones: a global picture of prevalence, incidence, and associated risk factors. Rev Urol. 2010;12(2–3):e86–e96. [Google Scholar] [PubMed]
4. Lang J, Narendrula A, El-Zawahry A, Sindhwani P, Ekwenna O. Global trends in incidence and burden of urolithiasis from 1990 to 2019: an analysis of global burden of disease study data. Eur Urol Open Sci. 2022;35(Suppl 3):37–46. doi:10.1016/j.euros.2021.10.008. [Google Scholar] [PubMed] [CrossRef]
5. Thongprayoon C, Krambeck AE, Rule AD. Determining the true burden of kidney stone disease. Nat Rev Nephrol. 2020;16(12):736–746. doi:10.1038/s41581-020-0320-7. [Google Scholar] [PubMed] [CrossRef]
6. Pearle MS, Calhoun EA, Curhan GC. Urologic diseases in America project: urolithiasis. J Urol. 2005;173(3):848–857. doi:10.1097/01.ju.0000152082.14384.d7. [Google Scholar] [PubMed] [CrossRef]
7. Antonelli JA, Maalouf NM, Pearle MS, Lotan Y. Use of the national health and nutrition examination survey to calculate the impact of obesity and diabetes on cost and prevalence of urolithiasis in 2030. Eur Urol. 2014;66(4):724–729. doi:10.1016/j.eururo.2014.06.036. [Google Scholar] [PubMed] [CrossRef]
8. Taylor EN, Stampfer MJ, Curhan GC. Diabetes mellitus and the risk of nephrolithiasis. Kidney Int. 2005;68(3):1230–1235. doi:10.1111/j.1523-1755.2005.00516.x. [Google Scholar] [PubMed] [CrossRef]
9. Shen Y, Zhu Z, Bi X et al. Association between insulin resistance indices and kidney stones: results from the 2015–2018 national health and nutrition examination survey. Front Nutr. 2024;11:1444049. doi:10.3389/fnut.2024.1444049. [Google Scholar] [PubMed] [CrossRef]
10. Liu M, Yang P, Gou Y. Association between triglyceride glucose index-related indices and kidney stones in adults based on NHANES 2007–2020. Front Endocrinol. 2025;15:1516982. doi:10.3389/fendo.2024.1516982. [Google Scholar] [PubMed] [CrossRef]
11. Paik JM, Tesfaye H, Curhan GC et al. Sodium-glucose cotransporter 2 inhibitors and nephrolithiasis risk in patients with type 2 diabetes. JAMA Intern Med. 2024;184(3):265–274. doi:10.1001/jamainternmed.2023.7660. [Google Scholar] [PubMed] [CrossRef]
12. Chung MC, Lin CY, Chang CH et al. Use of sodium-glucose transport protein 2 inhibitors and the incidence of urolithiasis: a multi-database and cross-country study in patients with type 2 diabetes mellitus. Clin Pharmacol Ther. 2025;117(6):1775–1783. doi:10.1002/cpt.3626. [Google Scholar] [PubMed] [CrossRef]
13. Spatola L, Ferraro PM, Gambaro G, Badalamenti S, Dauriz M. Metabolic syndrome and uric acid nephrolithiasis: insulin resistance in focus. Metabolism. 2018;83:225–233. doi:10.1016/j.metabol.2018.02.008. [Google Scholar] [PubMed] [CrossRef]
14. Kim S, Chang Y, Jung HS et al. Glycemic status, insulin resistance, and the risk of nephrolithiasis: a cohort study. Am J Kidney Dis. 2020;76(5):658–668.e1. doi:10.1053/j.ajkd.2020.03.013. [Google Scholar] [PubMed] [CrossRef]
15. Cupisti A, Meola M, D’Alessandro C et al. Insulin resistance and low urinary citrate excretion in calcium stone formers. Biomed Pharmacother. 2007;61(1):86–90. doi:10.1016/j.biopha.2006.09.012. [Google Scholar] [PubMed] [CrossRef]
16. DeFronzo RA, Tobin JD, Andres R et al. Glucose clamp technique: a method for quantifying insulin secretion and resistance. Am J Physiol. 1979;237(3):E214–E223. doi:10.1152/ajpendo.1979.237.3.E214. [Google Scholar] [PubMed] [CrossRef]
17. Williams KV, Erbey JR, Becker D et al. Can clinical factors estimate insulin resistance in type 1 diabetes? Diabetes. 2000;49(4):626–632. doi:10.2337/diabetes.49.4.626. [Google Scholar] [PubMed] [CrossRef]
18. Epstein EJ, Osman JL, Cohen HW et al. Use of the estimated glucose disposal rate as a measure of insulin resistance in an urban multiethnic population with type 1 diabetes. Diabetes Care. 2013;36(8):2280–2285. doi:10.2337/dc12-1693. [Google Scholar] [PubMed] [CrossRef]
19. von Elm E, Altman DG, Egger M et al. The strengthening the reporting of observational studies in epidemiology (STROBE) statement: guidelines for reporting observational studies. Ann Intern Med. 2007;147(8):573–577. doi:10.7326/0003-4819-147-8-200710160-00010. [Google Scholar] [PubMed] [CrossRef]
20. He HM, Xie YY, Chen Q et al. The additive effect of the triglyceride-glucose index and estimated glucose disposal rate on long-term mortality among individuals with and without diabetes: a population-based study. Cardiovasc Diabetol. 2024;23(1):307. doi:10.1186/s12933-024-02396-8. [Google Scholar] [PubMed] [CrossRef]
21. Yin S, Wang J, Bai Y et al. Association between healthy eating index-2015 and kidney stones in American adults: a cross-sectional analysis of NHANES 2007–2018. Front Nutr. 2022;9:820190. doi:10.3389/fnut.2022.820190. [Google Scholar] [PubMed] [CrossRef]
22. Rovin BH, Adler SG, Barratt J et al. KDIGO 2021 clinical practice guideline for the management of glomerular diseases. Kidney Int. 2021;100(4):S1–S276. doi:10.1016/j.kint.2021.05.021. [Google Scholar] [PubMed] [CrossRef]
23. Weinberg AE, Patel CJ, Chertow GM, Leppert JT. Diabetic severity and risk of kidney stone disease. Eur Urol. 2014;65(1):242–247. doi:10.1016/j.eururo.2013.03.026. [Google Scholar] [PubMed] [CrossRef]
24. Kabeya Y, Kato K, Tomita M et al. Associations of insulin resistance and glycemic control with the risk of kidney stones. Intern Med. 2012;51(7):699–705. doi:10.2169/internalmedicine.51.6426. [Google Scholar] [PubMed] [CrossRef]
25. Yang Y-X, Xiang J-C, Ye G-C, Luo K-D, Wang S-G, Xia Q-D. Association of insulin resistance indices with kidney stones and their recurrence in a non-diabetic population: an analysis based on NHANES data from 2007–2018. Ren Fail. 2025;47(1):2490203. doi:10.1080/0886022X.2025.2490203. [Google Scholar] [PubMed] [CrossRef]
26. Wang D, Zhang D, Zhang L, Shi F, Zhu Y. Association between triglyceride-glucose index and risk of kidney stone: a Chinese population-based case-control study. BMJ Open. 2024;14(11):e086641. doi:10.1136/bmjopen-2024-086641. [Google Scholar] [PubMed] [CrossRef]
27. Chobanian MC, Hammerman MR. Insulin stimulates ammoniagenesis in canine renal proximal tubular segments. Am J Physiol. 1987;253(6 Pt 2):F1171–F1177. doi:10.1152/ajprenal.1987.253.6.F1171. [Google Scholar] [PubMed] [CrossRef]
28. Spatola L, Angelini C, Badalamenti S, Maringhini S, Gambaro G. Kidney stones diseases and glycaemic statuses: focus on the latest clinical evidences. Urolithiasis. 2017;45(5):457–460. doi:10.1007/s00240-016-0956-8. [Google Scholar] [PubMed] [CrossRef]
29. Wagner CA, Mohebbi N. Urinary pH and stone formation. J Nephrol. 2010;23(Suppl 16):S165–S169. [Google Scholar] [PubMed]
Cite This Article
 Copyright © 2026 The Author(s). Published by Tech Science Press.
This work is licensed under a Creative Commons Attribution 4.0 International License , which permits unrestricted use, distribution, and reproduction in any medium, provided the original work is properly cited.
 Downloads
 Citation Tools