
 Submit a Paper
 Propose a Special lssue
 Open Access
ARTICLE

Refined Aerodynamic Test of Wide-Bodied Aircraft and Its Application
Institute of High Speed Aerodynamics, China Aerodynamics Research and Development Center, Mianyang, 621000, China
* Corresponding Author: Xin Peng. Email:
(This article belongs to the Special Issue: Vibration Control and Utilization)
Computer Modeling in Engineering & Sciences 2023, 136(3), 2691-2713. https://doi.org/10.32604/cmes.2023.026048
Received 12 August 2022; Accepted 28 November 2022; Issue published 09 March 2023
 View Full Text
 Download PDF
Abstract
The large dual-channel wide-bodied aircraft has a long range and a high cruise Mach number. Therefore, its aerodynamic design requires a high level of wind tunnel test refinement. Based on the requirements of aerodynamic design for the future wide-bodied aircraft and the characteristics of high-speed wind tunnel tests, the error theory is introduced to analyze the factors affecting the accuracy of the test data. This study carries out a series of research on the improvement of refined aerodynamic test technology in an FL-26 wind tunnel, including design and optimization of the support system of wide-bodied aircraft, model attitude angle measurement, Mach number control accuracy, measurement and control system stability, test data correction and perfection, high-precision force balance and standard model development. In addition, the effect of the standard specification of the refined aerodynamic test is investigated to improve the data quality. The research findings have been applied in the standard model test and subsequent models of wide-bodied aircraft. The results show that when Mach numbers are less than 0.9, the control accuracy of Mach numbers in the FL-26 wind tunnel is smaller than 0.001 and the measurement error of attack angle is smaller than 0.01°. Therefore, it has the ability to correct the data influenced by factors, such as support/wall interference, model deformation, floating resistance and airflow deflection angle. The repeatability accuracy of the standard model’s comparison test shows that the lift coefficient is less than or equal to 0.0012, the drag coefficient is less than or equal to 0.00004, pitching moment coefficient is less than or equal to 0.0004. The bending resolution of the model’s deformation measurement is less than 0.2 mm, and the tensional deformation is smaller than 0.04°. The revised aerodynamic data and model deformation measurement results have good agreement with that of the ETW wind tunnel. The results demonstrate that the improved technology presented in this paper can significantly enhance the refined aerodynamic test of wide-bodied aircraft.Keywords
The world’s large passenger aircraft market, especially the wide-bodied aircraft market, has long been dominated by Boeing and Airbus [1]. In order to break the monopoly, China and Russia plan to develop wide-bodied aircraft jointly to compete with the A350 airplane and Boeing 787 airplane, with a designed range of 12000 km, a typical cruising Mach number of 0.85, a maximum cruising Mach number of 0.89. Due to the high technical demand for wide-bodied aircraft design, such as cruising efficiency (Lift-Drag ratio) should exceed 20.5, aerodynamic design is the critical factor to determine the wide-bodied aircraft development, and the test data accuracy plays an important role for wide-bodied aircraft design correspondingly.
In recent years, the rapid progress of computer technology and the continuous innovation of computational fluid dynamics (CFD) and numerical solution methods [2,3] have significantly promoted the development and application of CFD technology. Mature aerodynamic optimization design of aircraft has been developed based on CFD technology, which plays a key role in aircraft development and design at the conceptual selection stage. However, CFD still has some drawbacks in solving specific engineering application issues. It remains to be improved for such issues as turbulence/transition simulation, high-precision scheme, dynamic grid technology and computational resource requirements. Aerodynamic design based on CFD needs to be verified through a reliable and sufficient aerodynamic data which can be obtained in wind tunnel test.
By far, wind tunnel test is one of the most important means to understand the aerodynamic performance of an aircraft and carry out the aerodynamic design since civil passenger planes have high requirements for economy, safety, comfort and environmental protection, designers face great challenges in improving the refined high-speed wind tunnel test of wide-bodied aircraft [4,5] and obtaining the test data with higher accuracy. The accuracy of the wind tunnel test data can be ensured by improving the quality of wind tunnel flow field, the stability of the measurement and control system, the processing quality of test model and the level of refined operation. The accuracy of wind tunnel test mainly depends on the ability to correct the original wind tunnel data and the aerodynamic characteristics of real flight conditions. Previous studies [6–10] showed that support/wall interference, model deformation and flow field distortion (air deflection angle and floating resistance) are the main factors affecting the accuracy of the test data, which can be revised by corresponding data correction technology.
Based on the aerodynamic design requirements of the future wide-bodied aircraft and the characteristics of high-speed wind tunnel test, the factors affecting the accuracy of wind tunnel test data are analyzed. In recent years, China Aerodynamics Research and Development Center has conducted a series of investigations on the improvement of refined aerodynamic test technology based on the FL-26 wind tunnel, including the design and optimization of a wide-bodied aircraft support system, model attitude angle measurement, Mach number control accuracy, stability of measurement and control system, improvement of data correction, and high-precision balance.
2 Characteristics of High-Speed Wind Tunnel Test of Wide-Bodied Aircraft
Compared to narrow-body aircraft, wide-bodied passenger aircraft adopt supercritical and swept-back (around 35°) wings and their wind tunnel test is conducted in the near-sonic regions, which leads to several problems and challenges.
Requirement for a high-precision aerodynamic test. For a wide-bodied aircraft, the designed cruising range is 12000 km and the cruise lift-drag ratio is required to be no less than 20.5. To meet the requirement, high-speed wind tunnel test must have high drag coefficient resolution and the short-term repeatability accuracy index must be less than 0.0001. Therefore, the equipment and technology of wind tunnel test must be advanced.
Flow field sensitivity. When an aircraft with supercritical wings flies at near-sonic speed, shock-induced separation will occur on the wing surface, which is particularly sensitive to flow. The slight difference between flow fields may cause the change of shock position and strength as well as a flow pattern, which will lead to a significant change in pitching moment and resistance characteristics of the test model. Wind tunnel test and numerical simulation research show that when the change of cruise Mach number (around 0.85) is 0.003, the variation of drag coefficient is within 0.0001 to 0.0008 (as shown in Fig. 1).
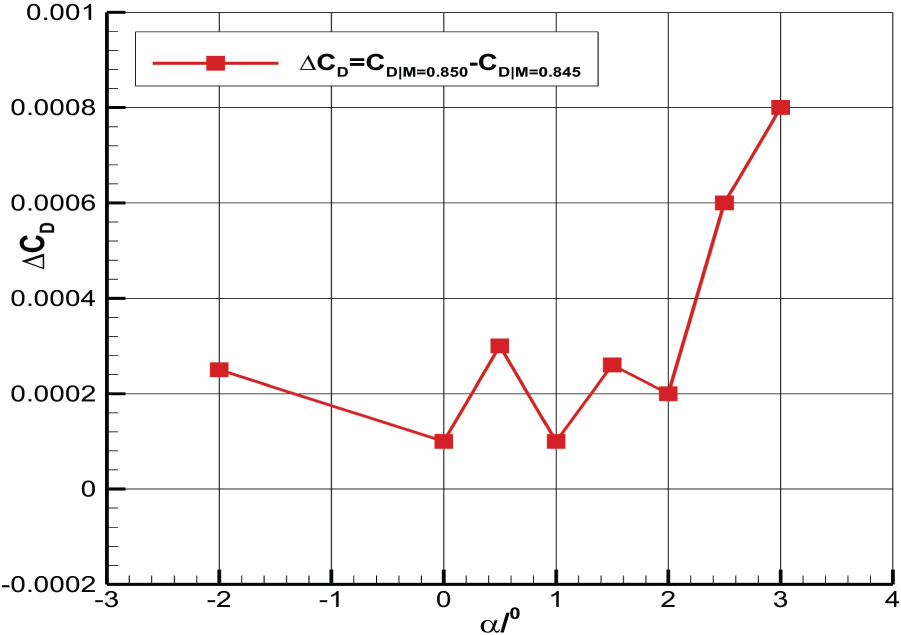
Figure 1: Influence of different Mach number on drag coefficient for wide-body aircraft model (Mach number M = 0.85, Reynolds number Re = 5.0 × 10⁶)
Model vibration. Wide-bodied aircraft should be tested at a fixed Reynolds number (Re = 5.0 × 10⁶). The heavy model load, combined with the excitation of shock-induced separation flow, is apt to cause severe model vibration, seriously affecting the accuracy of the test data and restricting the test envelope.
Nonlinear coupling of support/wall interference, there may be obvious coupling between support interference and wall interference when 0.8 ≤ M ≤ 0.96. To get clean benchmark test data, it is necessary to deduct support interference and wall interference simultaneously, rather than eliminate them separately [11].
Shock wave interaction. In near-sonic region, the airflow is easily compressed to shock waves. The strong shock waves in the main support system or auxiliary support system may seriously affect the aerodynamic measurement results of the test model. Therefore, it is necessary to design the main and auxiliary support systems carefully and analyze the surface flow pattern and affected area of the support devices.
3 Influence of the Factors on the Accuracy of High-Speed Wind Tunnel Test Data
The accuracy of wind tunnel test data is usually represented by the accuracy of the resistance coefficient. At present, high-speed wind tunnel test at home and abroad aim to obtain high measurement accuracy of resistance coefficient. In order to identify the main factors affecting the accuracy of large aircraft test data, the error transfer function of the resistance coefficient is adopted to determine the basic error sources and the accuracy control indexes of each error source in wind tunnel test when the measurement accuracy of the resistance coefficient reaches 0.0001. The calculation equation for the resistance coefficient without a sideslip angle is shown, as follows:
Differentiating the above equation:
According to the error transfer function, we obtain:
According to the calculation equation for velocity pressure:
The error transfer function of velocity pressure is obtained, as follows:
The error transfer function of the Mach number in the sub-transonic range is supplemented, as follows:
The meaning of each symbol above in Eqs. (1)–(6) is as follows:
CD–-Drag coefficient in air coordinate system
CL–-Lift coefficient in air coordinate system
CA–-Axial coefficient in body coordinate system
CN–-Normal coefficient in body coordinate system
α–-Attack angle of aircraft in air coordinate system
s–-Referenced area of aircraft
q–-Dynamic pressure
M–-Mach number
p–-Static pressure
P0–-Total pressure
It can be found that the measurement accuracy of drag coefficient is affected by not only the measurement accuracy of attack angle, normal force of balance, axial force of balance, total pressure and static pressure, but also the specific values of Mach number, attack angle, velocity pressure, lift coefficient, drag coefficient and reference area of wing. In addition, model vibration and wind tunnel background noise (which may be changed by the variation of open-close ratio of the perforated wall test section) have an impact on the test accuracy, which remains to be determined.
We take the test model of a reference aircraft which can represent the characteristics of wide-bodied planes in a 2.4 m wind tunnel as the research object. Under typical test conditions (reference area of 0.2562 m2, average aerodynamic chord length of 0.2082 m, Mach number range of 0.4∼0.96, fixed Reynolds number Re = 5.0 × 10⁶), the measurement accuracy of the wind tunnel’s original parameters must reach a certain value (σα = 0.01°, σFN = 9 N, σFA = 0.7 N, σP = 61.8 Pa, σP0 = 103 Pa), so that the accuracy of drag coefficient in cruise state σCD can reach 0.0001.
In addition, the inaccurate measurement of a characteristic parameter will affect other measurements through the functional relationship between the aerodynamic force and a certain characteristic parameter. For example, the drag measurement accuracy near the drag divergence Mach number is closely related to the Mach number control accuracy, and the lift coefficient measurement accuracy is closely related to the angle of attack measurement accuracy. When M = 0.8, 0.82, 0.85, 0.87 (near M = 0.85), the zero-lift drag coefficients calculated by CFD are respectively 0.0119, 0.0122, 0.0138, 0.0165, and the drag coefficients are 0.0205, 0.0205, 0.0203, 0.0234 (the lift coefficient CL = 0.5). It can be deduced that if ΔM = 0.002 (Mach number control accuracy is 0.001), the difference of drag coefficient will be about 0.00012. According to the calculation of the lift line slope (CLα ≈ 0.125), if the angle of attack measurement differs by Δα = 0.01°, the lift coefficient difference will be about ΔCL = 0.0013.
As mentioned before, the test accuracy is mainly affected by tunnel wall and support interferences, model deformation, and floating drag. From relevant research results of C919 model and published technical data of CRM standard model, it can be roughly concluded that the resistance correction of tail support interference may exceed 15 resistance units, the resistance correction of tunnel wall interference is about 1 resistance unit, and the resistance correction of floating resistance is about 3 resistance units. The model deformation is closely related to aerodynamic load and Mach number in the wind tunnel test.
To sum up, the measurement accuracy of drag coefficient is mainly influenced by the measurement accuracy of basic parameters of wind tunnel test, such as angle of attack, normal force of balance, the axial force of balance, total pressure and static pressure, Mach number control accuracy, and other factors that lead to the measurement accuracy of these basic parameters (including real-time measurement inaccuracy of angle of attack due to model shaking, and increased error of balance measurement due to the instability of data acquisition system). The tunnel wall interference, support interference, model deformation, and floating drag are the main factors that influence the test accuracy.
4 Improvement of Refined Aerodynamics Experiment Technology
4.1 Support System Design and Applications of Active Vibration Reduction Technology
For the same wing span, the fuselage of wide-body aircraft is slenderer and the aerodynamic load is larger than the C919 model. On the premise of meeting the support stiffness and strength, the model’s tail is damaged seriously, and problems such as support interference are more prominent. In order to ensure the reliability of test data, detailed optimization of test support system is needed.
(1) Main support system optimization
As the main support of wide-body aircraft under wind tunnel test, the tail support design impacts the subsequent test directly. Wide-bodied On the premise of sufficient stiffness and strength, data simulation is used for optimization of tail support by designing the angle of inclined tail support, the expanding position and angle of straight section such as strut. The supporting interference device has been carefully designed.
The main variables of tail shape design include the total length of strut, the diameter of equal straight section, the length of an equal straight section, and the angle of tail support (as the upturn angle of the tail-shaped rear body of civil aircraft is large, the straight tail support will cause large tail damage). The total length of a strut is fixed due to the restrictions such as the center of rotor of the FL-76 wind tunnel test section, uniform flow field, model moment reference point, and balance size. According to the model load and structural finite element analysis, the diameter of straight segment is 76 mm, so the tail support angle and straight segment length are the main variables in the design. In order to obtain better parameter values, we take the real shape of wide-bodied aircraft without pod and tail support as configurations. The CFD simulation based on nested grid is adopted to study the effect of tail support on aerodynamic coefficient under different tail support angles and equal segment length. The design goal is to minimize the support interference (Δ (CL, Cm, CD)), and the calculation conditions are: M = 0.7, 0.85, Re = 5.0 × 10⁶, α = −4°∼4°, Δα = 1°.
Fig. 2 shows the corresponding calculation results. It can be found that the tail support increases the lift of the whole aircraft. With the increasing of the tail support angle, the influence of the strut on the lift decreases gradually. As the influence of tail support on the drag decreases gradually and reaches a minimum at around 6°, the increasing of angle causes rising interference again. The influence of tail support angle on the moment is similar to that of lift. After comprehensive consideration, the tail support angle is selected as 6°.
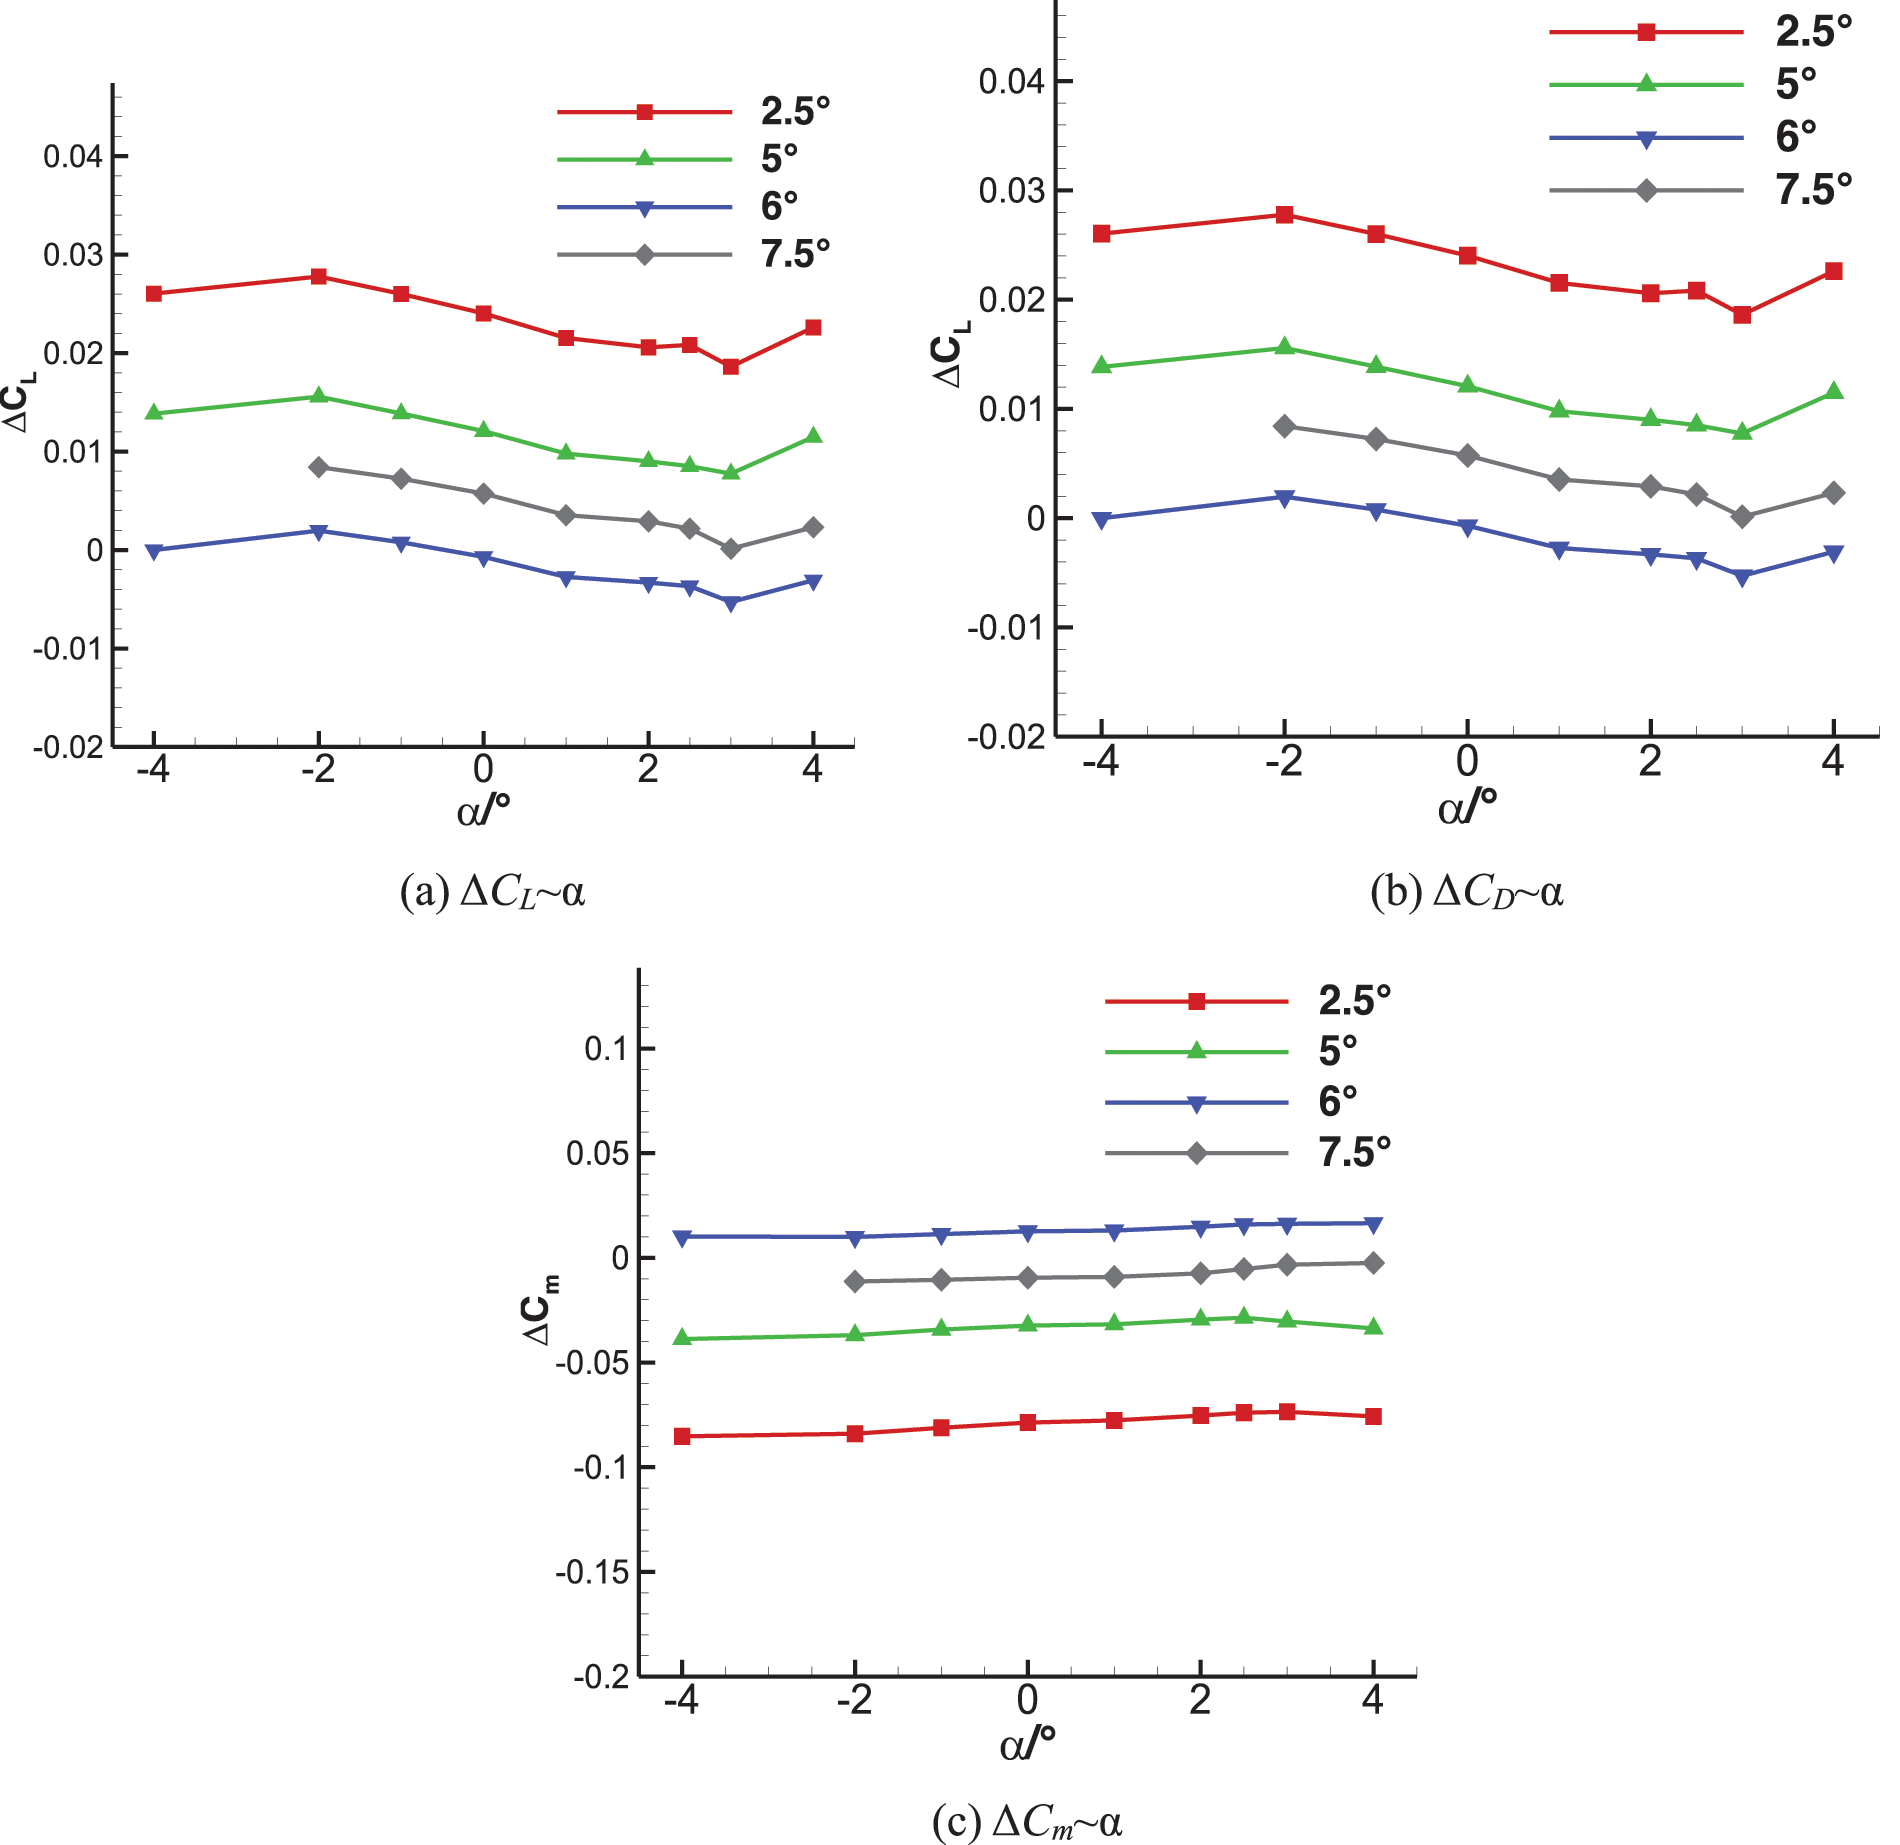
Figure 2: Influence of incidence angle on aerodynamic interference
Fig. 3a shows the calculation grid of wide-bodied aircraft with different straight segment lengths (corresponding to different expansion angles, numbered 1#∼5#), and the corresponding results are shown in Figs. 3b∼3c. Overall, it is found that the tail corresponding to 3# has less interference on aerodynamic characteristics.
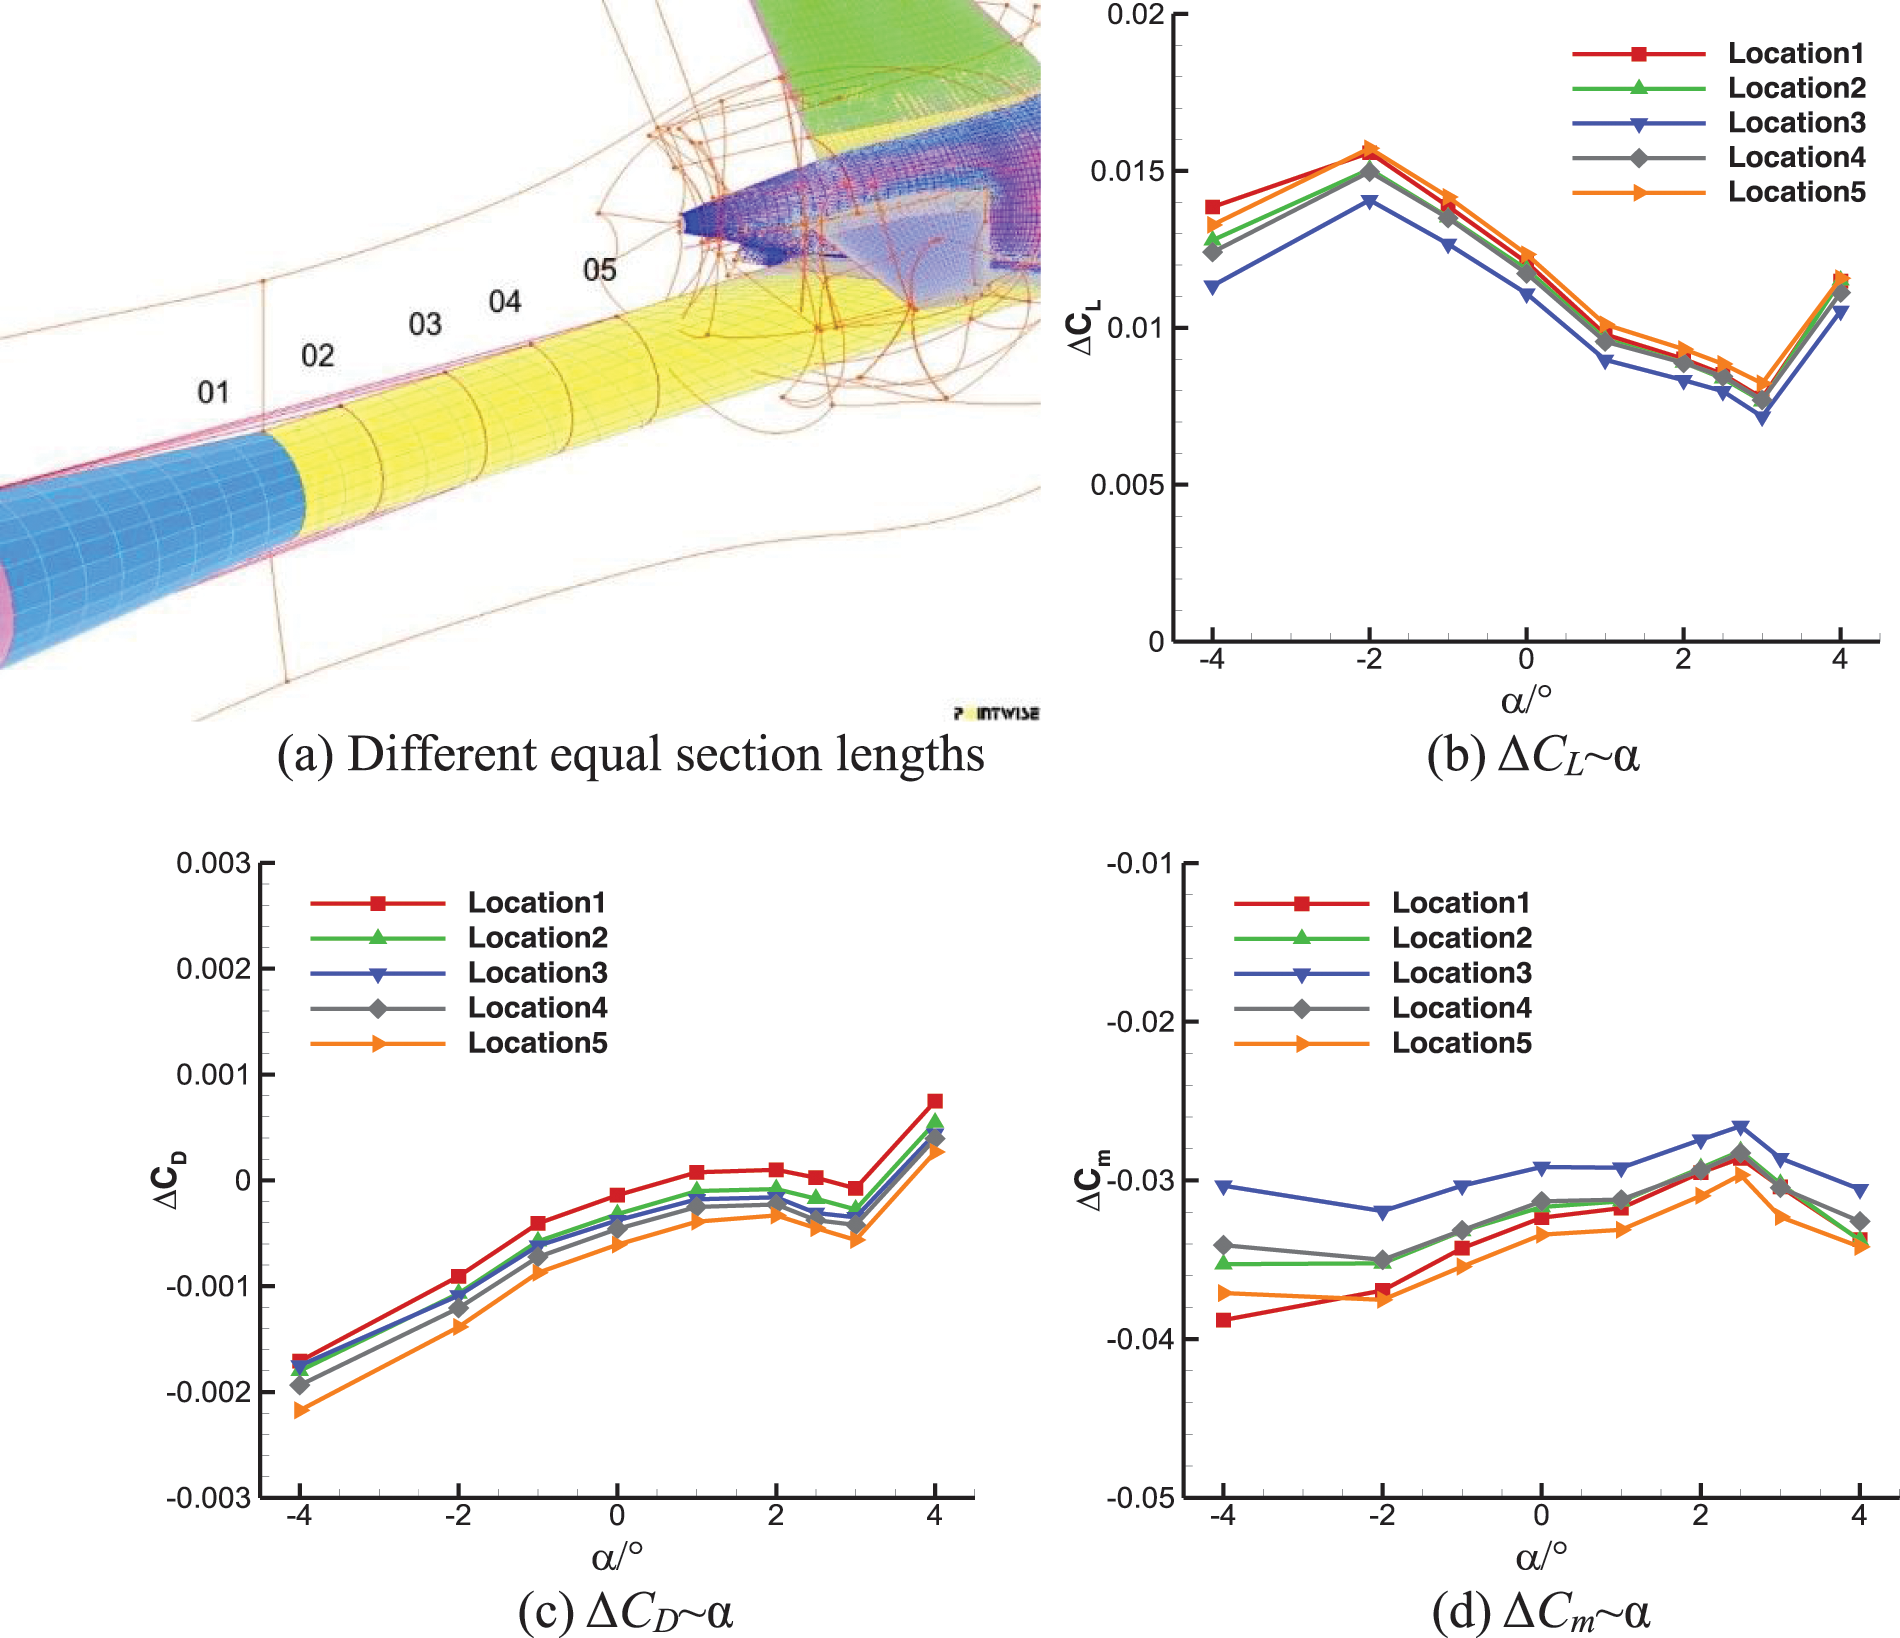
Figure 3: Influence of equal segment length on the interference of strut
(2) Support interference device optimization
Wingtip double support design. A more streamlined design is adopted to reduce aerodynamic interference, and its flow interference characteristics are analyzed through CFD [12–14]. The support is a π-shaped structure, containing a double support, support fairing cone, fairing cone cover, double support struts, double support balance, balance wing connecting cover, sensor shield, and sensor shield fairing (as shown in Fig. 4). The span distance of double supports can be adjusted (760, 888 and 1016 mm) to meet different test requirements.
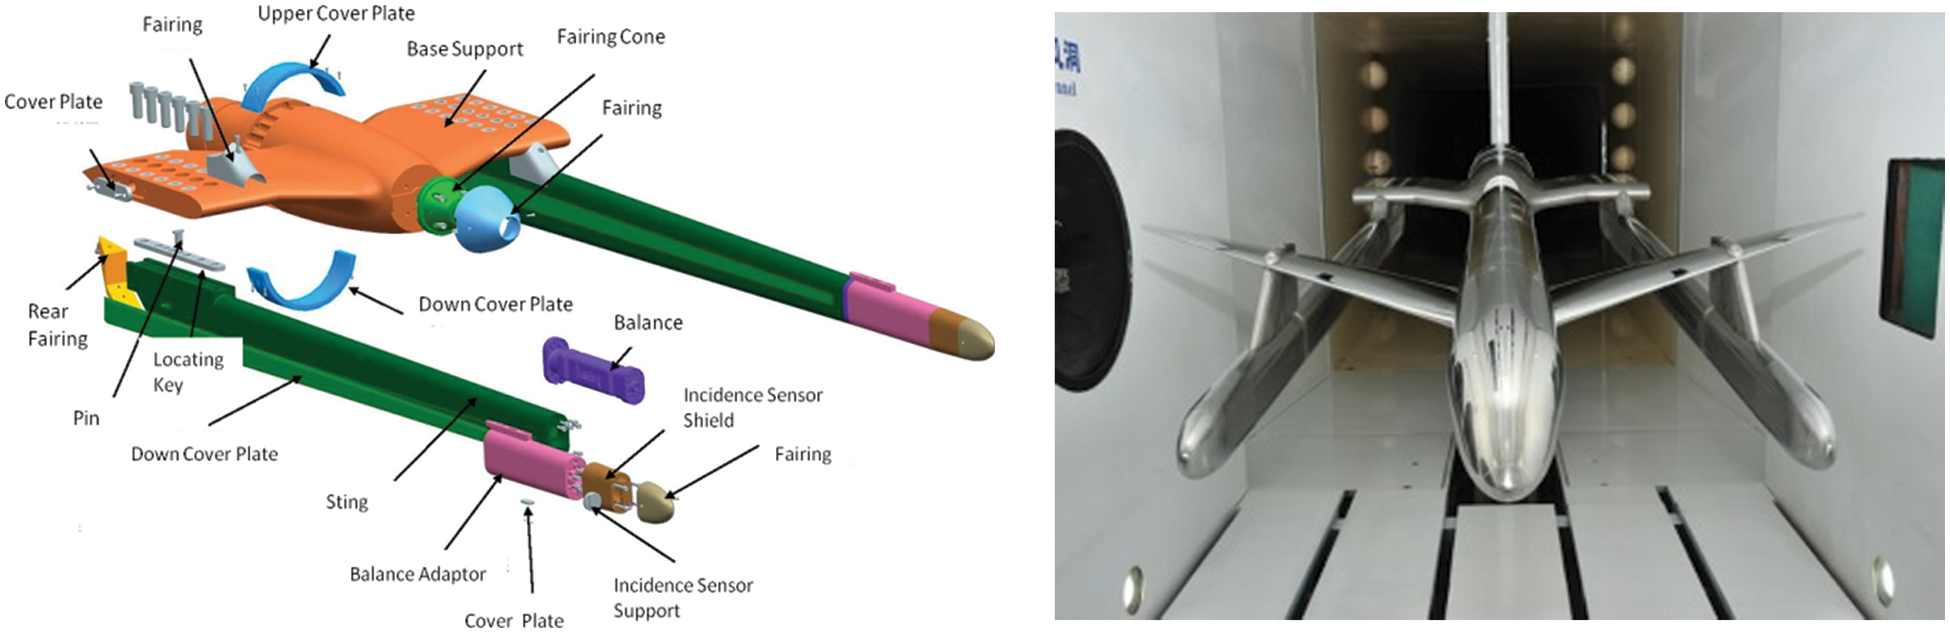
Figure 4: Sketch of wingtip dual support system structure and test photograph
(3) Application of model vibration active suppression technology
To some extent, the support system stiffness affects the data repeatability accuracy. Three tail supports with different stiffness are used in the study on the repetitive influence. As shown in Fig. 5, the stiffness of the support system becomes stronger after the diameter of the strut is increased. When α >0°, the repeatability accuracy of ϕ = 86 mm is improved obviously.
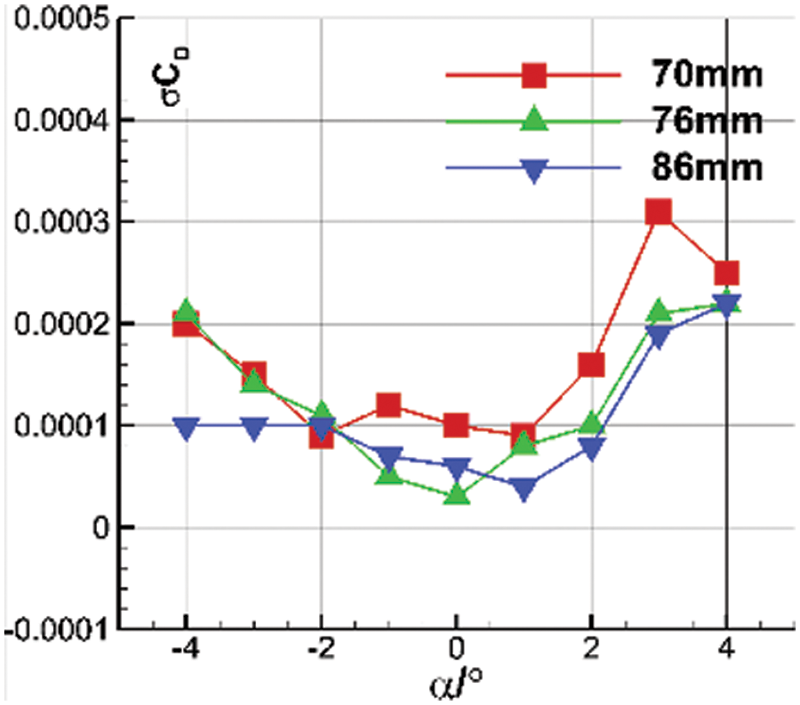
Figure 5: Repeatability accuracy of strut with different diameters
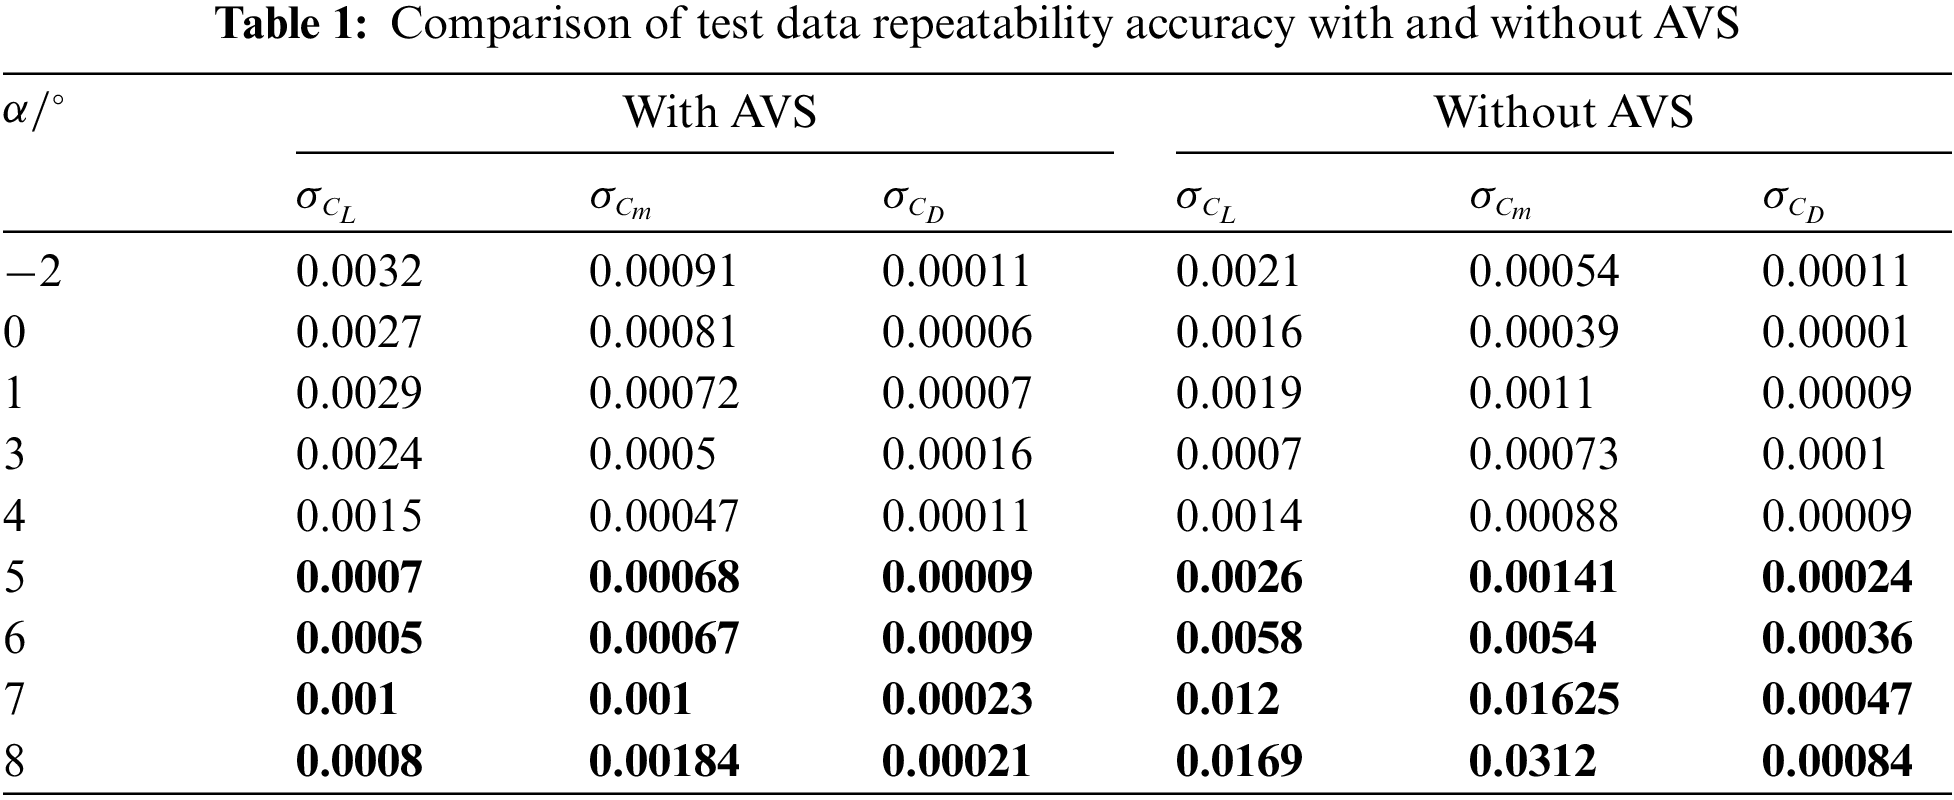
Therefore, it is of great value in engineering applications to apply active vibration suppression system to reduce model vibration and improve the repeatability accuracy of data for angle of attack above medium values. Table 1 shows the influence when applying the system on testing the repeatability accuracy of a freighter model test. It can be found that the active vibration suppression system (AVS) of the model has little influence on the repeatability accuracy of the test within the angle of attack of 4°. However, when the angle of attack is greater than 4°, the system can improve the repeatability accuracy significantly.
4.2 Improvement of Model Attitude Angle Measurement Technology
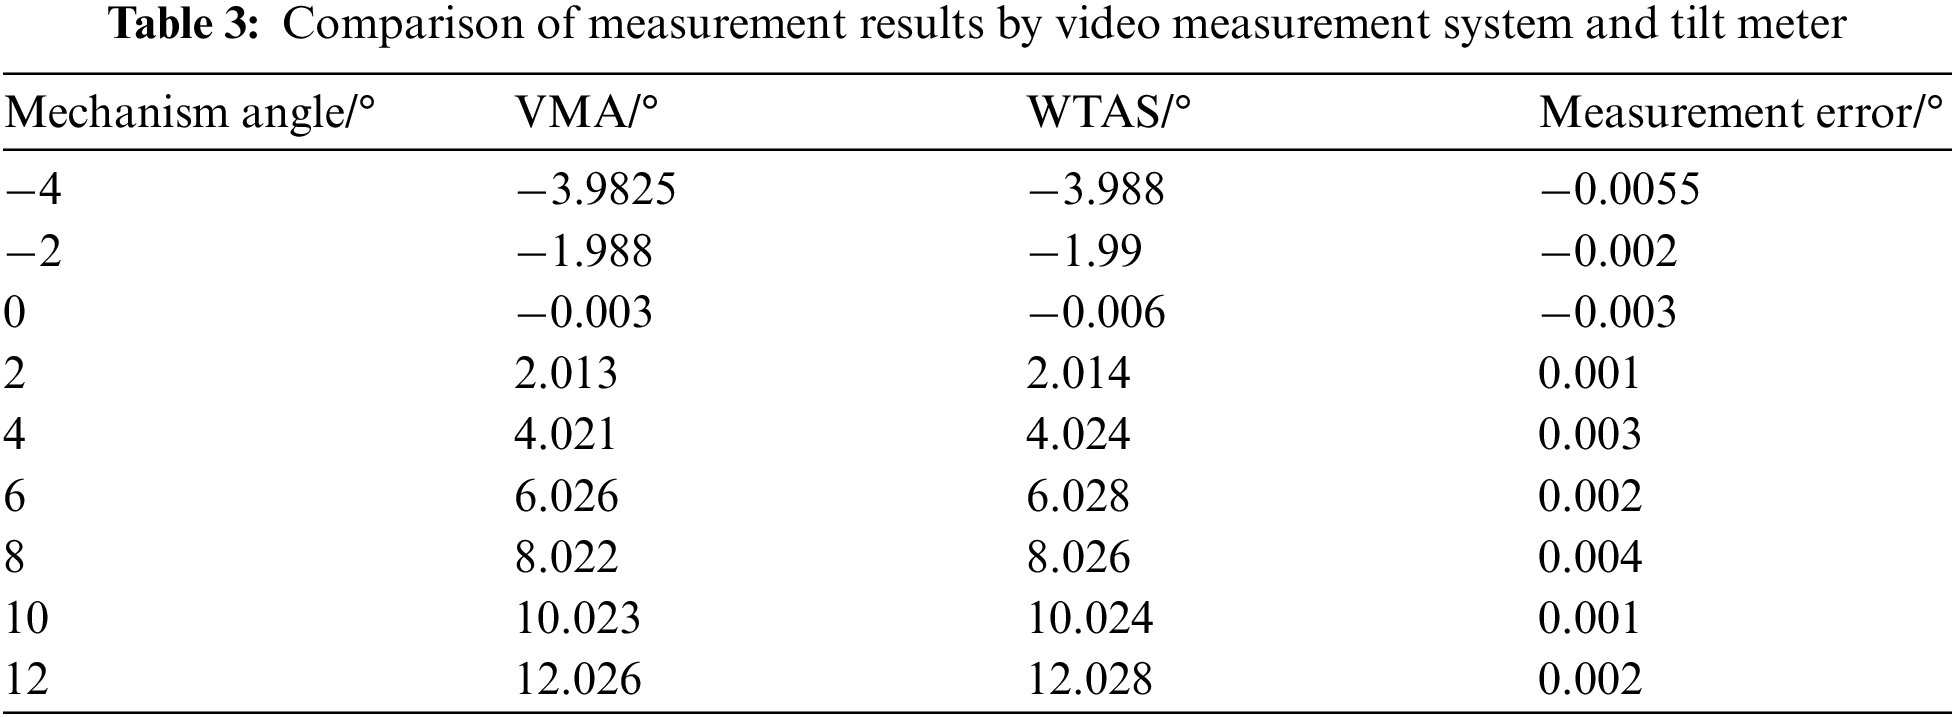
In order to improve the real-time measurement accuracy of the model’s angle of attack, video measurement attitude angle system (VMA) is perfected, and wind tunnel angle sensor (WTAS) suitable for wind tunnel test is designed and developed (as shown in Fig. 6). In order to improve the working stability and measurement accuracy of WTAS sensor, we select permanent magnet materials with high remanence and low temperature coefficient and soft magnetic materials with high magnetic permeability. In addition, the quartz pendulum and torque coil in the tilt sensor are improved to reduce the mass of sensitive component sand increase the number of turns of torque coil. Therefore, the overload range of WTAS tilt sensor reaches ± 40 g, and the angle measurement range is ± 45°, which meet the requirements of accuracy and stability.
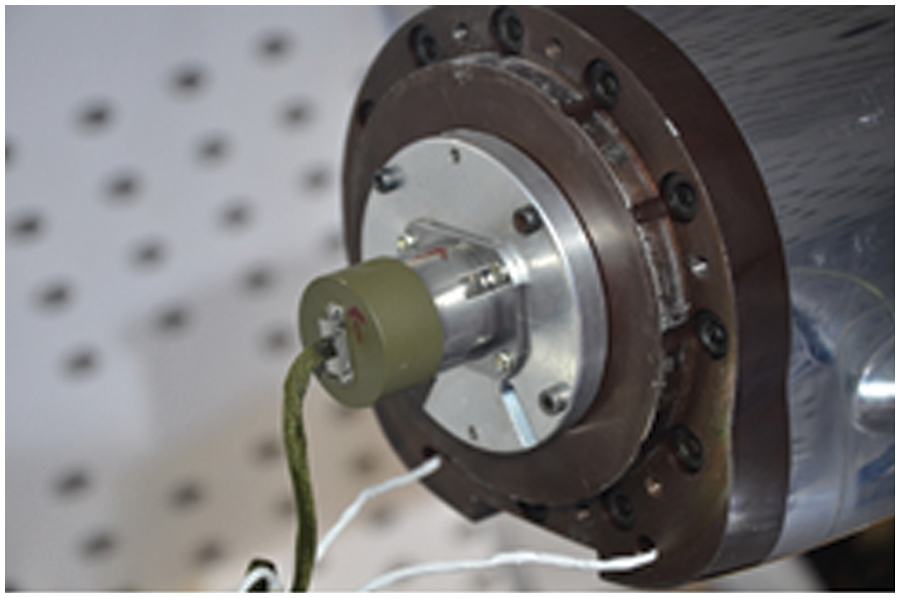
Figure 6: WTAS tilt sensor installed in cavity of model
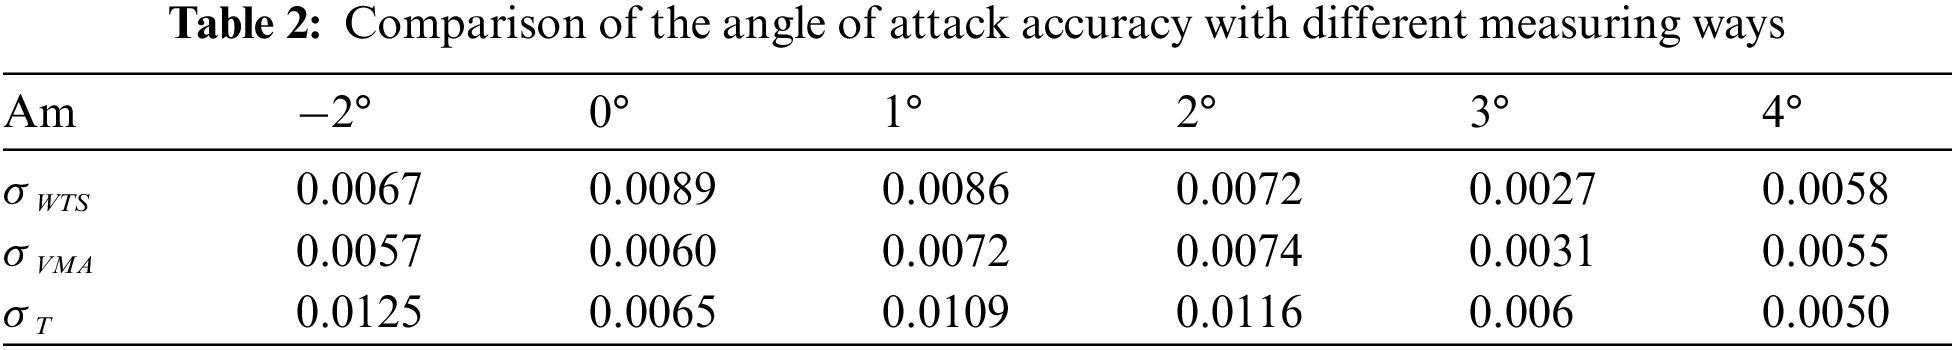
A comparative test of different angles of attack measurement methods (WTAS, VMA and elastic angle correction) is conducted to study the working characteristics of video measurement attitude angle system and WTAS tilt sensor. The results indicate that the repeatability measurement accuracy of WTAS and VMA is high (Table 2). The accuracy level in the main angle of attack measurement range of wide-bodied aircraft in high-speed wind tunnel test is better than 0.01°. The measurement accuracy of the traditional elastic angle correction method in some working conditions exceeds 0.01°. In addition, there is an error in fitting the elastic angle formula because it is difficult to calibrate the elastic angle by using the full-scale design load of the balance. Table 3 shows the angle measurement comparison between WTAS and VMA, and the maximum difference between them is within 0.009°, which indicates that the results of WTAS and VMA are reliable.
The two attitude angle measurement methods established in this study can be extended to high-speed wind tunnel test without main balance (such as pressure measurement, hinge moment, and atmospheric data system test) to improve the test accuracy greatly.
4.3 Technical Improvement of Mach Number Control Accuracy
In order to meet the demand for flow field control accuracy in the high-speed wind tunnel test of wide-bodied aircraft, much work has been carried out, including the research on grid finger synchronous control strategy, the improvement of synchronous control of main exhaust valves, and the optimization of Mach number control strategy based on model predictive control (MPC). As a result, the control of flow field in wind tunnel can meet the requirements of wide-body aircraft test. The improvements are as follows:
The positioning and synchronous control accuracy of the main exhaust valve control system has been improved, with its synchronous positioning and control accuracy increased to 0.5 mm and 1 mm, respectively;
The positioning and synchronization control accuracy of the grid finger system has been improved, with its synchronization positioning and control accuracy increased to 0.3 mm and 0.5 mm, respectively.
Due to the abnormal sensitivity of transonic flow and the limitations of temporary wind tunnel operation, the high-precision control requirements of Mach number in the near-sonic region cannot be achieved by using conventional PID control method. Therefore, the research on the control accuracy of Mach number in wind tunnel based on model predictive control has been carried out innovatively. As shown in Figs. 7–10, the step response models of gate finger, resident flow valve and main exhaust valve are constructed, and the online rolling optimization and control strategy based on feed forward/feedback dynamic matrix is put forward [2], which greatly improves the accuracy of Mach number near the sound speed. When 0.85 ≤ M ≤ 0.9, the control accuracy of Mach number exceeds 0.001, and when 0.9 ≤ M ≤ 0.96, it is better than 0.0015, which provides strong support for high-precision force measurement in the near-sonic region of wide-bodied aircraft.
Figure 7: Diagram of rolling optimization
Figure 8: Diagram of dynamic matrix control with feed forward and feedback
Figure 9: Actual control effect of Mach number (M = 0.85)
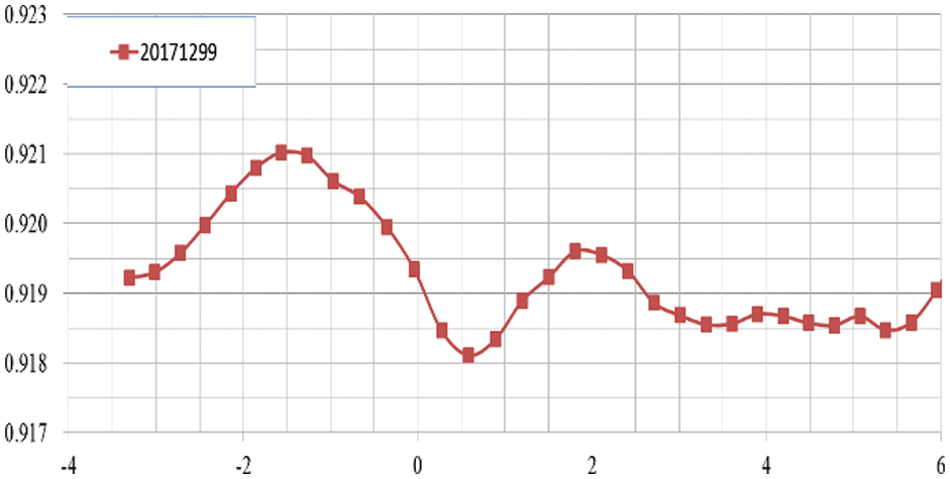
Figure 10: Actual control effect of Mach number (M = 0.92)
4.4 Improvement of Test Data Correction Technology
International advanced wind tunnels (such as ETW, NTF and HST) have not only excellent flow field quality and test system, but also mature wind tunnel test data correction technology, which has played an important role in the development of Boeing and Airbus series aircraft. FL-26 wind tunnel has established a large aircraft test data correction system through equipment upgrading and technical improvement (Fig. 11). In this study, according to the characteristics of wide-bodied aircraft in 2 m high-speed wind tunnel test, support/tunnel wall interference, model deformation and flow field distortion are systematically corrected. Clean benchmark data of wind tunnel test are obtained, the correction process and result analysis of test data are given, and technical improvements are realized in the following aspects.
Figure 11: Correction system of high-speed wind tunnel test data of large aircraft
(1) Model deformation correction technology
A mature model deformation measurement system (DMS) is established in FL-26 wind tunnel. Based on the real-time measurement of deformation results and grid deformation technology, CFD simulation method was used to correct the wing deformation of a wide-bodied aircraft model under different working conditions. The reliability reached engineering application levels, and the data distortion problem caused by load deformation of high aspect ratio aircraft model in wind tunnel test for a long time was solved [15,16].
The improved VMD system was used to measure the real-time deformation of the test model at different angles of attack. Then, CFD method was employed to obtain the aerodynamic characteristics of the wide-bodied aircraft test model before and after deformation. Since the large deformation of the test model was the wing, the deformation influence correction was mainly carried out for the wing.
Fig. 12 shows the torsion angle and bending deformation of the wide-body model wing at different angles of attack when M = 0.85 and Q (velocity pressure) = 54 kPa. The abscissa “η” in the figure indicates the percentage of exposed wing span wise stations.
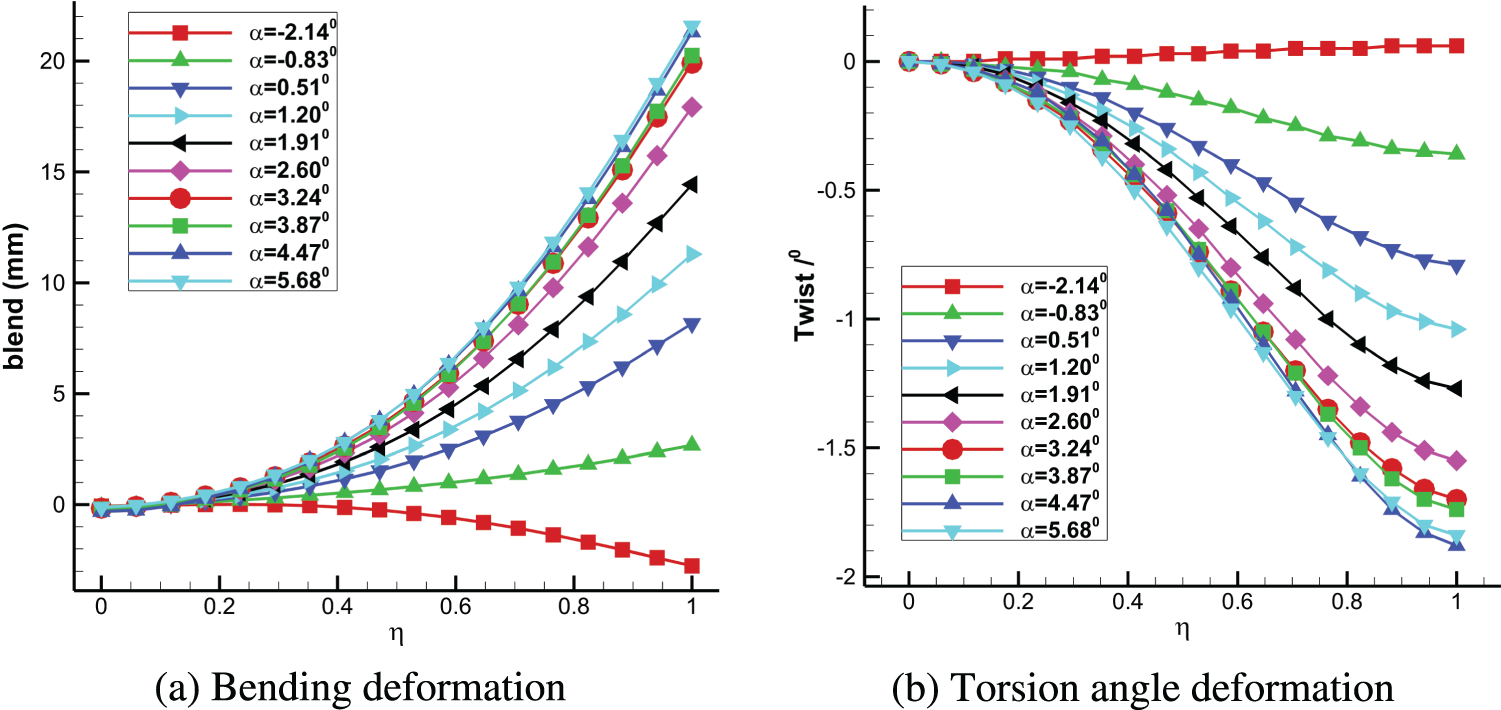
Figure 12: Deformation of the wide-body model wing under different angles of attack (M = 0.85, Re = 5.0 ×10⁶, Q = 54 kPa)
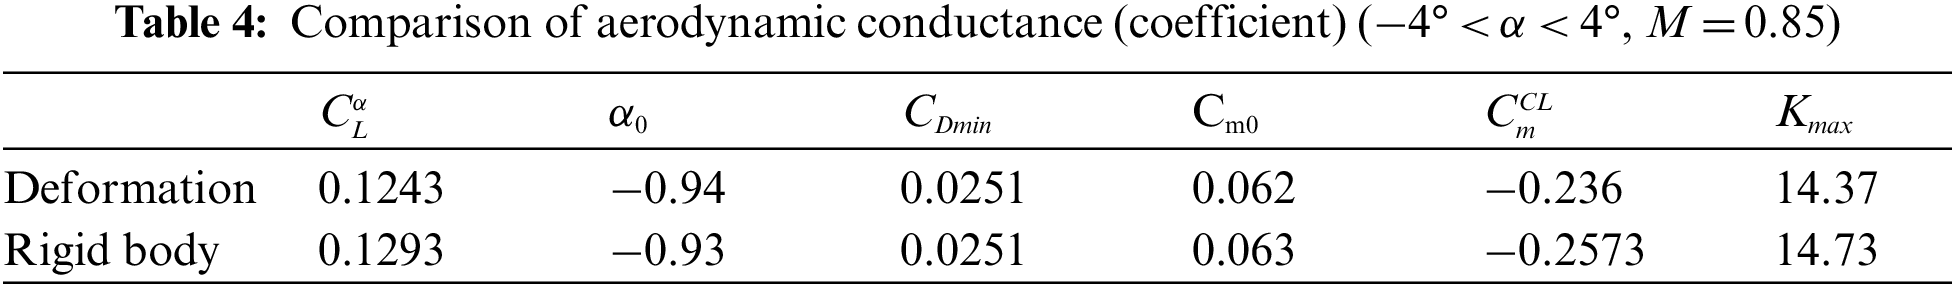
Table 4 shows the comparison of aerodynamic conductance and coefficient before and after the model deformation. It can be found that after wing deformation, the lift coefficient decreases, the slope of lift line decreases by about 0.005, the longitudinal static stability weakens, and the focus moves forward by 0.021 MAC. Although the minimum drag changes little, the drag near the cruise point increases by about 0.0006 and the maximum lift-drag ratio decreases by about 0.36. After the model deformation, the influence on the lift line slope, focus and cruise lift-drag ratio should not be ignored, but corrected.
The analysis shows that the wing model is deformed under load in the wind tunnel test, resulting in a negative torsion angle, and lower local angle of attack. Furthermore, the deformation of the wing closer to the wing tip is larger, and the lift loss of the outer wing part and the trailing edge of the wing is larger, which leads to the decreasing of lift coefficient and the increasing of pitching moment of the whole wing. With the increasing of the tested angle of attack, the aerodynamic load borne by the wing model increases, and the deformation of the model increases correspondingly. The loss of lift coefficient increases when the angle of attack is small, and the increment of the pitching moment also increases, which leads to the decrease of the slope of lift line and the forward focus of the model after deformation. At a positive angle of attack, the main reason for the decrease of drag coefficient is that the decrease of lift coefficient leads to the decrease of lift-induced drag at a constant angle of attack after the wing is deformed at a negative twist angle. Meanwhile, when the local angle of attack of the wing section decreases the profile drag of the wing section will decrease as well.
(2) Support interference correction technology
The traditional end-cavity pressure processing method of tail support interference test is improved, and the influence of the end-cavity pressure measurement position, the position and diameter of the dummy sting penetrating into the end cavity of the model on the test result is explored. The purpose is to accurately deduct the end cavity interference of the wide-bodied aircraft model and determine the test mode of the high-speed end-cavity interference test.
This study adopts the innovative three-balance support method (Fig. 13), in which the dummy sting is not connected with the twin sting support system, and takes root in the tail support balance. The simulation is basically consistent with the real tail support test, and the influence of strut is deducted by the component balance, which solves the simulation problem of flow similarity in the model cavity.
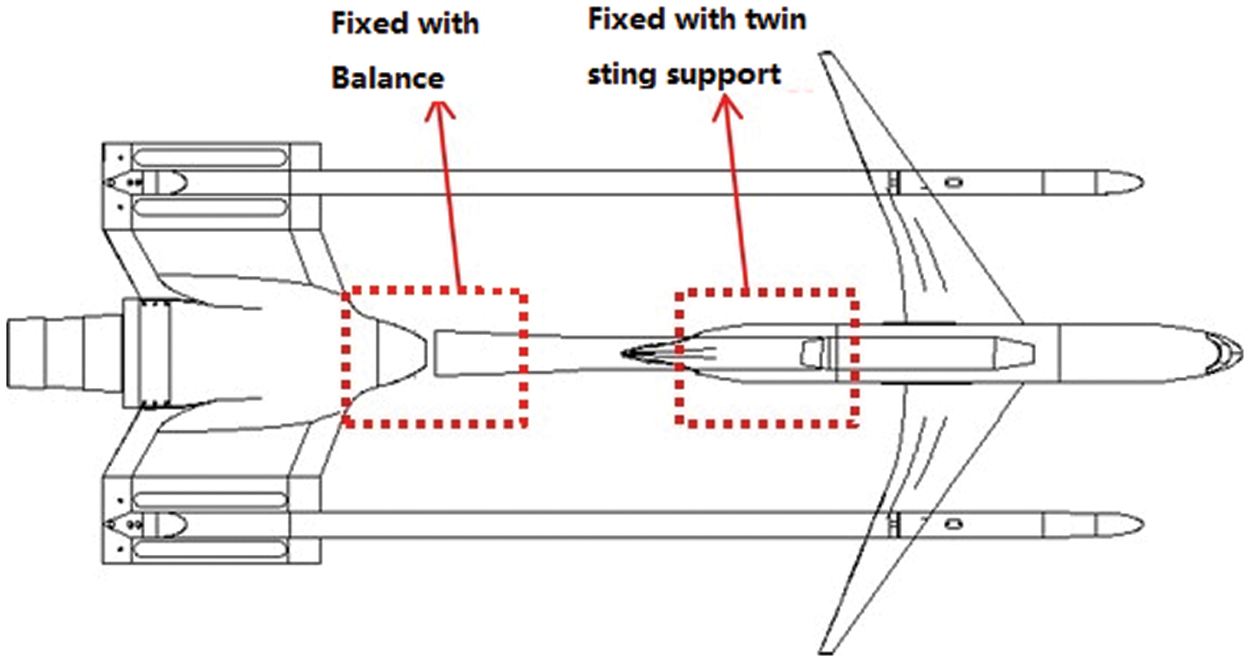
Figure 13: Support interference test of three balances
(3) Tunnel wall interference correction technology
The blockage degree of subsonic and transonic wind tunnel test models is generally controlled within 1%, and the wall interference correction is usually not carried out at middle and low test angles of attack. In order to accurately obtain the aerodynamic performance of wide-bodied aircraft and explore the wall interference characteristics in the full-scale test section of the FL-26 wind tunnel, a set of wall pressure measuring device was developed in particular, and the wall pressure information method was applied to study the correction of the wall interference influence as shown in Fig. 14.
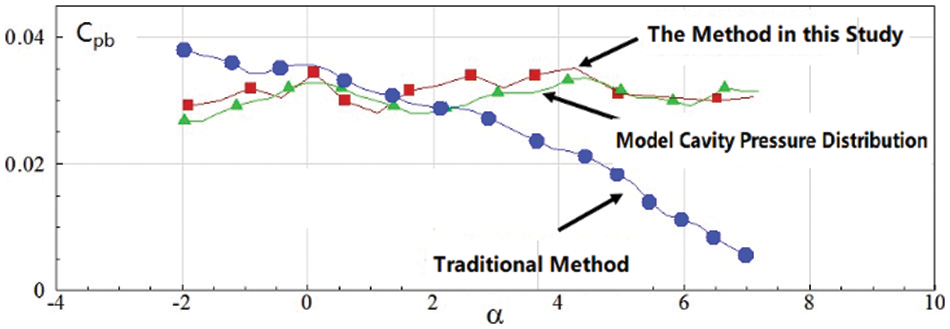
Figure 14: Comparison of pressure distribution in model end cavity with different simulation methods
The results show that for the test model of wide-bodied aircraft, the wall of the full-scale test section of the FL-26 wind tunnel makes the angle of attack larger and Mach number lower. Generally, the influence of the wall interference on the lift, resistance and pitching moment coefficient of the test model is small. The influence value of the lift coefficient is less than 0.002, the value of the resistance coefficient is less than one unit at most angles of attack, and the influence of the wall generates the lifting moment, with a value of less than 0.0025.
It is believed that there are two main reasons for the small interference of the wide-bodied aircraft model in FL-26 wind tunnel wall. First, the scale of the test model is strictly controlled, with the blockage degree at zero angle of attack less than 1%, and the wingspan less than 65% of the width of the test section. Second, the angle of attack of the test model is relatively small, and the test angle of attack is generally lower than 8 around the cruise Mach number. Due to the complicated preparation and implementation of the tunnel wall interference test, and the slight overall influence of tunnel wall interference, the existing correction results can be used before the aerodynamic layout of wide-bodied aircraft changes significantly [17,18].
For the channel wall test section, the channel wall interference prediction technology based on velocity potential equation can be directly applied to correct the test data.
(4) General correction
When the average air flow deflection angle is corrected, the microelectronic angle of attack measuring instrument is used in the same position to measure the attitude angle of the forward and reverse installation of the model, thus reducing the test error. When the influence of floating resistance is corrected, the accurate calculation of test model volume can be realized by integrating the sectional area of each component. Meanwhile, the flow field is calibrated according to the total test pressure of 5 × 10⁶ Reynolds of the model (Fig. 15). The floating resistance of the model is accurately corrected, and the difference between the total test pressure of 5 × 10⁶ Reynolds and the floating resistance under normal pressure is studied (Fig. 16).
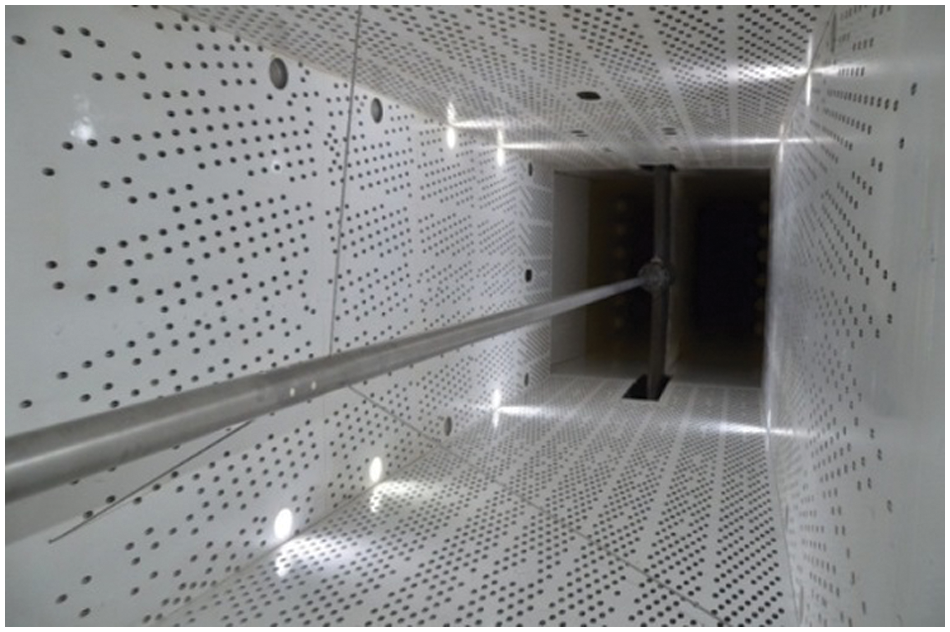
Figure 15: Measurement of the axial gradient of flow field
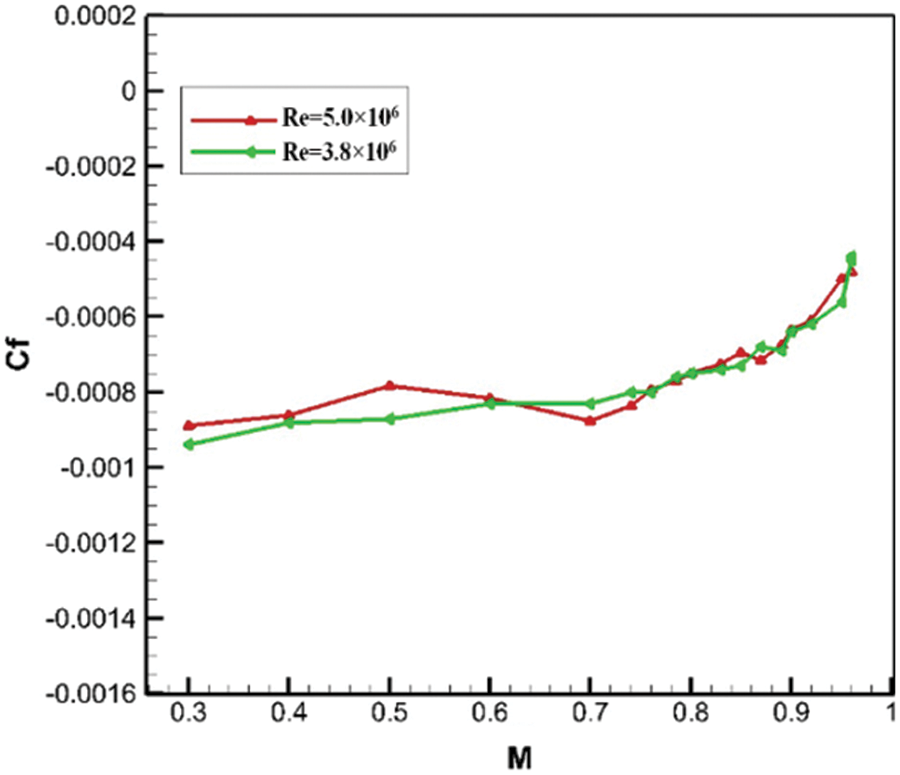
Figure 16: Buoyancy drag of wide-body aircraft model under different dynamic pressure (M = 0.85)
4.5 Development of High-Precision Force Balance and Standard Model
(1) Development of special high-precision six-point measuring force balance
Generally, the dimensions of a balance depend on the design range, model geometry and internal structure of the strain balance. Under the same load condition, the advantages of the balance with a large diameter are as follows: (1) When designing the structure, the strength check may meet the design requirements easily; (2) The layout space of balance elements is large, which is beneficial to controlling the processing accuracy and strain gauge sticking quality; (3) Large rigidity and good linearity of the balance calibration formula enable the calibration results reach the development index easily; (4) As part of the model support system, the stiffness of the balance contributes directly to the overall stiffness of the system and can reduce the model vibration.
The X element of the balance is the key to the design. T-shaped beam structure is adopted, which is symmetrically arranged on both sides of the longitudinal symmetry plane of the balance at the center. The supporting plate consists of several vertical beams, which are arranged on both sides of the longitudinal symmetry plane of the balance and in front of and behind the design center of the balance. It aims to decompose resistance load and other loads, reduce interference and improve performance. The Y element, Mz element, Mx element, Z element and My element of the balance are rectangular beams with simple structure, which is easy to be processed.
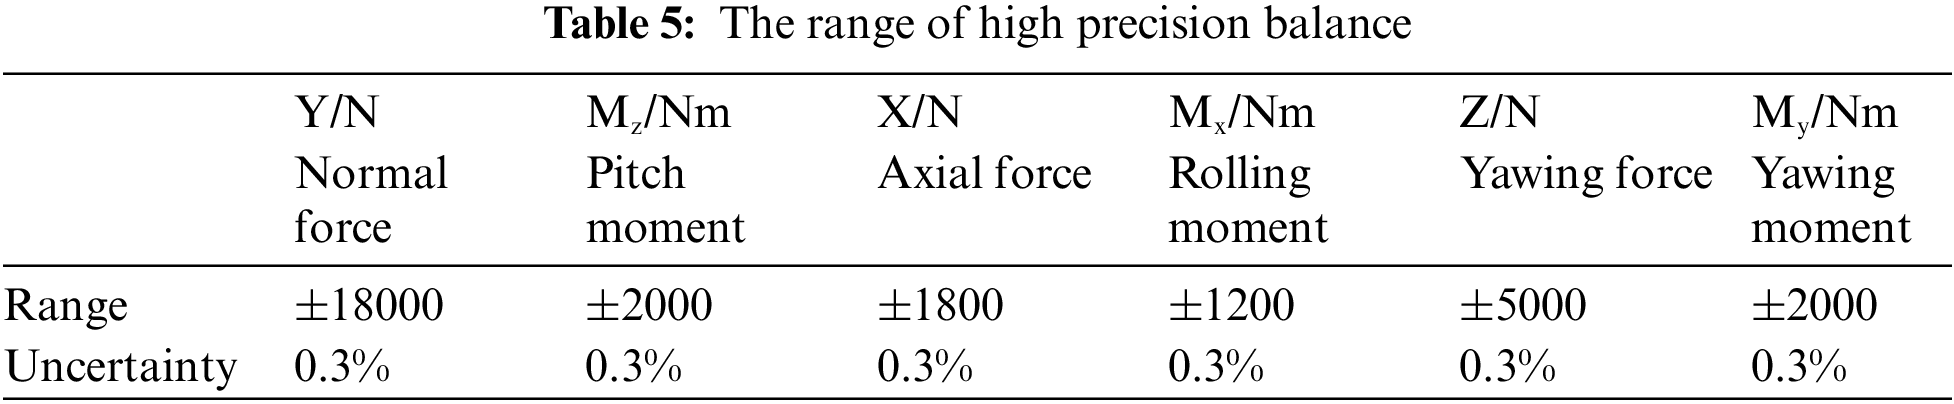
Finally, the measurement uncertainty level of normal force and axial force of the balance was increased from 0.3% of conventional balance to 0.1%, which better met the test requirements of wide-bodied aircraft (as shown in Fig. 17), the detail range of balance is presented in Table 5.
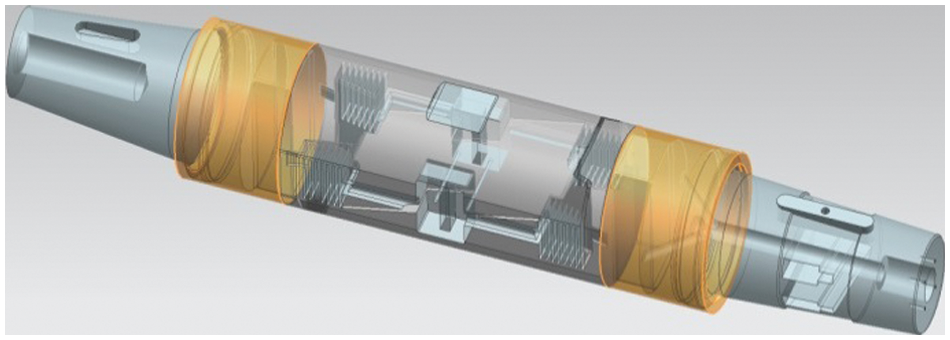
Figure 17: High precision balance for wide-bodied aircraft model
5 Comparative Test and Application of Wide-Bodied Aircraft Standard Model
5.1 Wide-Bodied Aircraft Standard Model Configuration
As shown in Fig. 18, the standard model of the wide-bodied aircraft in this test is the wing-body combination configuration, which adopts the supercritical airfoil design and the designed cruise Mach number is 0.85. The model is 1.6223 m long, with a wingspan of 1.564 m and a reference area of 0.2555 m2. It has been tested in ETW of Europe, T-128 of Russia and FL-26 wind tunnel of aerodynamic center, including longitudinal aerodynamic characteristics, model deformation measurement and support interference.
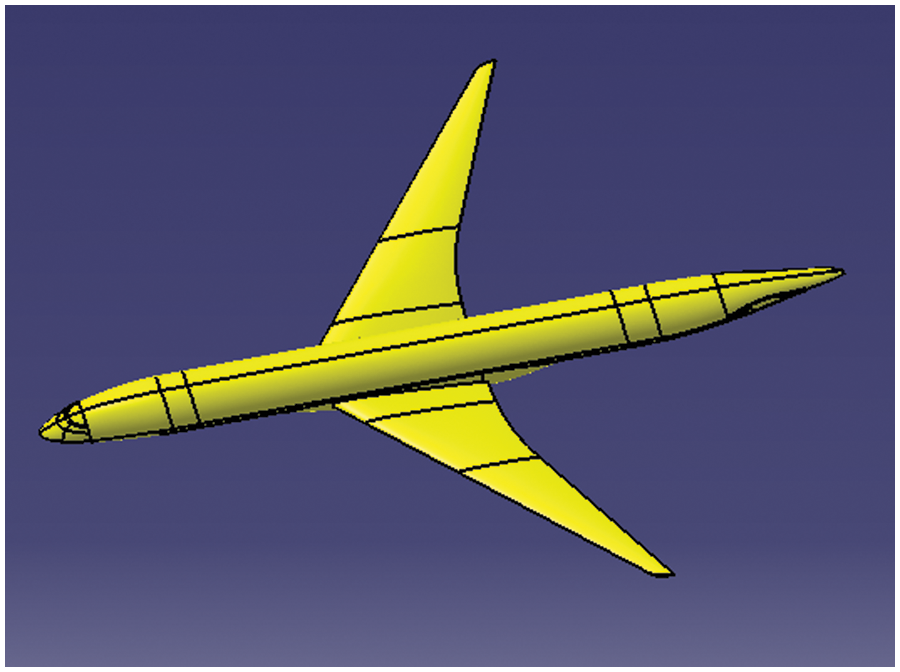
Figure 18: Contour drawing of wide-body aircraft standard model
(1) Test repeatability accuracy
Table 6 shows the aerodynamic repeatability accuracy of the wide-bodied aircraft standard model for seven times. Fig. 19 displays the comparison of deformation measurement results of two repetitive tests. It can be seen that the repeatability accuracy of the comparison test is σCL ≤ 0.0012, σCD ≤ 0.00004, σCm ≤ 0.0004, the bending resolution of the model deformation measurement is within 0.2 mm, and the tensional deformation is within 0.04.
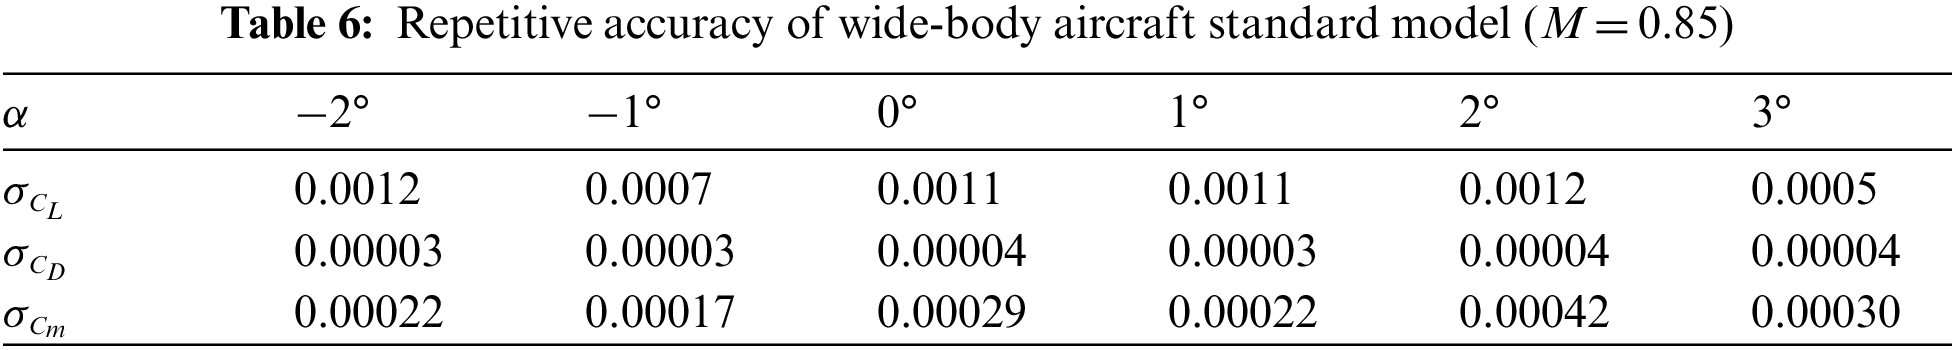
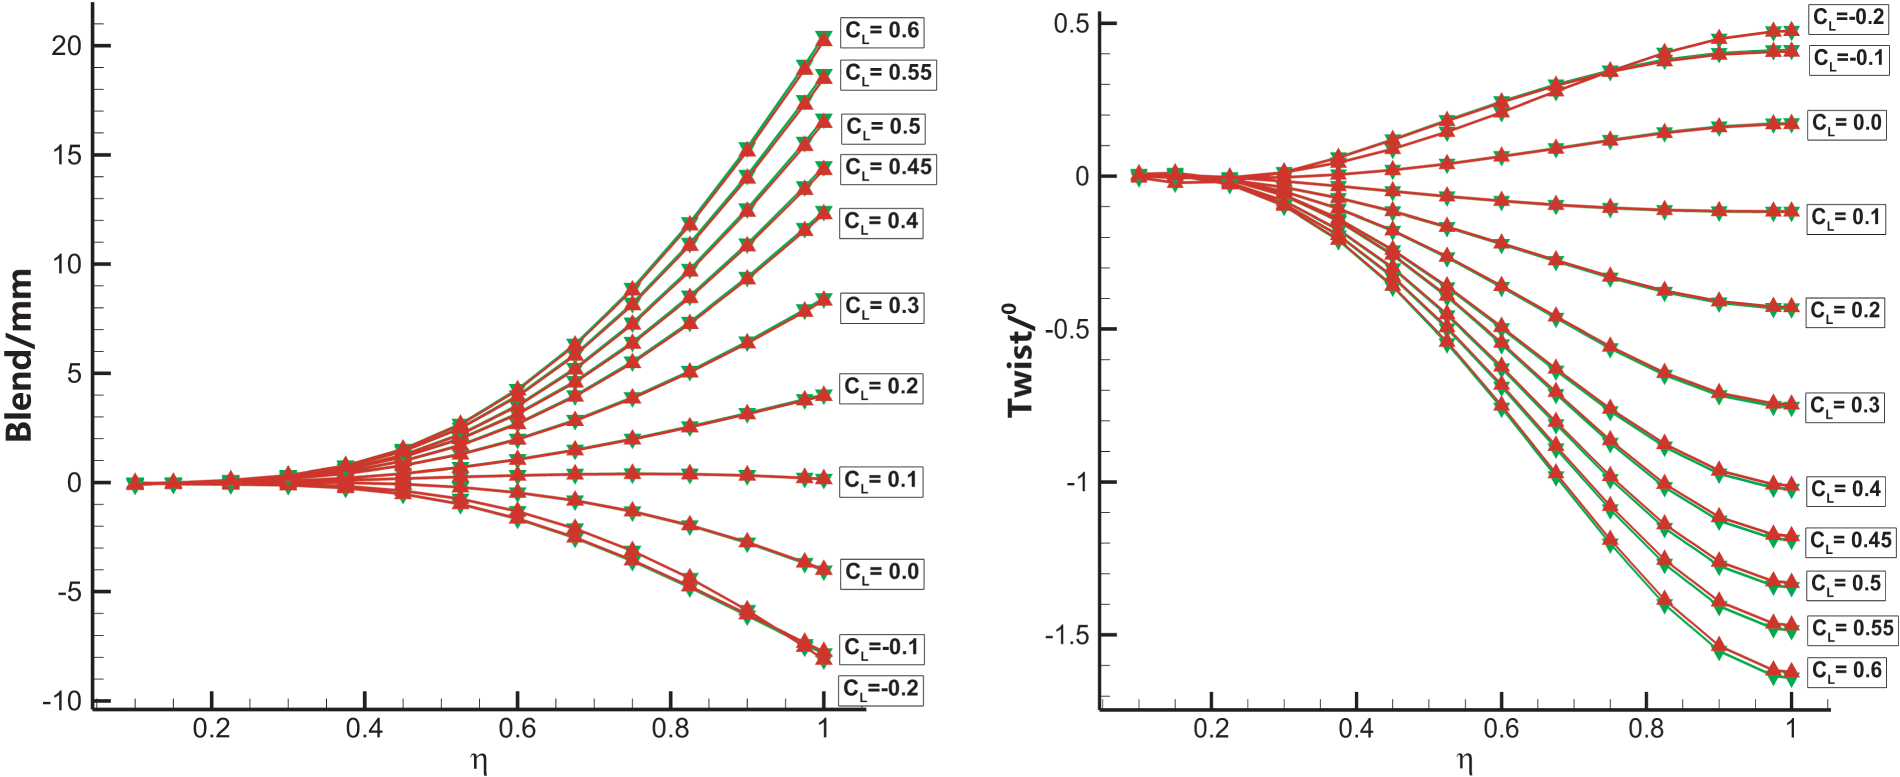
Figure 19: Repeatability of model deformation measurement (M = 0.85)
(2) Comparison with the ETW test results of European transonic wind tunnel
① Model deformation measurement results
The comparison of the deformation measurement test results of the wide-bodied aircraft standard model in different wind tunnels is shown in Fig. 20. The results demonstrate that the deformation measurement law and magnitude of the model’s wing are in good agreement in both wind tunnels. When M = 0.85, the maximum torsion difference is less than 0.1, and the maximum inversion difference is about 0.4 mm. When M = 0.89, the maximum torsion difference is less than 0.1, and the maximum reverse deformation difference is about 1.3 mm.
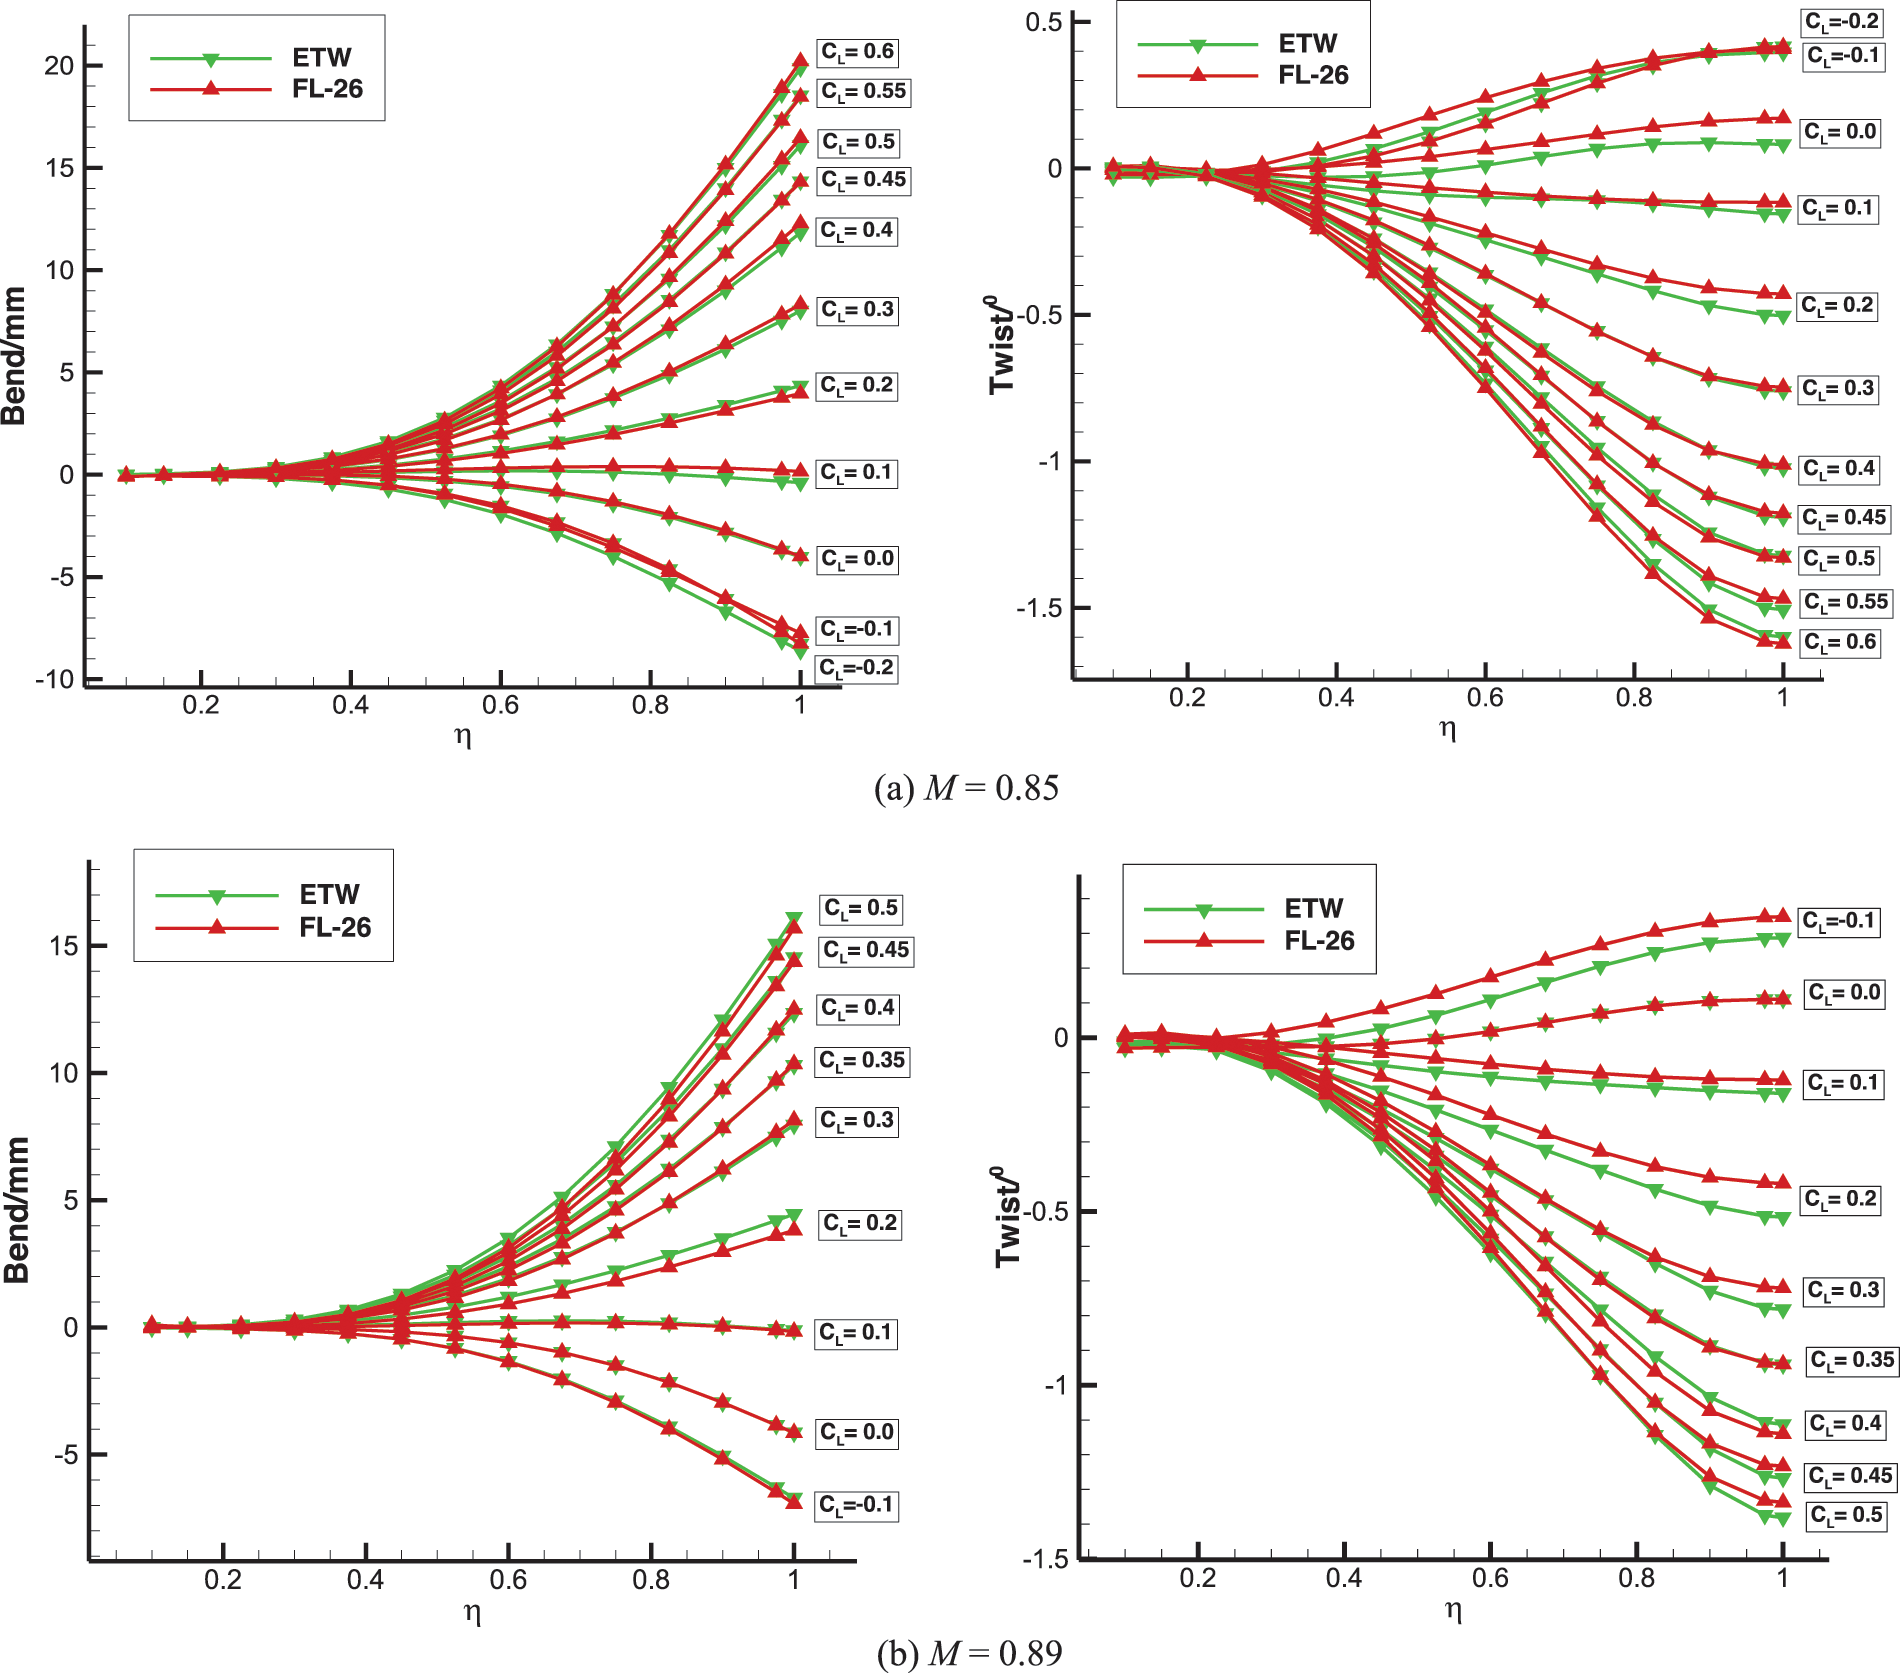
Figure 20: Deformation of wide-body aircraft standard model in FL-26 and ETW
② Revised aerodynamic results
Figs. 21 and 22 show the comparison results of aerodynamic conductivity and coefficient of the wide-bodied aircraft standard model after being revised in two wind tunnels [19]. After revision, it correlates well in the two wind tunnels [20,21], and the test curve and the number of typical derivatives (coefficients) differ slightly. Taking M = 0.85 for example, the maximum lift-drag ratio difference is 0.01, the zero-lift drag coefficient difference is 0.0003, the lift line slope difference is 0.0013, the focus difference is 0.0015, and the zero-lift moment difference is 0.0012, and the zero-lift angle of attack difference is 0.04.
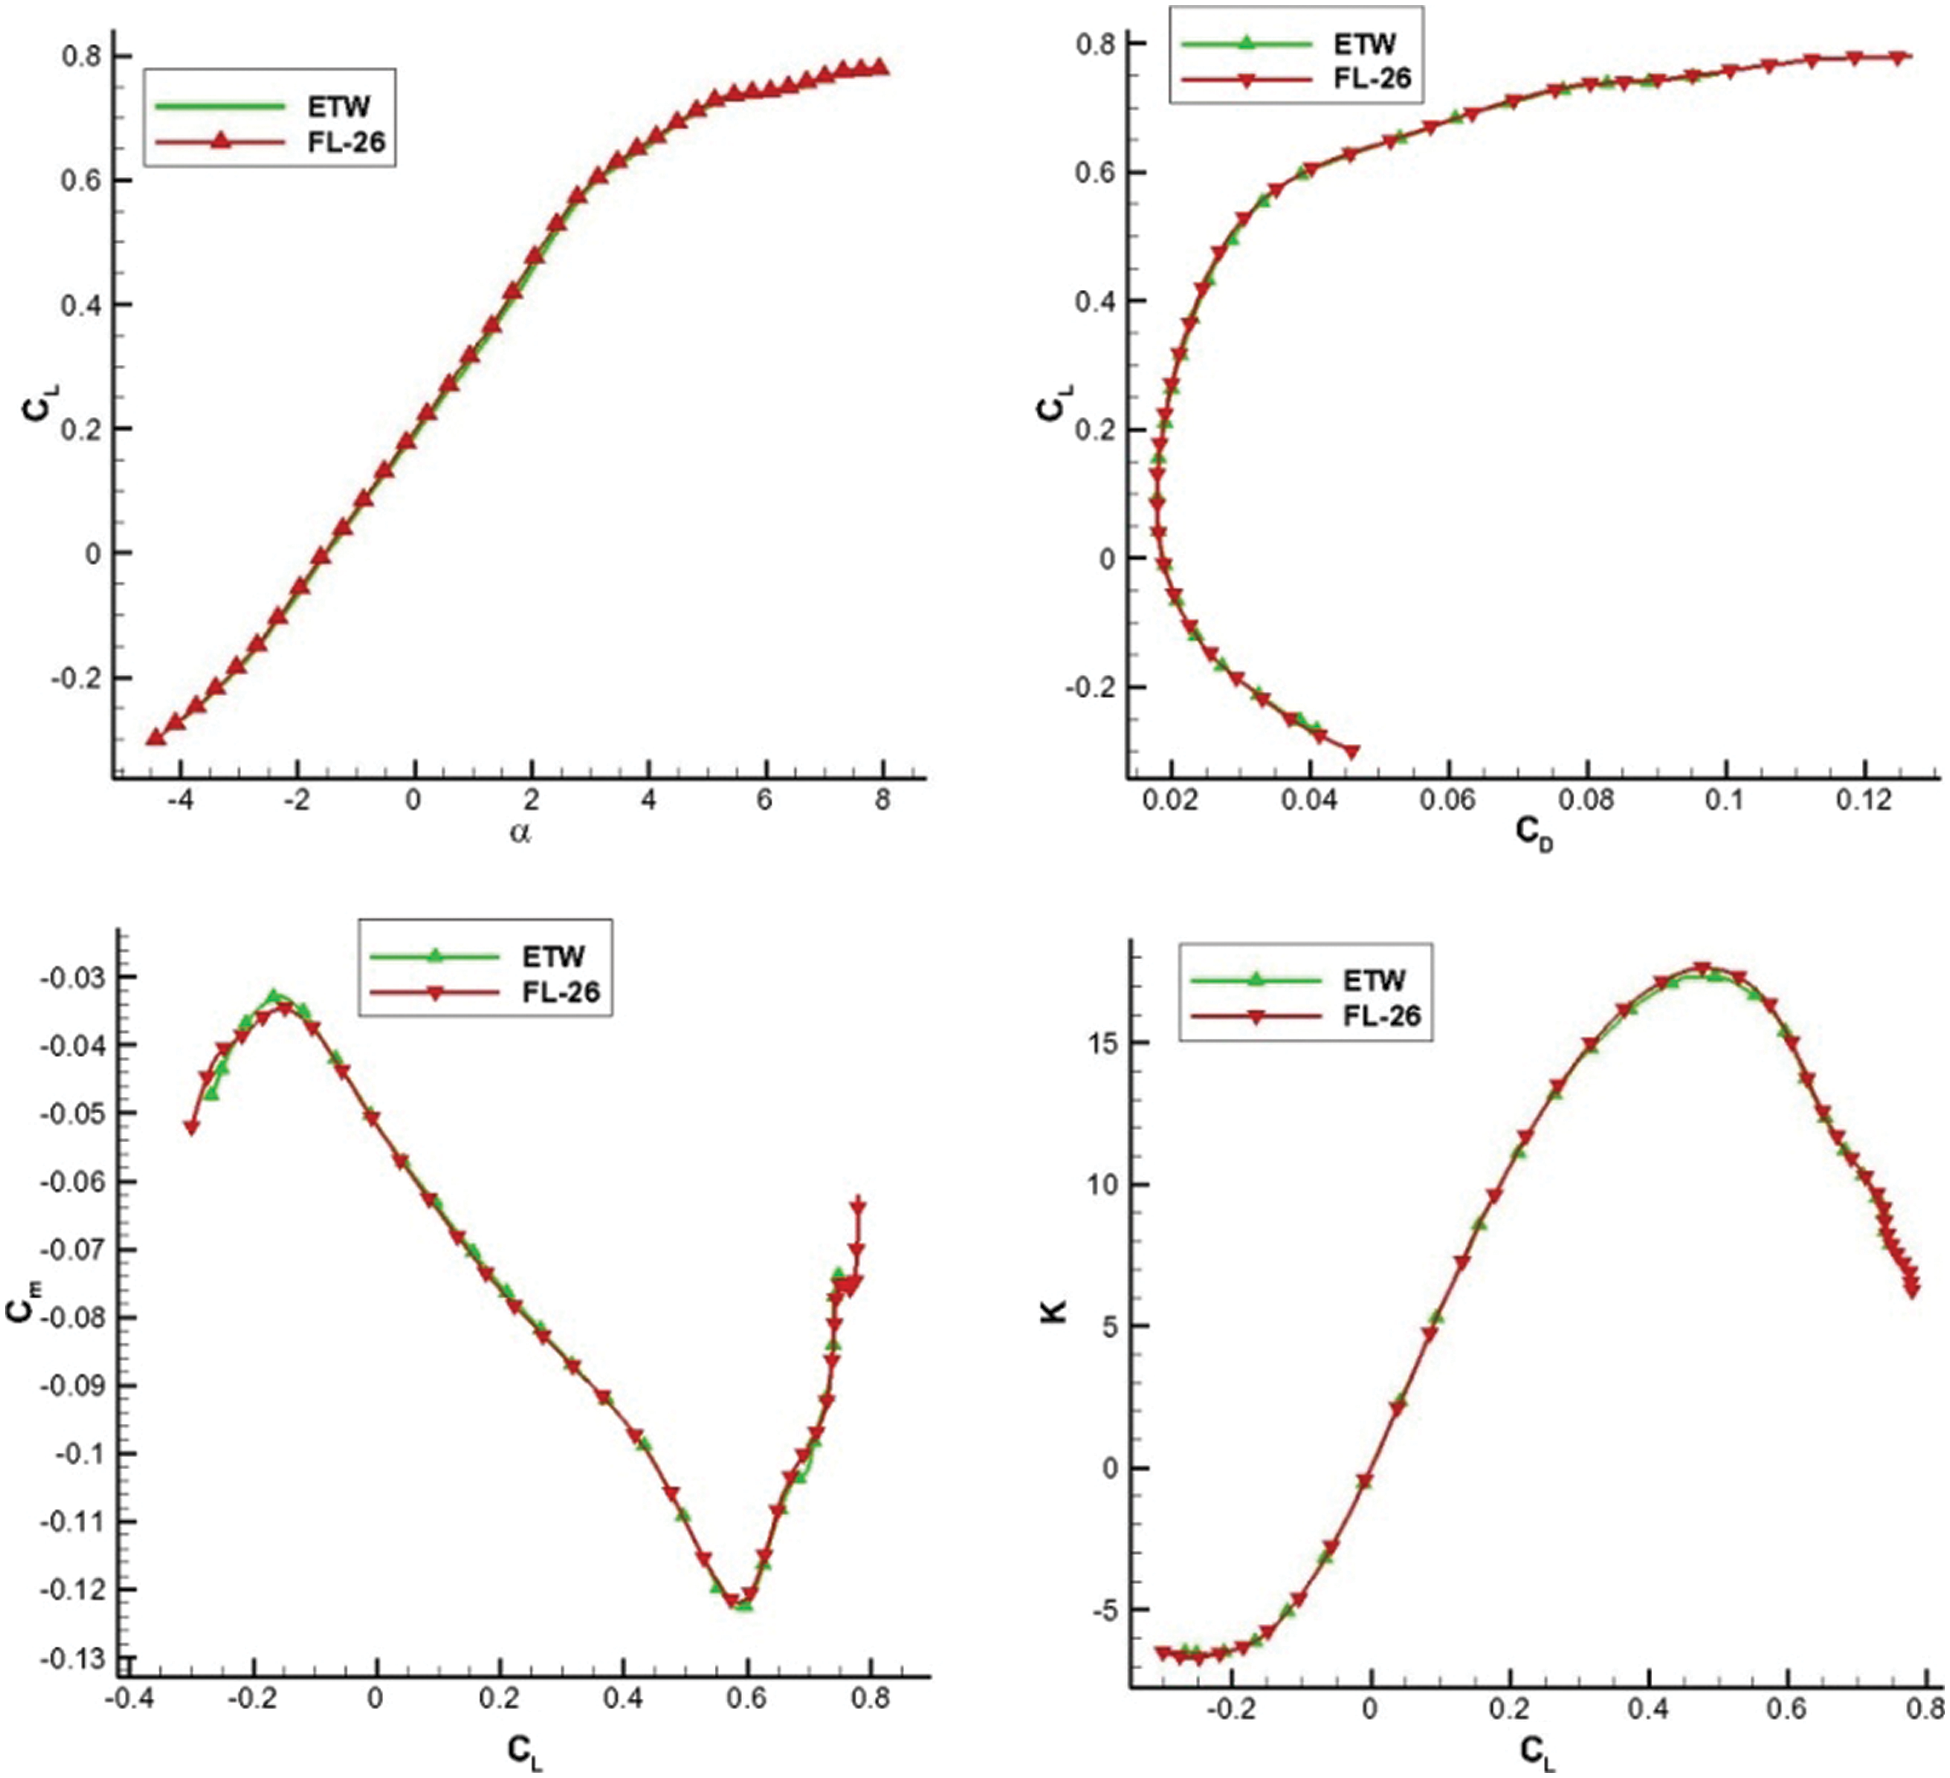
Figure 21: Wind tunnel test results of wide-body aircraft standard model in FL-26 and ETW (M = 0.85)
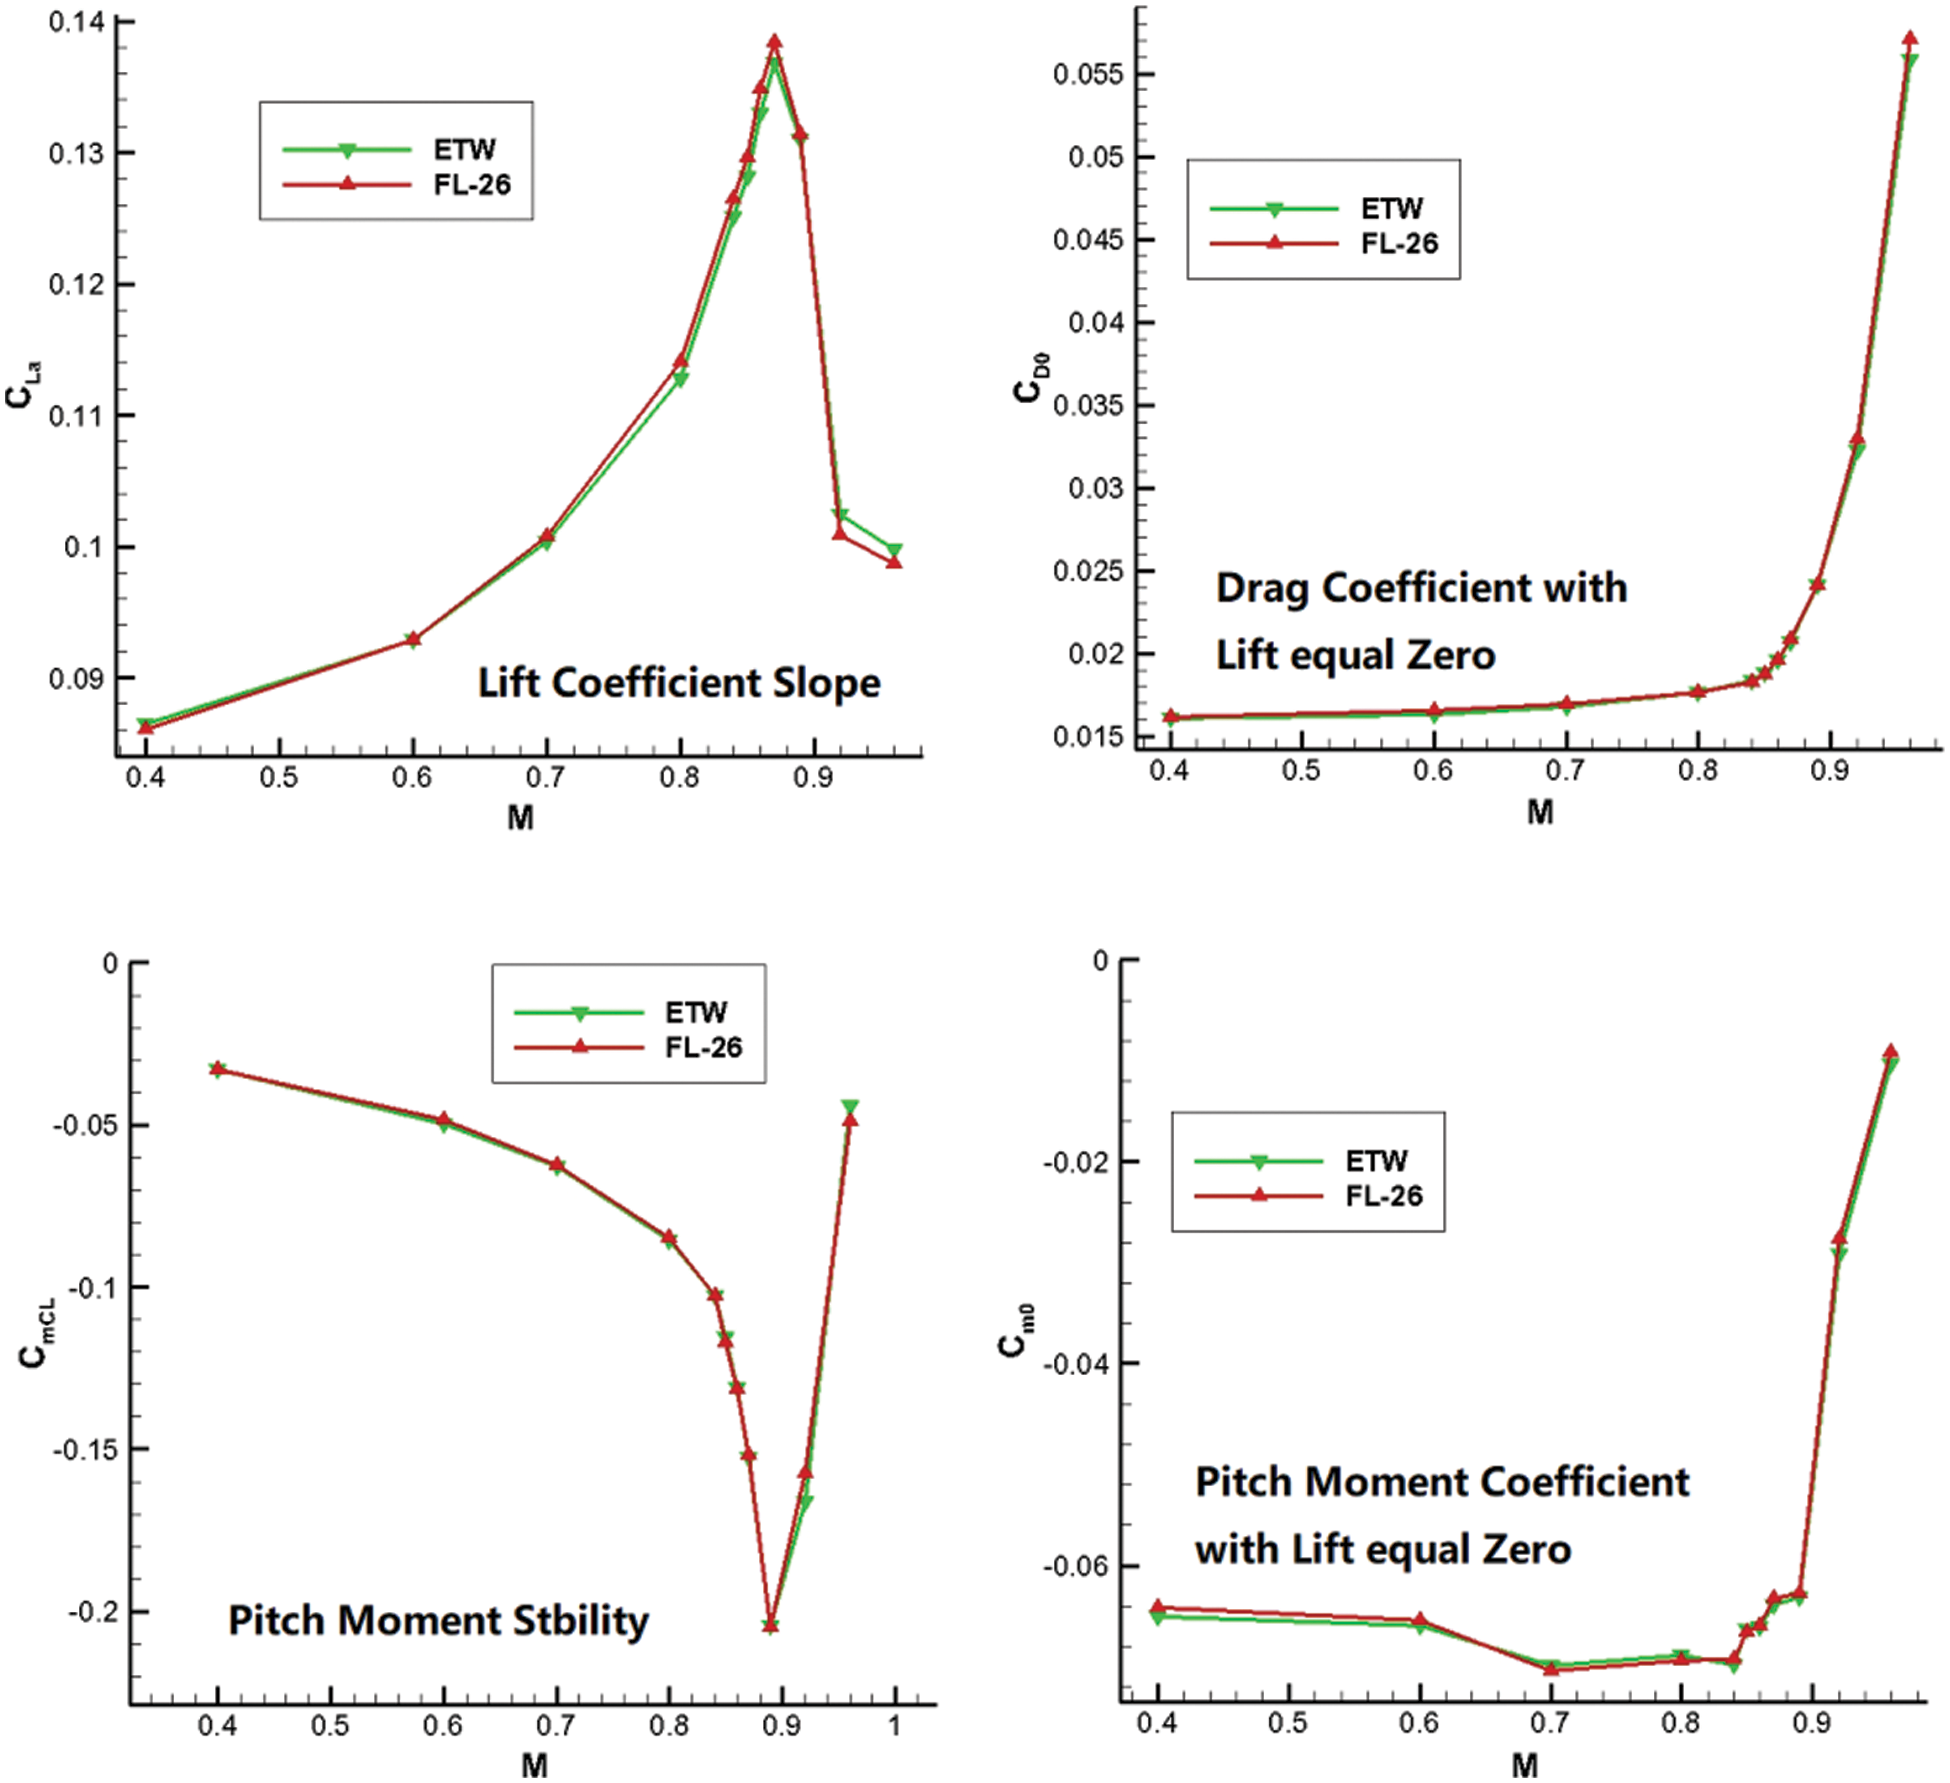
Figure 22: Comparison of typical dynamic derivative of test results for wide-body model in FL-26 and ETW
The results show that the improved refined aerodynamic test technology in this paper has an obvious effect on the repeatability accuracy of wide-bodied aircraft test data. The repeatability accuracy of the resistance coefficient is less than 0.0001, the bending resolution of model deformation measurement is less than 0.2 mm, and the torsion deformation is less than 0.04°. Meanwhile, it is founded that the refined management and operation specifications explored in the comparison test of the wide-bodied aircraft standard model are effective measures to further improve the repeatability accuracy of the test. Thus, the repeatability accuracy of the drag coefficient exceeds 0.00005, reaching the international advanced level. In view of the characteristics of FL-26 wind tunnel, the correction system of large aircraft test data is complete and reliable, and the revised aerodynamic test results have a good correlation with ETW.
Funding Statement: The authors received no specific funding for this study.
Conflicts of Interest: The authors declare that they have no conflicts of interest to report regarding the present study.
References
1. Chen, D., Lin, J., Guo, D. (2003). Technical ways to solve high speed key aerodynamic problems of large air transporters. Experiments and Measurements in Fluid Mechanics, 18(2), 1–5. [Google Scholar]
2. Chen, D., Liu, D., Xu, X. (2014). Investigation on factors influencing high speed wind tunnel data for large airplane. 8th National Fluid Dynamics Conference, Lanzhou, China. [Google Scholar]
3. Gregory, M. G., Melissa, B. R., Scott, L. G. (2008). Experimental investigation of the DLR-f6 transport configuration in the national transonic facility. 26th AIAA Applied Aerodynamics Conference, Honolulu, Hawaii, USA. https://doi.org/10.2514/6.2008-6917 [Google Scholar] [CrossRef]
4. Melissa, B. R., Craig, A. H., Gregory, M. G. (2009). Support system effects on the DLR-f6 transport configuration in the national transonic facility. 27th AIAA Applied Aerodynamics Conference, San Antonio, Texas, USA. https://doi.org/10.2514/6.2009-4115 [Google Scholar] [CrossRef]
5. Ralf, R., Martin, S., Jean, L. G. (2009). Experimental investigation of the wing-body juncture flow on the DLR-f6 configuration in the ONERA S2MA facility. 27th AIAA Applied Aerodynamics Conference, San Antonio, Texas, USA. https://doi.org/10.2514/6.2009-4113 [Google Scholar] [CrossRef]
6. Alpheus, W. B., William, K. G., Edward, A. M. (2008). Wing deformation measurements of the DLR-f6 transport configuration in the national transonic facility. 26th AIAA Applied Aerodynamics Conference, Honolulu, Hawaii, USA. https://doi.org/10.2514/6.2008-6921 [Google Scholar] [CrossRef]
7. Thorsten, L., Philipp, P. G., Jean, L. G. (2013). Going for experimental and numerical unsteady wake analyses combined with wall interference assessment by using the NASA CRM model in ETW. 51st AIAA Aerospace Sciences Meeting including the New Horizons Forum and Aerospace Exposition. https://doi.org/10.2514/6.2013-871 [Google Scholar] [CrossRef]
8. Wang, Y., Wang, G., Zhang, Y. (2008). Drag of DLR-f6 wing-body configuration. Chinese Journal of Computational Physics, 25(2). [Google Scholar]
9. Antony, J. S., John, C. V., Neal, A. H. (2007). Drag prediction for the DLR-f6 wing body and DPW wing using CFL3D and OVERFLOW on an overset mesh. 45th AIAA Aerospace Sciences Meeting and Exhibit. https://doi.org/10.2514/6.2007-257 [Google Scholar] [CrossRef]
10. Chen, D., Wang, W., Wang, J., Zhou, L. (2004). Investigation on flow-field debugging for 2.4 m transonic wind tunnel. Acta Aerodynamica Sinica, 22(3), 279–282. [Google Scholar]
11. Masataka, K., Makoto, U., Seigo, K., Norikazu, S. (2013). Wall and support interference corrections of NASA common research model wind tunnel test in JAXA. 51st AIAA Aerospace Sciences Meeting Including the New Horizons Forum and Aerospace Exposition, Texas. https://doi.org/10.2514/6.2013-963 [Google Scholar] [CrossRef]
12. Yu, Y., Zhou, Z., Mou, B. (2018). Aerodynamic design of a standard model CHNT-1 of wind tunnel test and applied CFD reliability verification. Acta Aerodynamica Sinica, 36(3), 505–513. https://doi.org/10.7638/kqdlxxb-2018.0072 [Google Scholar] [CrossRef]
13. Liu, D., Chen, D., Li, Q. (2015). Investigation on the correlation of CFD and EFD results for a supercritical wing. International Journal of Heat and Technology, 19–26. https://doi.org/10.18280/ijht.330303 [Google Scholar] [CrossRef]
14. Liu, D., Xu, X., Wei, Z., Chen, D. (2014). Engineering extrapolation to flight reynolds number for supercritical airfoil pressure distribution based on CFD results. Applied Mechanics and Materials, 444–445. https://doi.org/10.4028/www.scientific.net/AMM.444-445.517 [Google Scholar] [CrossRef]
15. Fan, J., Chen, D., Peng, Y. (2007). Research on force test technique of UAV model with large aspect ratio in high speed wind tunnel. Journal of Experiments in Fluid Mechanics, (3), 62–65. https://doi.org/10.3969/j.issn.1672-9897.2007.03.013 [Google Scholar] [CrossRef]
16. Chen, D., Yin, L., Wu, W. (2009). The test technique for aircraft with high aspect ratio in the 2.4 meter transonic wind tunnel. Acta Aerodynamica Sinica, (5), 542–546. https://doi.org/10.3969/j.issn.0258-1825.2009.05.007 [Google Scholar] [CrossRef]
17. Wang, R., Wu, J., Guo, Q. (2012). Research on the affecting factors of test quality and improvement methods in 2.4 m transonic wind tunnel. Journal of Experiments in Fluid Mechanics, (1), 37–41. https://doi.org/10.3969/j.issn.1672-9897.2012.01.008 [Google Scholar] [CrossRef]
18. Wang, F. (2003). High speed wind tunnel test. Beijing, China: National Defense Industry Press. [Google Scholar]
19. Huang Y., L., Zhao K, X. (2002). On the correlation of force test results of a tactical missile calibration model in five different wind tunnels. Experiments and Measurements in Fluid Mechanics, (2), 16–20. https://doi.org/10.3969/j.issn.1672-9897.2002.02.003 [Google Scholar] [CrossRef]
20. Cheng, H. (2003). Interference and correction on wind tunnel testing. Beijing, China: National Defense Industry Press. [Google Scholar]
21. Zhan, P., Luo, Y. (2011). Primary research on the standard system of air vehicle calibration models used in wind tunnel test. Standard Science. [Google Scholar]
Cite This Article
 Copyright © 2023 The Author(s). Published by Tech Science Press.
This work is licensed under a Creative Commons Attribution 4.0 International License , which permits unrestricted use, distribution, and reproduction in any medium, provided the original work is properly cited.
 Downloads
 Citation Tools