
 Submit a Paper
 Propose a Special lssue
 Open Access
ARTICLE

Numerical Study on Reduction in Aerodynamic Drag and Noise of High-Speed Pantograph
1 State Key Laboratory of Rail Transit Vehicle System, Southwest Jiaotong University, Chengdu, 610031, China
2 School of Electrical Engineering, Southwest Jiaotong University, Chengdu, 610031, China
* Corresponding Author: Tian Li. Email:
(This article belongs to the Special Issue: Computer Modeling in Vehicle Aerodynamics)
Computer Modeling in Engineering & Sciences 2024, 139(2), 2155-2173. https://doi.org/10.32604/cmes.2023.044460
Received 31 July 2023; Accepted 31 October 2023; Issue published 29 January 2024
 View Full Text
 Download PDF
Abstract
Reducing the aerodynamic drag and noise levels of high-speed pantographs is important for promoting environmentally friendly, energy efficient and rapid advances in train technology. Using computational fluid dynamics theory and the K-FWH acoustic equation, a numerical simulation is conducted to investigate the aerodynamic characteristics of high-speed pantographs. A component optimization method is proposed as a possible solution to the problem of aerodynamic drag and noise in high-speed pantographs. The results of the study indicate that the panhead, base and insulator are the main contributors to aerodynamic drag and noise in high-speed pantographs. Therefore, a gradual optimization process is implemented to improve the most significant components that cause aerodynamic drag and noise. By optimizing the cross-sectional shape of the strips and insulators, the drag and noise caused by airflow separation and vortex shedding can be reduced. The aerodynamic drag of insulator with circular cross section and strips with rectangular cross section is the largest. Ellipsifying insulators and optimizing the chamfer angle and height of the windward surface of the strips can improve the aerodynamic performance of the pantograph. In addition, the streamlined fairing attached to the base can eliminate the complex flow and shield the radiated noise. In contrast to the original pantograph design, the improved pantograph shows a 21.1% reduction in aerodynamic drag and a 1.65 dBA reduction in aerodynamic noise.Keywords
High-speed trains have become the dominant mode of transport. They offer excellent efficiency, safety, comfort and environmental protection. With the continuous progress of theoretical exploration and gradual refinement of technology, China is working on the design and research of high-speed trains that can reach 400 km/h. However, there are still outstanding aerodynamic problems in the train’s acceleration phase. In addition, when the train passes through the tunnel and runs under crosswind, it requires higher performance [1,2]. The aerodynamic drag and noise generated by high-speed trains running in different environments affect energy consumption and environmental pollution. Aerodynamic optimization is one of the effective measures for energy saving and environmental protection of high-speed trains [3,4]. The pantograph, a device mainly composed of rods for obtaining electrical energy, is installed on the top of the train, which is one of the major sources of aerodynamic drag and noise of high-speed trains [5–7]. Due to the requirements of environmental assessment, aerodynamic noise exceeding the prescribed standards will limit railway operations. Therefore, we need to study the source characteristics and noise reduction methods of high-speed train pantograph noise in more detail in order to reduce its impact on the surrounding environment and promote the further development of high-speed trains.
Up to now, aerodynamic research on pantographs has mainly focused on the source, formation and control methods of aerodynamic drag and noise. Research on reducing the aerodynamic drag of the pantograph has been conducted continuously. The pantograph is mainly composed of bars. These complex structures are going to form a large number of unstable flow fields under the influence of the high-speed air flow. The complex vortex formation produced by the pantograph wake, combined with the effects of high-speed airflow, contributes significantly to the generation of aerodynamic drag [8]. In general, optimizing the structure of the pantograph itself or the surrounding ancillary equipment is a way to reduce the drag of the pantograph system. The pantograph structure mainly includes the top panhead area, the middle frame system area and the bottom base area. By streamlining the panhead structure to reduce the flow separation, the aerodynamic drag and noise can be effectively reduced [9]. In addition, by reducing the distance between the strips, the aerodynamic drag and noise of the double-strip pantograph can be reduced [10,11]. In the frame system area, Lee et al. [12] compared three pantograph structures: single-armed, double-armed and periscope-armed pantographs and pointed out that the aerodynamic performance of single-armed pantographs was better. The optimization of the base area can reduce drag by increasing the fairing to block the impact of airflow on the base and insulator [13,14]. In China, high-speed trains are also equipped with various forms of diversion fairings, such as bathtub-type and baffle-type fairings. So far, the sinking of the pantograph installation platform has also become an important drag reduction method. Drag can be further reduced by avoiding the impact of the air flow at the bottom and reducing the air flow velocity around the pantograph [15,16].
As the high-speed train’s speed increases, the aerodynamic noise generated by the pantograph gradually increases. Reducing the aerodynamic resistance of the pantograph should not only be considered but also comprehensively discussed in order to effectively reduce the noise. Active and passive control strategies for the control of pantograph drag and noise have been the focus of many researchers. Active control methods include blowing and sucking, jetting, etc. However, this has not become a mainstream control method as it requires additional energy input to achieve flow field changes. Passive control methods are favored by many researchers, including optimizing the structural shape of the pantograph, changing materials, adding a deflector, or sinking the installation platform [17–20]. King et al. [21] studied the aeroacoustics performance of strips with different cross-section shapes, including: round, square, rectangular and elliptical. The results show that the noise of the strip with an elliptical cross section is the lowest. For circular strips, the noise can be significantly reduced by adding lateral ribs and knurled surfaces. Zhang et al. [22] investigated the effects of porous materials coated non-uniformly on the drag and noise of cylindrical rods. The results confirm that if the porous material with large pores is used at the separation position of the cylindrical flow, the pressure baseline in the wake region can be improved and the vortex shedding can be reduced, thus reducing the drag and noise of the cylindrical rod. Liu et al. [23] evaluated the effects of two different pantograph installation forms, namely the sinking platform and the fairing, on the aerodynamic performance of the pantograph. It is pointed out that the aerodynamic drag can be significantly reduced by using the pantograph fairing. However, the installation of the sinking platform can significantly reduce the sound pressure level of the pantograph.
The design of a 400 km/h high speed train has higher requirements for the aerodynamic and acoustic performance of the pantograph. It is worthy of attention to explore potential measures to further reduce the aerodynamic drag and noise of high-speed pantographs. The existing research methods ignore the quadrupole noise of the pantograph, resulting in insufficient optimization of some components. In addition, the pantograph system as a whole also needs systematic research to achieve further drag and noise reduction. The aerodynamic optimization research of pantograph still has limitations such as single component and insufficient consideration of aerodynamic noise sources, which hinders the further drag reduction and noise reduction of high-speed pantograph. Therefore, the contribution of the quadrupole sound source is considered in this paper, and the components of the pantograph are systematically optimized step by step. Finally, the differences in aerodynamic performance between the improved pantograph composed of optimized components and the original pantograph are compared. The results of this research can be used as a reference for the design and optimization of high-speed pantographs, with a focus on low resistance and low noise levels.
It is very important to select the appropriate turbulence model to simulate the turbulent environment near the pantograph of a high-speed train. Full consideration must be given to the details of the flow field, such as flow separation and vortex shedding. Numerical simulations must balance efficiency with accuracy. Obviously, relying only on the Reynolds-averaged Navier-Stokes (RANS) turbulence model will not provide highly accurate flow field results. Although the Large Eddy Simulation (LES) method is capable of simulating the pressure variation on the surface of the object to obtain ideal results, the calculation efficiency limits the wide application. Therefore, it is possible to obtain highly accurate flow field results while satisfying the computational efficiency by using a hybrid RANS/LES method, called Detached Eddy Simulation (DES). More details can be found in references [24,25].
In practical engineering applications, problems such as mismatching of logarithmic layers and separation by grids have been found with the standard DES method. As a result, a number of improved models have been the subject of research and development, and the Improved Delayed DES (IDDES) method is one of these. Among them, IDDES uses DDES and wall-modelled LES (WMLES) to effectively solve these problems. For the simulation of unstable and separated turbulent flows at high Reynolds numbers, this method has been widely used nowadays [26,27]. In this study, we selected the IDDES method on the basis of the SST k-ω model for the simulation of the accurate flow field.
Lighthill introduced the Lighthill equation for the study of jet noise by transforming the Navier-Stokes equation into a linear wave equation, which established the foundation of aeroacoustics [28]. Then, by introducing the generalized function method, Ffowcs-Williams et al. considered the effect of a solid moving boundary, studied the aerodynamic noise generated by moving objects in the fluid, and further established the FW-H equation [29]. FW-H classifies sound sources into three categories: monopoles due to mass flow, dipoles due to pressure variations and quadrupoles due to turbulent pressure. Di Francescantonio derived the FW-H equation from the K-FWH equation by incorporating the core concept of Kirchhoff’s method [30].
The quadrupole noise is usually much smaller than the dipole noise in the low Mach number flow (Ma < 0.3). The sound wave propagation will be dominated by the pressure variation on the surface of the body. However, for more accurate noise predictions, quadrupole noise must also be taken into account, considering that high-speed trains run at speeds above 400 km/h. By integrating the K-FWH equation of the solid or permeable surface, these dipole and quadrupole noise generated by the motion of the object can be obtained. Spalart et al. [31] compared the two calculation methods and found that the integration method using permeable surfaces is more accurate in predicting far-field noise. However, there is no uniform criterion for selecting the location and size of the permeable integral surface, which is usually determined by the specific computational case. In this study, we chose to use the permeable surface for far-field noise prediction. Section 4.2 of this paper describes the specific location, size and determination method of the permeable surface.
The aerodynamic noise prediction of high-speed pantograph is divided into three simulation processes. Firstly, the steady calculation is carried out to obtain the fully developed steady-state flow field, which also provides the initial field data for the subsequent unsteady flow field calculation. Then the IDDES model is applied to the simulation of unsteady flow field and acoustic calculation. Finally, the sound source is extracted and the K-FWH equation is used to solve the sound propagation. The convection term and momentum term in the governing equation are discretized by the second-order scheme. In addition, an implicit second-order scheme is implemented for the time discretization, with a time step of 5 × 10⁻⁵ s. For the unstable flow field, we performed 4000 iterations and a simulation time of 0.2 s. During the sound propagation calculation, the sampling frequency and time step of the flow field are matched, and then an additional 6000 iterations are performed to extract the sound source. The total duration of the simulation is 0.5 s.
The process of the aerodynamic optimization and the numerical simulation of the pantograph in this study is as follows:
Step 1. Firstly, the aerodynamic/noise numerical modelling of the original model of high-speed pantograph is established. It includes grid independence testing, method validation, determination of the permeable acoustic integral surface, etc.
Step 2. To obtain the aerodynamic and acoustic performance of the pantograph, the numerical simulation of the original pantograph model is carried out. The aerodynamic drag and noise contribution of each component of the pantograph are analyzed and discussed.
Step 3. Step by step, the main components of the high-speed pantograph are optimized in terms of aerodynamic drag and noise source. Different drag and noise reduction measures are applied according to the flow characteristics of different components.
Step 4. The optimized model of each component of the pantograph obtained by the step-by-step method is integrated to obtain an optimized pantograph model. Finally, the drag and noise reduction effects of the optimized models are evaluated in comparison with the original models.
The above process is outlined in Fig. 1.
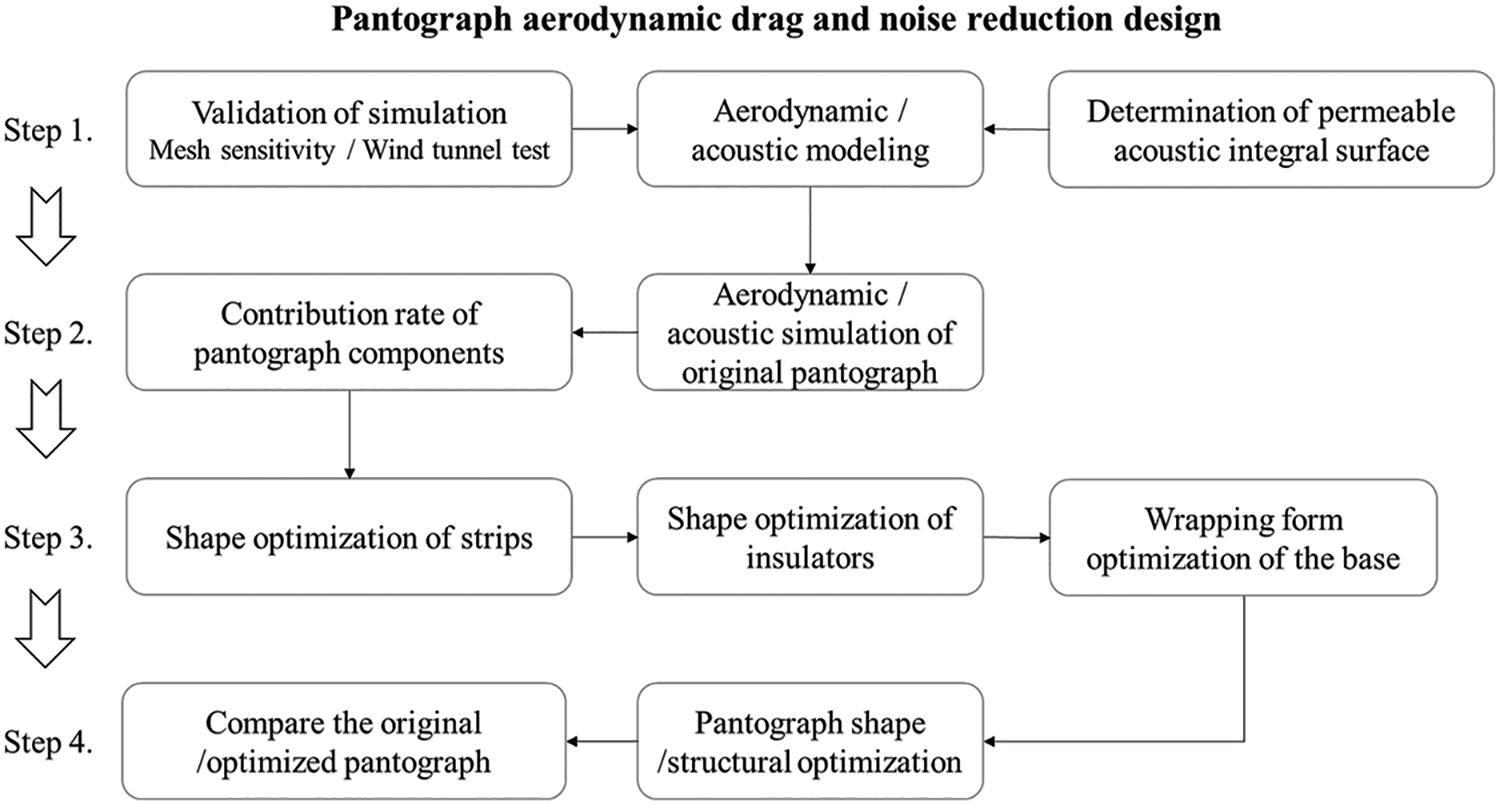
Figure 1: Optimization process
4 Numerical Simulation Information
The first step in the process of optimizing pantograph aerodynamic performance is to establish a reliable numerical computational model. The following is the establishment of the numerical calculation domain, grid independence test, the selection of acoustic integral surface and the validation of numerical method.
Fig. 2 shows a simplified model of a high-speed pantograph used for simulation. The size of the model is L = 2.45 m, W = 1.95 m, H = 1.65 m. The size of the numerical calculation domain of the pantograph is 40 L × 16 W × 8 H, as shown in Fig. 3. In practice, the pantograph is on top of the train, but to reduce the calculation period, the train body is simplified to a rectangular platform. In addition, the use of an isolated pantograph model facilitates the analysis of the aerodynamic performance of the pantograph components. The distance from the upstream boundary to the train and the distance from the downstream boundary to the train are 10 L and 29 L, respectively. For the computational domain, a slip wall with an opposing train speed is utilized at the bottom. The top and both sides of the boundary are assumed to be symmetrical, while the surface of the pantograph and car body are regarded as non-slip walls. The inlet and outlet of the computational domain are the far-field boundary and pressure outlet boundary, respectively, with an inlet Mach number of 0.326.
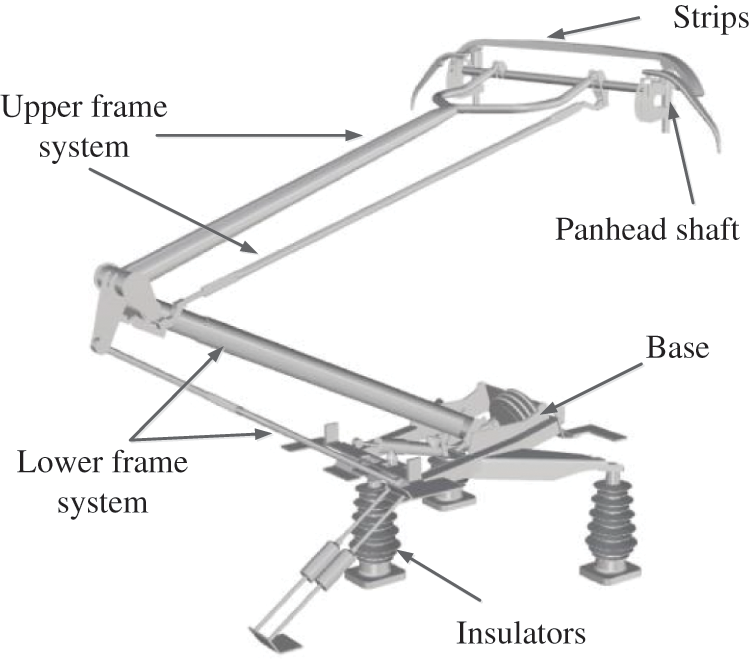
Figure 2: Geometric model
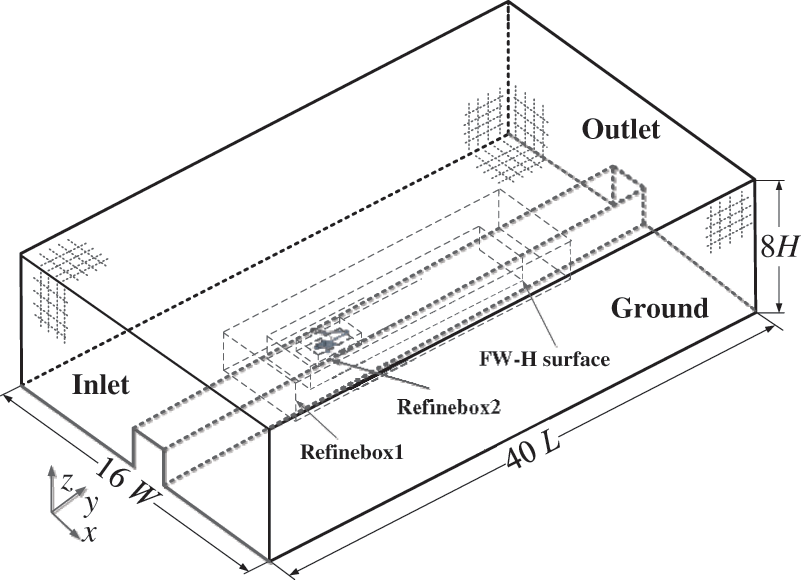
Figure 3: Computational domain
Three different grid scales were used to investigate the grid independence of the numerical analysis. In practice, determining the appropriate characteristic area of the pantograph is a challenge. To calculate the aerodynamic drag coefficient (Cd) of the pantograph, the cross-sectional area of the train (A = 10 m2) is usually used as a reference area. For aerodynamic radiated noise, the maximum sound pressure level (MSPL) generated by the pantograph is usually evaluated, measured at a height of 2.5 meters above the ground and 25 meters from the center line of the track. The results presented in Table 1 show the predicted values of the pantograph drag coefficient and far field noise using three different grid scales. Results for all three grids are comparable, but there is relatively little difference between drag and noise for fine and medium grids. Based on a balance between accuracy and efficiency, it is appropriate to use a medium grid scale to prove grid independence.
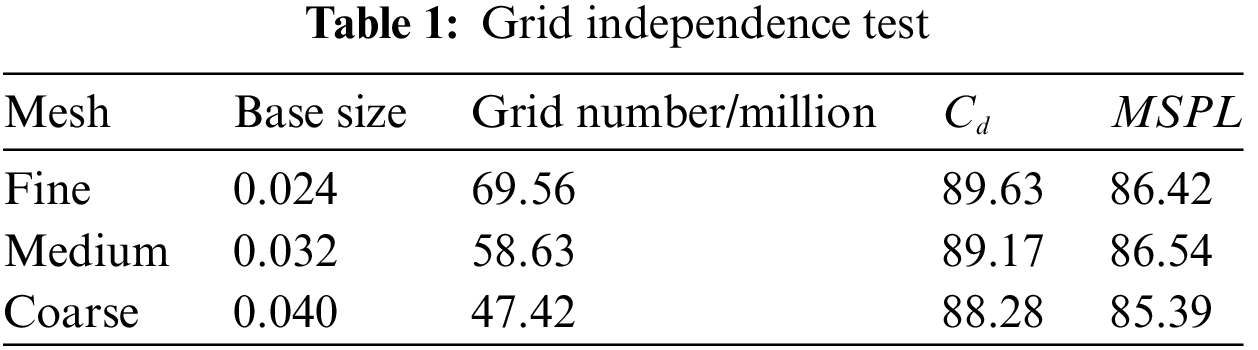
Fig. 4 shows the grid layout near the pantograph. To maintain a dimensionless value of y+ less than 1 for the wall distance, a boundary layer grid is created on the pantograph surface. This grid consists of 17 layers, with a normal growth rate of 1.2 and a height of the first grid of 0.004 mm. In addition, there is a refinement of the grid around the pantograph for quality improvement.
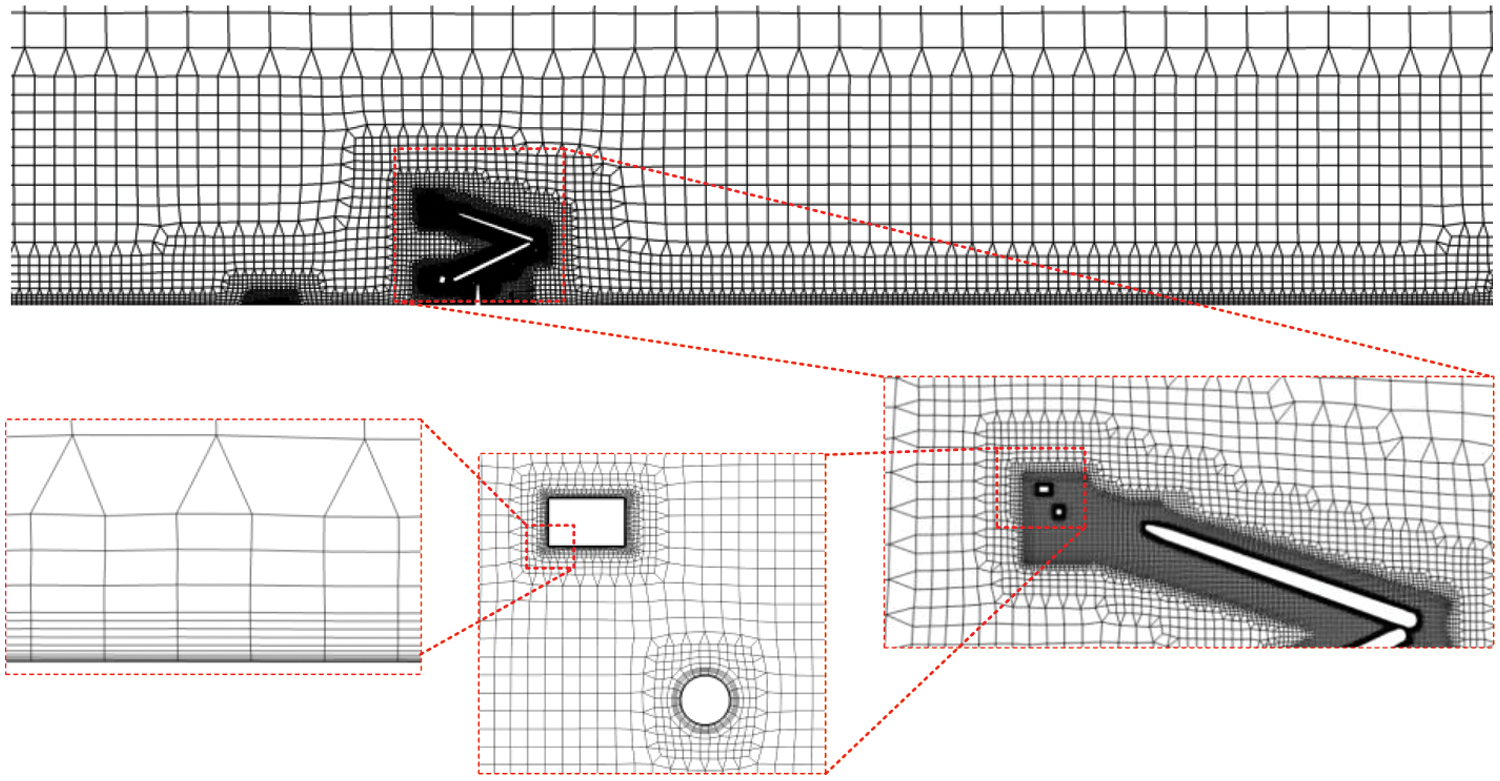
Figure 4: Computational grid
By constructing a permeable integral surface including the main flow sound source in the far-field noise prediction process, the prediction results can be obtained. Although the use of a larger integral surface can improve the accuracy of the prediction, it is necessary to construct a limited and appropriate acoustic integral surface in the actual application. In 1964, Powell introduced the concept of vorticity into the Lighthill equation and proposed the Powell vortex sound equation [32]. This equation confirms that vorticity is the main source of aerodynamic noise by correlating the change in vorticity motion with aerodynamic noise. Fig. 5 shows the vorticity development curve in the pantograph wake, and the extraction position is shown as red line in Fig. 6. It can be concluded that there is no significant noise source in this flow field, provided that the vorticity change is very small and essentially stable.
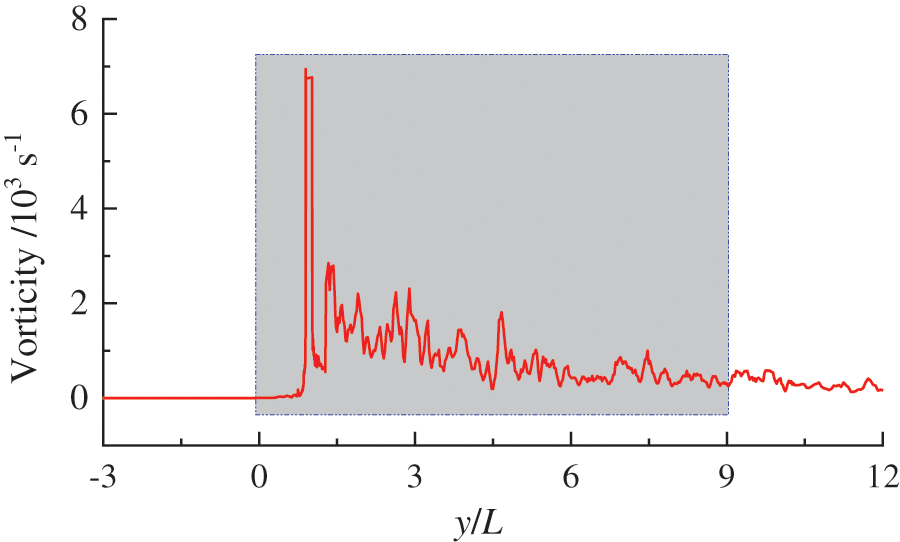
Figure 5: Vortex development curve in the pantograph wake
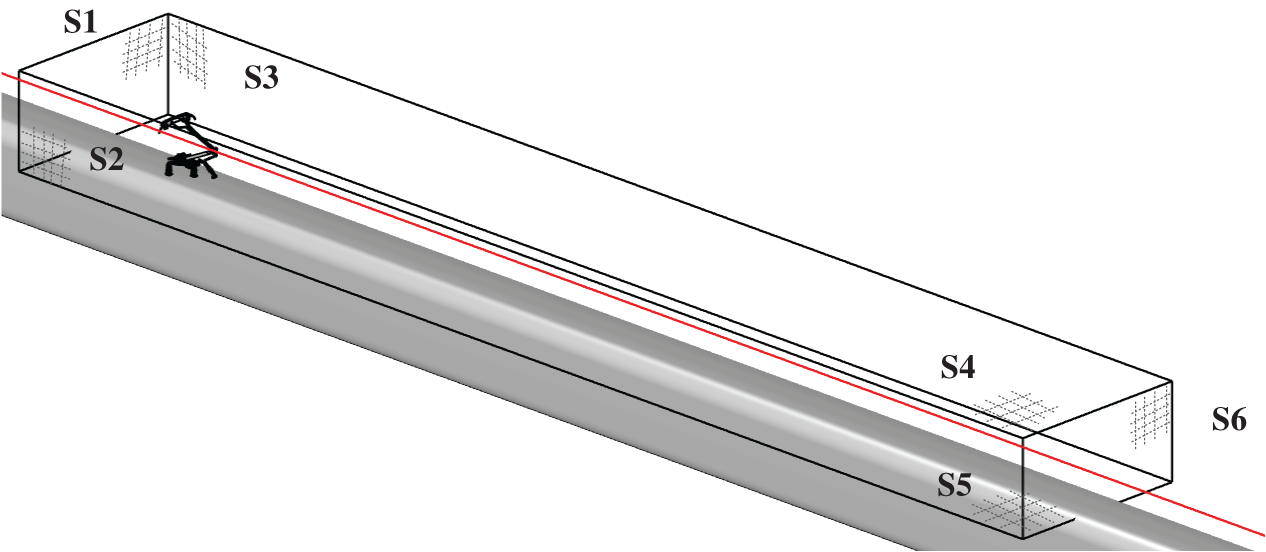
Figure 6: The permeable acoustic integral surface around the pantograph
The determination of the permeable acoustic integral surface around the pantograph is based on the development of the vorticity of the flow field. As shown in Fig. 6, the whole acoustic integral control surface consists of six surfaces, named S1~S6, respectively. The distance between the front and rear surfaces S1 and S6 from the pantograph is 0.8 L and 7.2 L, respectively. The distance between the two sides of S2 and S3 from the longitudinal center section of the pantograph is 0.75 W, and the height of the acoustic integral surface is 1.5 H. The size of the entire acoustic integral surface is 9 L × 1.5 W × 1.5 H. It should be noted that the vortex in the wake will produce a significant pseudo-acoustic effect when passing through the S6 surface. Therefore, only S1 to S5 are selected for the acoustic integral surface.
The validation of the calculation method in this paper needs to be investigated. Considering that the pantograph is mainly composed of rods, we choose a finite length cylinder with a diameter of d = 10 mm and a span length of 30d for aerodynamic noise modelling. The free flow velocity is U0 = 72 m/s. Based on open access experimental data, numerical simulation is performed, and more experimental information can be found [33,34]. Fig. 7 shows the computational domain and boundary conditions. We compare the predicted surface pressure coefficient (Cp) results of numerical simulation with experimental results, as shown in Fig. 8. It can be seen that for a benchmark problem, we and Yu et al. [33] obtained similar results for the same numerical simulation condition, and basically coincided with the experiment. The acoustic results of the far field sound pressure level spectrum at 185d from the cylinder varying with the Strouhal number are shown in Fig. 9. Similar to the results of Yu et al. [33] and Zhang et al. [34], three main frequency peaks of vortex shedding are obtained, which are in good agreement with the experimental results. The numerical simulation and experiment show that the peak difference of the noise spectrum near St = 0.197 is about 2 dB and there is a certain frequency shift. This can be attributed to spectral resolution effects. In conclusion, for the prediction of the aerodynamic and acoustic simulation of the flow around a cylinder, the numerical simulation method used in this paper is reliable.
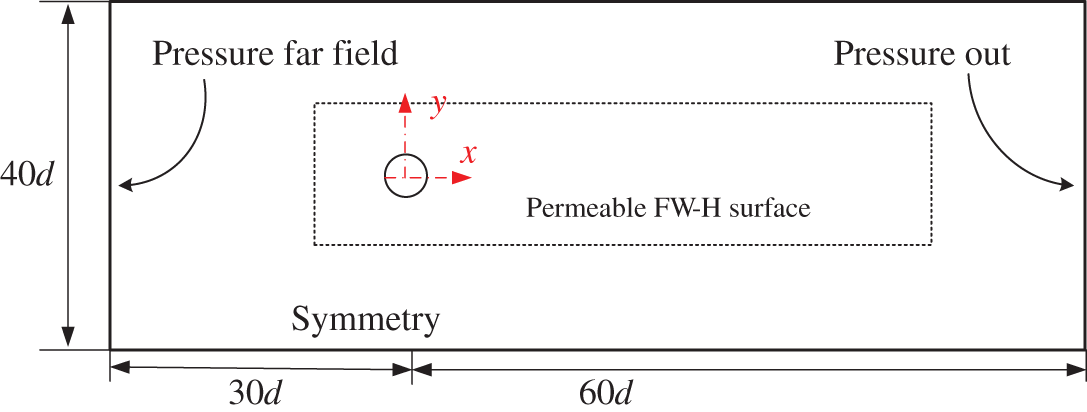
Figure 7: Computational domain of cylindrical aerodynamic noise modelling
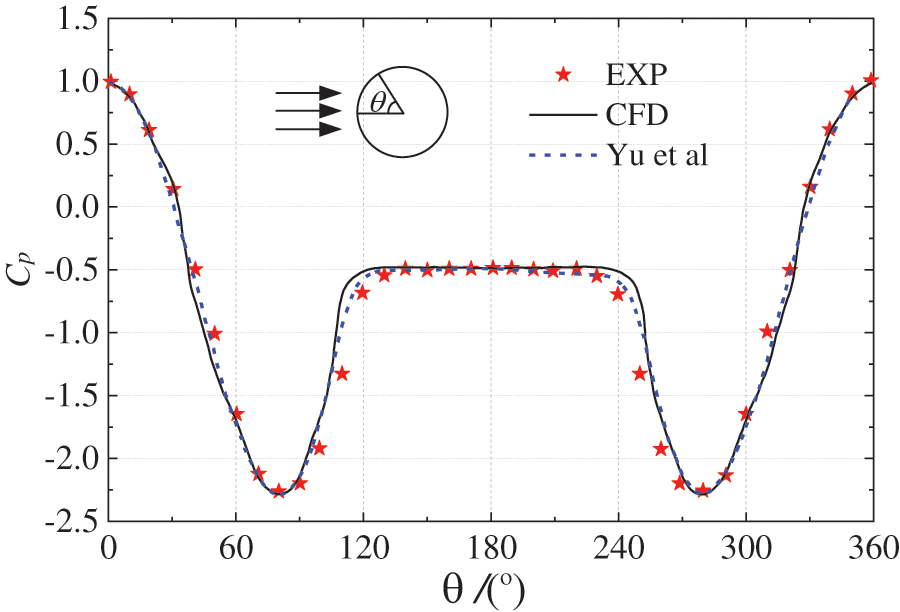
Figure 8: Comparison of surface pressure coefficient
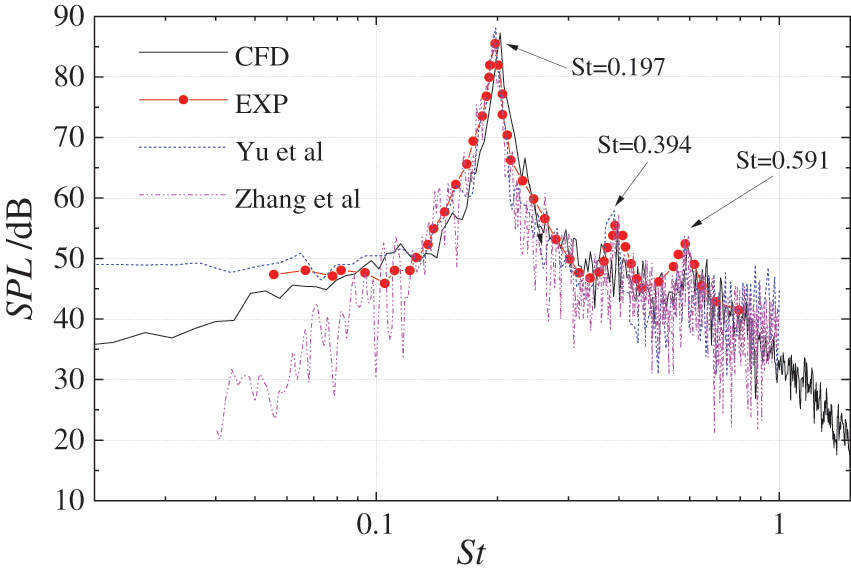
Figure 9: Comparison of far-field noise
The second to fourth steps in the process of optimizing the aerodynamic performance of the pantograph correspond to the following Sections 5.1–5.3. Firstly, the numerical simulation of the original pantograph is carried out and the contribution of each component of the pantograph to the total aerodynamic drag and noise is analyzed. Then, the main components of the pantograph drag and noise source are gradually optimized. Finally, the optimized pantograph is obtained by synthesizing all the optimization schemes of the pantograph components and compared with the aerodynamic performance of the original pantograph.
5.1 Aerodynamic and Acoustic Performance of the Original Model
Fig. 10 shows the distribution of the pressure and the noise on the surface of the pantograph. The pressure difference formed by the pressure on the windward and leeward sides of the base, insulator and panhead produces aerodynamic drag, which is the main source of pantograph aerodynamic drag. The strips, insulators, upper arm, lower arm and base are the main sources of aerodynamic noise from the pantograph. The maximum surface sound power level of these components can be up to 120 dB. The upper structure of the pantograph consists mainly of slender rods, resulting in a small windward surface but significant flow separation. The lower structure of the pantograph has a large windward surface and is susceptible to high-speed airflow, leading to the formation of a high positive pressure zone.
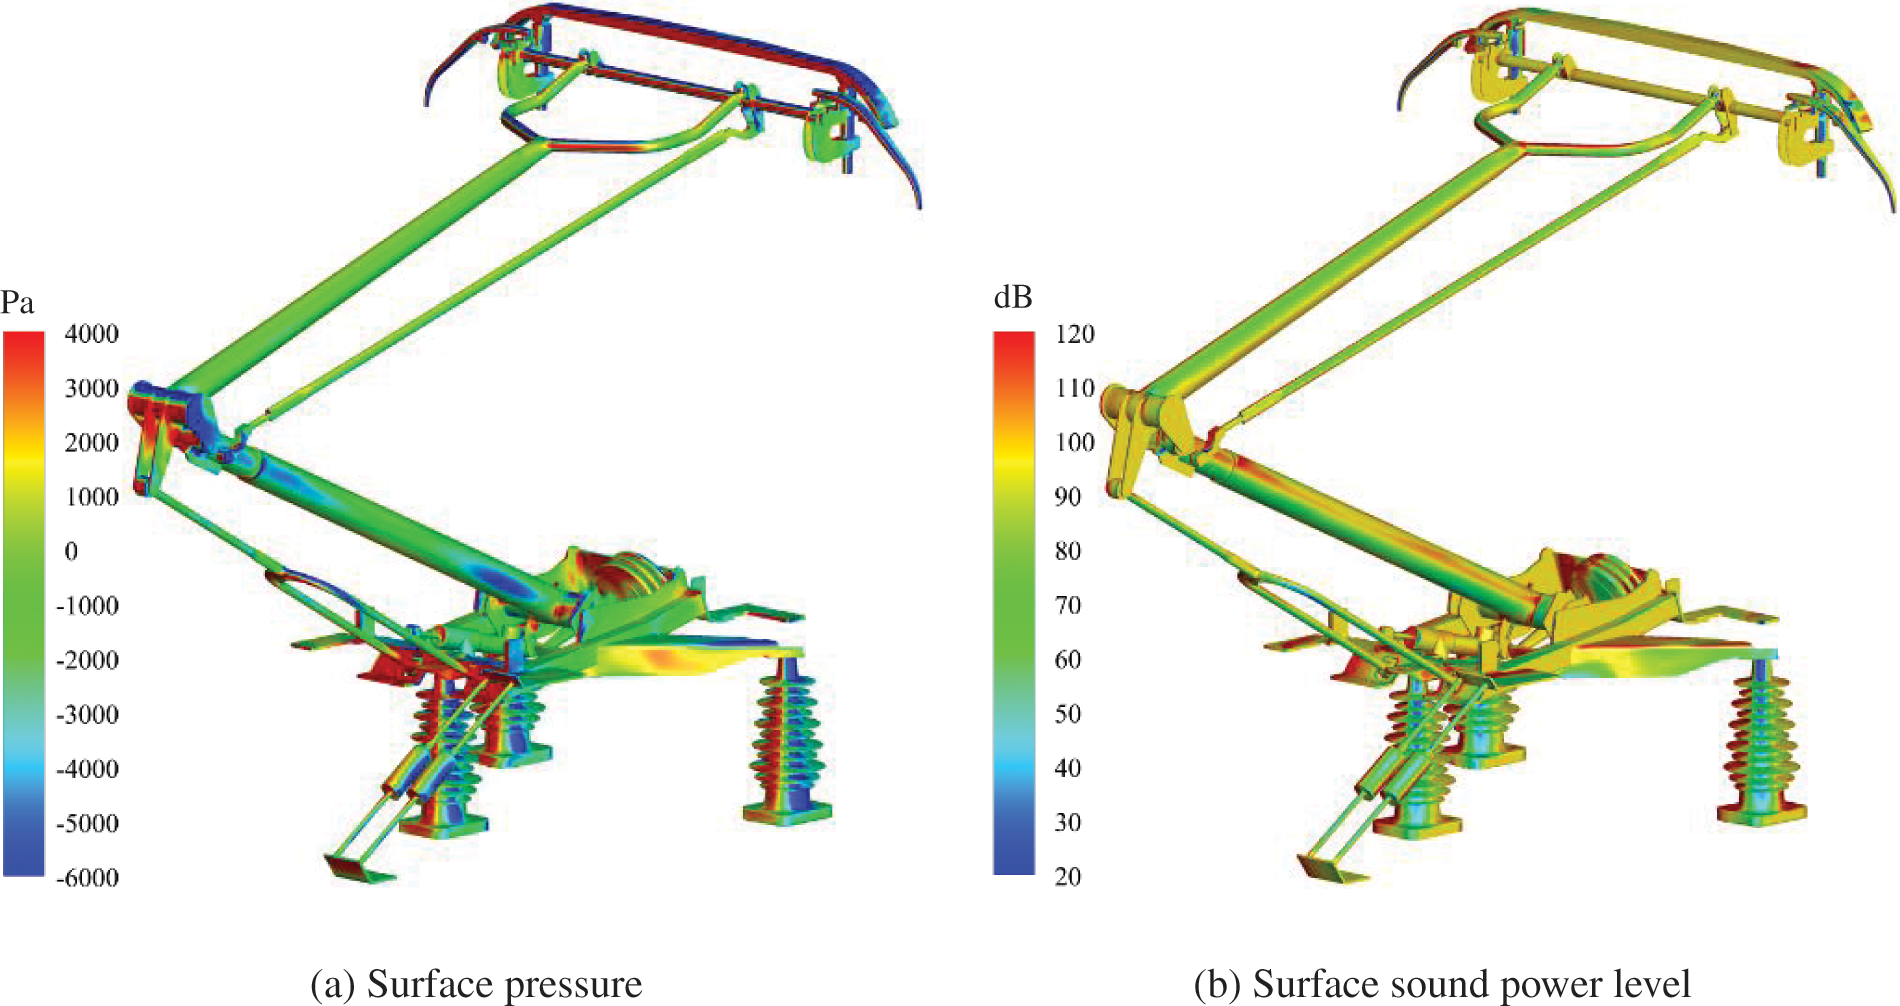
Figure 10: Pressure and noise distribution on the surface of high-speed pantograph
The pantograph is a complex geometry composed of rods. When the air flows over the surface of the rod, a complex flow separation phenomenon is created, resulting in the vortex being sheared off and broken off, causing an alternating oscillating force on the surface of the rod, and ultimately forming the aerodynamic noise source. Fig. 11 shows the contribution rate of each pantograph component to the total drag and noise. It can be seen that the order of contribution to the total aerodynamic drag is base, insulators, strips, panhead shaft, upper frame system and lower frame system. The panhead and the base are the most important aerodynamic noise sources, accounting for up to 50%. Followed by the upper frame system with 20.3%.
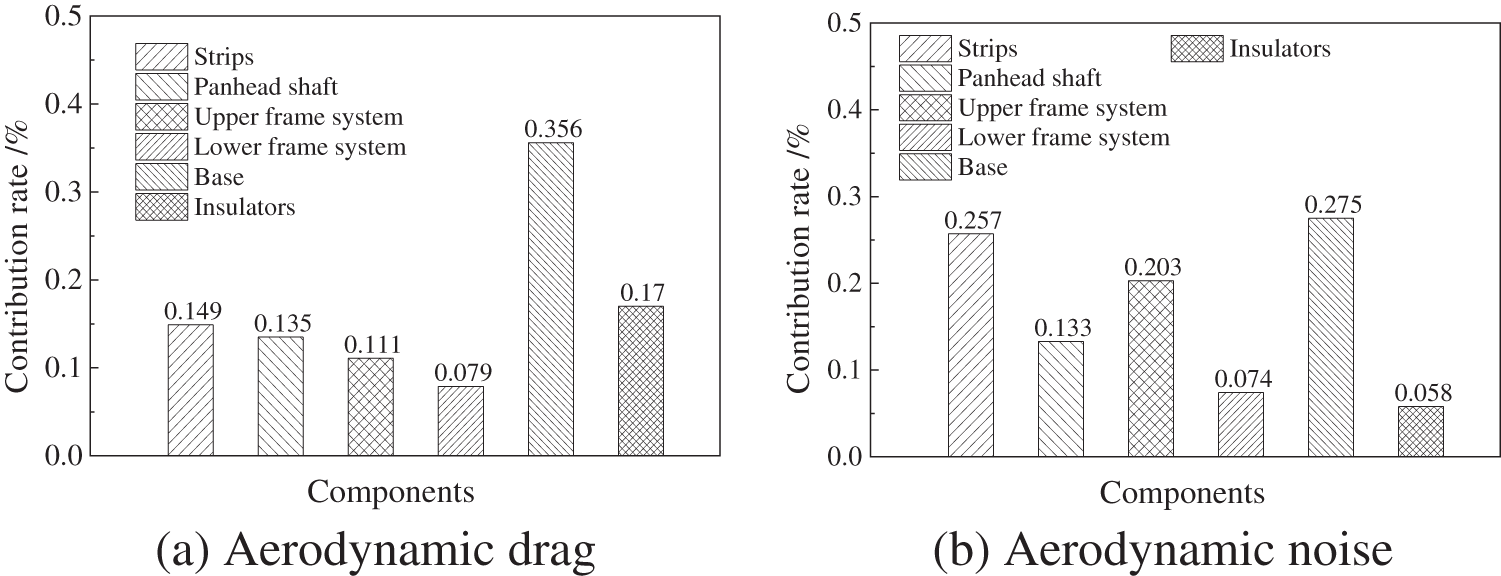
Figure 11: Contribution rate of pantograph components to total aerodynamic drag and noise
5.2 Structural Optimization of Pantograph Components
From the results of Section 5.1, the top three in the contribution rate of pantograph aerodynamic drag are strips, insulators and base, while the top two in the contribution rate of pantograph aerodynamic noise are strips and base. For the reduction of aerodynamic drag, we can optimize all components. In contrast, the reduction of noise we can only consider the main noise source components. Therefore, the optimization of these three components is carried out separately in the following.
Strips with rectangular cross-section and insulators with circular cross-section are prone to flow separation and vortex shedding, resulting in excessive drag and radiated noise. Therefore, the cross-section shapes of the strips and insulators are optimized, as shown in Fig. 12. By changing the chamfer angle (
Figure 12: Optimization of cross section
Fig. 13 shows the flow characteristics around the rectangular strip with different chamfer angles. When the chamfer angle is too small, the airflow will separate earlier, forming a large vortex on the upper and lower surfaces of the strip. When the chamfer angle is about 60°, the flow separation on the upper and lower surfaces of the strip disappears. Continue to increase the chamfer angle is beneficial to the drag reduction of the front part of the strip, but it will also lead to an increase in the scale of the shedding vortex in the wake. Therefore, the rectangular strip with a chamfer angle of 60° has better aerodynamic performance. Fig. 14 further shows the flow characteristics around the rectangular strip with different chamfer heights. At the same chamfer angle, as the chamfer height increases, the flow separation phenomenon on the upper and lower surfaces of the strip gradually weakens. When the chamfer height is about h/6~h/4, the flow separation basically disappears, and the scale of the vortex in the wake will increase when the chamfer height continues to increase.
Figure 13: Flow field characteristics around strips with different chamfer angles
Figure 14: Flow field characteristics around strips with different chamfer heights
The results of the aerodynamic drag calculation for the strips are shown in Fig. 15. The strips with rectangular cross section have the highest aerodynamic drag. As the chamfer angle increases, the aerodynamic drag of the strips gradually decreases. In contrast, the drag first decreases and then increases as the chamfer height increases.
Figure 15: Comparison of aerodynamic drag of strips with different cross sections
The effect of the scaling ratio on the aerodynamic drag and maximum surface sound power level of insulators is shown in Fig. 16. As the scaling ratio increases, the aerodynamic drag of the insulator decreases. When the scaling ratio is greater than 1.5, the aerodynamic drag changes slightly. Under the condition that the surface area of the insulator remains unchanged, the cross-sectional shape of the insulator in the longitudinal direction is increased by 1.5 times and the aerodynamic drag of the insulator is reduced by 55.3%. The maximum surface sound power level of the insulator decreases rapidly and then tends to be stable with the increase of the scaling ratio. For the optimized insulator model, the flow separation is weakened and the shedding vortex scale is reduced.
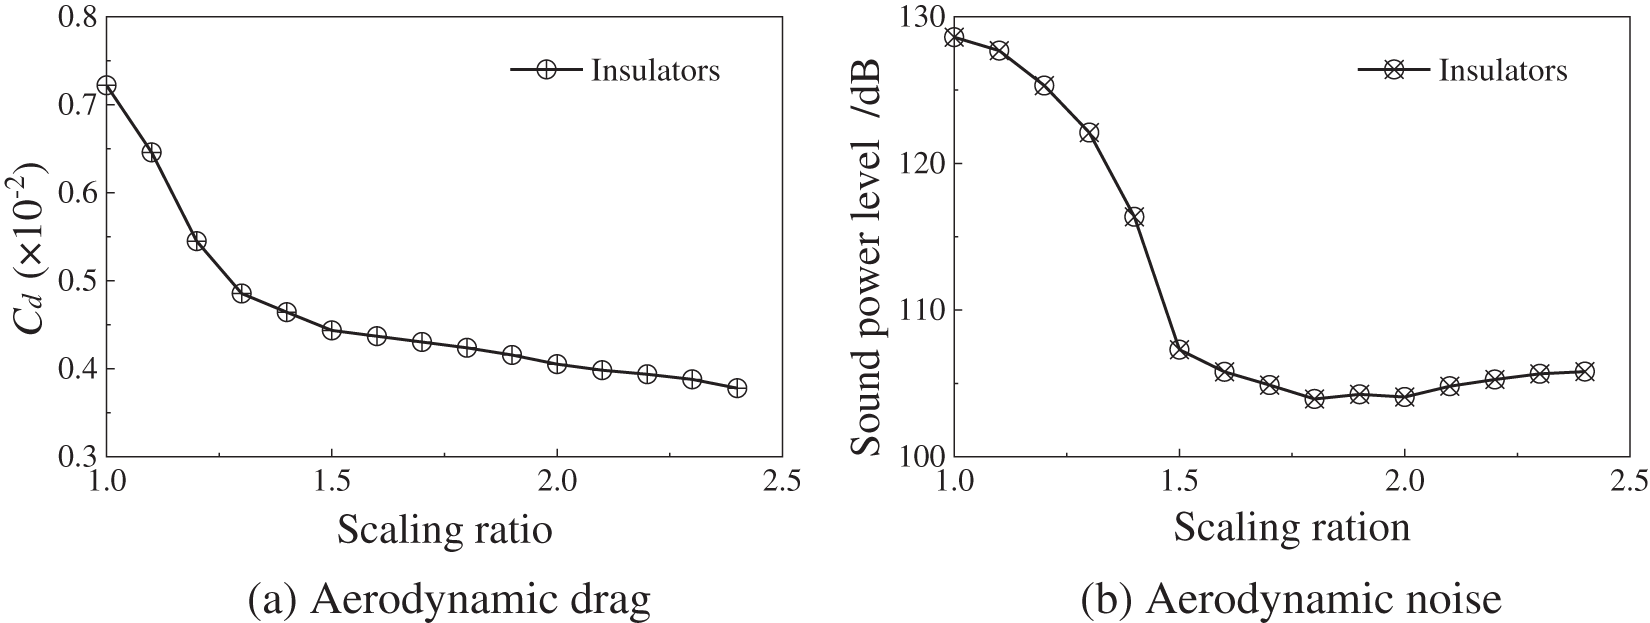
Figure 16: Comparison of aerodynamic drag and noise of insulators with different cross sections
The base is the main source of aerodynamic drag, accounting for more than 40% of the total aerodynamic drag. At the same time, the flow of airflow in the base area is very complex and generates large radiated noise. Considering the complexity of the base structure, it is difficult to implement optimization. Therefore, the detachable base fairing can be used to shield the complex phenomenon of the base area. The pantograph components are optimized step by step, and the optimized model is shown in Fig. 17.
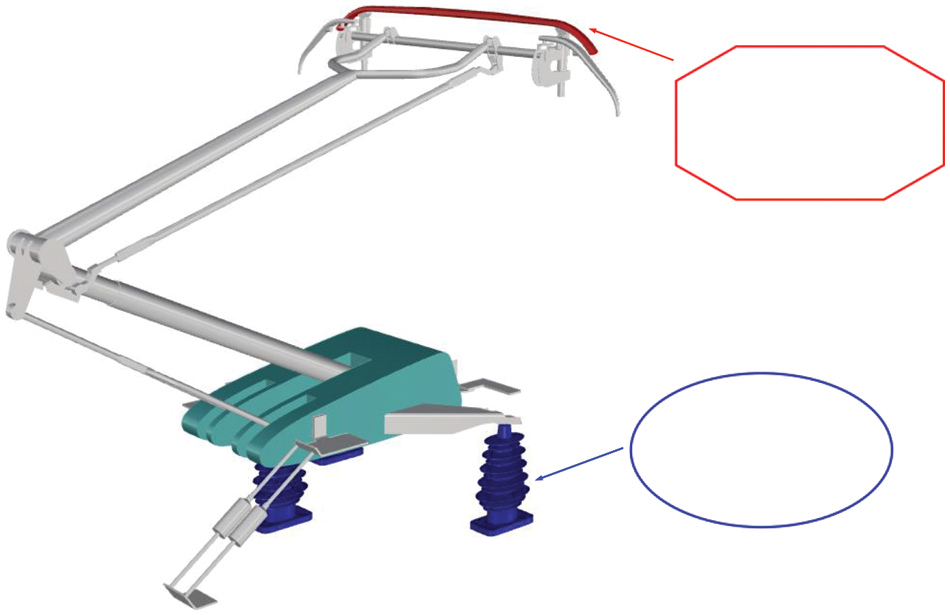
Figure 17: Optimized pantograph model
5.3 Aerodynamic Evaluation of Optimized Pantograph
Fig. 18 shows the pressure and streamline distribution around the original pantograph and the optimized pantograph. The optimized pantograph shows a significant reduction in the positive pressure amplitude on the windward surface of the base and insulator. The airflow through the strips, insulator and base fairing is smoother, resulting in lower drag and noise with no large-scale vortex and recirculation zone observable.
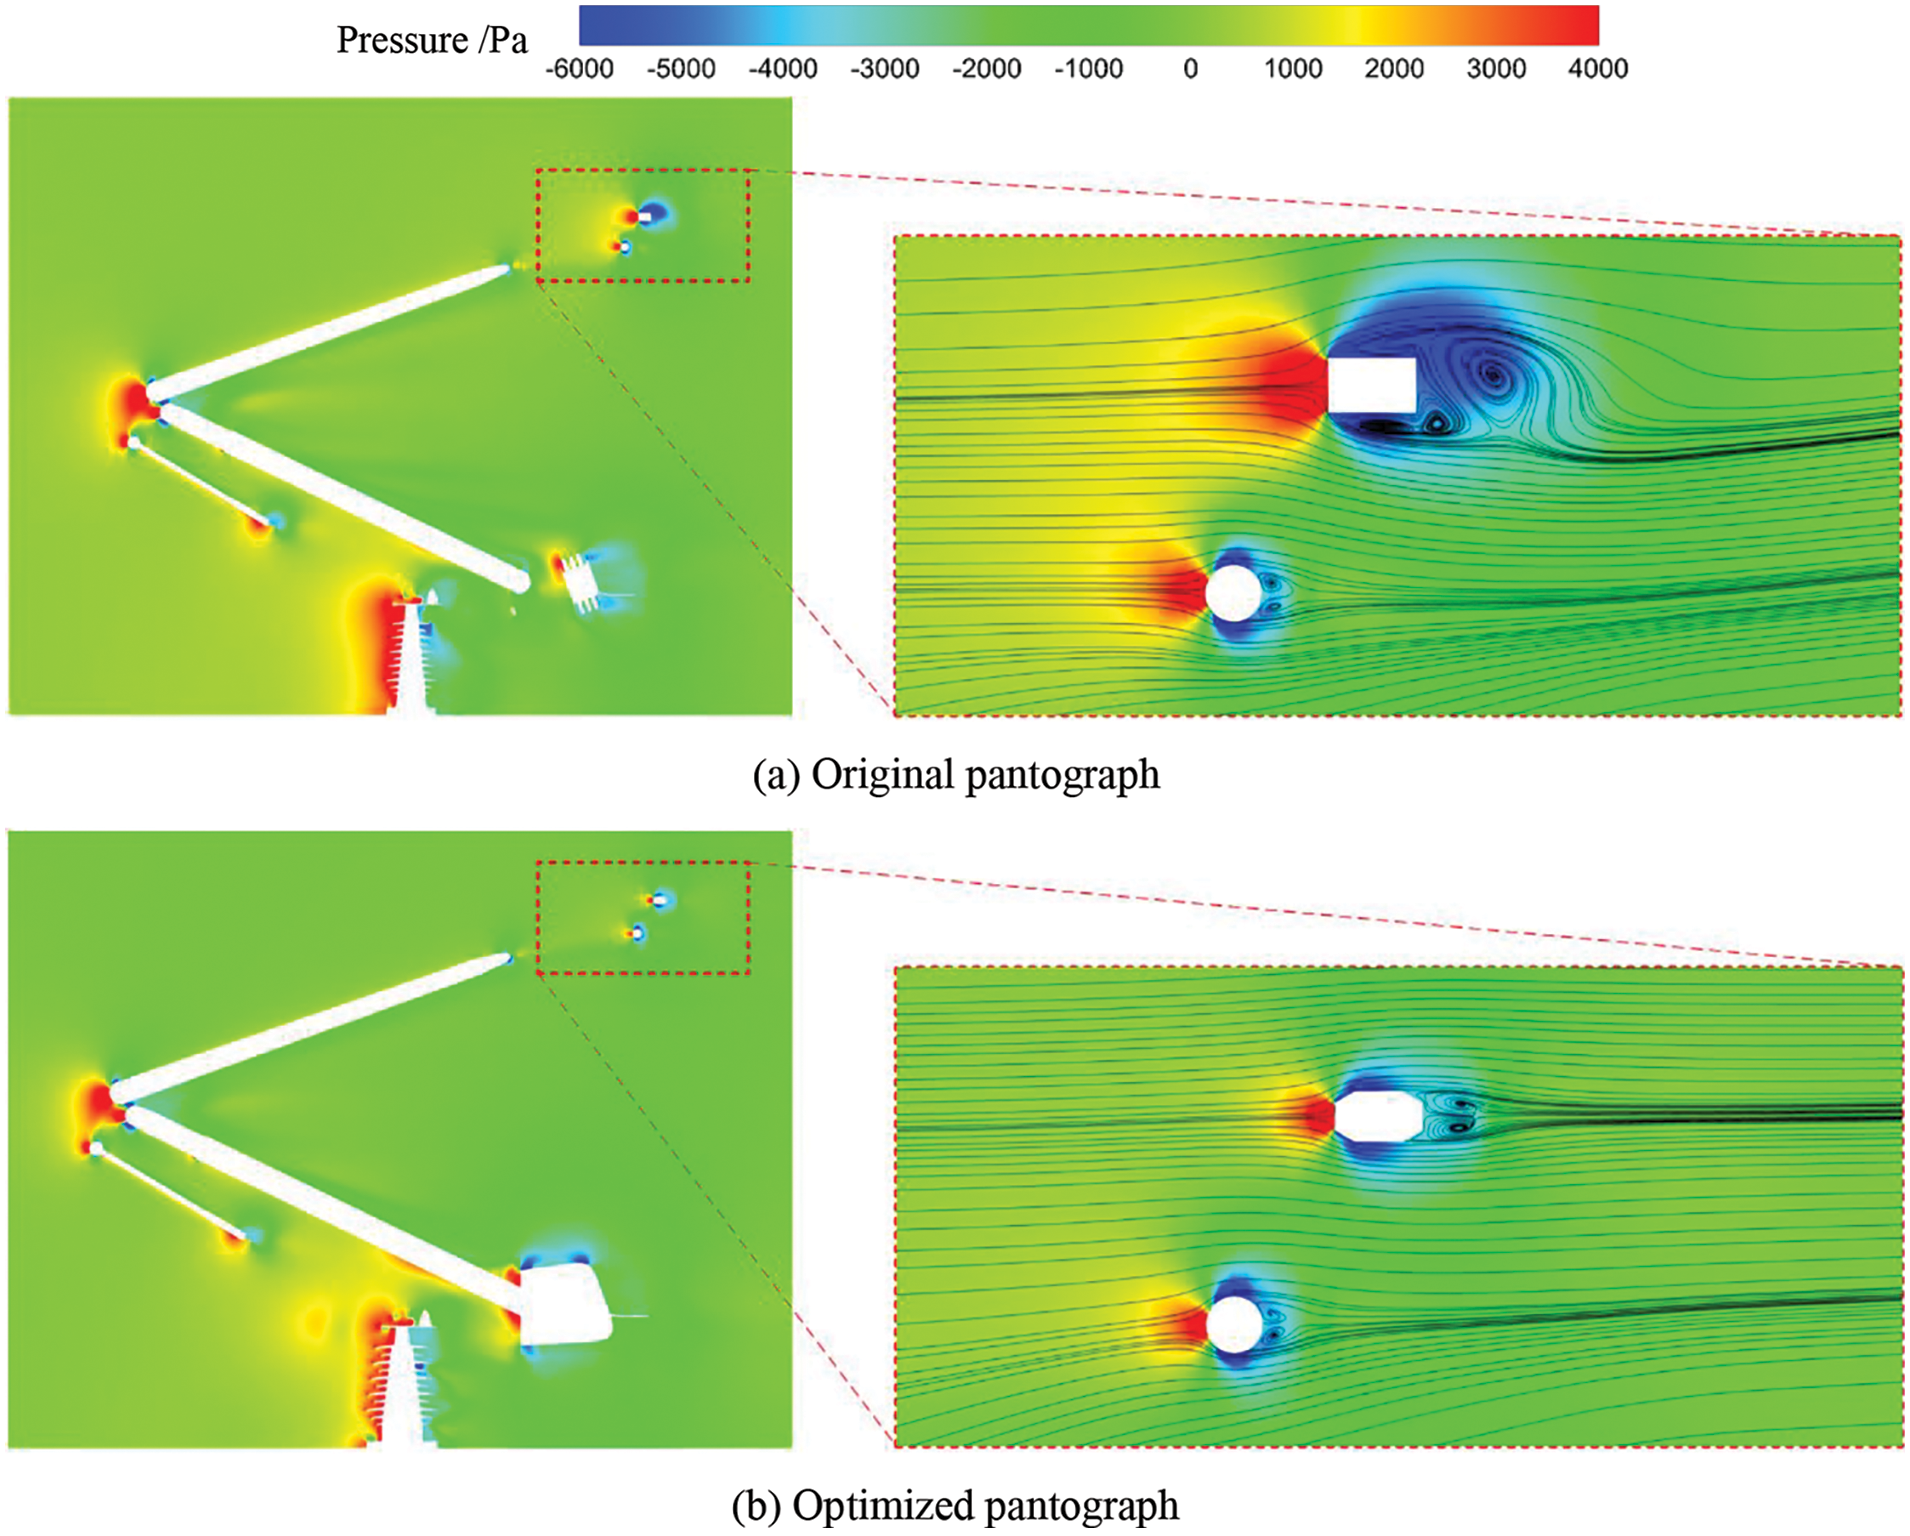
Figure 18: Pressure field distribution around the pantograph
Fig. 19 further shows the velocity field distribution around the pantograph. It can be seen that after the optimization of the strip, insulator and base, the low-speed area on the leeward side of the pantograph is reduced, and the negative pressure core area formed in the pantograph wake is reduced, which is beneficial to the reduction of the pressure difference resistance on the front and rear surfaces of the pantograph.
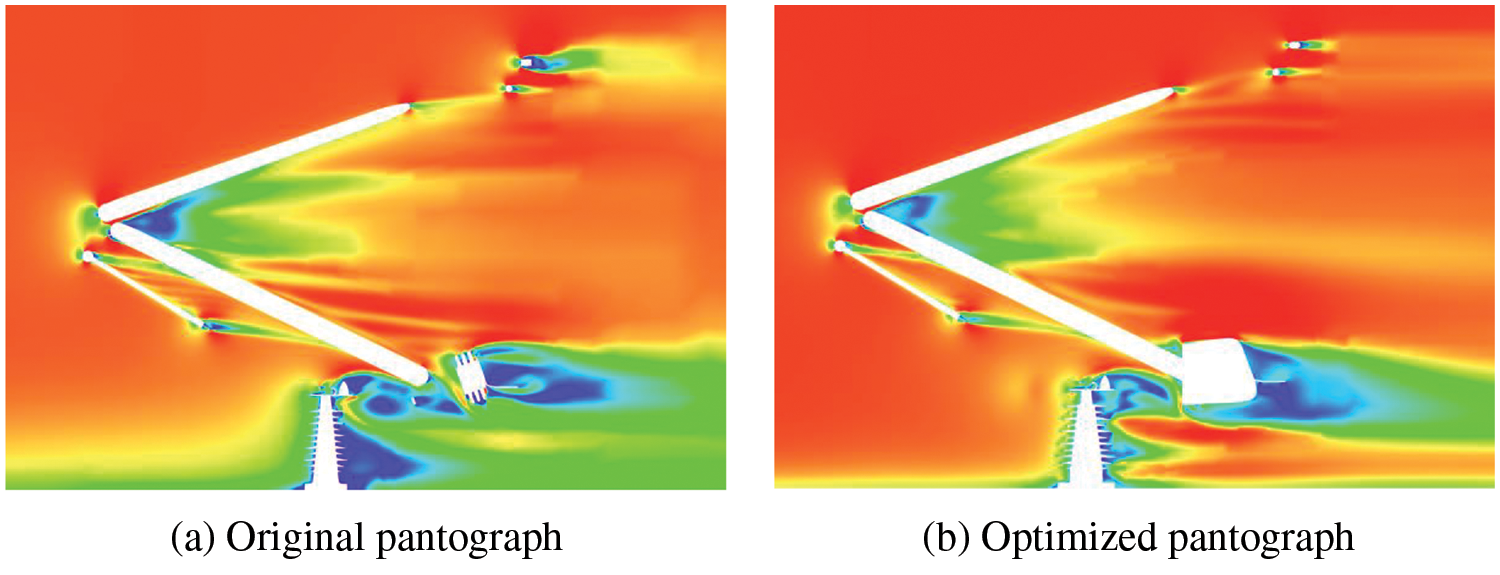
Figure 19: Velocity field distribution around the pantograph
Fig. 20 shows the turbulent kinetic energy (TKE) around the pantograph. This energy is associated with the strength of aerodynamic noise from the pantograph region and reflects the degree of unstable airflow around the pantograph. The original pantograph has higher turbulent kinetic energy near the strips, base and insulator. By introducing a base fairing and optimizing the cross-sectional design of the strips and insulators, the turbulent kinetic energy in the area surrounding the pantograph can be decreased.
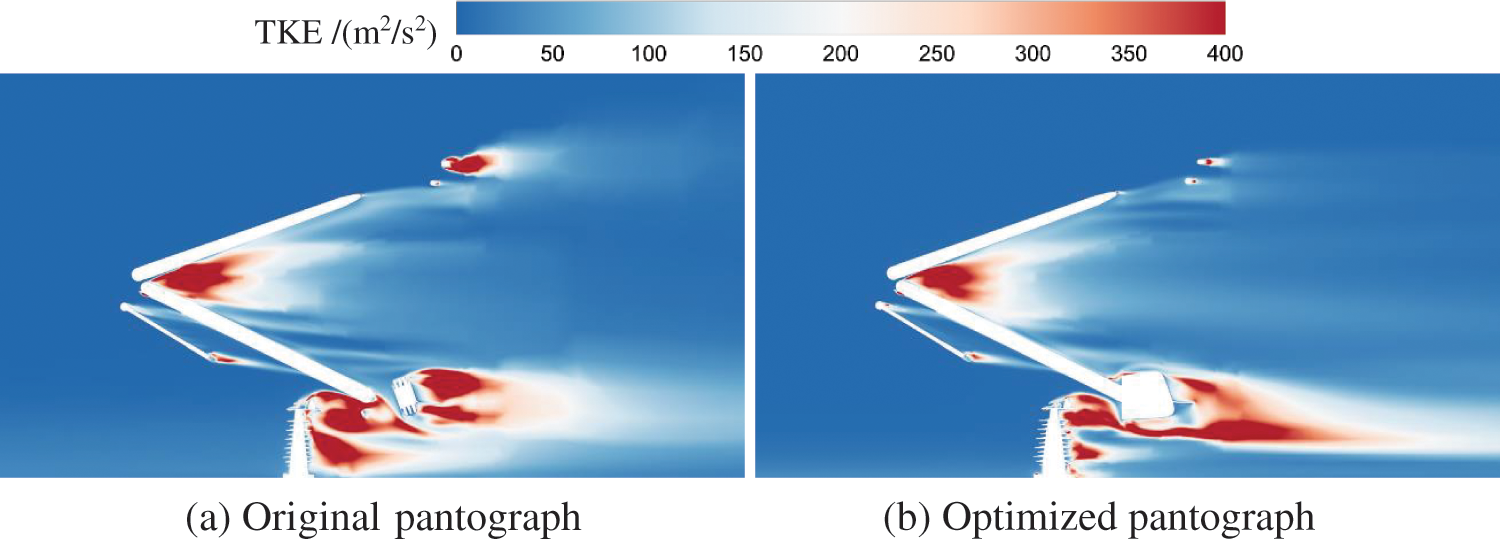
Figure 20: Turbulent kinetic energy around the pantograph
The aerodynamic noise of pantograph mainly comes from the flow separation, vortex shedding and fluctuating pressure on the surface of each component. Vorticity is the source of flow-induced aerodynamic noise. Fig. 21 also shows the vorticity distribution around the pantograph. It can be seen that the vorticity behind the strip, insulator and base is significantly reduced, which indicates that the optimized pantograph will produce less aerodynamic radiation noise. The flow separation and vortex shedding are reduced by the optimization of the cross-section shape of the strip and insulator, which significantly reduces the vorticity of the pantograph wake. The optimization of the base also reduces the vorticity around the lower arm. The optimization of the pantograph components helps to reduce the pressure gradient in the airflow. A smaller pressure gradient can reduce the generation of turbulence, thereby reducing the vorticity in the wake. The flow field around other unoptimized components of the pantograph is also affected by the optimized components, resulting in improved performance.
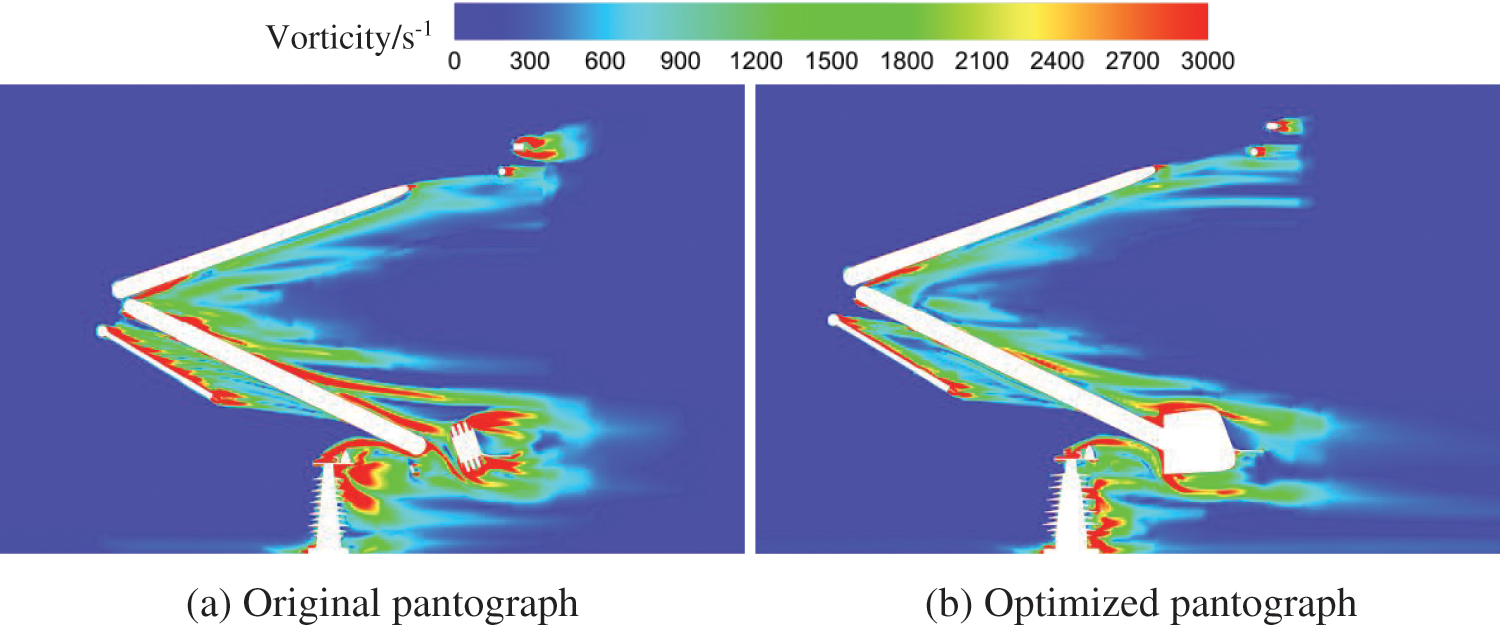
Figure 21: The vorticity distribution around the pantograph
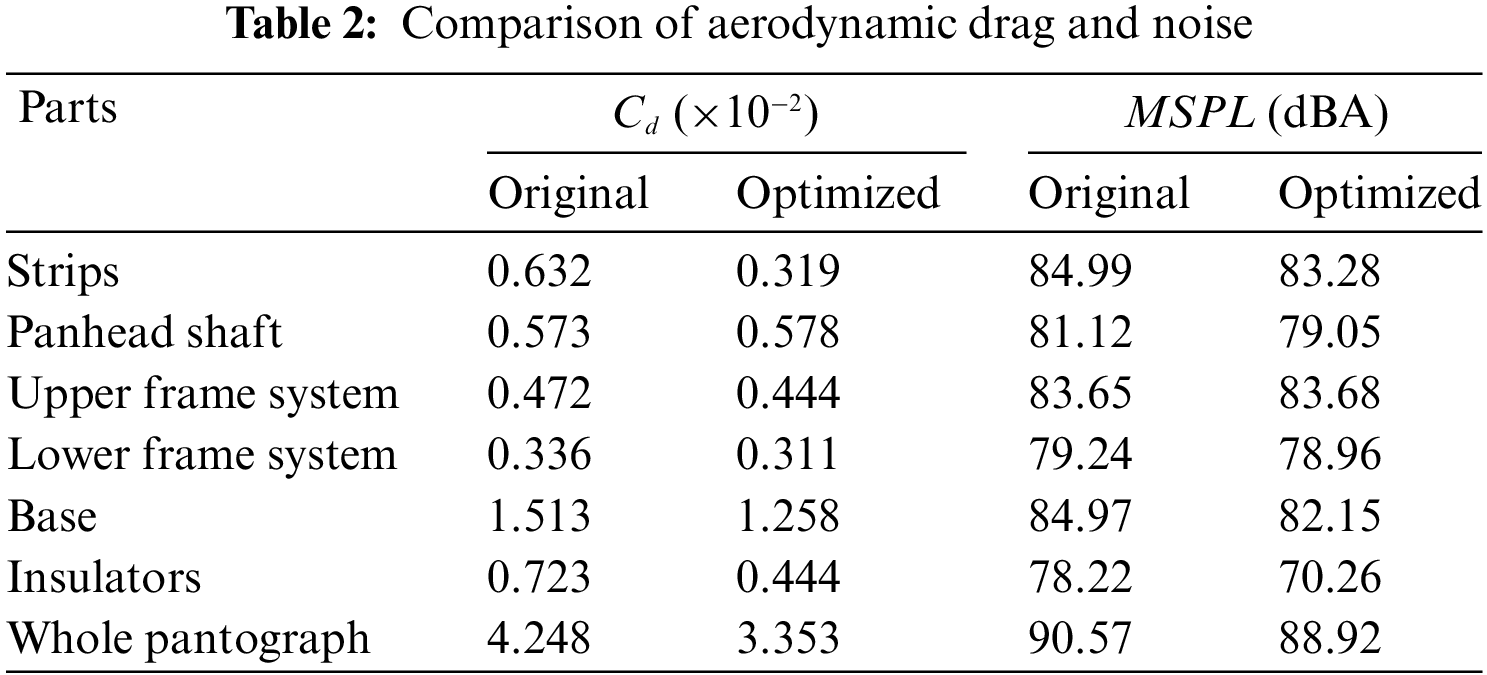
Table 2 shows a comparison of the aerodynamic drag and far-field noise associated with the components of a high-speed pantograph. The main contributors to the aerodynamic drag of the high-speed pantograph are the base, insulator and panhead, which account for over 80% of the total drag. The sound pressure level of the original pantograph model at a distant field receiver (located 25 m from the pantograph and 3.5 m above the ground) is measured to be 90.57 dBA. The noise comes mainly from the panhead, the upper frame system and the base. The change in the cross-sectional design of the strips and insulators results in a reduction in the aerodynamic drag of the relevant parts by 49.5% and 38.6%, respectively. In addition, the fairing reduces the drag of the base by 16.9%. There is a 21.1% reduction in overall drag and a 1.65 dBA reduction in far field noise.
Overall, by considering the quadrupole sound source, the aerodynamic noise of high-speed pantographs can be more accurately predicted and the possibility of reducing aerodynamic drag and noise of pantograph components can be further explored. From the results, the structural design of the main drag and noise source components of the pantograph can achieve better performance improvement. In practical applications, it is necessary to comprehensively consider the aerodynamic optimization of the whole structure of the pantograph system. In addition, wind tunnel tests can be carried out to ensure the performance and safety of the pantograph when it is required.
In this paper, we used numerical simulation to investigate the aerodynamic drag and noise characteristics of a high-speed pantograph. Then, a step-by-step optimization process was carried out with a focus on the most important components. Finally, the aerodynamic behavior of the improved pantograph model was compared and analyzed. The main conclusions are as follows:
(1) Rectangular and circular cross-sections will cause early separation and vortex shedding of the airflow, resulting in increased aerodynamic drag and radiated noise. As the chamfer angle increases, the aerodynamic drag first increases and then decreases. In addition, with the increase of the chamfer height, the aerodynamic drag gradually decreases and then tends to be gentle. When
(2) The insulator with an elliptical cross-sectional shape has a better aerodynamic performance. By elliptically optimizing the cross-sectional shape of the insulator, the flow separation on the surface of the insulator can be significantly reduced, and the pressure drag on the front and rear surfaces of the insulator can be reduced. While maintaining the surface area of the insulator constant, by increasing its length by 1.5 times and reducing its width to 0.667 times, a significant 55.3% reduction in the aerodynamic drag generated by the insulator can be achieved. In addition, the use of streamlined fairing shrouds to cover the base can minimize aerodynamic drag and shielding noise. The improved pantograph, based on component optimization, reduced drag by 21.1% and noise by 1.65 dBA relative to the original pantograph.
(3) In this study, the pantograph components were optimized based on the consideration of quadrupole sound sources to reduce drag and noise. However, the actual installation form of the pantograph, such as the sinking of the installation platform, may affect the effect of the structural optimization. In addition, the flow field around the pantograph is affected by the train geometry, but only an isolated pantograph model is used in this paper. Therefore, future research can further improve the modelling of pantograph noise to improve the accuracy. In the future, aerodynamic noise wind tunnel experiments can also be carried out to provide data support for the acoustic evaluation of high-speed train pantographs. An aerodynamic noise prediction method suitable for high-speed pantographs above 400 km/h is a problem worthy of investigation in future work, which will be helpful in exploring some potential drag and noise reduction measures.
Acknowledgement: This paper’s logical organisation and content quality have been enhanced, so the authors thank anonymous reviewers and journal editors for assistance.
Funding Statement: This work was supported by National Natural Science Foundation of China (12372049), Science and Technology Program of China National Accreditation Service for Conformity Assessment (2022CNAS15), Sichuan Science and Technology Program (2023JDRC0062) and Independent Project of State Key Laboratory of Rail Transit Vehicle System (2023TPL-T06).
Author Contributions: The authors confirm contribution to the paper as follows: study conception and design: D. Qin; data collection: X. Du; analysis and interpretation of results: D. Qin, T. Li; draft manuscript preparation: D. Qin; manuscript review: J. Y. Zhang. All authors reviewed the results and approved the final version of the manuscript.
Availability of Data and Materials: The datasets used and/or analyzed during the current study are available from the corresponding author on reasonable request.
Conflicts of Interest: The authors declare that they have no conflicts of interest to report regarding the present study.
References
1. Yang, W. C., Deng, E., He, X. H., Luo, L. S., Zhu, Z. H. et al. (2021). Influence of wind barrier on the transient aerodynamic performance of high-speed trains under crosswinds at tunnel-bridge sections. Engineering Applications of Computational Fluid Mechanics, 15(1), 727–746. [Google Scholar]
2. Thompson, D. J., Iglesias, E. L., Liu, X., Zhu, J., Hu, Z. (2015). Recent developments in the prediction and control of aerodynamic noise from high-speed trains. International Journal of Rail Transportation, 3(3), 119–150. [Google Scholar]
3. Ding, S. S., Li, Q., Tian, A. Q., Du, J., Liu, J. L. (2016). Aerodynamic design on high-speed trains. Acta Mechanica Sinica, 32(2), 215–232. [Google Scholar]
4. Yang, W. C., Deng, E., Zhu, Z. H., Li, M. F., Shi, C. H. et al. (2020). Sudden variation effect of aerodynamic loads and safety analysis of running trains when entering tunnel under crosswind. Applied Sciences, 10(4), 1445. [Google Scholar]
5. Talotte, C. (2000). Aerodynamic noise: A critical survey. Journal of Sound & Vibration, 231(3), 549–562. [Google Scholar]
6. Yue, M. T., Li, H., Zhou, X. (2015). Analysis on aerodynamic characteristics and noise of the high-speed train under high-speed operation. Journal of Vibroengineering, 17(3), 1452–1463. [Google Scholar]
7. Qin, D., Li, T., Dai, Z. Y., Zhang, J. Y. (2022). Study on prediction in far field aerodynamic noise of long-marshalling high-speed train. Environmental Science and Pollution Research, 29(57), 86580–86594. [Google Scholar] [PubMed]
8. Tan, X. M., Xie, P. P., Yang, Z. G., Gao, J. Y. (2019). Adaptability of turbulence models for pantograph aerodynamic noise simulation. Shock and Vibration, 2019, 1–20. [Google Scholar]
9. Ikeda, M., Suzuki, M., Yoshida, K. (2006). Study on optimization of panhead shape possessing low noise and stable aerodynamic characteristics. Quarterly Report of RTRI, 47(2), 72–77. [Google Scholar]
10. Li, T., Qin, D., Zhang, W. H., Zhang, J. Y. (2020). Study on the aerodynamic noise characteristics of high-speed pantographs with different strip spacings. Journal of Wind Engineering and Industrial Aerodynamics, 202, 104191. [Google Scholar]
11. Dai, Z. Y., Li, T., Deng, J., Zhou, N., Zhang, W. H. (2021). Effect of the strip spacing on the aerodynamic performance of a high-speed double-strip pantograph. Vehicle System Dynamics, 60(10), 3358–3374. [Google Scholar]
12. Lee, Y., Rho, J., Kim, K. H., Lee, D. H., Kwon, H. B. (2013). Experimental studies on the aerodynamic characteristics of a pantograph suitable for a high-speed train. Proceedings of the Institution of Mechanical Engineers, Part F: Journal of Rail and Rapid Transit, 229(2), 136–149. [Google Scholar]
13. Niu, J. Q., Zhou, D., Liang, X. F., Jia, L. R. (2017). Influence of diversion device on unsteady aerodynamic performance of pantograph. Journal of ZheJiang University Engineering Science, 51, 752–760. [Google Scholar]
14. Wu, Z., Xie, Z., Wang, P., Ding, W. (2020). Aerodynamic drag performance analysis of different types of high-speed train pantograph fairing. Journal of Applied Science and Engineering, 23, 509–519. [Google Scholar]
15. Xiao, C. H., Yang, M., Tan, C., Lu, Z. (2020). Effects of platform sinking height on the unsteady aerodynamic performance of high-speed train pantograph. Journal of Wind Engineering and Industrial Aerodynamics, 204, 104284. [Google Scholar]
16. Liu, H. K., Zhang, S. S., Liang, X. F., Zou, Y. (2022). The effect of covering structure in pantograph sinking platform on the aerodynamics of high-speed train. Engineering Applications of Computational Fluid Mechanics, 16(1), 2157–2175. [Google Scholar]
17. Liu, H. R., Wei, J. J., Qu, Z. G. (2017). Prediction of aerodynamic noise reduction by using open-cell metal foam. Journal of Sound and Vibration, 331, 1483–1497. [Google Scholar]
18. Wu, J. M. (2017). Numerical computation and improvement of aerodynamic radiation noises of pantographs. Journal of Vibroengineering, 19(5), 3939–3952. [Google Scholar]
19. Wang, Y. Y., Zhou, J. S., Gong, D., Liu, H. T. (2018). Study on bionic noise reduction and aerodynamic noise distribution characteristics for high-speed trains’s pantographs. Noise and Vibration Control, 38(S1), 367–371. [Google Scholar]
20. Zhang, Y. D., Zhang, J. Y., Li, T., Zhang, W. H. (2016). Research on aerodynamic noise reduction for high-speed trains. Shock and Vibration, 2016, 6031893. [Google Scholar]
21. King, W. F., Pfizenmaier, E. (2009). An experimental study of sound generated by flows around cylinders of different cross-section. Journal of Sound and Vibration, 328(3), 318–337. [Google Scholar]
22. Zhang, P. K., Liu, Y., Li, Z. Y., Liu, H. R., Yang, Y. N. (2020). Numerical study on reducing aerodynamic drag and noise of circular cylinders with non-uniform porous coatings. Aerospace Science and Technology, 107, 106308. [Google Scholar]
23. Liu, H. K., Zhou, S. Q., Chen, R. R., Li, Z. L., Zhang, S. S. et al. (2022). Numerical study on the aeroacoustic performance of different diversion strategies in the pantograph area of high-speed trains at 400 km/h. Applied Sciences, 12(21), 10702. [Google Scholar]
24. Shur, M. L., Spalart, P. R., Strelets, M. K., Travin, A. K. (2008). A hybrid RANS-LES approach with delayed-DES and wall-modelled LES capabilities. International Journal of Heat and Fluid Flow, 29(6), 1638–1649. [Google Scholar]
25. Li, T., Qin, D., Zhou, N., Zhang, J. Y., Zhang, W. H. (2022). Numerical study on the aerodynamic and acoustic scale effects for high-speed train body and pantograph. Applied Acoustics, 196, 108886. [Google Scholar]
26. Yang, W. C., He, Y., Deng, E., He, X. H., Zhou, Y. F. et al. (2022). Comparison of aerodynamic performance of high-speed train driving on tunnel-bridge section under fluctuating winds based on three turbulence models. Journal of Wind Engineering & Industrial Aerodynamics, 228, 105081. [Google Scholar]
27. Guo, Z. J., Liu, T. H., Hemida, H., Chen, Z. W., Liu, H. K. (2020). Numerical simulation of the aerodynamic characteristics of double unit train. Engineering Applications of Computational Fluid Mechanics, 14(1), 910–922. [Google Scholar]
28. Lighthill, M. J. (1952). On sound generated aerodynamically. I. General theory. Proceedings of the Royal Society A: Mathematical and Physical Sciences, 211(1107), 564–587. [Google Scholar]
29. Ffowcs-Williams, J. E., Hawkings, D. L. (1969). Sound generation by turbulence and surfaces in arbitrary motion. Philosophical Transactions for the Royal Society A: Mathematical and Physical Sciences, 264(1151), 321–342. [Google Scholar]
30. Di Francescantonio, P. (1997). A new boundary integral formulation for the prediction of sound radiation. Journal of Sound and Vibration, 202(4), 491–509. [Google Scholar]
31. Spalart, P. R., Belyaev, K. V., Shur, M. L., Strelets, M. K., Travin, A. K. (2019). On the differences in noise predictions based on solid and permeable surface Ffowcs Williams-Hawkings integral solutions. International Journal of Aeroacoustics, 18(6–7), 621–646. [Google Scholar]
32. Powell, A. (1964). Theory of vortex sound. Journal of the Acoustic Society of America, 36(1), 177–195. [Google Scholar]
33. Yu, H. H., Li, J. C., Zhang, H. Q. (2013). On aerodynamic noises radiated by the pantograph system of high-speed trains. Acta Mechanica Sinica, 29(3), 399–410. [Google Scholar]
34. Zhang, Y. D., Zhang, J. Y., Li, T., Zhang, L. (2017). Investigation of the aeroacoustic behavior and aerodynamic noise of a high-speed train pantograph. Science China Technological Sciences, 60(4), 561–575. [Google Scholar]
Cite This Article
 Copyright © 2024 The Author(s). Published by Tech Science Press.
This work is licensed under a Creative Commons Attribution 4.0 International License , which permits unrestricted use, distribution, and reproduction in any medium, provided the original work is properly cited.
 Downloads
 Citation Tools