
 Submit a Paper
 Propose a Special lssue
 Open Access
ARTICLE

An Effective Hybrid Model of ELM and Enhanced GWO for Estimating Compressive Strength of Metakaolin-Contained Cemented Materials
1 Department of Civil Engineering, National Institute of Technology Patna, Patna, India
2 Department of Computer Engineering and Applications, GLA University, Mathura, India
3 Department of Computer Science, College of Sciences and Humanities-Aflaj, Prince Sattam Bin Abdulaziz University, Al-Kharj, Saudi Arabia
4 Department of Computer Science, College of Science and Arts, Qassim University, Unaizah, Saudi Arabia
* Corresponding Authors: Abidhan Bardhan. Email: ; Sulaiman Abdullah Alateyah. Email:
(This article belongs to the Special Issue: Meta-heuristic Algorithms in Materials Science and Engineering)
Computer Modeling in Engineering & Sciences 2024, 139(2), 1521-1555. https://doi.org/10.32604/cmes.2023.044467
Received 31 July 2023; Accepted 24 October 2023; Issue published 29 January 2024
 View Full Text
 Download PDF
Abstract
This research proposes a highly effective soft computing paradigm for estimating the compressive strength (CS) of metakaolin-contained cemented materials. The proposed approach is a combination of an enhanced grey wolf optimizer (EGWO) and an extreme learning machine (ELM). EGWO is an augmented form of the classic grey wolf optimizer (GWO). Compared to standard GWO, EGWO has a better hunting mechanism and produces an optimal performance. The EGWO was used to optimize the ELM structure and a hybrid model, ELM-EGWO, was built. To train and validate the proposed ELM-EGWO model, a sum of 361 experimental results featuring five influencing factors was collected. Based on sensitivity analysis, three distinct cases of influencing parameters were considered to investigate the effect of influencing factors on predictive precision. Experimental consequences show that the constructed ELM-EGWO achieved the most accurate precision in both training (RMSE = 0.0959) and testing (RMSE = 0.0912) phases. The outcomes of the ELM-EGWO are significantly superior to those of deep neural networks (DNN), k-nearest neighbors (KNN), long short-term memory (LSTM), and other hybrid ELMs constructed with GWO, particle swarm optimization (PSO), harris hawks optimization (HHO), salp swarm algorithm (SSA), marine predators algorithm (MPA), and colony predation algorithm (CPA). The overall results demonstrate that the newly suggested ELM-EGWO has the potential to estimate the CS of metakaolin-contained cemented materials with a high degree of precision and robustness.Keywords
Abbreviations
| Adj.R2 | Adjusted coefficient of determination |
| ANN | Artificial neural network |
| B/S | Binder to sand ratio |
| BBO | Biogeography-based optimization |
| CO2 | Carbon dioxide |
| CPA | Colony predation algorithm |
| CS | Compressive strength |
| CSS | Charged system search |
| DE | Differential evolution |
| DNN | Deep neural network |
| E&E | Exploration and exploitation |
| EGWO | Enhanced grey wolf optimizer |
| ELM | Extreme learning machine |
| ELM-CPA | Hybrid model of ELM and CPA |
| ELM-EGWO | Hybrid model of ELM and EGWO |
| ELM-GWO | Hybrid model of ELM and GWO |
| ELM-HHO | Hybrid model of ELM and HHO |
| ELM-MPA | Hybrid model of ELM and MPA |
| ELM-PSO | Hybrid model of ELM and PSO |
| ELM-SSA | Hybrid model of ELM and SSA |
| EP | Evolutionary programming |
| FOF | Field of forces algorithm |
| GA | Genetic algorithm |
| GGBS | Granular glass furnace slag |
| GP | Genetic programming |
| GSA | Gravitational search algorithm |
| GWO | Grey wolf optimizer |
| HHO | Harris hawks optimization |
| KNN | K-nearest neighbors algorithm |
| lb | Lower bound |
| LCA | League championship algorithm |
| LSTM | Long short-term memory |
| M | Cement grade |
| MH | Meta-heuristic |
| MK | Metakaolin |
| MK/B | Metakaolin to binder ratio content |
| ML | Machine learning |
| MLA | Machine learning algorithm |
| MPA | Marine predators algorithm |
| NH | Number of hidden neurons |
| NS | Swarm size |
| PFI | Performance index |
| PSO | Particle swarm optimization |
| R2 | Coefficient of determination |
| RMSE | Root mean square error |
| RSR | RMSE to standard deviation of actual observations |
| SLC | Soccer league competition |
| SLFNN | single layer feed-forward neural network |
| SLO | Social learning optimization |
| SO | Spiral optimizer |
| SOA | Seeker optimization algorithm |
| SP | Superplasticizer |
| SSA | Salp swarm algorithm |
| SVR-PSO | Hybrid model of SVR and PSO |
| TLBO | Teaching-learning-based optimization |
| tmax | Maximum epoch count |
| TR | Training |
| TS | Testing |
| ub | Upper bound |
| VAF | Variance account factor |
| W/B | Water-binder ratio |
| WCA | Water cycle algorithm |
Concrete is a broadly utilized material in the construction industry. In the field of civil engineering, composite concrete technology is used to make concrete and cement-based materials, which are made up of cement, reinforcement, filler materials, admixtures, and water [1]. These materials are extensively used in the construction industry due to their high mobility, early strength gain, strong durability, and many other characteristics. For the construction of important structures such as precast concrete frames [2], reinforced concrete frames [3–5], composites reinforced columns and beams [6,7], steel-concrete composite beams [8], composite structure conducted under severe conditions [9], these materials also play an important role. During the process of cement manufacturing, a large amount of CO2 is released into the air which is a great threat to the environment. Practically, 5% of the total CO2 emission is mainly due to the production of cement [1,10–12]. The environmental damage caused by the mining of such large quantities of raw materials, the construction industry faces increasing pressure to cut the amount of cement consumption in concrete or to replace a proportion of cement content with supplemental materials such as recycled aggregates. According to the source of availability, supplementary materials can be classified into the following categories (a) natural materials such as natural pozzolans; (b) industrial wastes, viz., slag, fly ash, silica fume, etc.; and (c) environmentally friendly materials such as granular glass furnace slag (GGBS), metakaolin (MK), etc. [1,10]. Notably, the production energy of GGBS and MK is less demanding and thus more environmentally friendly. Among these two, MK is an aluminosilicate substance that is created by calcining kaolin clay at high a temperature. MK is a high-performance mineral additive and has better pozzolanic properties than silica fume [13,14].
Extensive research works on the production and characterization, and effect of MK on the physico-chemical characteristics of cement, mortars, and concrete have been carried out since the mid-20th century [15,16]. The partial replacement of cement with MK has shown a substantial effect on both the fresh and hardened properties of MK-cement mixtures, providing an alternative to standard cement-sand mixtures. Due to the pozzolanic reaction between MK and portlandite, the addition of MK to concrete/cement mortar causes the consumption of portlandite formed during the hydration phase of Portland concrete resulting in the generation of extra C-S-H gel and crystalline substances [13,14]. The optimal proportion of MK replacement varies among studies and depends on several factors such as the composition of Portland cement, water-binder ratio (W/B), proportion of superplasticizer (SP), and the properties of MK. The pozzolanic reaction and filler effect lead to the refinement of pores in the hardened mix of MK-contained concretes, resulting in a decrease in pore size and increasing total porosity. According to the literature, the compressive strength (CS) of concrete/cement increases with MK content when used as partial cement replacement, but the optimum percentage for maximum long-term strength varies. Concrete mixes with MK also exhibit enhanced durability and workability, better resistivity against chemical attack, reduced permeability and efflorescence, and reduced the effect of alkali-silica reaction. The part replacement of cement with GGBS and/or MK not only improves concrete durability but also reduces the risk of thermal cracking in the produced mix [17–19].
Although MK may increase the susceptibility of concrete to carbonation by consuming portlandite, there are cases where MK enhances carbonation resistance. Overall, replacing cement with MK increases the durability of mortar and concrete. According to earlier research, the part replacement of cement with MK has a good effect on the strength and durability of mortar and concrete; therefore, MK can serve as a carbon-neutral substitute for pure Portland cement concrete/mortar. In the past, numerous experimental works have been conducted to examine the impact of various factors, such as the proportion of cement replaced by MK, the age of the specimen during testing, and the ratio of aggregates to binder, on the CS of concrete and cement containing MK. Furthermore, statistical models have been developed to predict their CS. However, the vast number of variables and complexity of the subject make it difficult to incorporate all parameters into these formulas, rendering them specific to certain materials and not generally applicable. Additionally, researchers have tested the CS of cement in the laboratory, but the laboratory tests can be time-consuming, expensive, and labour-intensive. Therefore, there is a need for a more resourceful and cost-effective method to estimate the CS of concrete and cement-based materials containing MK.
Machine learning (ML) is a multi-disciplinary area of research concerned with the development of intelligent inferences that can learn and draw inferences from patterns in data. Its main goal is to simulate and implement human learning behavior, enabling the acquisition of new skills and the continual improvement of existing skills [20,21]. By leveraging the powerful data processing and analysis abilities of computers, ML can effectively process and analyse large quantities of data. In recent times, ML paradigms have been applied in various fields due to their superior performance. Given its outstanding performance, many researchers have proposed multiple ML approaches to estimate the characteristics of cement and concrete, yielding satisfactory outcomes. In the field of CS prediction of concrete and cement, Özcan et al. [22] presented comparative results of prediction outcomes of neural network and fuzzy logic paradigms for the long-term CS of silica fume-based concrete. Sarıdemir [23,24] used ANNs and fuzzy logic for predicting CS of concretes and mortars containing MK and silica fume. Gilan et al. [25] suggested an SVR-PSO paradigm for the prediction of CS of MK-contained concretes. Moradi et al. [26] studied predicting the CS of MK-contained concrete with different properties using ANN. Asteris et al. [1] used ANN to reveal the nature of MK-based concrete. Huang et al. [10] predicted the CS of cement-based materials with MK used on the hybrid ML paradigm. Although the aforementioned ML paradigms achieved satisfactory results in predicting the CS of concrete and cement, they have multiple limitations such as uncertainty, time consumption, and local minima trapping issues. Thus, it is necessary to develop a high-performance ML paradigm, especially for estimating the CS of MK-contained cement-based materials.
According to the literature, to overcome the afore-mentioned limitations and enhance the application of hybrid ML paradigms, this research suggests a high-performance ML solution for predicting the CS of cement containing MK. To this end, enhanced GWO (EGWO), proposed by Joshi et al. [27], was employed to optimize the weights and biases of ELM. EGWO is an augmented form of the classic GWO. Compared to standard GWO, EGWO has a better hunting mechanism and produces an appropriate balance between exploration and exploitation (E&E) that leads to optimal performance. The developed model was then used for the estimation of CS of MK-contained cement-based materials. The outcomes of the ELM-EGWO were also compared with six more hybrid ELMs constructed with GWO, PSO, HHO, SSA, MPA, and CPA and three standalone models including DNN, KNN, and the LSTM.
The subsequent part of this work is ordered as follows: Section 2 offers research significance which is followed by the details of the ELM and an overview of MHs in Section 3. Descriptive information of the datasets and the computation modelling procedure are presented in Section 4. The results and discussions are presented in Section 5, while in Section 6, a summary and conclusions is provided.
With non-linear association between the parameters and the concrete qualities, it is challenging to construct optimal concrete mixes incorporating metakaolin [1]. For the optimal mix design, expensive and time-consuming experimental operations based on empirical formulas are typically conducted. In addition, the literature and current tools for predicting the CS of concrete and cemented materials reflect this challenge, where empirical correlations are suggested to account for the consequence of a small number of parameters on the concrete CS. Most of the existing models employ diverse parameters and provide findings with a substantial variation, highlighting the need for additional studies. In addition, alternative methods that can produce optimum outcomes with fewer input data are required.
The existing literature across several technical and scientific disciplines provides evidence that soft computing techniques, known for their proficiency in non-linear modelling, can establish correlations between desired outcomes and a range of influencing parameters, whether they have direct or indirect impacts [1,28–32]. Considering the effects of influencing parameters, it is possible to design a high-performance soft computing-based paradigm using existing experimental data from numerous sources. As stated previously, the selection of an effective soft computing model is however a difficult task for the following reasons: (a) model implementation without considering the effects of individual variables; (b) inappropriate model construction and validation; (c) inability of employed models to find the exact global optimum; (d) overfitting-related issues, etc. In order to estimate the intended output, such as the CS of concrete, it is necessary to develop a high-performance intelligence paradigm that takes into account the effects of influencing parameters and overfitting related concerns. Considering the afore-mentioned discussion as a reference, this study suggested a highly effective hybrid model, i.e., ELM-EGWO, for estimating the CS of cemented materials. To this end, a comprehensive record was collected from the work of Huang et al. [10]. The outcomes of the suggested ELM-EGWO paradigm were analysed and compared for three different input combinations. For this purpose, three standalone models (viz., DNN, KNN, and LTSM) and six additional hybrid ELMs constructed with GWO, PSO, HHO, SSA, MPA, and CPA algorithms, were used in the present research.
This section discusses the working concept of ELM, followed by the classification of MHs. Following that, details of GWO and EGWO are presented. At the end, the methodological details for hybrid ELM development are provided. Notably, detailed information on the utilized MHs is not offered because they are well-established and the works of PSO [33], HHO [34], SSA [35], MPA [36], and CPA [37] can be referred to for more detail. Similarly, the literature on DNN [38,39], KNN [40,41], and LSTM [42,43] can be referred to for information regarding the working principle and application domain of these paradigms.
ELM [44], a widely used soft computing algorithm that is used for both regression and classification tasks. It is also called single layer feed-forward neural network (SLFNN). With the use of an advanced SLFNN, a closed-form solution for the weights of the outputs is produced by the ELM. It has only one hidden layer with one or more hidden neurons (see Fig. 1). The input and output layers each include the same number of nodes as their corresponding input and output parameters. In ELM, the weights and biases are assigned at random, which remains constant during the course of operation. Contrary to usual feed-forward networks where iterative procedures are followed, adapting to the ELM is carried out through a continuous-time function of the distribution of probability, which provides lower design complexity and is capable of solving problems faster using random weights and biases for the hidden layers, along with a unique solution in the output by employing the Moore-Penrose pseudo inverse function [44].

Figure 1: Structure of ELM
A set of predictor as
where
where
The target matrix in the training phase can be defined as:
An optimal response is provided through
As of date, several MHs have been introduced. Based on their source of inspiration, MHs can be classified into various groups including (a) evolutionary algorithms (EAs), (b) swarm intelligence (SI) algorithms, (c) natural phenomena-based algorithms, and (d) human inspiration algorithms [47]. The inspiration for EAs is dependent on the simulation of natural genetic concepts, e.g., mutation, selection, and crossover. BBO [48], DE [49], EP [50], GA [51], and GP [52] belong to this group. The SI techniques simulate the behavior of a swarm in nature in the course of searching for food. The MHs under this category are CPA [37], GWO [53], HHO [34], MPA [36], PSO [33], SSA [35], and so on. The natural phenomena-based techniques include CSS [54], FOF [55], GSA [56], SO [57], WCA [58], and so on. The human-inspired algorithms are dependent on inspiration from human behavior. Examples are LCA [59], SLC [60], SLO [61], SOA [62], TLBO [63], etc. These groups are illustrated in Fig. 2.

Figure 2: Classification of MHs
GWO [53] offered an innovative and revolutionary algorithm for optimization based on the imitation of the grey wolves’ social bahavior. In specific, GWO mimics the process that grey wolves utilize to capture their prey, along with the structure of their leadership. For the recreation of the hierarchical structure in GWO, grey wolves in four different types are assumed for every wolf pack. The leader and the most significant wolf in the pack are called
where
where
In GWO, E&E are handled using parameters
In standard GWO, exploration is allowed on the primary phase of the iterations and exploitation on the second phase. However, this approach ignored the importance of striking the appropriate balance between the two activities in order to arrive at a close approximation of the global optimum. Thus, to solve the problem, Joshi and Arora [27] proposed EGWO, in which the
3.3 Hybridization Steps of ELM and MHs
In the last decade, numerous MHs have been utilized extensively to adjust the learning parameters of many ML models in order to improve their performance [64–66]. The combination of MLAs with MHs helps in the search for the exact global optimum. This is accomplished by improving the accuracy of the results. Due to the use of MHs, the search space has been reduced to a global optimum. In the case of hybrid ELM modelling, MHs update weights and biases of ELM iteratively and offer optimal values that are then used to estimate the intended output. Notably, the activation function and hidden neuron numbers (NH) play a significant role during the model construction; therefore, they should also be selected carefully during hybridization. In addition, different MH parameters, such as swarm size (NS), maximum epoch count (tmax), and upper and lower bounds (ub and lb) should also be designed sensibly for constructing the optimum hybrid ELMs. Six MHs, viz., GWO, PSO, HHO, SSA, MPA, and CPA, were used in the current research to develop hybrid ELMs for the purpose of predicting the CS of MK-contained materials. Additionally, EGWO was used to construct a high-performance hybrid model called ELM-EGWO. Fig. 3 illustrates the steps of hybrid ELM modelling in predicting CS of MK-contained cemented materials.

Figure 3: Flow chart of computational modelling
4 Data Description and Modelling
In past studies, researchers focused more on making models that were easy to use and could predict the properties of concrete and cement mortar. However, they often overlooked how important it was to have a good database for making predictions. The model’s accuracy can be checked by looking at a database with enough good data. In this study, a large amount of data was acquired from Huang et al. [10] and used to predict the CS of MK-contained cemented materials. There are five influential parameters including M, MK/B, W/B, SP, and B/S, and the CS of MK-contained cemented materials is the output variable. Literature has shown that these parameters have a substantial effect on the CS. Descriptive particulars are presented in Table 1.
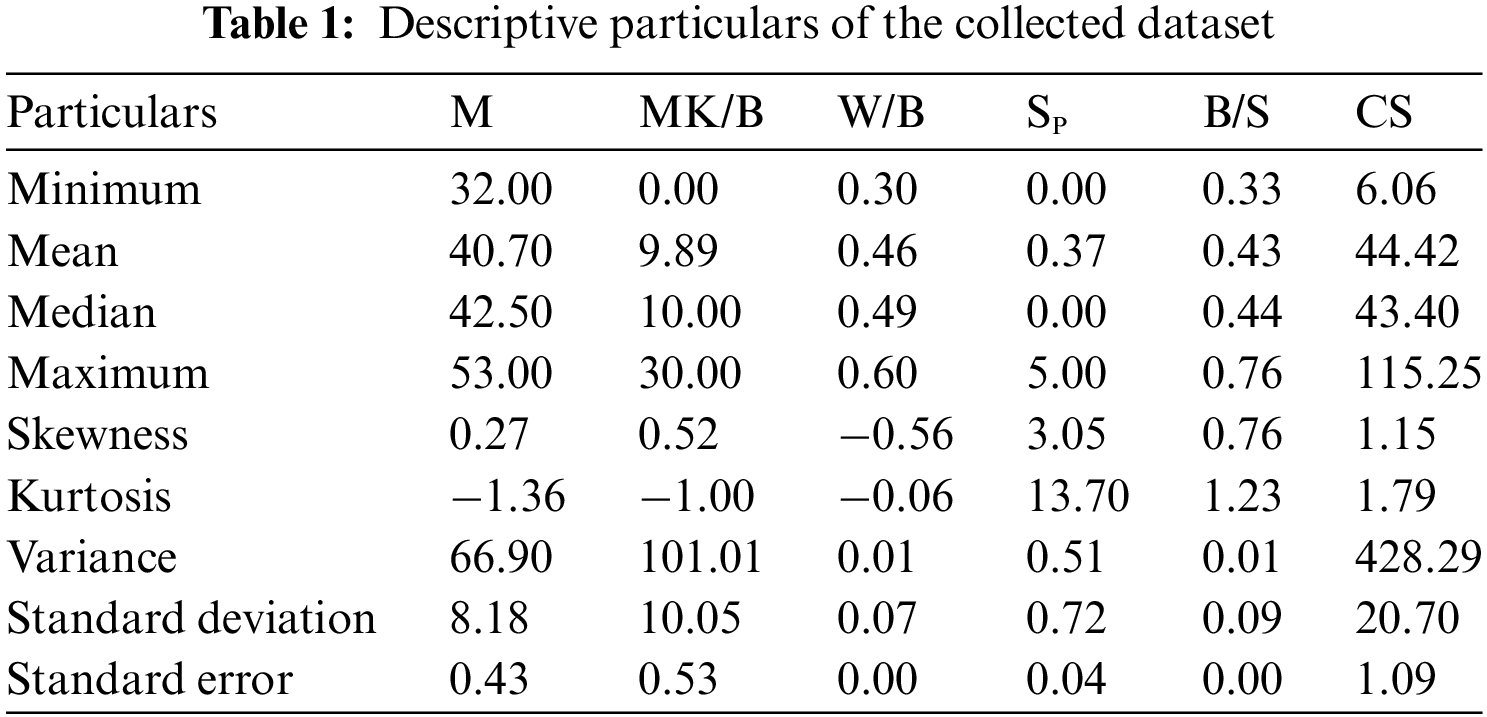
According to Table 1, M varies between 32 and 53 with a high variance of 66.90. The parameters MK/B, W/B, and B/S scatter in the range of 0 to 30, 0.30 to 0.60, and 0.33 to 0.76, respectively. the SP content varies between 0% and 5%. The variance of MK/B and CS is 101.01 and 428.29, respectively, which is considered to be very high. The parameters (viz., M, MK/B, and W/B) with -ve Kurtosis indicate that these variables are not uniformly distributed. Similarly, The parameters (viz., SP, B/S, and CS) with +ve Kurtosis also indicate that they are not uniformly distributed. According to this information, it is seen that the gathered records have a wide range of experimental observations and hence, can be considered useful for the estimation of CS of MK-contained cement-based materials. To illustrate the data range, frequency distribution histograms (see Fig. 4) and correlation matrix (see Fig. 5) are also presented. From the correlation matrix, it is seen that the association between the influential variables and the CS is scattered between –0.56 and 0.32, which is very low. The maximum correlation is −0.56 between M and CS whereas the minimum correlation is 0.025 between MK/B and CS.

Figure 4: Frequency distribution histograms of input and output variables

Figure 5: Correlation matrix
4.2 Data Processing and Analysis
To model the CS of MK-contained materials, 3 different combinations of input parameters, viz., Case-1 (C1), Case-2 (C2), and Case-3 (C3), were explored. For this purpose, sensitivity analysis (SA) based on the Cosine Amplitude method [1,28] was conducted. Initially, the strength of relation (RS) between the output and input variables was determined and arranged in descending order. The input parameters were then ranked between 1 and 5 (there are a total of five input parameters) based on their RS values. The RS value and rankings for three combinations are presented in Table 2. It is seen that M has the highest strength (RS = 0.7462), followed by B/S (RS = 0.7186), W/B (RS = 0.6887), MK/B (R2 = 0.6265), and SP (RS = 0.4391). In this work, the parameters, i.e., M and B/S were considered in Case-1. These two inputs have a high RS value (range from 0.7462 to 0.7186) and are thus taken into account in this combination. In Case-2, parameters with RS
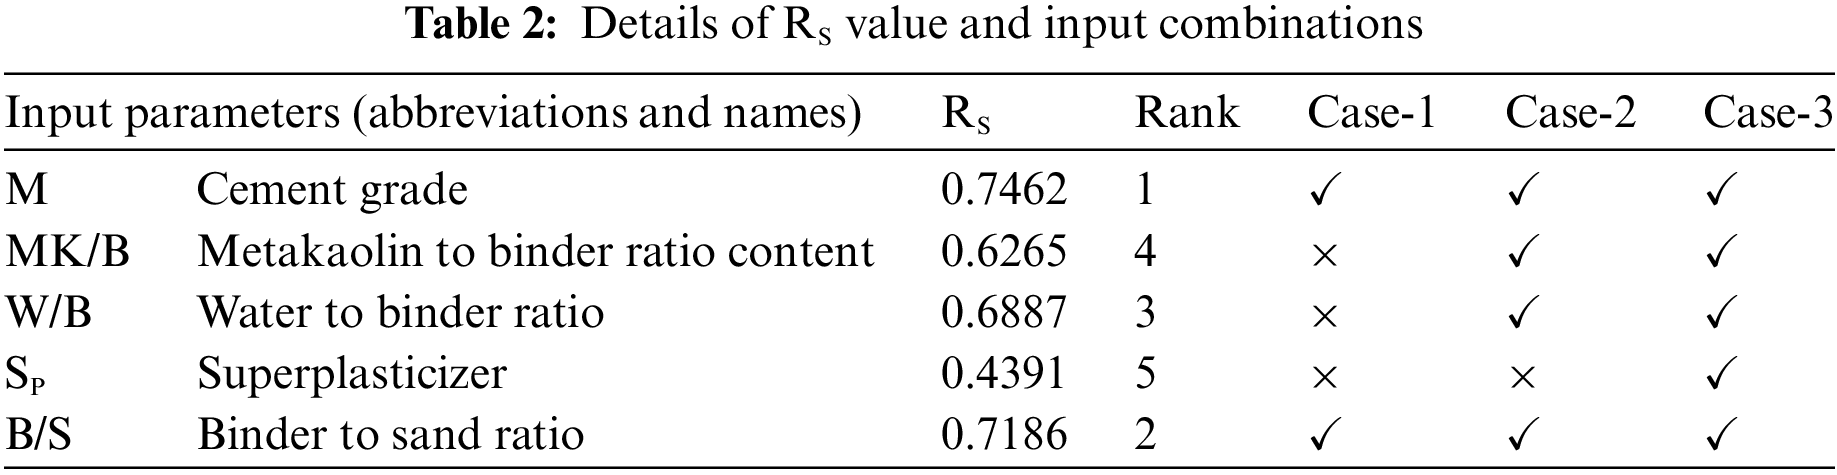
Table 3 displays the details of different input combinations considered in the present work. The details of the computational analysis are also demonstrated in Fig. 6. The steps are (a) dataset collection; (b) selection of input parameters; (c) sensitivity analysis; (d) arranging input parameters in descending order based on RS value; (e) selection of three different input combinations (i.e., Cases-1 to 3) based on ranking, (f) computational modelling, and (g) training and validation of hybrid ELMs. Note that, Fig. 6 shows a complete flow chart for hybrid ELM modelling, however, three conventional models, such as DNN, KNN, and LSTM, were also used in this work for predicting the CS of MK-contained cemented materials.
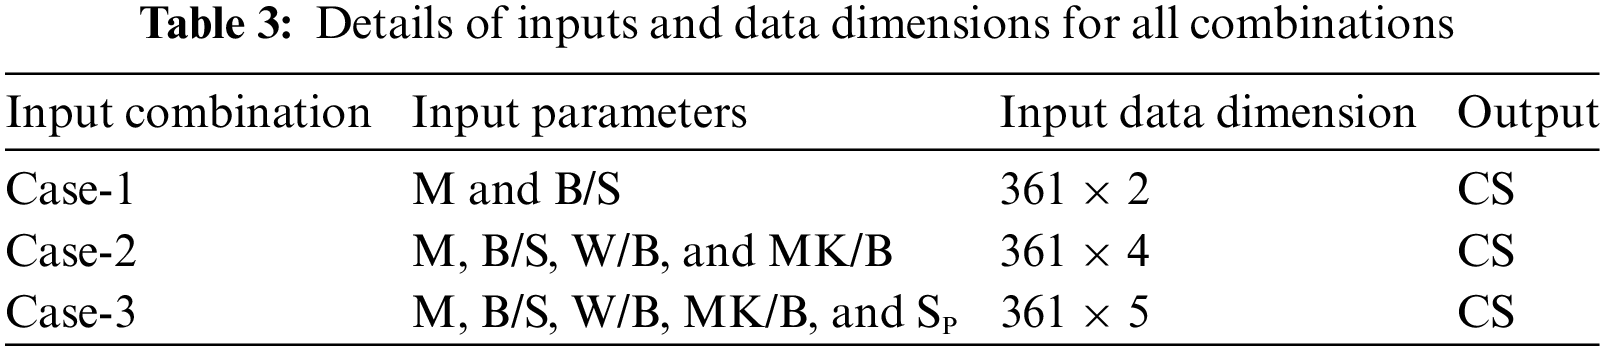

Figure 6: Illustration of computational modelling
4.3 Modelling and Performance Evaluation
It should be mentioned that data normalization is a vital activity in data-driven modelling and is frequently employed to mitigate the impacts of multidimensionality. Thus, the current research uses the min-max approach of normalization. Then the acquired records were separated into training (TR) and testing (TS) subgroups. The latter was extracted in order to estimate the trained models’ outcomes against unseen samples. So, 80% (289 observations) of the collected records were used for model construction and a balance of 20% (72 observations) for validation. Notably, while there are no predefined guidelines for determining the number of samples to include in a data-driven model, the researchers’ decision will be mostly determined by the nature of the tasks. Note that, a model constructed using a large sample is more likely to be accepted than one constructed from a small dataset. Thus, a 20% sample was preferred to validate the developed models. Following model development, their effectiveness was measured using multiple indices namely Adj.R2, NS, PFI, R2, RMSE, RSR, and VAF, expressed in Eqs. (15)–(21). In the domain of engineering and sciences, these are the most common indices used for the performance assessment of a data-driven model [1,28,67–70].
where
This section reports the performance of the developed/employed paradigms used to evaluate the CS of MK-contained cemented materials. As said above, each dataset was split into TR and TS subsets before developing the models. It should be mentioned that all of the models were constructed and corroborated with similar TR and TS subsets. Then, their results were evaluated via multiple parameters. It is noteworthy that the deterministic parameters of the MHs (viz., NS, tmax, ub, lb, etc.) have a key role in hybrid modelling, and hence they were calibrated correspondingly. In addition, the activation function and NH of ELM were tuned appropriately. Thus, before providing the results, the next sub-section presents a complete description of the configuration of hyper-parameters and deterministic parameters and their final values in the prediction of the CS of MK-contained materials.
To construct an optimum hybrid ELM, the NH ranging between 5 and 20 was investigated. Using sigmoid as the activation function and RMSE as the cost function, the optimal value of NH was obtained via a trial-and-error technique. On the contrary, the deterministic parameters of MHs were also tuned in the course of simulations. The details of all the parameters for the optimum hybrid ELMs are tabulated in Table 4. The detailed approach of hybrid ELM-GWO for CS estimation is described below.
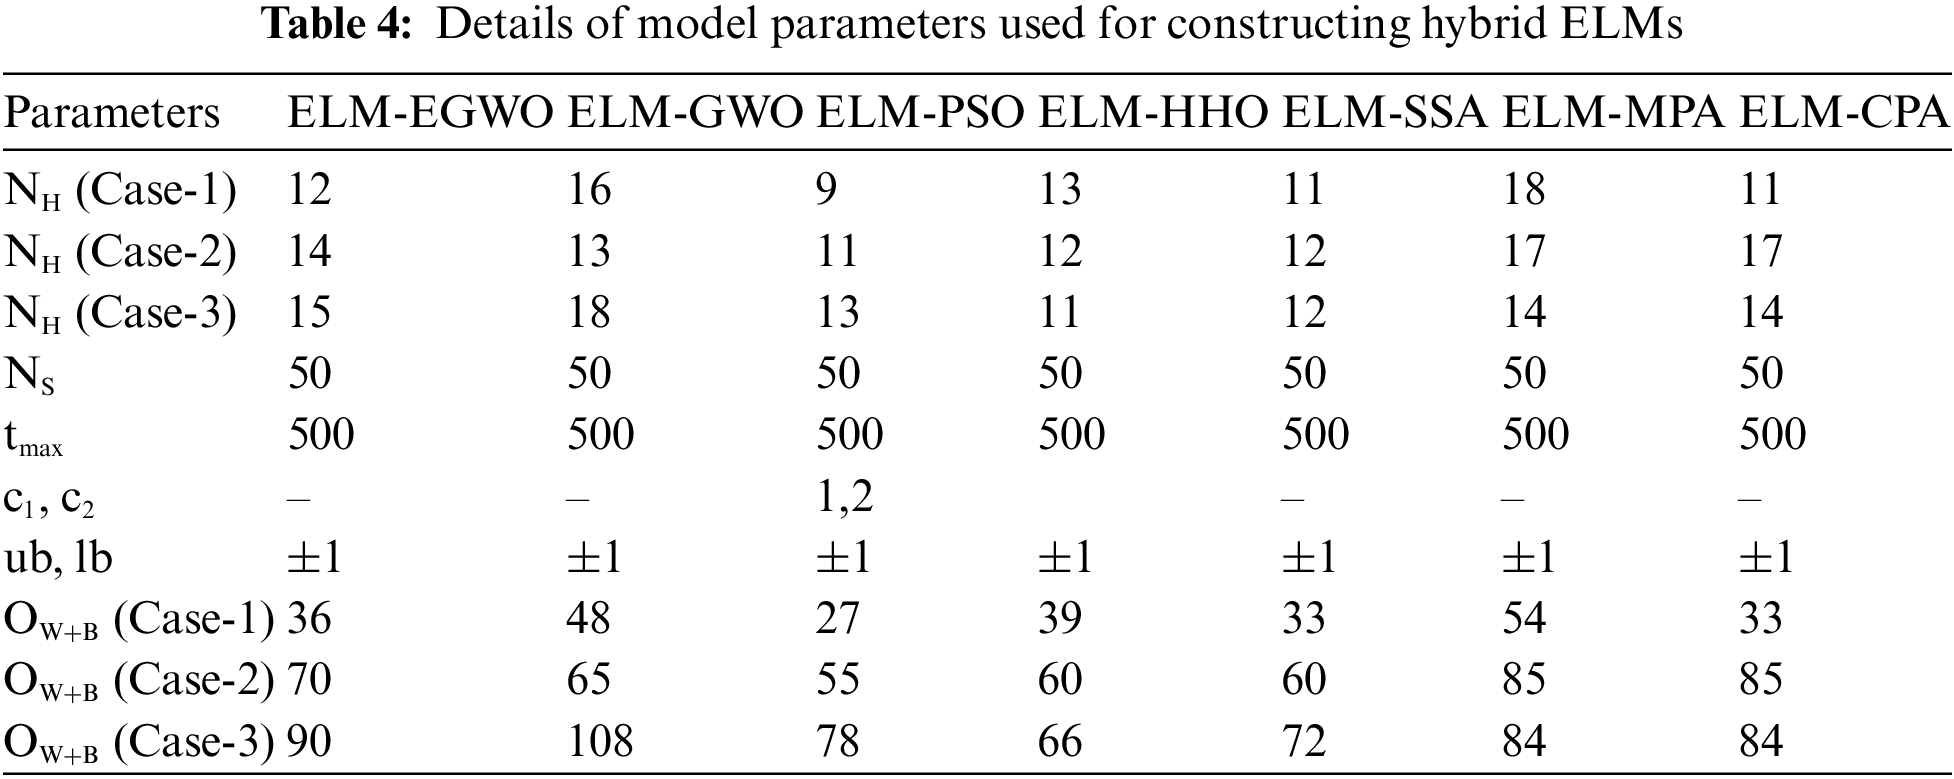
During ELM-GWO modelling, the ELM was set primarily and consequently the GWO was incorporated in order to optimize biases and weights of ELM. As soon as the training was completed, the final ELM-GWO structure was finalized. It is noteworthy that the GWO optimized ELM contains 16, 13, and 18 hidden neurons in Cases-1, 2, and 3 combinations, respectively. The numbers of input neurons were 2, 4, and 5, for input combinations Case-1, 2, and 3, respectively. However, the number of output neurons was 1 for all three cases. Therefore, the number of OW+B can be determined as 48 (2 × 16 + 16) for Case-1, 65 (4 × 13 + 13) for Case-2, and 108 (5 × 18 + 18) for Case-3 of input combinations. With NH between 13 and 18 and a sum of 289 training samples, the searches were carried out for global optimum at tmax = 500 with NS = 50 and subsequently, the OW+B were generated to validate the developed ELM-GWO models against each input combination.
Analogous to the ELM-GWO model, all other hybrid ELMs were developed using the same training dataset. For each hybrid ELM, the value of NH was determined using a trial-and-error technique. However, the values of NS, tmax, lb and ub were kept constant to conduct a fair comparison between other hybrid ELMs. Other deterministic parameters of HHO, PSO, MPA, CPA, and SSA were also fine-tuned in the course of the optimization. The accelerator coefficients of PSO, i.e., c1 and c2, were respectively set to 1 and 2 in ELM-PSO modelling. In all cases, the values of ub and lb were set to −1 and +1, respectively. By employing a trial-and-error technique, the optimal configuration of these parameters was obtained, the details of which are presented in Table 4.
Fig. 7 illustrates the convergence behavior for the developed hybrid ELMs for all combinations of CS estimation. It is seen that the proposed ELM-EGWO reached faster convergence and lower RMSE than other hybrid ELMs. Notably, all the ELMs were built in MATLAB 2015a environment. The computation time was recorded as ELM-EGWO = 56.51 s, ELM-GWO = 63.68 s, ELM-PSO = 58.50 s, ELM-HHO = 62.22 s, ELM-SSA = 55.33 s, ELM-MPA = 112.66 s, and ELM-CPA = 94.93 s for Case-1; ELM-EGWO = 56.98 s, ELM-GWO = 57.74 s, ELM-PSO = 56.97 s, ELM-HHO = 66.03 s, ELM-SSA = 55.83 s, ELM-MPA = 114.94 s, and ELM-CPA = 125.74 s for Case-2; and ELM-EGWO = 57.73 s, ELM-GWO = 57.51 s, ELM-PSO = 57.19 s, ELM-HHO = 64.72 s, ELM-SSA = 56.02 s, ELM-MPA = 114.40 s, and ELM-CPA = 132.85 s for Case-3 input combinations.

Figure 7: Convergence curves for different input combinations of hybrid ELMs
Similar to hybrid ELMs, the parameters of DNN, KNN, and LSTM were selected using a trial and error approach. The DNN structure was finalized by using mean squared error as the loss function and Adam optimizer. The final structure comprises of 5-input neurons, one output neuron, and four hidden layers with NH = 10 in each layer. Notably, in each dense layer, the ReLU was used as the activation function. For KNN, the number of neighbors was set to 5. The LSTM model was finalized using the same loss function and optimizer that were utilized during the creation of the DNN model. The sigmoid activation function was used in this case. The epoch number was set to 500 in the case of DNN and LSTM models.
The following sub-sections present and discuss the performance of all the constructed/employed models in the evaluation of the CS of MK-contained cemented materials. Also, a comprehensive comparison of the accuracies of models via various performance criteria is provided. In addition, the final results are visually presented and analyzed.
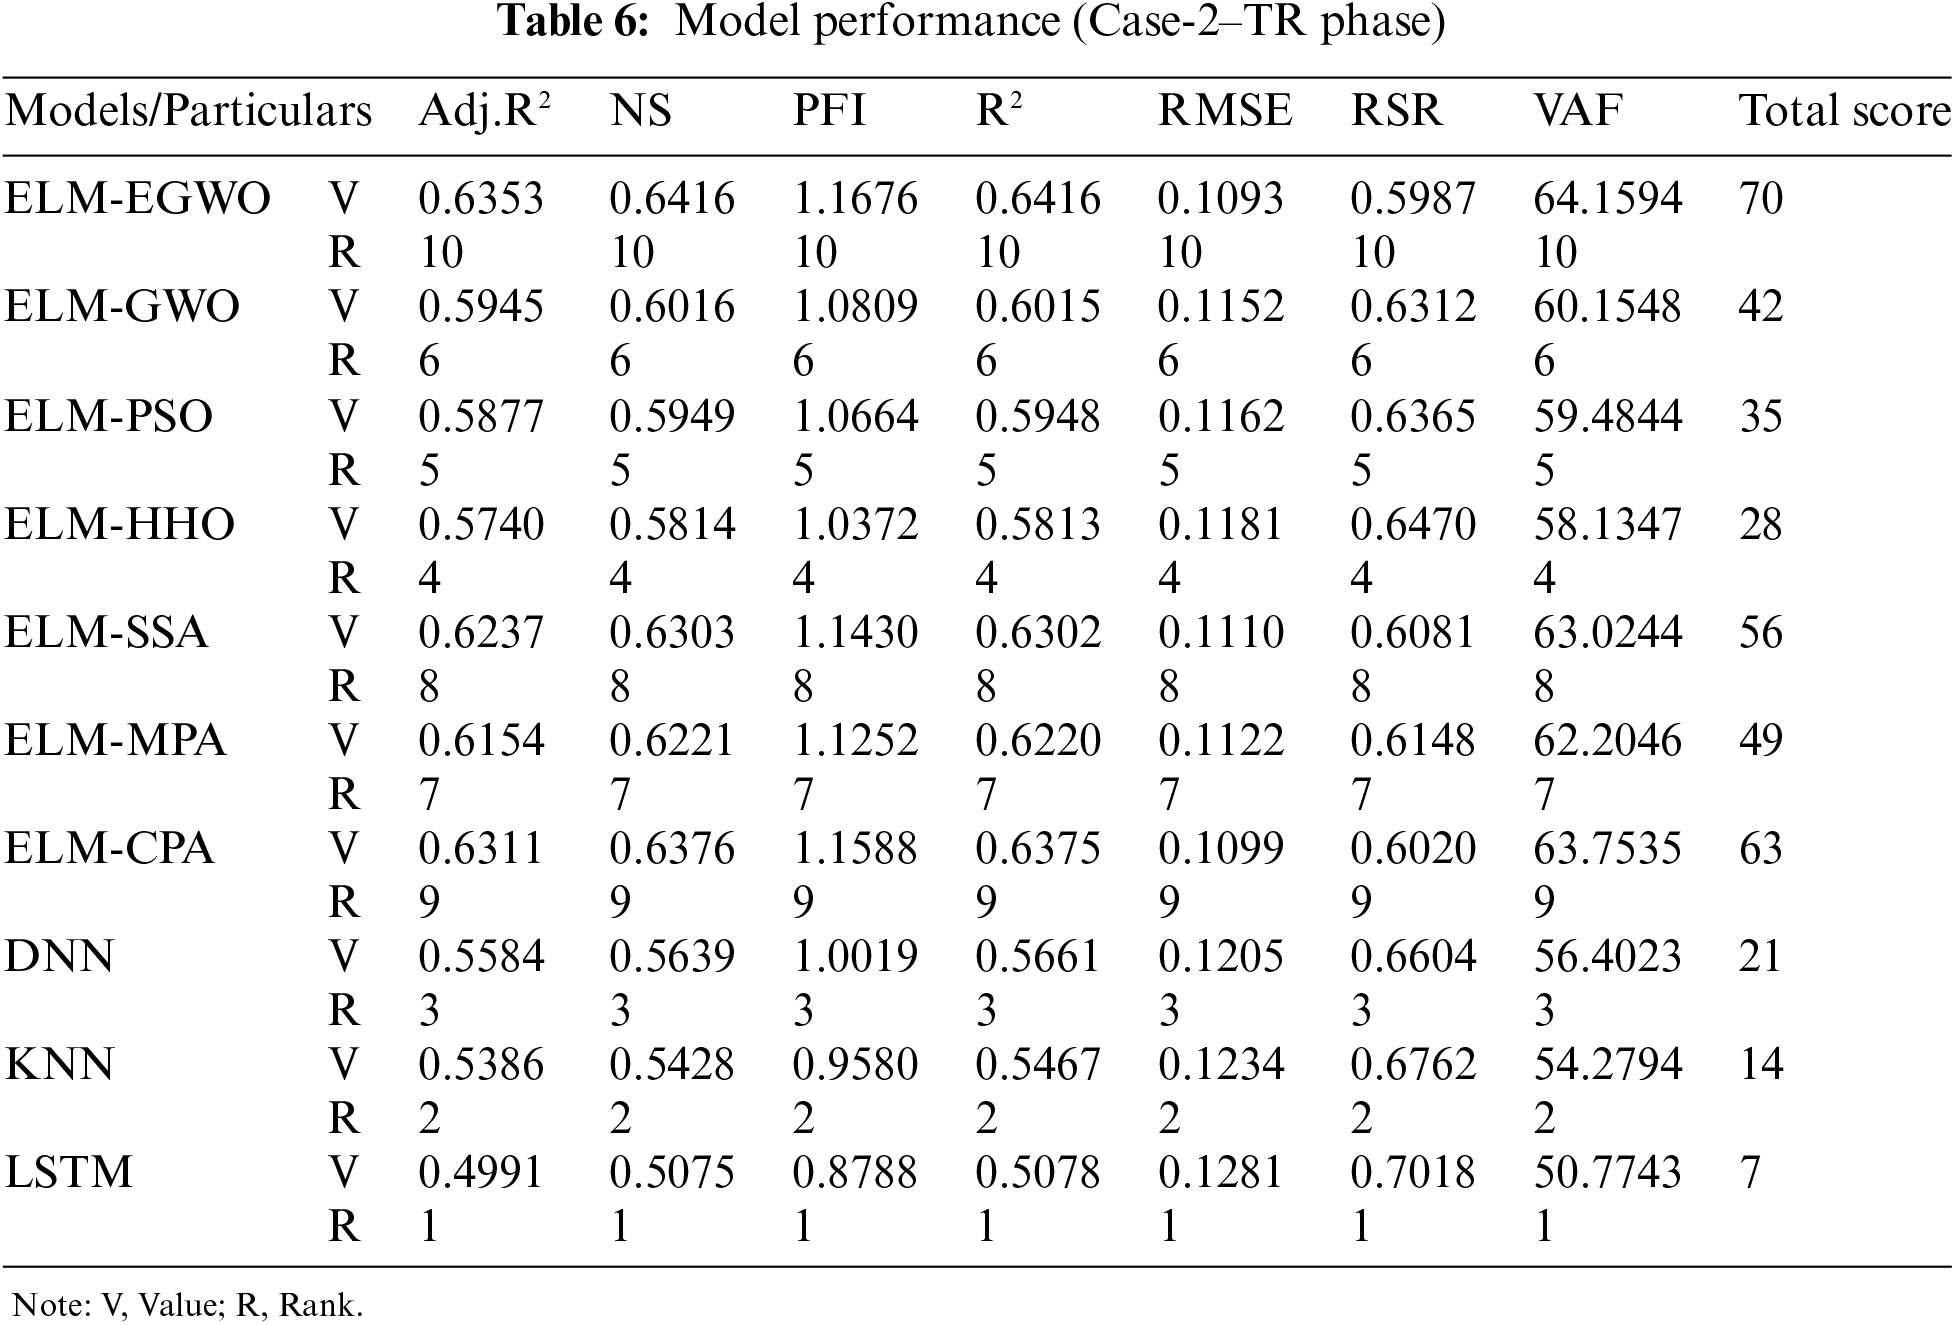
The results for all the constructed/employed paradigms for the estimation of CS of MK-contained cemented materials are given in Tables 5–7 for Cases-1, 2, and 3, respectively. Herein, the model performance along with their scores are summarized for the training subset. In accordance with the results of the R2 and RMSE measures, it is evident that the proposed ELM-EGWO reached its maximum precision in the training phase. In Cases-1, 2, and 3 of CS predictions, the R2 are 0.5834, 0.6416, and 0.7240, and the RMSE are 0.1178, 0.1093, and 0.0959, respectively. In all cases, the developed ELM-EGWO attained the highest total score of 70. The second-best model in Case-1 combination is ELM-PSO with a total score = 63, R2 = 0.5814 and RMSE = 0.1181, followed by ELM-MPA (total score = 56, R2 = 0.5773 and RMSE = 0.1187), ELM-CPA (total score = 49, R2 = 0.5768 and RMSE = 0.1187), and so on (see Table 5 for other models). The second-best model in Case-2 combination is ELM-CPA with total score = 63, R2 = 0.6375 and RMSE = 0.1099, followed by ELM-SSA (total score = 56, R2 = 0.6302 and RMSE = 0.1110), ELM-MPA (total score = 49, R2 = 0.6220 and RMSE = 0.1122), and so on (see Table 6 for other models). For Case-3 combination, the ELM-GWO (total score = 63, R2 = 0.6620 and RMSE = 0.1061) and ELM-MPA (total score = 56, R2 = 0.6555 and RMSE = 0.1071) were determined to be the second and third-best paradigms, respectively.
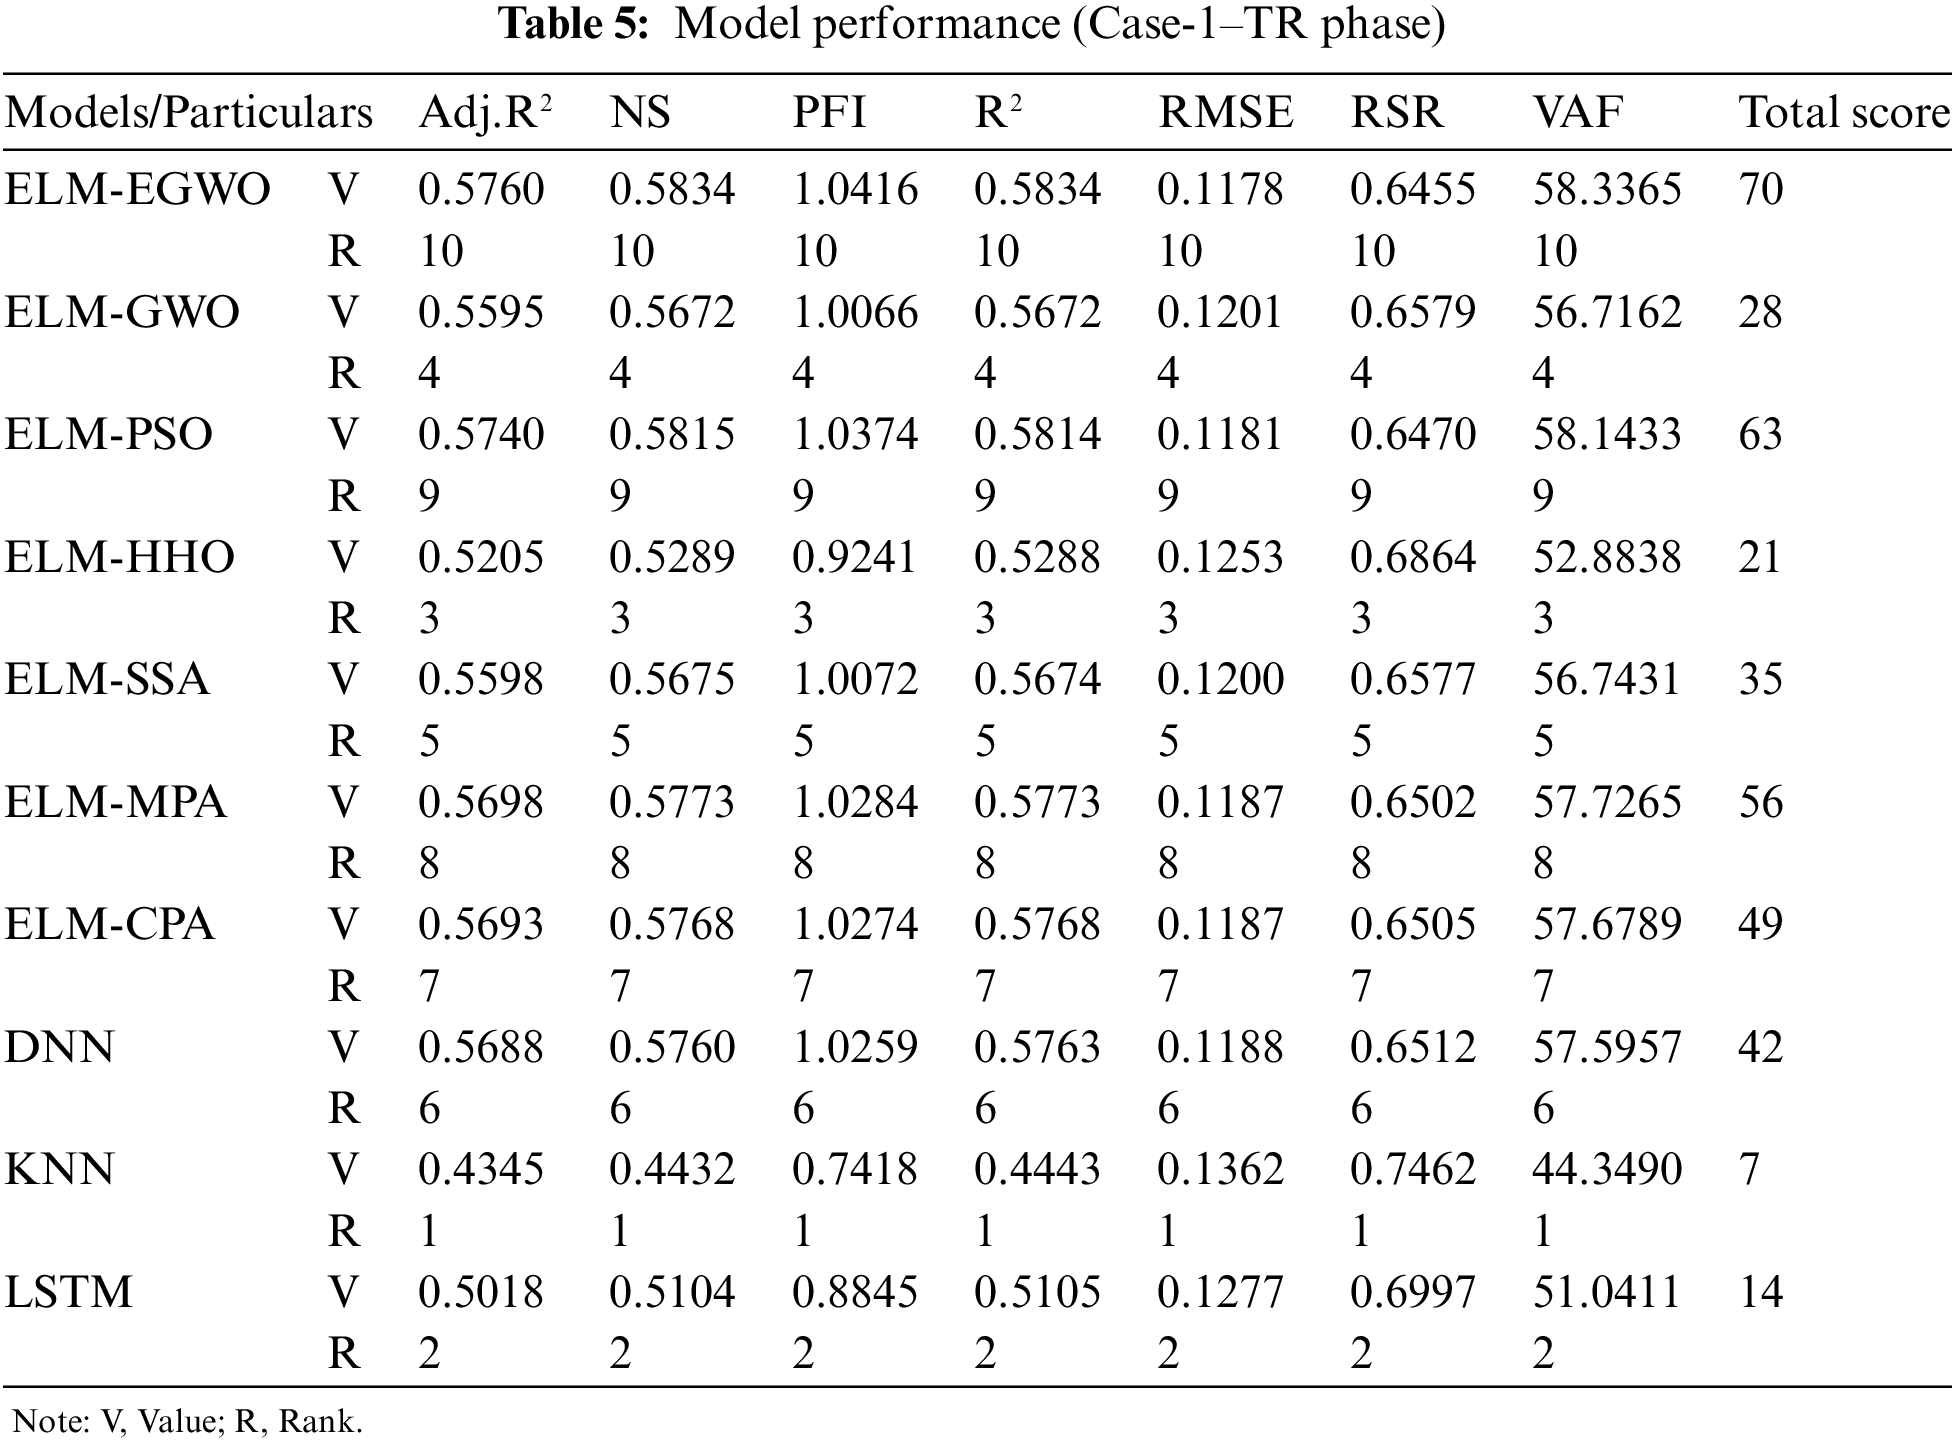

For a comparative assessment, all the developed/employed paradigms were ranked (as per R2 and RMSE criteria) and the details of the best three models are presented in Table 8. It is seen that the built ELM-EGWO attained the most precise estimation in all input combinations of CS prediction. Also, the R2 increased significantly from 0.5834 to 0.7240, indicating Case-3 input combination is the most effective one among the three combinations considered in this work. In Case-3, the RMSE index lower than 10% (RMSE = 0.0959, i.e., 9.59%) indicates that the proposed ELM-EGWO reached a good predictive performance. According to the total score in Case-3 combination, the performance of ELM-HHO (total score = 7), DNN (total score = 14), and ELM-PSO (total score = 21) models was found to be least effective. Among the standalone models, the LSTM model shows significant performance with total score = 32, R2 = 0.6245 and RMSE = 0.1124 in the Case-3 input combination of CS estimation. To better establish the performance of the best three prediction paradigms (as per RMSE index), illustrations of scatter plots are presented in Fig. 8. It is noteworthy that the performance matrices given in Tables 5–7 were determined via normalized values.
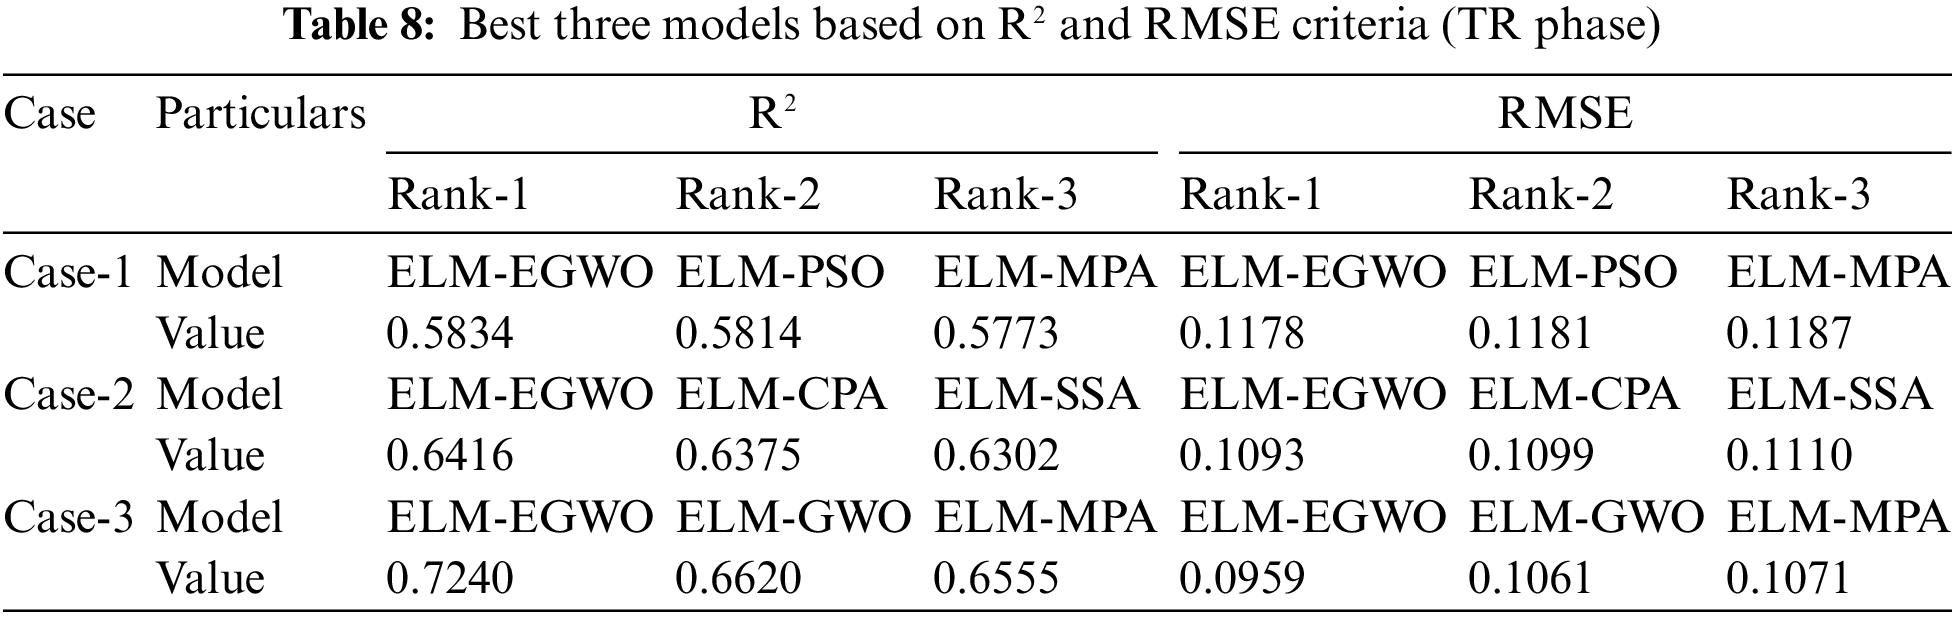


Figure 8: Scatter plots for TR subset (best three models in each case): (a–c) C1, (d–f) C2, and (g–i) C3 of CS prediction
After training the models on the same dataset, the testing subset was employed to corroborate them for all three input combinations in CS prediction. The model performance for the testing subset with normalized output values is given in Tables 9–11, respectively, for Cases-1, 2, and 3 combinations. Notably, the results of the testing subset were utilized to validate the estimation ability of the developed/employed models. According to the results, The constructed ELM-EGWO achieved the maximum precision in all cases of CS prediction, with optimal outcomes of R2 = 0.6751 and VAF = 64.5864 (Case-1), R2 = 0.7964 and VAF = 78.5611 (Case-2), and R2 = 0.8233 and VAF = 81.8112 (Case-3). In all cases, the developed ELM-EGWO attained the highest total score of 70.

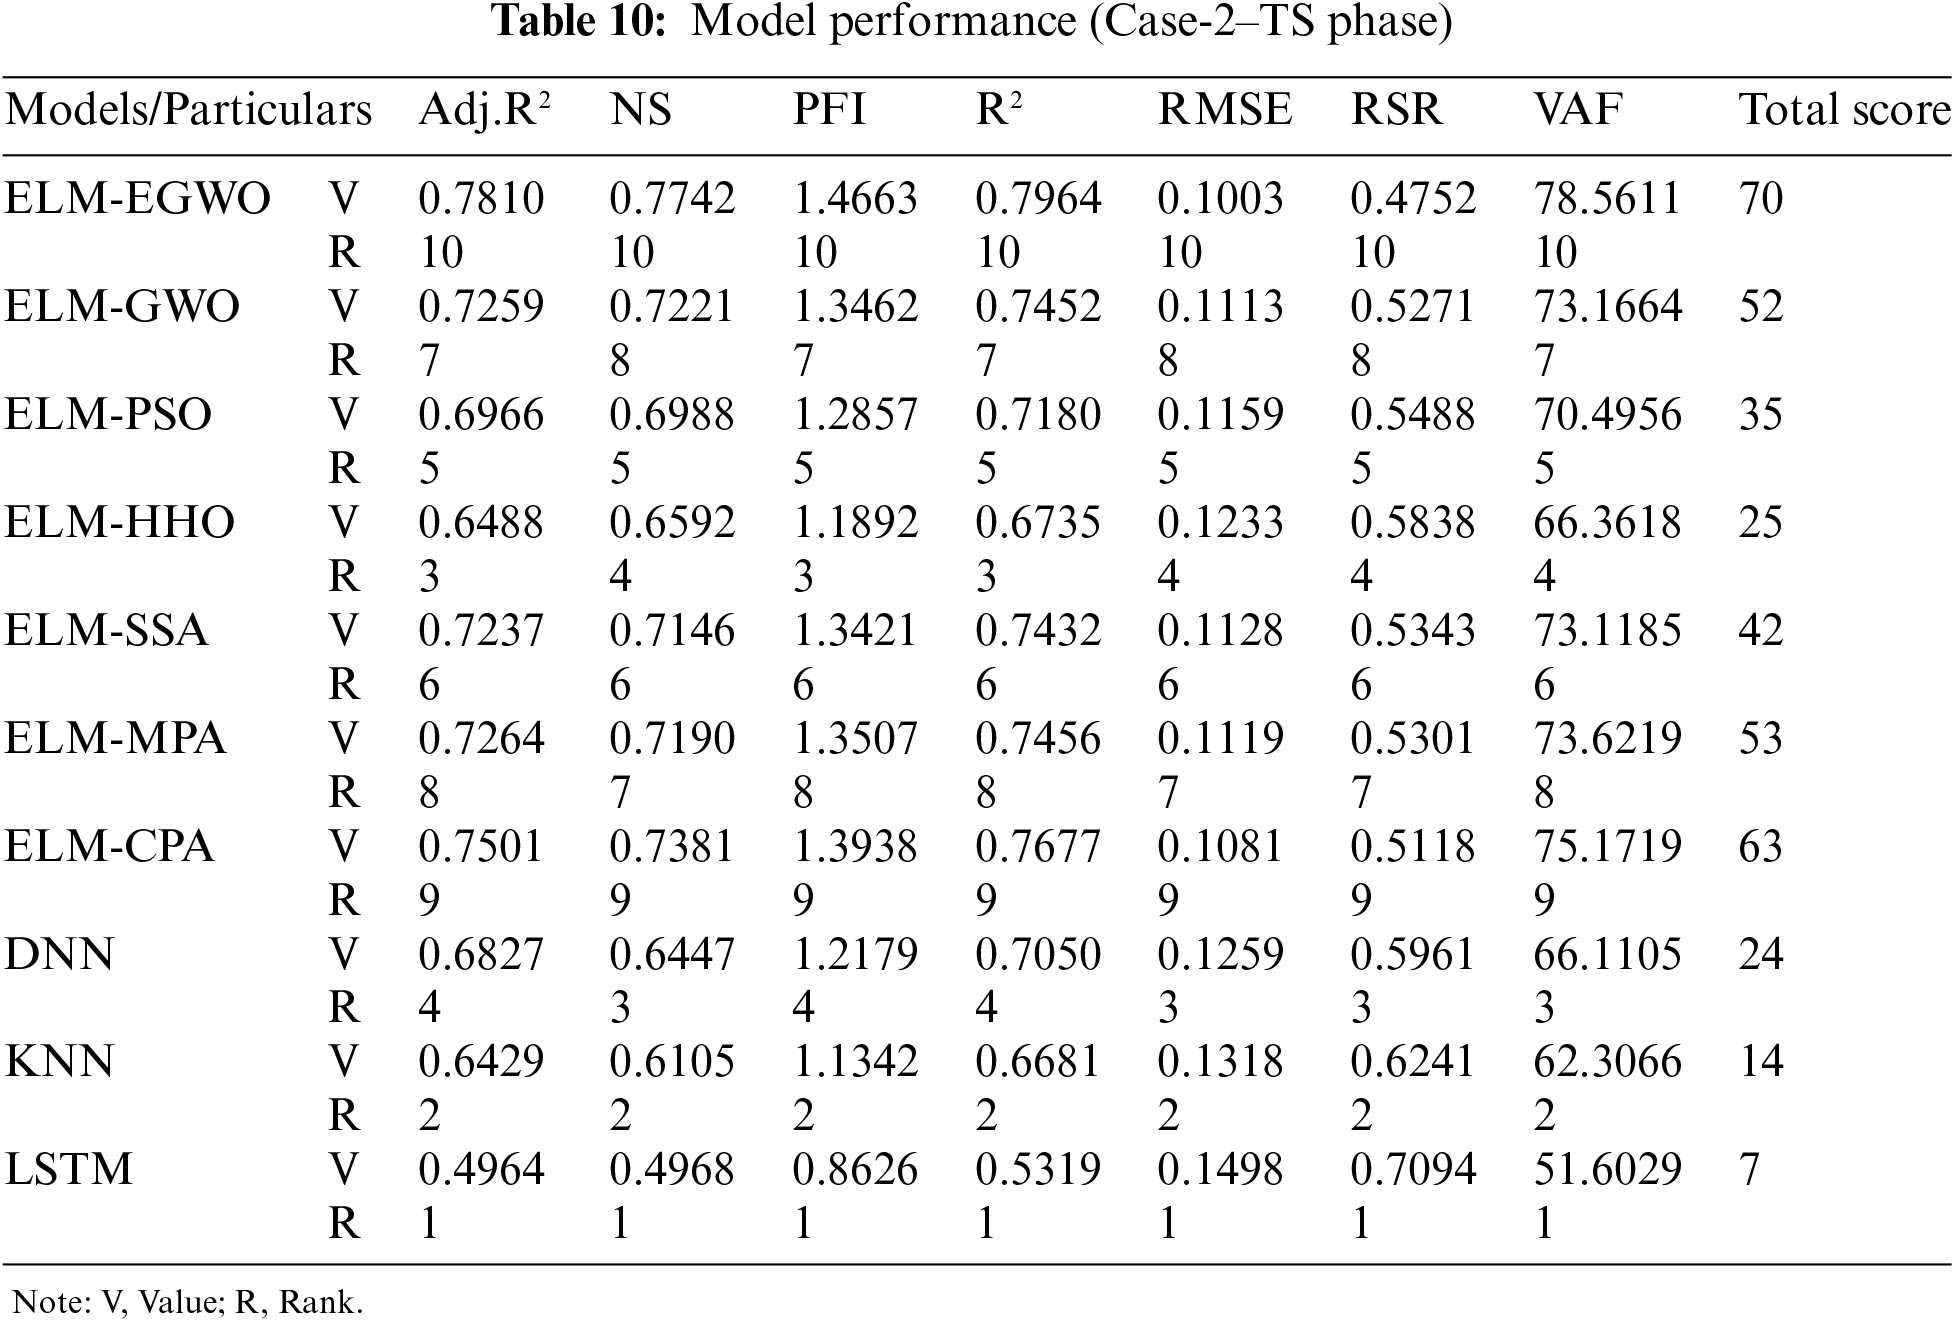
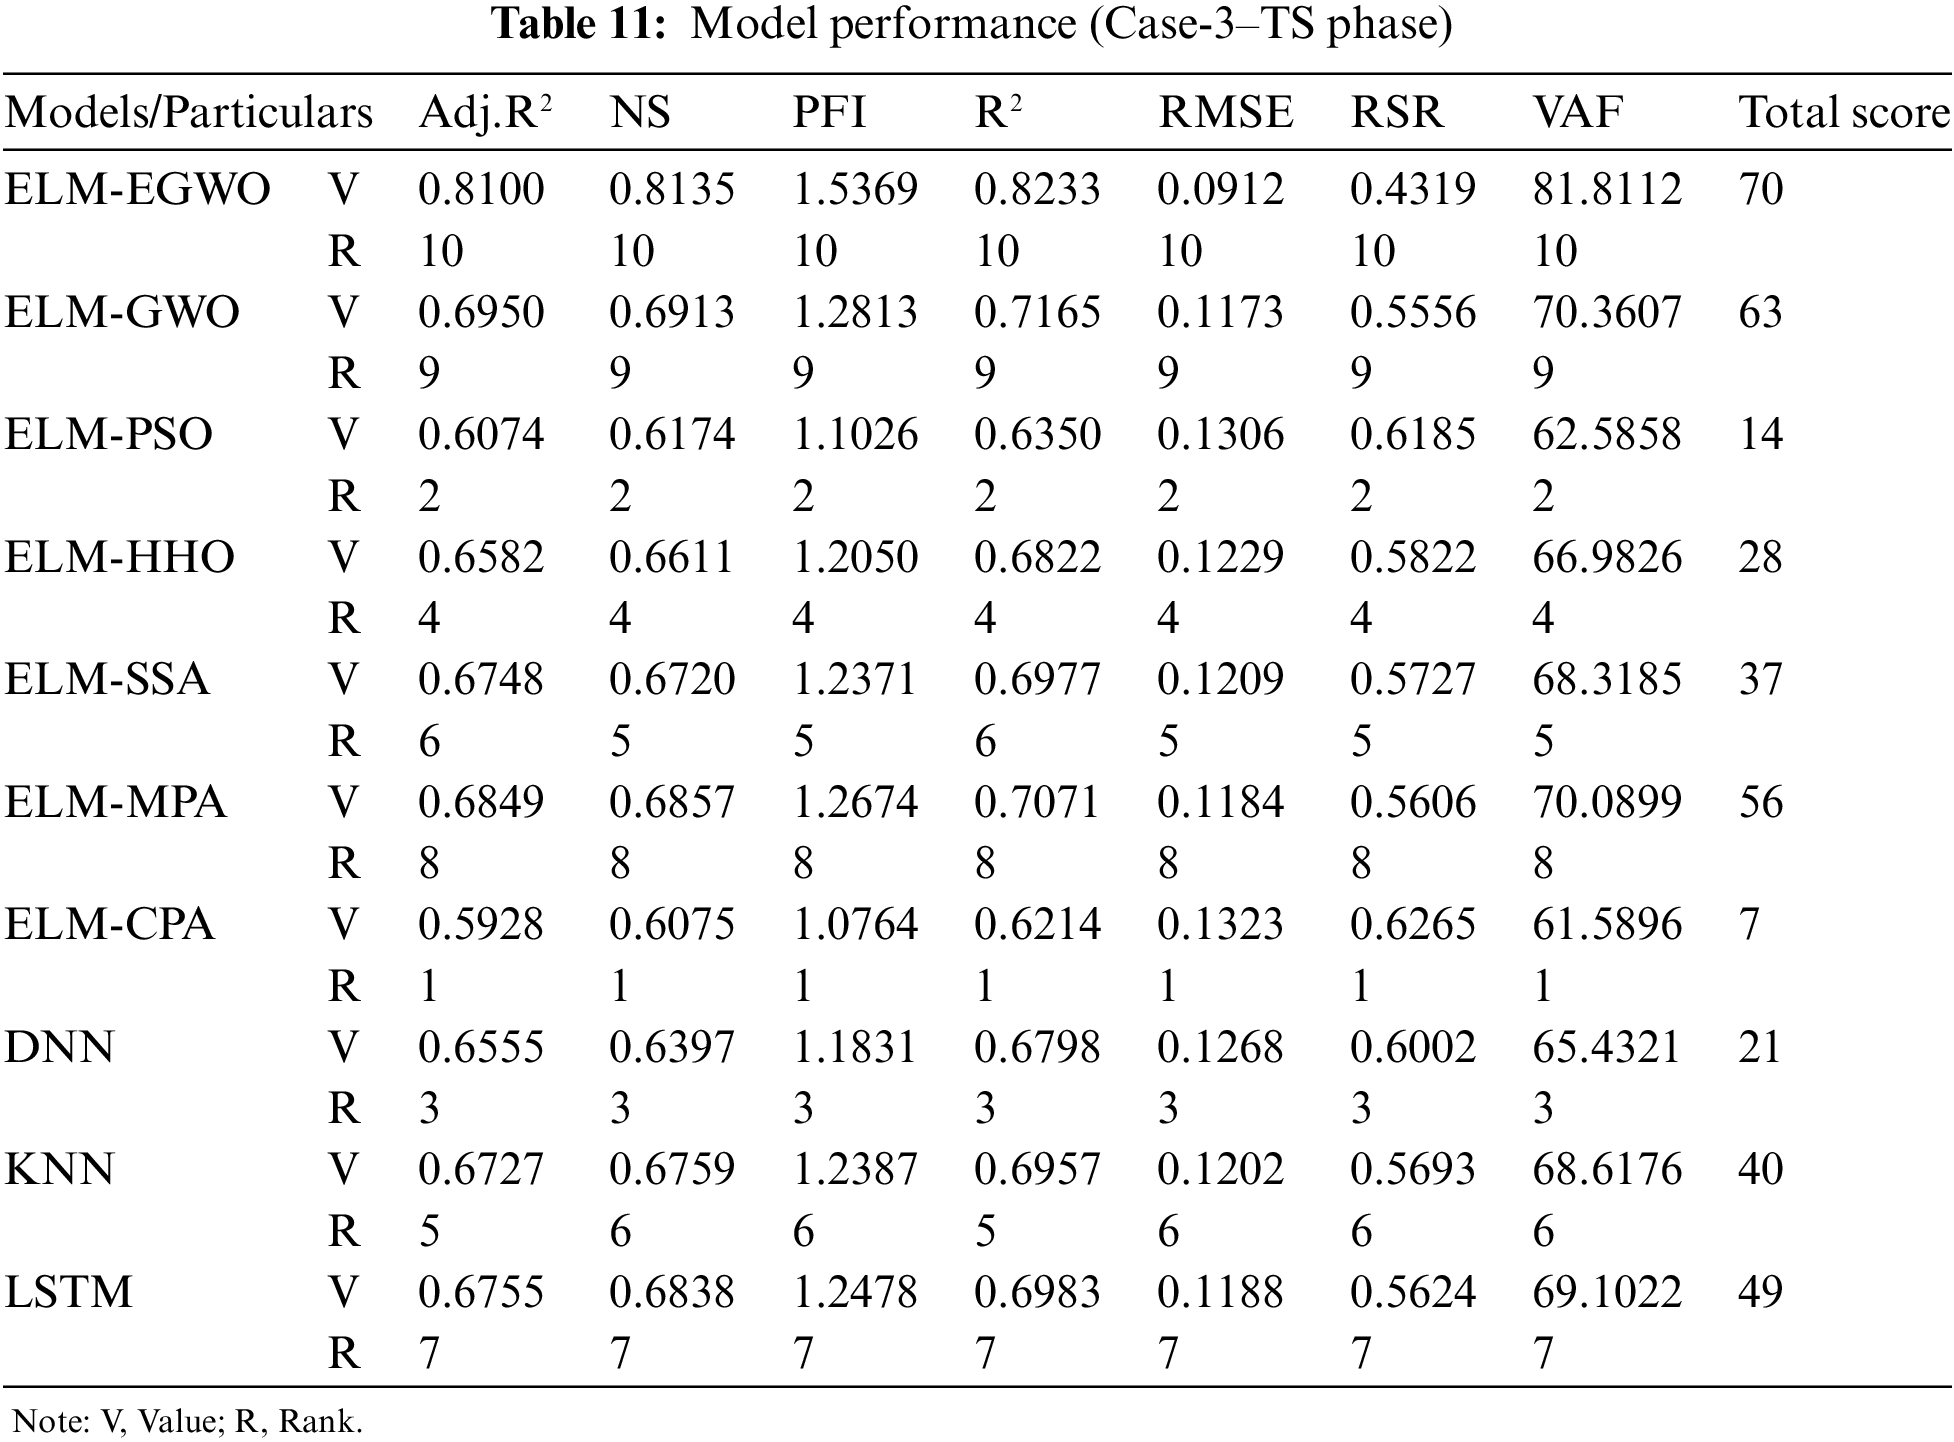
The second-best model for Case-1 combination is ELM-MPA with total score = 63, R2 = 0.6743 and RMSE = 0.1284, followed by ELM-CPA (total score = 56, R2 = 0.6740 and RMSE = 0.1285), ELM-PSO (total score = 49, R2 = 0.6704 and RMSE = 0.1290), and so on (see Table 9 for other models). The second-best model for Case-2 combination is ELM-CPA with total score = 63, R2 = 0.7677 and RMSE = 0.1081, followed by ELM-MPA (total score = 53, R2 = 0.7456 and RMSE = 0.1119), ELM-GWO (total score = 52, R2 = 0.7452 and RMSE = 0.1113), and so on (see Table 10 for other models). For Case-3 combination, the ELM-GWO (total score = 63, R2 = 0.7165 and RMSE = 0.1173) and ELM-MPA (total score = 56, R2 = 0.7071 and RMSE = 0.1184) were determined to be the 2nd and 3rd-best paradigms, respectively. Analogous to training results, all the developed/employed models were ranked for the testing subset, and the details of the top-three paradigms (as per R2 and RMSE values) are presented in Table 12, from which it is understood that the ELM-EGWO reached the most precise prediction in all cases of CS estimation. In the testing phase, the proposed ELM-EGWO led to better results in all cases, which indicates that EGWO acts better than the standard GWO when it comes to the prediction of CS of cemented materials containing metakaolin. The scatterplots in Fig. 9 illustrate the top three performing models (as per RMSE index) for each of the three input combinations.
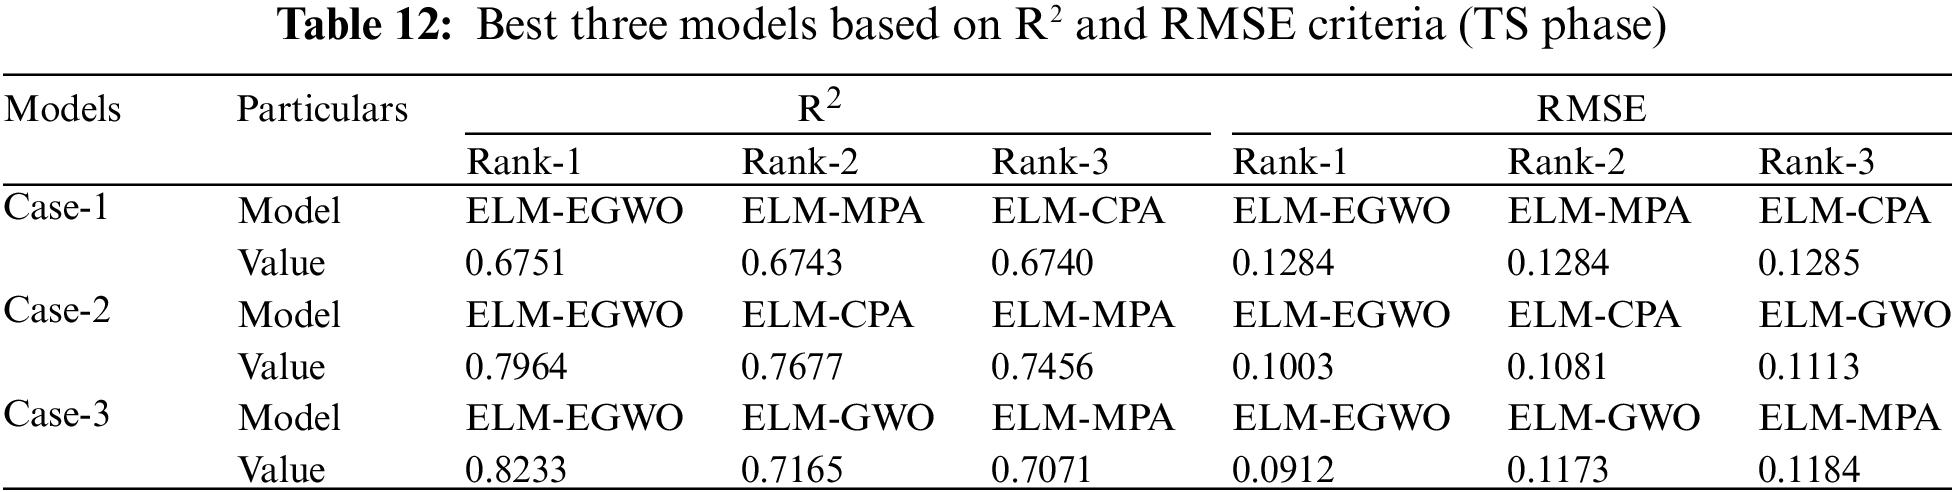


Figure 9: Scatter plots for TS subset (best three models in each case): (a–c) C1, (d–f) C2, and (g–i) C3 of CS prediction
5.3 Visual Interpretation of Results
In order to spot trends, patterns, and other insights, it is always preferable to offer a visual description of the gathered information rather than reading raw reports/data. Raw data is visualized using graphical representations, allowing users to easily explore the data and reveal profound insights. It permits one to grasp information quickly and effectively. Thus, to investigate the generalization ability of the generated/employed paradigms, visual interpretations of results are presented and discussed in this sub-section.
In this work, the performance of the developed/employed paradigms was examined using index scoring and Taylor diagram [71]. The model performance for the testing subset is only reported in this sub-section. Taylor diagram is a 2-D graphic that depicts the associations between the actual and expected variables in terms of three different matrices. In this figure, a model is usually depicted by a point, which should match with the point of reference for a perfect predictive model. On the other hand, during index scoring, the notion of rank analysis was utilized to rank the models based on performance matrices. All of the performance indicators were first transformed into % precision terms against each index and then ranked from 1 to m, where m (in this study m = 10) is the number of prediction models under consideration. On the basis of R2 index, the accuracy of the developed models (for Case-3 input combination) was found to be ELM-EGWO = 82.33%, ELM-GWO = 71.65%, ELM-PSO = 63.50%, ELM-HHO = 68.22%, ELM-SSA = 69.77%, ELM-MPA = 70.71%, ELM-CPA = 62.14%, DNN = 67.98%, KNN = 69.57%, and LSTM = 69.83%. Therefore, they can be ranked by assigning a maximum rank of 10 to the model with the greatest R2 value and a rank of 1 to the model with the poorest R2 value. The ELM-EGWO model received a score of 10 for having the highest accuracy of 82.33% (R2 = 0.8233), while the ELM-CPA model received a score of 1 for having the lowest accuracy of 62.14% (R2 = 0.6214). The same steps were followed for other indicators. It should be noted that a model with the highest score of 70 (i.e., total number of models considered

Figure 10: Taylor diagram for the TS subset: (a–c) C1, (d–f) C2, and (g–i) C3 of CS prediction
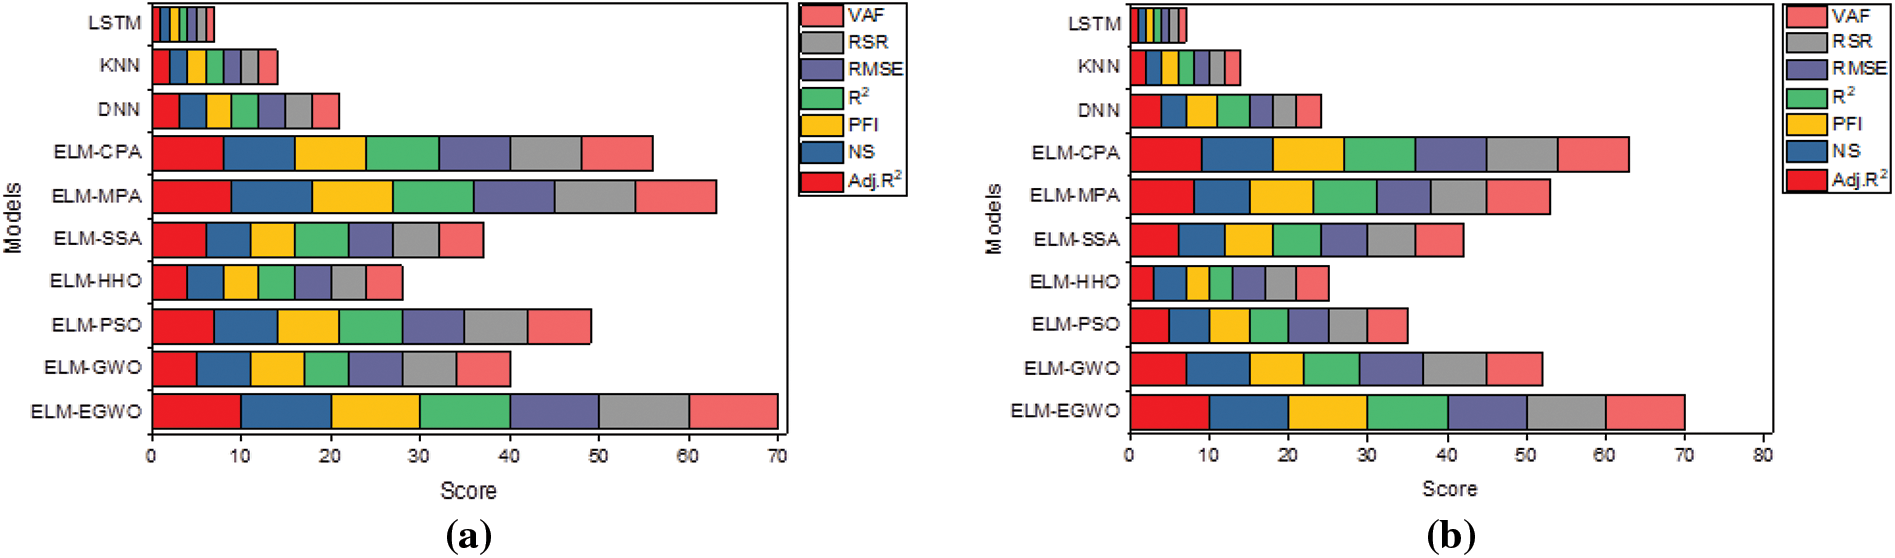

Figure 11: Illustration of index scoring: (a) C1, (b) C2, and (c) C3 of CS prediction
Notably, quantitative estimation of a data-driven model’s results is an important criterion for assessing its reliability in forecasting the desired output [72]. Therefore, uncertainty analysis (UA) was conducted in this work to undertake the quantitative evaluation of the prediction models’ errors. Herein, the results of the whole dataset are investigated. Since there are 72 real-life records in the dataset, it is significant to compare the results of predictions to see how reliable the developed/employed models are. In UA, the error (
where
Note that, WCB represents a range of errors in which approximately 95% of the data reside. Table 13 reports the UA results for all four input combinations of CS prediction. One can evaluate the model performance based on the WCB value presented in Table 13. It is noteworthy that smaller WCB represents higher certainties, i.e., the model is subjected to a smaller error level, and it can predict with higher precision. In accordance with the UA results, ELM-EGWO recorded the minimum WCB and mean absolute error (MAE) values of 0.0434 and 0.0891, 0.0306 and 0.0762, and 0.0286 and 0.0678, respectively, in Cases-1, 2, and 3 combinations. In addition, smaller quantities of ME, SE, and SD are rendered as higher reliability for ELM-EGWO compared to the other suggested models. For a quick assessment, all of the models were ranked by their WCB value. MAE and SD were used to rank a model with the same WCB value. It is seen that the proposed ELM-EGWO is the most reliable model (secured first rank) in all cases. A comparison of the developed hybrid ELMs with DNN, KNN, and LSTM shows that the LSTM and DNN have the highest WCB value among all models. Nonetheless, based on the outcomes presented in Table 13, the proposed ELM-EGWO can be considered reliable in predicting the CS of cemented materials containing metakaolin. However, for a better comparison, the UA results are presented in Fig. 12.
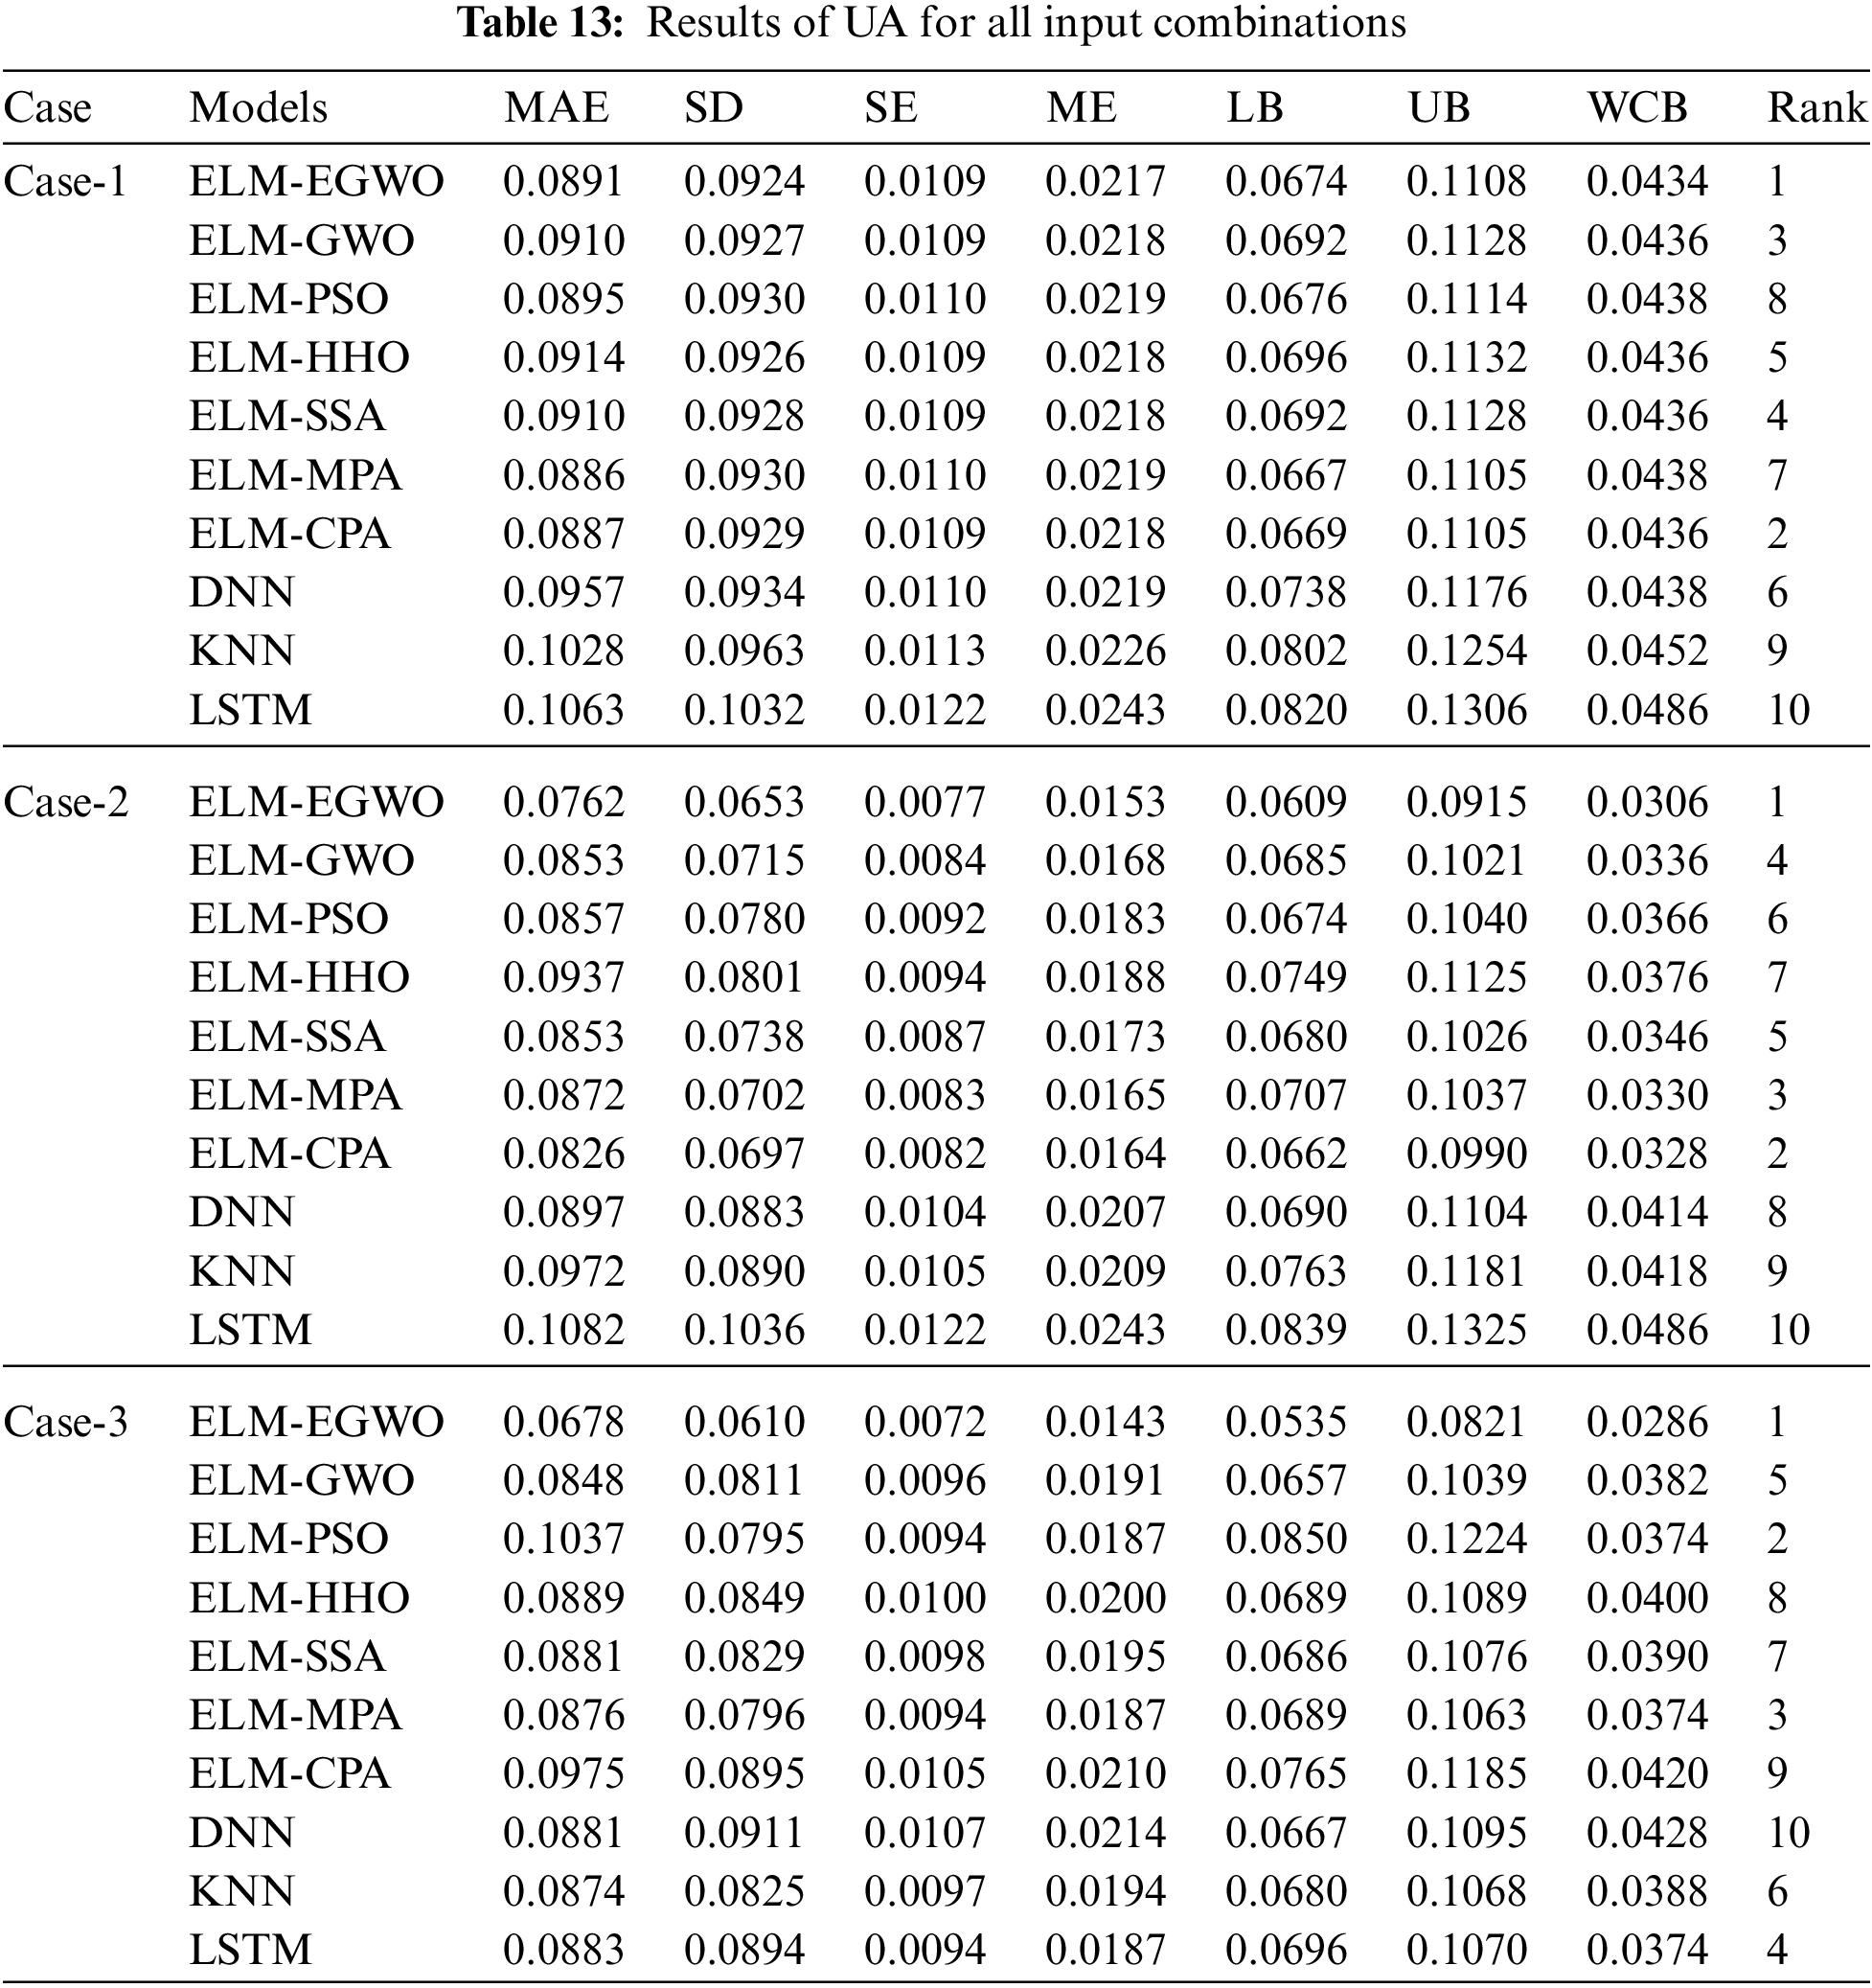

Figure 12: Bar plot of UA for all combinations of CS prediction
Furthermore, the monotonicity analysis was used to test the viability of the proposed ELM-EGWO model for different input parameters of MK-contained cemented materials. Notably, overfitting is a common problem encountered during the mathematical simulation of datasets. This means that a model may succeed in an excellent simulation of data used for its development and training, but at the same time predict extremely unusual behavior for other datasets. Hence, it is worth assessing the overall behavior of the optimum models with regard to their expected behavior in terms of the estimated parameter. Thus, the purpose of this investigation was to see if the proposed ELM-EGWO model is capable of developing the necessary trend between various inputs and CS. For this purpose, one input parameter was changed monotonically, while the other inputs were kept constant at their mean values (as presented in Table 1), resulting in a simulated dataset (details tabulated in Table 14). The variation of the anticipated CS with various input parameters can be identified using the ELM-EGWO model. The changing range of the input parameters cannot exceed the range defined by its minimum and maximum values during the monotonicity computation, as presented in Table 1. Figs. 13a–13o show the variation of the predicted CS value with all the influential variables. As can be seen, the predicted CS decreases as W/B, and B/S increase whereas the CS increases with the increase of M value. However, the value of CS rises initially and then declines when the MK/B and SP rise. These variations are consistent with the theoretical trend for the CS value against each input parameter, implying the correctness of the proposed ELM-EGWO model.
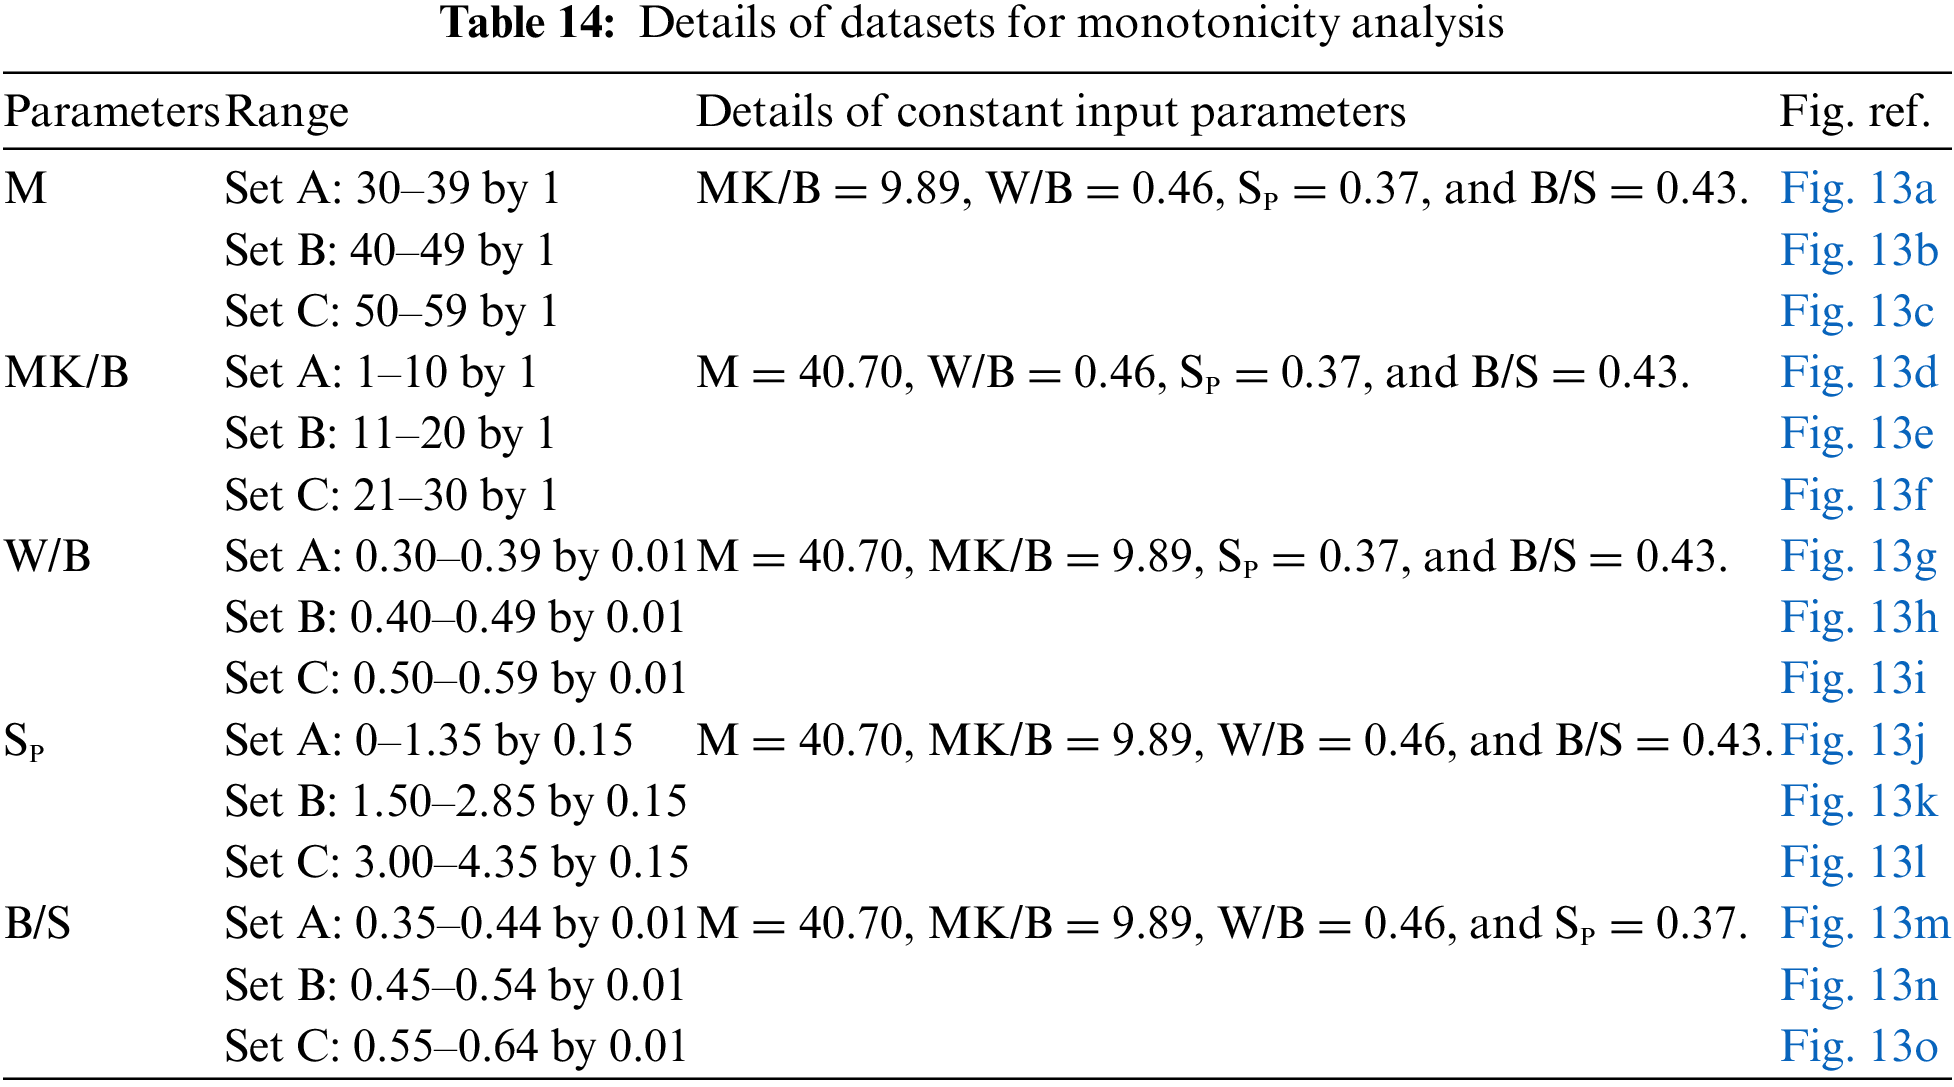
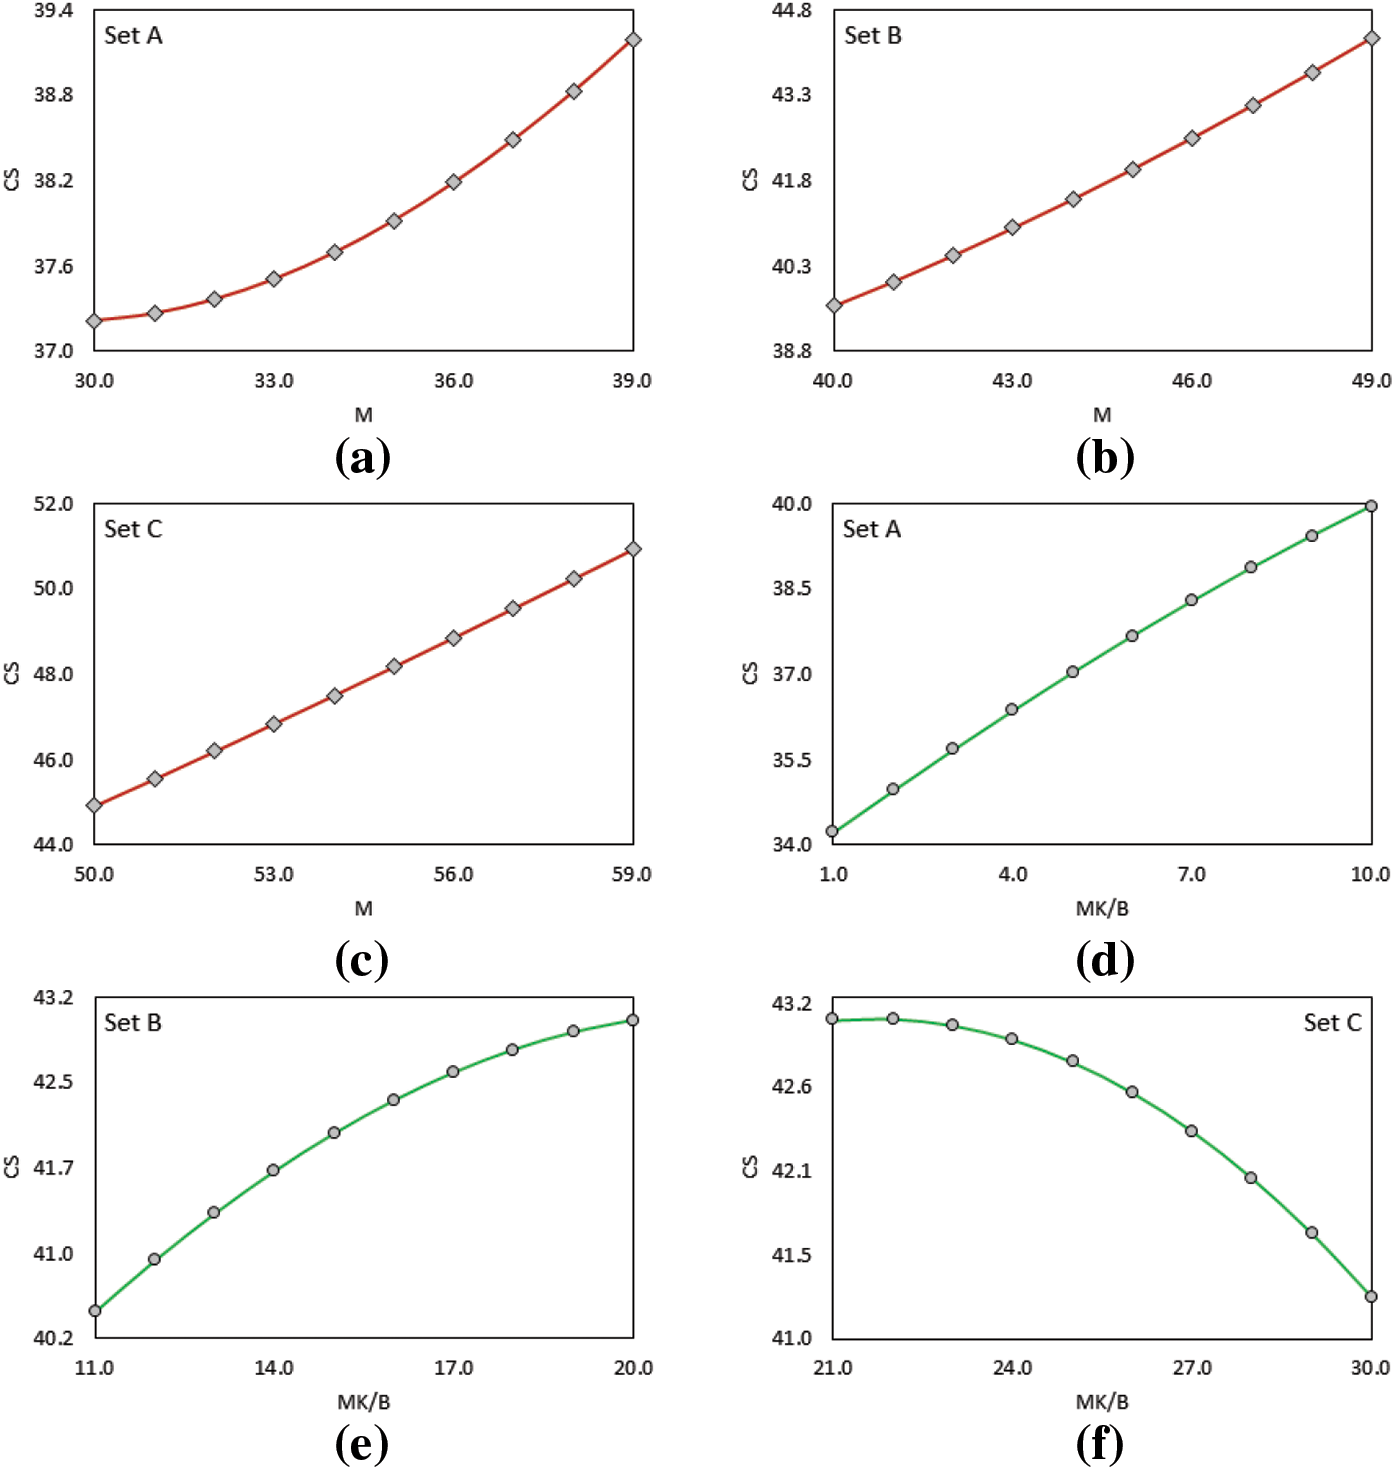

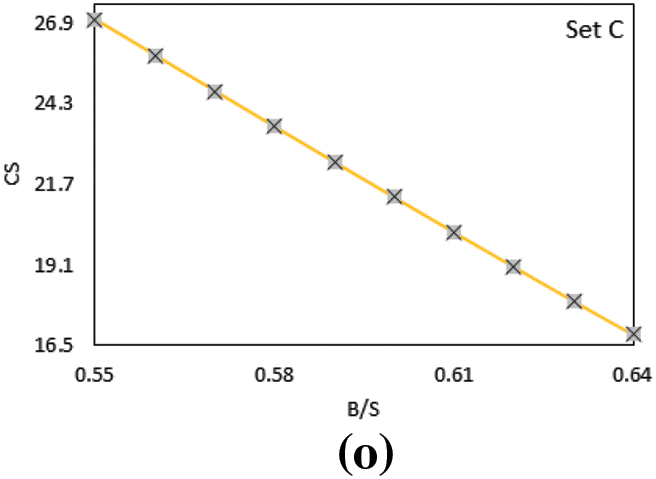
Figure 13: Illustration of monotonicity analysis
A thorough examination of the prediction outcomes of the proposed ELM-EGWO model in estimating CS of cemented materials containing metakaolin is provided in the above sub-sections. In this work, three distinct input parameter combinations were chosen for model construction and validation. The ELM-EGWO model appears to be the most successful based on the results of RMSE, R2, and other performance metrics. The said model also attained the requisite predicted accuracy in Case-3 combination. Using UA, the reliability of the proposed/employed models was assessed. The ELM-EGWO model was determined to be most reliable in Case-3 combination (WCB = 0.0286) when the produced models were evaluated using the WCB value. Note that, the uncertainty evaluation was done only based on the testing dataset because a model with higher accuracy during the validation phase is deemed more resilient and should be recognized with greater confidence. It can also be seen from the results that the Case-3 input combination provided a stronger prediction model, implying that the parameters considered in this study had a significant effect on the CS of MK-contained materials. Moreover, the results of the monotonicity analysis verify the correctness and validity of the proposed ELM-EGWO model. Based on the results of monotonicity analysis, engineers and practitioners can attain the desired CS value by adjusting the proportions of different influential parameters. However, it may be noted that the effects of different parameters presented in Fig. 13 may differ during the course of manufacturing different-grade cemented materials.
This research proposes a novel hybrid model, ELM-EGWO, for estimating the CS of MK-contained cemented materials. To create and evaluate the constructed ELM-EGWO model, three distinct combinations of influencing parameters were investigated based on SA. Experimental results indicate that the developed ELM-EGWO obtained the most precise CS value when all the input parameters, i.e., combination Case-3, were considered as influencing factors. Precisely, the ELM-EGWO performed better than other hybrid ELMs and standalone models in the testing phase with R2 = 0.6751 in Case-1, R2 = 0.7964, and R2 = 0.8233 in Case-3 combinations of CS prediction. Overall, the experimental findings show that the newly suggested ELM-EGWO model has strong potential to estimate the CS of cemented materials containing metakaolin with a high degree of accuracy and robustness.
One of the key advantages of the proposed ELM-EGWO had the highest predation accuracy, demonstrating EGWO’s superiority over the standard GWO and other MHs employed in this work. The proposed ELM-EGWO model also offers a faster convergence rate, which is a significant benefit. In addition, the findings of monotonicity analysis will enable researchers/practitioners to design concrete by changing the mix proportions of MK and superplasticizers as per their requirements. This will lead engineers/practitioners to implement a sustainable concept without affecting the desired strength of concrete. However, the future scope might include (a) a thorough evaluation of the ELM-EGWO and other hybrid ANN, SVM, and ANFIS models constructed with EGWO in predicting CS of MK-contained concrete and cemented materials; (b) a comparison of the proposed ELM-EGWO to other hybrid models constructed with evolutionary and physics-based MHs, and (c) implementation of shapley additive explanations (SHAP) methods or partial dependency graphs to obtained optimized results of parametric analysis. Nonetheless, as per the authors’ knowledge, this is the first research to estimate the CS of cemented materials containing metakaolin using a hybrid ELM paradigm created with an enhanced version of an SI algorithm.
Acknowledgement: None.
Funding Statement: This study is supported via funding from Prince Sattam Bin Abdulaziz University Project Number (PSAU/2023/R/1445).
Author Contributions: The authors confirm contribution to the paper as follows: study conception and design: A. B.; data collection: A. B.; analysis and interpretation of results: A. B.; draft manuscript preparation: A. B., R. K. S., M. A., S. A. A. All authors reviewed the results and approved the final version of the manuscript.
Availability of Data and Materials: The details of employed dataset are mentioned in the manuscript.
Conflicts of Interest: The authors declare that they have no conflicts of interest to report regarding the present study.
References
1. Asteris, P. G., Lourenço, P. B., Roussis, P. C., Adami, C. E., Armaghani, D. J. et al. (2022). Revealing the nature of metakaolin-based concrete materials using artificial intelligence techniques. Construction and Building Materials, 322, 126500. [Google Scholar]
2. Huang, H., Li, M., Yuan, Y., Bai, H. (2022). Theoretical analysis on the lateral drift of precast concrete frame with replaceable artificial controllable plastic hinges. Journal of Building Engineering, 62, 105386. [Google Scholar]
3. Guo, M., Huang, H., Zhang, W., Xue, C., Huang, M. (2022). Assessment of RC frame capacity subjected to a loss of corner column. Journal of Structural Engineering, 148(9), 04022122. [Google Scholar]
4. Huang, H., Huang, M., Zhang, W., Guo, M., Chen, Z. et al. (2021). Progressive collapse resistance of multistory RC frame strengthened with HPFL-BSP. Journal of Building Engineering, 43, 103123. [Google Scholar]
5. Huang, H., Huang, M., Zhang, W., Guo, M., Liu, B. (2022). Progressive collapse of multistory 3D reinforced concrete frame structures after the loss of an edge column. Structure and Infrastructure Engineering, 18(2), 249–265. [Google Scholar]
6. Zhang, W., Liu, X., Huang, Y., Tong, M. N. (2022). Reliability-based analysis of the flexural strength of concrete beams reinforced with hybrid BFRP and steel rebars. Archives of Civil and Mechanical Engineering, 22(4), 171. [Google Scholar]
7. Abedini, M., Zhang, C. (2022). Residual capacity assessment of post-damaged RC columns exposed to high strain rate loading. Steel and Composite Structures, 45(3), 389–408. [Google Scholar]
8. Li, D., Nie, J. H., Wang, H., Yan, J. B., Hu, C. X. et al. (2023). Damage location, quantification and characterization of steel-concrete composite beams using acoustic emission. Engineering Structures, 283, 115866. [Google Scholar]
9. Jin, M., Ma, Y., Li, W., Huang, J., Yan, Y. et al. (2023). Multi-scale investigation on composition-structure of C-(A)-SH with different Al/Si ratios under attack of decalcification action. Cement and Concrete Research, 172, 107251. [Google Scholar]
10. Huang, J., Zhou, M., Yuan, H., Sabri, M. M. S., Li, X. (2022). Prediction of the compressive strength for cement-based materials with metakaolin based on the hybrid machine learning method. Materials, 15(10), 3500. [Google Scholar] [PubMed]
11. Ren, J., Xu, Y., Huang, J., Wang, Y., Jia, Z. (2021). Gradation optimization and strength mechanism of aggregate structure considering macroscopic and mesoscopic aggregate mechanical behaviour in porous asphalt mixture. Construction and Building Materials, 300, 124262. [Google Scholar]
12. Huang, J., Li, X., Zhang, J., Sun, Y., Ren, J. (2022). Determining the Rayleigh damping parameters of flexible pavements for finite element modeling. Journal of Vibration and Control, 28(21–22), 3181–3194. [Google Scholar]
13. Caldarone, M. A., Gruber, K. A., Burg, R. G. (1994). High reactivity metakaolin (HRMA new generation mineral admixture for high performance concrete. Concrete International, 16(11), 37–41. [Google Scholar]
14. Biljana, I., Aleksandra, M., Ljiljana, M. (2010). Thermal treatment of kaolin clay to obtain metakaolin. Hemijska Industrija , 64(4), 351–356. [Google Scholar]
15. Siddique, R., Klaus, J. (2009). Influence of metakaolin on the properties of mortar and concrete: A review. Applied Clay Science, 43(3–4), 392–400. [Google Scholar]
16. Chandak, M. A., Pawade, P. Y. (2018). Influence of metakaolin in concrete mixture: A review. The International Journal of Engineering and Science (IJES), 37–41. [Google Scholar]
17. Liu, Z., Takasu, K., Koyamada, H., Suyama, H. (2022). A study on engineering properties and environmental impact of sustainable concrete with fly ash or GGBS. Construction and Building Materials, 316, 125776. [Google Scholar]
18. Prabakar, J., Dendorkar, N., Morchhale, R. K. (2004). Influence of fly ash on strength behavior of typical soils. Construction and Building Materials, 18(4), 263–267. [Google Scholar]
19. Murthy, A. R., Ganesh, P., Kumar, S. S., Iyer, N. R. (2015). Fracture energy and tension softening relation for nano-modified concrete. Structural Engineering and Mechanics, 54(6), 1201–1216. [Google Scholar]
20. Li, G., Sun, Y., Qi, C. (2021). Machine learning-based constitutive models for cement-grouted coal specimens under shearing. International Journal of Mining Science and Technology, 31(5), 813–823. [Google Scholar]
21. Villarroya, S., Baumann, P. (2020). On the integration of machine learning and array databases. IEEE 36th International Conference on Data Engineering (ICDE), pp. 1786–1789. Dallas, TX, USA, IEEE. https://doi.org/10.1109/ICDE48307.2020.00170 [Google Scholar] [CrossRef]
22. Özcan, F., Atiş, C. D., Karahan, O., Uncuoğlu, E., Tanyildizi, H. (2009). Comparison of artificial neural network and fuzzy logic models for prediction of long-term compressive strength of silica fume concrete. Advances in Engineering Software, 40(9), 856–863. [Google Scholar]
23. Sarıdemir, M. (2009). Prediction of compressive strength of concretes containing metakaolin and silica fume by artificial neural networks. Advances in Engineering Software, 40(5), 350–355. [Google Scholar]
24. Sarıdemir, M. (2009). Predicting the compressive strength of mortars containing metakaolin by artificial neural networks and fuzzy logic. Advances in Engineering Software, 40(9), 920–927. [Google Scholar]
25. Gilan, S. S., Jovein, H. B., Ramezanianpour, A. A. (2012). Hybrid support vector regression-Particle swarm optimization for prediction of compressive strength and RCPT of concretes containing metakaolin. Construction and Building Materials, 34, 321–329. [Google Scholar]
26. Moradi, M. J., Khaleghi, M., Salimi, J., Farhangi, V., Ramezanianpour, A. M. (2021). Predicting the compressive strength of concrete containing metakaolin with different properties using ANN. Measurement, 183, 109790. [Google Scholar]
27. Joshi, H., Arora, S. (2017). Enhanced grey wolf optimization algorithm for global optimization. Fundamenta Informaticae, 153(3), 235–264. [Google Scholar]
28. Asteris, P. G., Lemonis, M. E., Nguyen, T. A., Le, H. V., Pham, B. T. (2021). Soft computing-based estimation of ultimate axial load of rectangular concrete-filled steel tubes. Steel and Composite Structures, 39(4), 471–491. [Google Scholar]
29. Bardhan, A., Biswas, R., Kardani, N., Iqbal, M., Samui, P. et al. (2022). A novel integrated approach of augmented grey wolf optimizer and ANN for estimating axial load carrying-capacity of concrete-filled steel tube columns. Construction and Building Materials, 337, 127454. [Google Scholar]
30. Koopialipoor, M., Tootoonchi, H., Jahed Armaghani, D., Tonnizam Mohamad, E., Hedayat, A. (2019). Application of deep neural networks in predicting the penetration rate of tunnel boring machines. Bulletin of Engineering Geology and the Environment, 78, 6347–6360. [Google Scholar]
31. Rahimi, I., Gandomi, A. H., Asteris, P. G., Chen, F. (2021). Analysis and prediction of COVID-19 using SIR, SEIQR, and machine learning models: Australia, Italy, and UK Cases. Information, 12(3), 109. [Google Scholar]
32. Asteris, P. G., Douvika, M. G., Karamani, C. A., Skentou, A. D., Chlichlia, K. et al. (2020). A novel heuristic algorithm for the modeling and risk assessment of the COVID-19 pandemic phenomenon. Computer Modeling in Engineering & Sciences, 125(2), 815–828. https://doi.org/10.32604/cmes.2020.013280 [Google Scholar] [CrossRef]
33. Kennedy, J., Eberhart, R. (1995). Particle swarm optimization. Proceedings of ICNN’95-International Conference on Neural Networks, vol. 4, pp. 1942–1948. Perth, WA, Australia, IEEE. https://doi.org/10.1109/ICNN.1995.488968 [Google Scholar] [CrossRef]
34. Heidari, A. A., Mirjalili, S., Faris, H., Aljarah, I., Mafarja, M. et al. (2019). Harris hawks optimization: Algorithm and applications. Future Generation Computer Systems, 97, 849–872. [Google Scholar]
35. Mirjalili, S., Gandomi, A. H., Mirjalili, S. Z., Saremi, S., Faris, H. et al. (2017). Salp swarm algorithm: A bio-inspired optimizer for engineering design problems. Advances in Engineering Software, 114, 163–191. [Google Scholar]
36. Faramarzi, A., Heidarinejad, M., Mirjalili, S., Gandomi, A. H. (2020). Marine predators algorithm: A nature-inspired metaheuristic. Expert Systems with Applications, 152, 113377. [Google Scholar]
37. Tu, J., Chen, H., Wang, M., Gandomi, A. H. (2021). The colony predation algorithm. Journal of Bionic Engineering, 18, 674–710. [Google Scholar]
38. Huynh, H. D., Dang, L. M., Duong, D. (2017). A new model for stock price movements prediction using deep neural network. Proceedings of the 8th International Symposium on Information and Communication Technology, pp. 57–62. NhaTrangCity, VietNam. https://doi.org/10.1145/3155133.3155202 [Google Scholar] [CrossRef]
39. Wang, Y., Zou, R., Liu, F., Zhang, L., Liu, Q. (2021). A review of wind speed and wind power forecasting with deep neural networks. Applied Energy, 304, 117766. [Google Scholar]
40. Mladenović, D., Janković, S., Zdravković, S., Mladenović, S., Uzelac, A. (2022). Night traffic flow prediction using K-nearest neighbors algorithm. Operational Research in Engineering Sciences: Theory and Applications, 5(1), 152–168. [Google Scholar]
41. Rajani, N. F., Krause, B., Yin, W., Niu, T., Socher, R. et al. (2020). Explaining and improving model behavior with k nearest neighbor representations. arXiv preprint arXiv:2010.09030. [Google Scholar]
42. Fang, Z., Wang, Y., Peng, L., Hong, H. (2021). Predicting flood susceptibility using LSTM neural networks. Journal of Hydrology, 594, 125734. [Google Scholar]
43. Men, L., Ilk, N., Tang, X., Liu, Y. (2021). Multi-disease prediction using LSTM recurrent neural networks. Expert Systems with Applications, 177, 114905. [Google Scholar]
44. Huang, G. B., Zhu, Q. Y., Siew, C. K. (2006). Extreme learning machine: Theory and applications. Neurocomputing, 70(1–3), 489–501. [Google Scholar]
45. Fikret Kurnaz, T., Kaya, Y. (2018). The comparison of the performance of ELM, BRNN, and SVM methods for the prediction of compression index of clays. Arabian Journal of Geosciences, 11, 1–14. [Google Scholar]
46. Dash, Y., Mishra, S. K., Panigrahi, B. K. (2017). Rainfall prediction of a maritime state (KeralaIndia using SLFN and ELM techniques. International Conference on Intelligent Computing, Instrumentation and Control Technologies (ICICICT), pp. 1714–1718. Kerala, India, IEEE. https://doi.org/10.1109/ICICICT1.2017.8342829 [Google Scholar] [CrossRef]
47. Abd Elaziz, M., Dahou, A., Abualigah, L., Yu, L., Alshinwan, M. et al. (2021). Advanced metaheuristic optimization techniques in applications of deep neural networks: A review. Neural Computing and Applications, 33, 14079–14099. https://doi.org/10.1007/s00521-021-05960-5 [Google Scholar] [CrossRef]
48. Simon, D. (2008). Biogeography-based optimization. IEEE Transactions on Evolutionary Computation, 12(6), 702–713. [Google Scholar]
49. Storn, R., Price, K. (1997). Differential evolution-a simple and efficient heuristic for global optimization over continuous spaces. Journal of Global Optimization, 11, 341–359. [Google Scholar]
50. Yao, X., Liu, Y., Lin, G. (1999). Evolutionary programming made faster. IEEE Transactions on Evolutionary Computation, 3(2), 82–102. [Google Scholar]
51. Holland, J. H. (1992). Genetic algorithms. Scientific American, 267(1), 66–73. [Google Scholar]
52. Koza, J. R. (1994). Genetic programming as a means for programming computers by natural selection. Statistics and Computing, 4, 87–112. [Google Scholar]
53. Mirjalili, S., Mirjalili, S. M., Lewis, A. (2014). Grey wolf optimizer. Advances in Engineering Software, 69, 46–61. [Google Scholar]
54. Kaveh, A., Talatahari, S. (2010). A novel heuristic optimization method: Charged system search. Acta Mechanica, 213(3–4), 267–289. [Google Scholar]
55. Kaveh, A. (2014). Advances in metaheuristic algorithms for optimal design of structures, pp. 9–40. Switzerland: Springer International Publishing. [Google Scholar]
56. Rashedi, E., Nezamabadi-Pour, H., Saryazdi, S. (2009). GSA: A gravitational search algorithm. Information Sciences, 179(13), 2232–2248. [Google Scholar]
57. Tamura, K., Yasuda, K. (2011). Primary study of spiral dynamics inspired optimization. IEEJ Transactions on Electrical and Electronic Engineering, 6(S1), S98–S100. [Google Scholar]
58. Eskandar, H., Sadollah, A., Bahreininejad, A., Hamdi, M. (2012). Water cycle algorithm–A novel metaheuristic optimization method for solving constrained engineering optimization problems. Computers & Structures, 110, 151–166. [Google Scholar]
59. Kashan, A. H. (2009). League championship algorithm: A new algorithm for numerical function optimization. International Conference of Soft Computing and Pattern Recognition, pp. 43–48. Malacca, Malaysia, IEEE. https://doi.org/10.1109/SoCPaR.2009.21 [Google Scholar] [CrossRef]
60. Moosavian, N., Roodsari, B. K. (2014). Soccer league competition algorithm: A novel meta-heuristic algorithm for optimal design of water distribution networks. Swarm and Evolutionary Computation, 17, 14–24. [Google Scholar]
61. Liu, Z. Z., Chu, D. H., Song, C., Xue, X., Lu, B. Y. (2016). Social learning optimization (SLO) algorithm paradigm and its application in QoS-aware cloud service composition. Information Sciences, 326, 315–333. [Google Scholar]
62. Dai, C., Zhu, Y., Chen, W. (2007). Seeker optimization algorithm. In: Computational intelligence and security, pp. 167–176. Berlin Heidelberg, Springer. [Google Scholar]
63. Rao, R. V., Savsani, V. J., Vakharia, D. P. (2011). Teaching-learning-based optimization: A novel method for constrained mechanical design optimization problems. Computer-Aided Design, 43(3), 303–315. [Google Scholar]
64. Koopialipoor, M., Fallah, A., Armaghani, D. J., Azizi, A., Mohamad, E. T. (2019). Three hybrid intelligent models in estimating flyrock distance resulting from blasting. Engineering with Computers, 35, 243–256. [Google Scholar]
65. Golafshani, E. M., Behnood, A., Arashpour, M. (2020). Predicting the compressive strength of normal and high-performance concretes using ANN and ANFIS hybridized with Grey Wolf Optimizer. Construction and Building Materials, 232, 117266. [Google Scholar]
66. Le, L. T., Nguyen, H., Dou, J., Zhou, J. (2019). A comparative study of PSO-ANN, GA-ANN, ICA-ANN, and ABC-ANN in estimating the heating load of buildings’ energy efficiency for smart city planning. Applied Sciences, 9(13), 2630. [Google Scholar]
67. Zhou, J., Qiu, Y., Zhu, S., Armaghani, D. J., Li, C. et al. (2021). Optimization of support vector machine through the use of metaheuristic algorithms in forecasting TBM advance rate. Engineering Applications of Artificial Intelligence, 97, 104015. [Google Scholar]
68. Asteris, P. G., Armaghani, D. J., Hatzigeorgiou, G. D., Karayannis, C. G., Pilakoutas, K. (2019). Predicting the shear strength of reinforced concrete beams using Artificial Neural Networks. Computers and Concrete, An International Journal, 24(5), 469–488. [Google Scholar]
69. Apostolopoulou, M., Asteris, P. G., Armaghani, D. J., Douvika, M. G., Lourenço, P. B. et al. (2020). Mapping and holistic design of natural hydraulic lime mortars. Cement and Concrete Research, 136, 106167. [Google Scholar]
70. Asteris, P. G., Gavriilaki, E., Touloumenidou, T., Koravou, E. E., Koutra, M. et al. (2022). Genetic prediction of icu hospitalization and mortality in COVID-19 patients using artificial neural networks. Journal of Cellular and Molecular Medicine, 26(5), 1445–1455. [Google Scholar] [PubMed]
71. Taylor, K. E. (2001). Summarizing multiple aspects of model performance in a single diagram. Journal of Geophysical Research: Atmospheres, 106(D7), 7183–7192. [Google Scholar]
72. Gholami, A., Bonakdari, H., Samui, P., Mohammadian, M., Gharabaghi, B. (2019). Predicting stable alluvial channel profiles using emotional artificial neural networks. Applied Soft Computing, 78, 420–437. [Google Scholar]
Cite This Article
 Copyright © 2024 The Author(s). Published by Tech Science Press.
This work is licensed under a Creative Commons Attribution 4.0 International License , which permits unrestricted use, distribution, and reproduction in any medium, provided the original work is properly cited.
 Downloads
 Citation Tools