
 Submit a Paper
 Propose a Special lssue
 Open Access
ARTICLE

Aggravation of Cancer, Heart Diseases and Diabetes Subsequent to COVID-19 Lockdown via Mathematical Modeling
1 Near East University, Department of Mathematics, Nicosia, 99010, North Cyprus
2 Mehran University of Engineering and Technology, Department of Basic Sciences and Related Studies, Jamshoro, 76090, Pakistan
3 Department of Computer Science and Mathematics, Lebanese American University, P.O. Box 13-5053, Beirut, Lebanon
4 Near East University, Mathematics Research Center, Nicosia, 99010, North Cyprus
* Corresponding Author: Evren Hincal. Email:
(This article belongs to the Special Issue: Mathematical Aspects of Computational Biology and Bioinformatics-II)
Computer Modeling in Engineering & Sciences 2024, 140(1), 485-512. https://doi.org/10.32604/cmes.2024.047907
Received 22 November 2023; Accepted 31 January 2024; Issue published 16 April 2024
 View Full Text
 Download PDF
Abstract
The global population has been and will continue to be severely impacted by the COVID-19 epidemic. The primary objective of this research is to demonstrate the future impact of COVID-19 on those who suffer from other fatal conditions such as cancer, heart disease, and diabetes. Here, using ordinary differential equations (ODEs), two mathematical models are developed to explain the association between COVID-19 and cancer and between COVID-19 and diabetes and heart disease. After that, we highlight the stability assessments that can be applied to these models. Sensitivity analysis is used to examine how changes in certain factors impact different aspects of disease. The sensitivity analysis showed that many people are still nervous about seeing a doctor due to COVID-19, which could result in a dramatic increase in the diagnosis of various ailments in the years to come. The correlation between diabetes and cardiovascular illness is also illustrated graphically. The effects of smoking and obesity are also found to be significant in disease compartments. Model fitting is also provided for interpreting the relationship between real data and the results of this work. Diabetic people, in particular, need to monitor their health conditions closely and practice heart health maintenance. People with heart diseases should undergo regular checks so that they can protect themselves from diabetes and take some precautions including suitable diets. The main purpose of this study is to emphasize the importance of regular checks, to warn people about the effects of COVID-19 (including avoiding healthcare centers and doctors because of the spread of infectious diseases) and to indicate the importance of family history of cancer, heart diseases and diabetes. The provision of the recommendations requires an increase in public consciousness.Keywords
Epidemiology is a field of study that analyzes the causes of illness and health by addressing the facts of a population [1]. Studies in this area have been mostly interested in infectious diseases until the twentieth century. Recently, other than transmitted diseases by infection, diseases like cardiac heart diseases, diabetes, and stroke that can induce deaths worldwide have become a significant concern in the health sciences [1].
A new field derived from the interaction between epidemiology and genetics over many years has emerged, named genetic epidemiology. This new area concentrates on the connection between genetic and environmental parameters during disease in a human population. Genetic epidemiology provides benefits for comprehending the interaction between genetic roots and major chronic disorders like coronary heart disease, cancer, and diabetes [2].
Cardiovascular disorders (CVDs) belong to the category of disorders involving blood veins and the heart. There are a variety of cardiovascular disorders (CVDs), including coronary heart, cerebrovascular, peripheral arterial, rheumatic heart, congenital heart, pulmonary embolism and deep vein thrombosis [3].
Coronary heart disease (CHD) is a disorder of the blood veins providing for the heart muscle [4]. CHD is a worldwide major chronic disease, and tobacco use, high cholesterol, an unhealthy diet, alcohol use, and physical inactivity dramatically increase the risk of CHD. Additionally, one significant risk of CHD is having a family history, especially a male family member under the age of 55 or a female family member under the age of 65 with CHD. Approximately 17.9 million people passed away due to CVDs in 2019. CVD is one of the leading causes of deaths globally, making up 32% of deaths worldwide. Additionally, stroke and heart attacks cause 85% of deaths worldwide [5].
Cancer is another disorder that includes a wide group of diseases. It describes unpreventable abnormal or damaged cell growth almost anywhere in human parts or organs. Cancer does not differentiate between age, gender, family background, or other categories. However, cancer statistics enable us to recognize the similarities and differences between categories identified with sex, age, ethnic groups, etc. The mathematical model proposed in [6] provides a picture of cancer rates over time by collecting information statistically. Cancer is classified in the first place by its founding in the human body, like lung cancer, colon cancer, skin cancer, breast cancer, and prostate cancer. It can also be classified by cell types like soft tissues, such as muscles, nerves, blood vessels, or deep skin [7,8].
According to the basic cancer facts, there are plenty of factors that raise the risk of having cancer. High tobacco use, high alcohol use, and being overweight are some of these factors. These factors are alterable within the realm of possibility. On the other hand, other risk factors are not modifiable, like inherited genetic mutations [8]. Globally, roughly 10 million people passed away in 2020 from cancer [9]. In other words, one in six deaths in 2020 was caused by cancer. The most common cancers are breast cancer, with 2.26 million cases; lung cancer, with 2.21 million cases; and colon and rectum cancer, with 1.93 million cases. Prostate cancer and skin (non-melanoma) cancer are next in line [10]. In 2022, the estimated number of new cases and deaths was 1.9 million and 609,360 in the U.S. Moreover, cancer is the second-leading cause of death in USA [11].
Diabetes mellitus, simply called diabetes, is a disease caused by insufficient insulin production by the pancreas. It leads to uncontrolled amounts of glucose or sugar in the human body [12]. The most well-known categories are type 1 diabetes (5%) and type 2 diabetes (95%) in the obese community. There are other categories of diabetes, such as diabetes LADA, diabetes MODY, and gestational diabetes, which are rare and occur in the mutation of a single gene [13]. Statistically, around 442 million people have diabetes worldwide, while 1.5 million people’s deaths are caused by diabetes every year [14].
Mathematical models allow us to foresee the future outcomes of an epidemic or health issues. Besides this, they might be used as interpretive tools for the clarification of basic principles of transmission or extension [15,16]. Kermack and McKendrick increased the level of mathematical epidemiology by proposing a new model concerning the spread of contagious diseases in 1927 [1]. The first mathematical modeling of contagious diseases, by Daniel Bernoulli, was structured to determine the impact of smallpox inoculation on the population. Due to the description of complicated mutual interaction between human (or animal) hosts’ environment and biology, modern contagious disease epidemiology mostly depends on mathematical models [17].
In recent years, the most well-known contagious disease has been the Coronavirus disease (COVID-19), caused by the SARS-CoV-2 virus. COVID-19 is transmitted by liquid particles from the mouth or nose of an infected person. It is categorized as a pandemic disease since it affects many countries within international boundaries [18,19]. At the beginning of the pandemic, there was a large concern about its contagiousness and fatality since the structure of the disease was unknown. However, with the vaccination and some restrictions, the fatality of the disease was taken under control. Hence, almost every restriction has been lifted.
In recent years, many articles have been published in mathematical modeling that analyze COVID-19. Article [20] studied COVID-19’s epidemic development using a mathematical model in China. It proposes an SEIR (a varied Susceptible, Exposed, Infectious, Recovered) model [21]. Research by [22,23] and [24] studied the effect of vaccination on COVID-19 while [25] focused on both vaccination and mobility. Mathematical models that include fractional orders are widely applied to COVID-19 in different regions with many different approaches [26–30]. The work by [31] discussed the change in health behavior during the COVID-19 lockdown in the United Kingdom by applying descriptive statistics. The methods of another field, machine learning, are applied in the paper [32] to examine the transfusion of the best convalescent plasma for critical COVID-19 patients. The paper [33] deliberated on artificial intelligence techniques concerning the detection and classification of medical images of COVID-19. Also, in [34], artificial intelligence was applied to a fractional model dealing with COVID-19. In the papers [35–37], the authors proposed fractional models for transmitting COVID-19 and Zika viruses. More papers regarding COVID-19 and infectious diseases with mathematical models can be found in [38–41].
Mathematical modeling plays a remarkable role in infectious (epidemic/pandemic) diseases and chronic diseases. In the health sciences, mathematical models can be applied to identify the dynamics and aspects of diseases such as cancer, coronary heart disease (CHD), and diabetes. In [42], the proposed mathematical models provide approaches for a better understanding of the parameters of chronic disorders.
This paper aims to present the effect of COVID-19 on other significant diseases, specifically cancer, heart disease, and diabetes. This study aims to warn people and increase their awareness so that the necessity of doctor and hospital visits in the upcoming years can be reduced. The presented study has a significant role in health sciences by being one of the strong and rare models that discuss the effect of the COVID-19 pandemic from different and serious perspectives. On that note, two mathematical models are proposed: one for the relationship between cancer and COVID-19 and one for the relationship between heart disease, diabetes, and COVID-19. This study aims to demonstrate how doctor controls are important for the future of human beings and how COVID-19 will negatively affect these doctor visits. In this regard, two mathematical models are constructed. In Sections 2–4, models are given with the necessary existence theorems and proofs. Section 5 includes the sensitivity analysis and its results as numerical simulations. The results and discussion, conclusions, and future recommendations sections are explained in Sections 6–8, respectively.
In this study, compartmental mathematical models are constructed. For the analysis of models, invariance, basic reproduction numbers, and equilibrium point properties are obtained and proved. Furthermore, for the effectiveness of parameters, sensitivity analysis is applied. All the data used in this paper for both models are gathered from the references [4,43–46].
3 Construction and Analysis of the First Model
In this section, the first model of the paper is proposed, and the entity of the solution is demonstrated. The model is constructed with the help of ordinary differential equations (ODEs) to obtain the change in compartments at time t. Then, an analysis of the model is given.
3.1 Mathematical Model Formulation
The whole population,
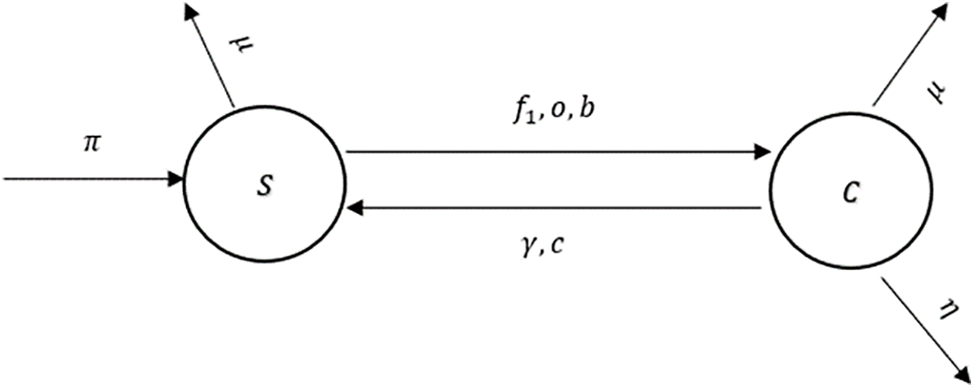
Figure 1: The flow diagram of the model (1)
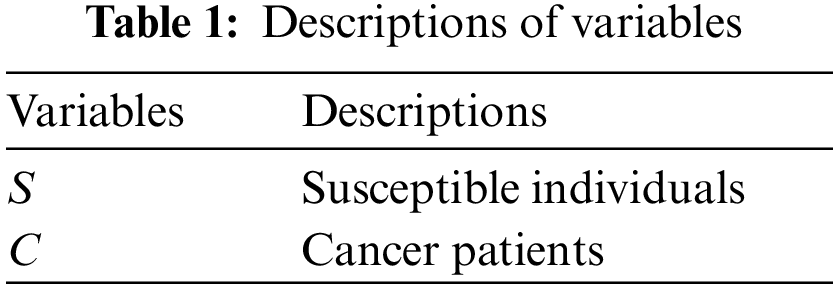
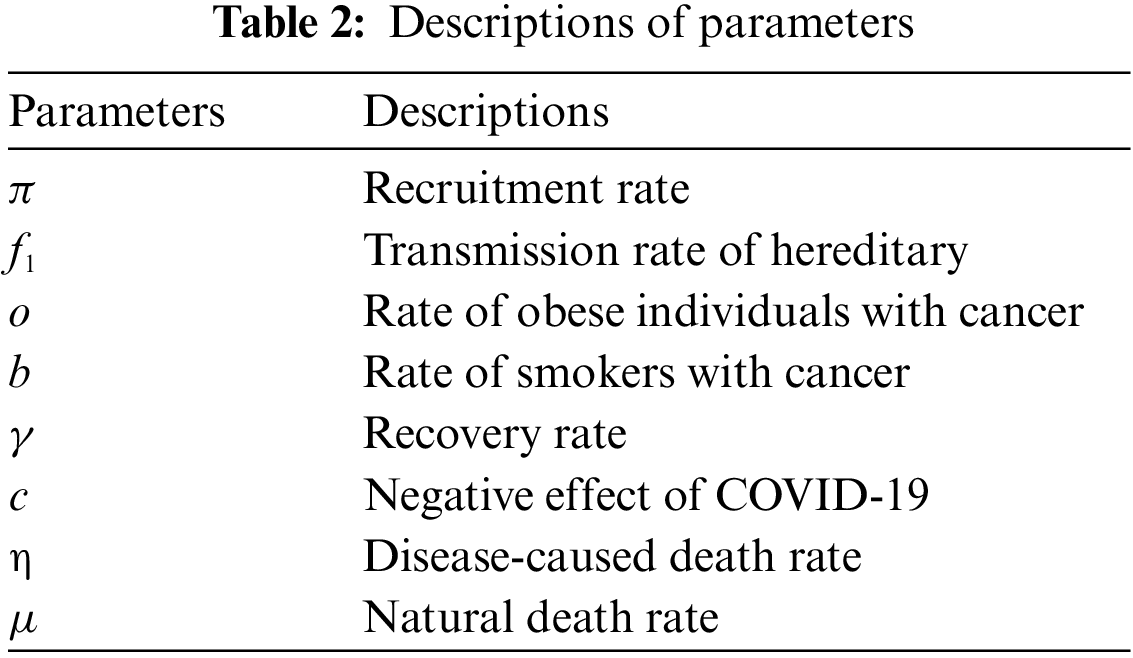
In Tables 1 and 2, descriptions of variables and parameters are explained, respectively.
Theorem 1. Let
is invariant and positive. Moreover, all of the solutions in
Proof of Theorem 1. By adding all of the terms that are on the right side of the proposed system,
is obtained. From the equality, it can be seen that
for some arbitrary constant
For the constructed model, two equilibrium points, disease-free and endemic equilibrium points, are evaluated. At the disease-free equilibrium point, denoted by
It is obvious that
The endemic equilibrium point, denoted by
where
for
and
On the other hand, a real solution of the quadratic equation that depends on
This inequality always holds since the value of the natural death rate is very small.
Theorem 2. Disease Free Equilibrium,
Proof of Theorem 2. Consider the Lyapunov function
The above function is always positive and at the point
Since
It is clear that
Theorem 3. Endemic Equilibrium,
Proof of Theorem 3. For the proof of the above theorem, the following Lyapunov function is constructed:
where
Thus,
3.3 Parameter Fitting Using Real Clinical Data
In mathematical epidemiology, deterministic models of diseases rely significantly on data fitting to verify that their predictions are in line with observed data. The capacity to predict the spread of disease is enhanced since it simplifies the estimation of model parameters like transmission and recovery rates. By contrasting the model with the data, researchers can learn more about illness trends, treatment outcomes, and discrepancies and undertake what-if analyses. If policymakers had more faith in the model’s projections, they could make more educated choices. Improving future model development is another benefit of expanding the scientific knowledge base.
The least squares method has been extensively used in a wide variety of fields, from epidemiology to finance, to estimate parameters in mathematical models. When developing a deterministic model for infectious diseases, we first start with a set of differential equations that describe the dynamics of the disease. These equations may contain imprecise values for parameters like the rate of transmission or the rate of recovery. Model predictions produced with arbitrary settings for these parameters will not match the observed data. Finding these parameters’ values that yield predictions as close to the data as possible is the goal. To strike this equilibrium, the least squares approach minimizes the squared differences (also known as “residuals”) between the observed and expected values. Once the parameter values have been obtained, the squared deviations between the model’s predictions and the data can be easily calculated. Finding parameter values that minimize this sum is desirable since it indicates that the model’s predictions are close to the data. The model’s parameters are considered to be “fit” to the data once this constraint minimization is complete. With these modified parameters, the model should more faithfully capture the dynamics of the infectious disease’s transmission and impact as observed in the real world.
In epidemiology, fitting parameters to models using the ODE system in (1) demonstrates an innovative strategy. Some of the complexity of pandemic spread may be better understood with the use of deterministic models, such as those that use ordinary derivatives. However, such models cannot make accurate predictions in the real world without trustworthy parameter-fitting methods and high-quality data. For this purpose, we aspire to select authentic cancer patient clinical data, such as COVID-19 daily confirmed cases from March 13 to April 01, 2023, as made available on the Worldometer website [50]. Some of the model’s most crucial parameters are derived from the fitted data, while others are taken from the cited analysis in the available literature. Fig. 2 displays the results of a comparison between real clinical data and model (1) simulations, including residuals in Fig. 3 and the corresponding box-plot in Fig. 4. Fig. 2 shows that the curve of the simulated data agrees well with the actual clinical data, and the scatter in the associated residuals, as shown in Fig. 3. Lends credence to this conclusion. A similar claim is valid for the box-plot in Fig. 4. The following initial conditions are used during the simulations:
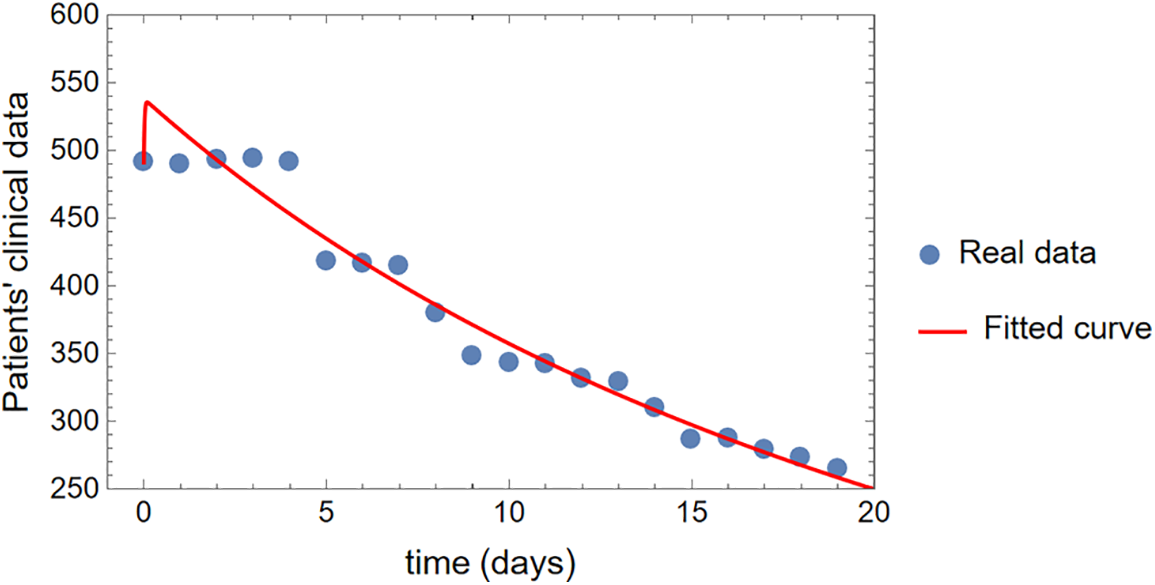
Figure 2: The comparison of simulations of model (1) with the real clinical data
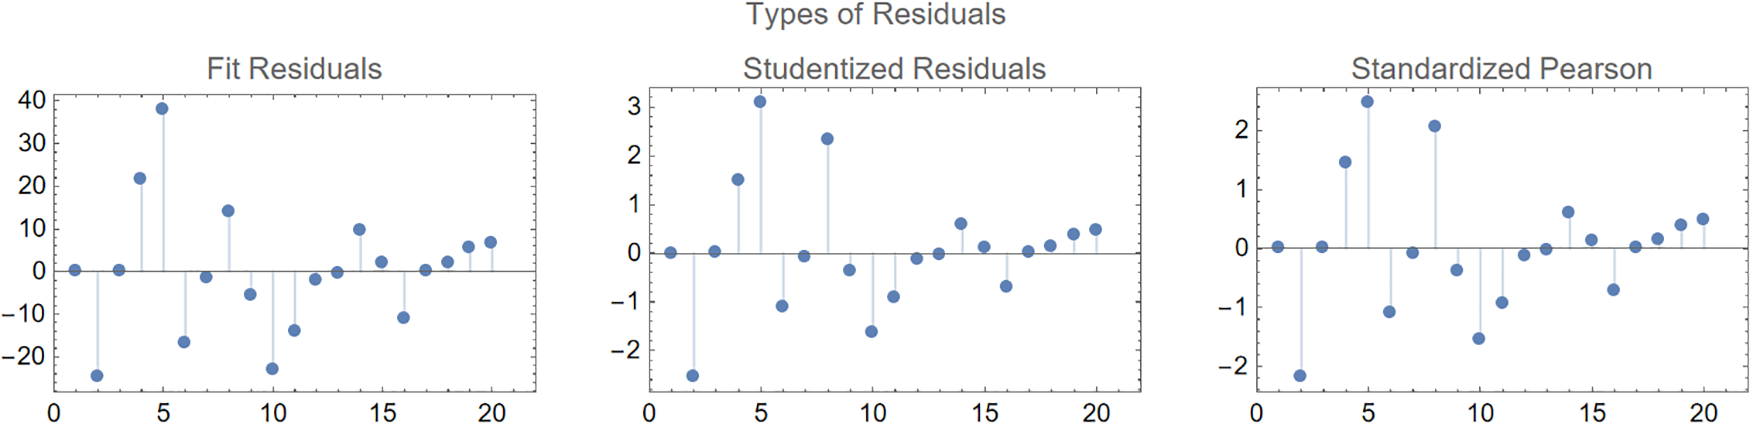
Figure 3: Different types of residuals for the curve fitting of the model (1)
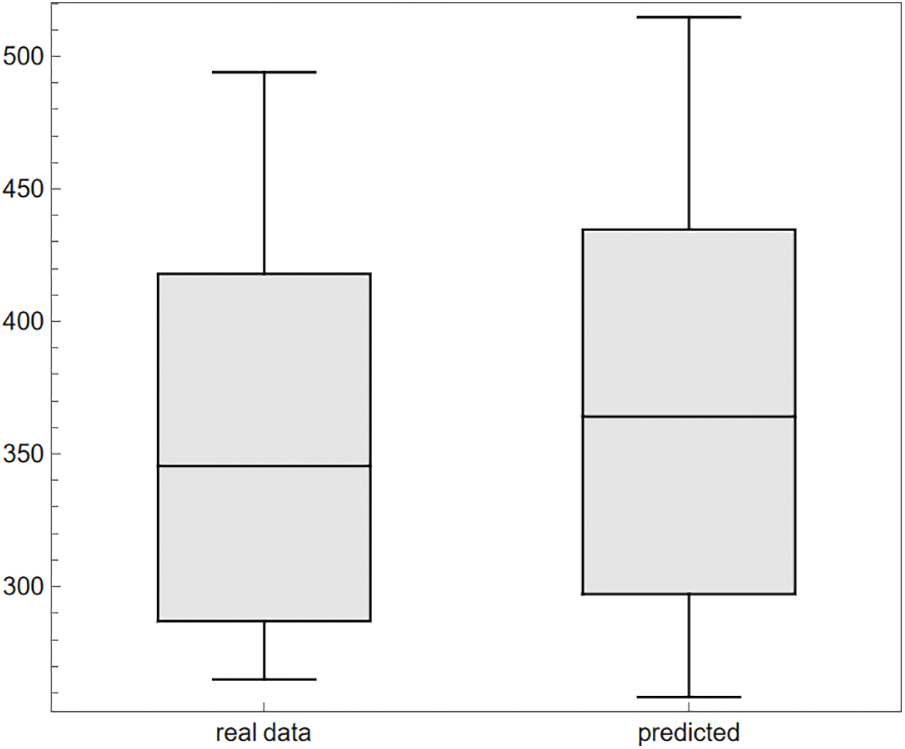
Figure 4: The comparison of the box-plots for the real clinical data and the observed (predicted) data from simulations of the model (1)
The fitted parameters are obtained as follows:
The rest of the parameters are taken to be fixed and given to be
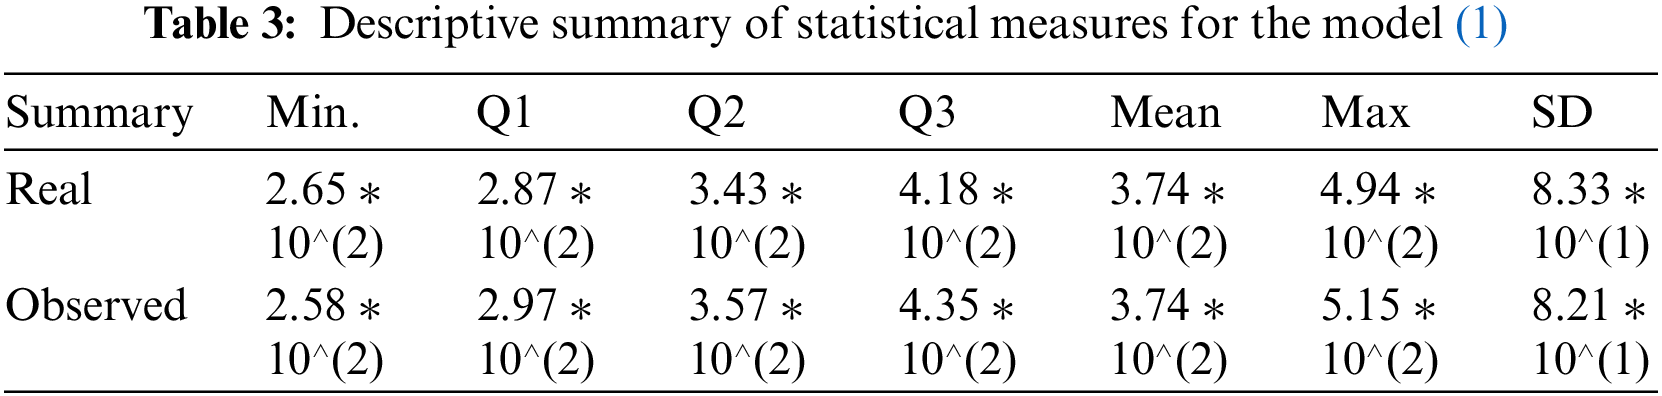
It may further be seen that the statistical measures (minimum, first, second, and third quartile (Q1, Q2, Q3), arithmetic mean, maximum, and standard deviation) computed in Table 3 are also in very good agreement with each other. This enhances the validation and verification of the model (1) since the standard deviation of magnitude 82.1, obtained under the simulations of the model (1), is close enough to the standard deviation based on the real clinical data as shown in the last column of Table 3.
4 Construction and Analysis of the Second Model
In this section, the model is proposed with proof of the existence of the solution. Afterwards, analyses of equilibrium points are given.
4.1 Mathematical Model Formulation
The population, which is stated by
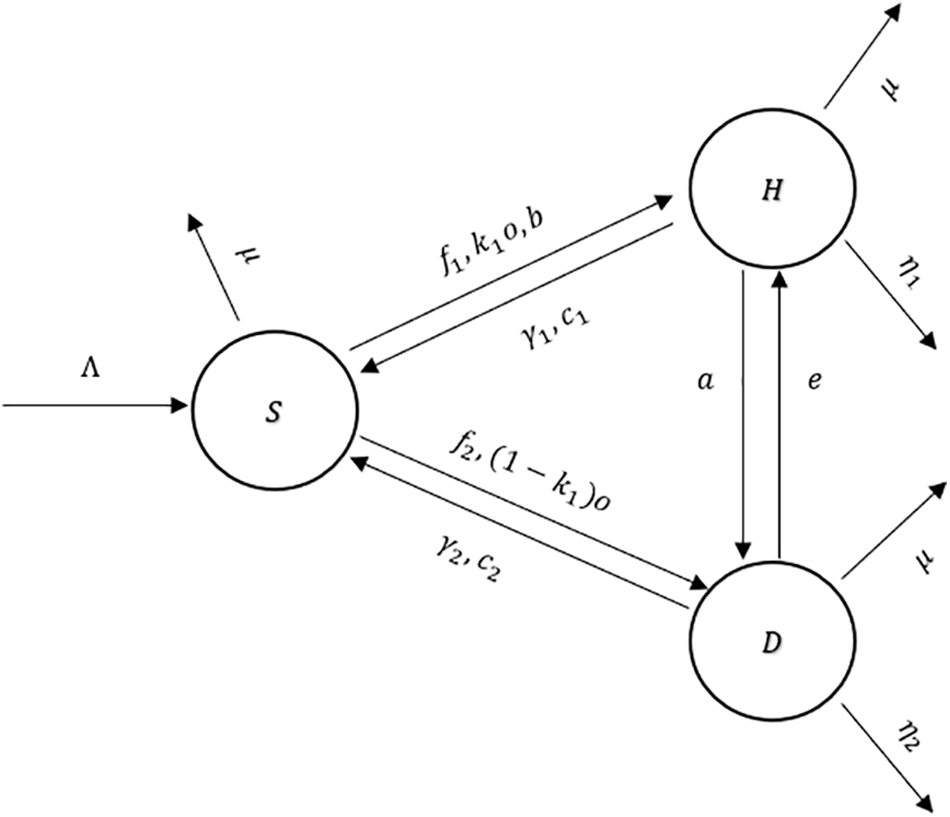
Figure 5: The flow diagram of the model (2)
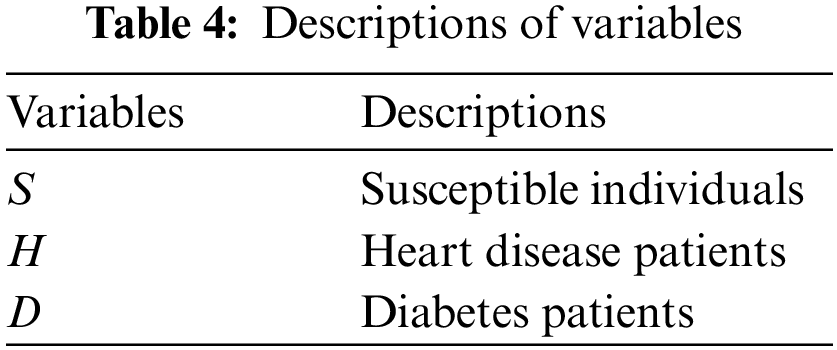
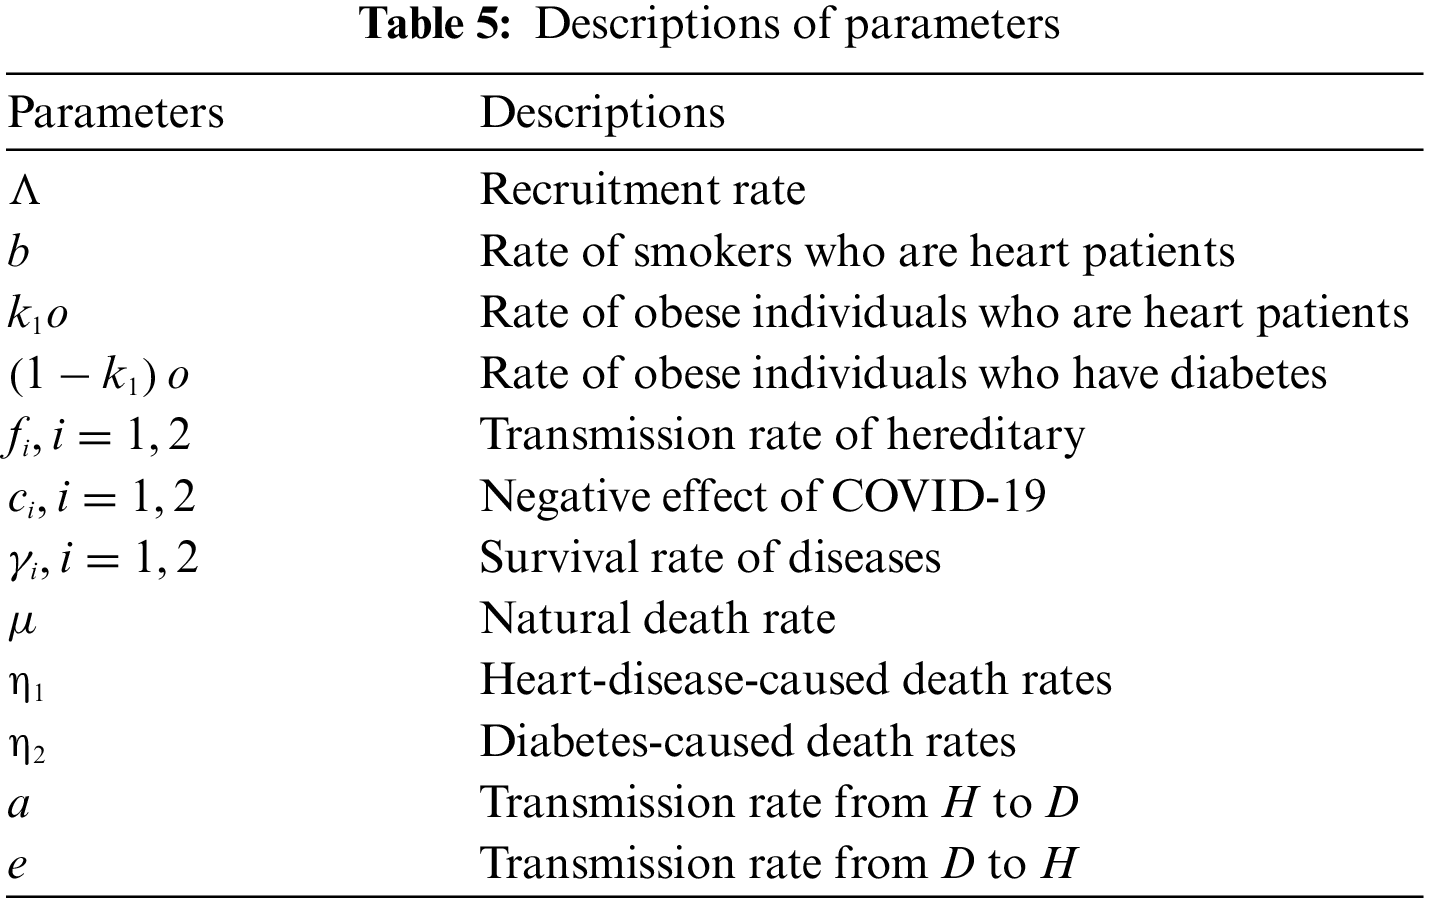
An explanation of the variables and parameters is given in Tables 4 and 5.
Theorem 4. Assume that
is positive, invariant, and the solutions in
Proof of Theorem 4. The addition of all of the terms that are on the right side of the system gives
From the above equality, it is obvious that
for some constant
In the proposed model, there are two equilibrium points: the disease-free equilibrium point, denoted by
Here,
The endemic equilibrium point, denoted by
where
for
and so
Theorem 5. Disease Free Equilibrium,
Proof of Theorem 5. Consider the below Lyapunov function
Here, the constructed function
since
Similarly, if
Hence,
Theorem 6. Endemic Equilibrium Point,
Proof of Theorem 6. Consider the below Lyapunov function
The constructed function
So,
According to the statistics proposed in [47] and [51], there are more diabetic patients than heart patients in the world. Hence, for the stability of the endemic equilibrium point, this situation should be reversed and
5 Sensitivity Analysis and Numerical Simulations
Sensitivity analysis is a method that can be applied to the parameters of any mathematical model to identify the effect of the parameters on the compartments. This analysis aims to demonstrate how a small change in parameters can affect whether a disease exists or dies out [43]. In this section, sensitivity analysis of the parameters is given separately for both models. Data for the parameters are taken from the references [43–46,52]. All the computations have been accomplished by MatLab.
5.1 Sensitivity Analysis of the First Model
In this part, a sensitivity analysis is implemented to the parameters of the first model.
Figs. 6 and 7 show the expected pattern for cancer patients when the
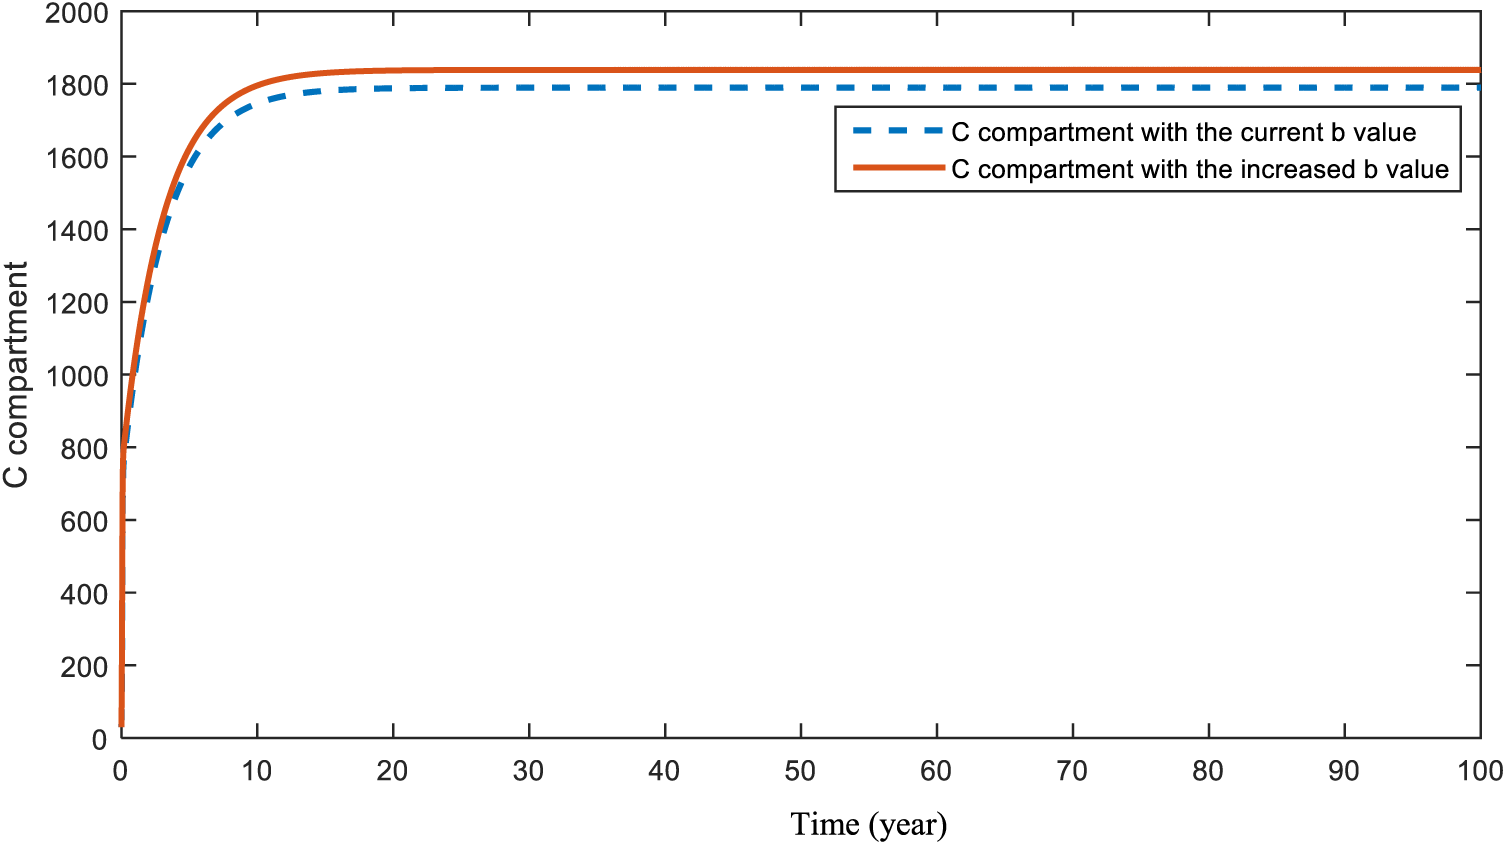
Figure 6: Sensitivity analysis of parameter
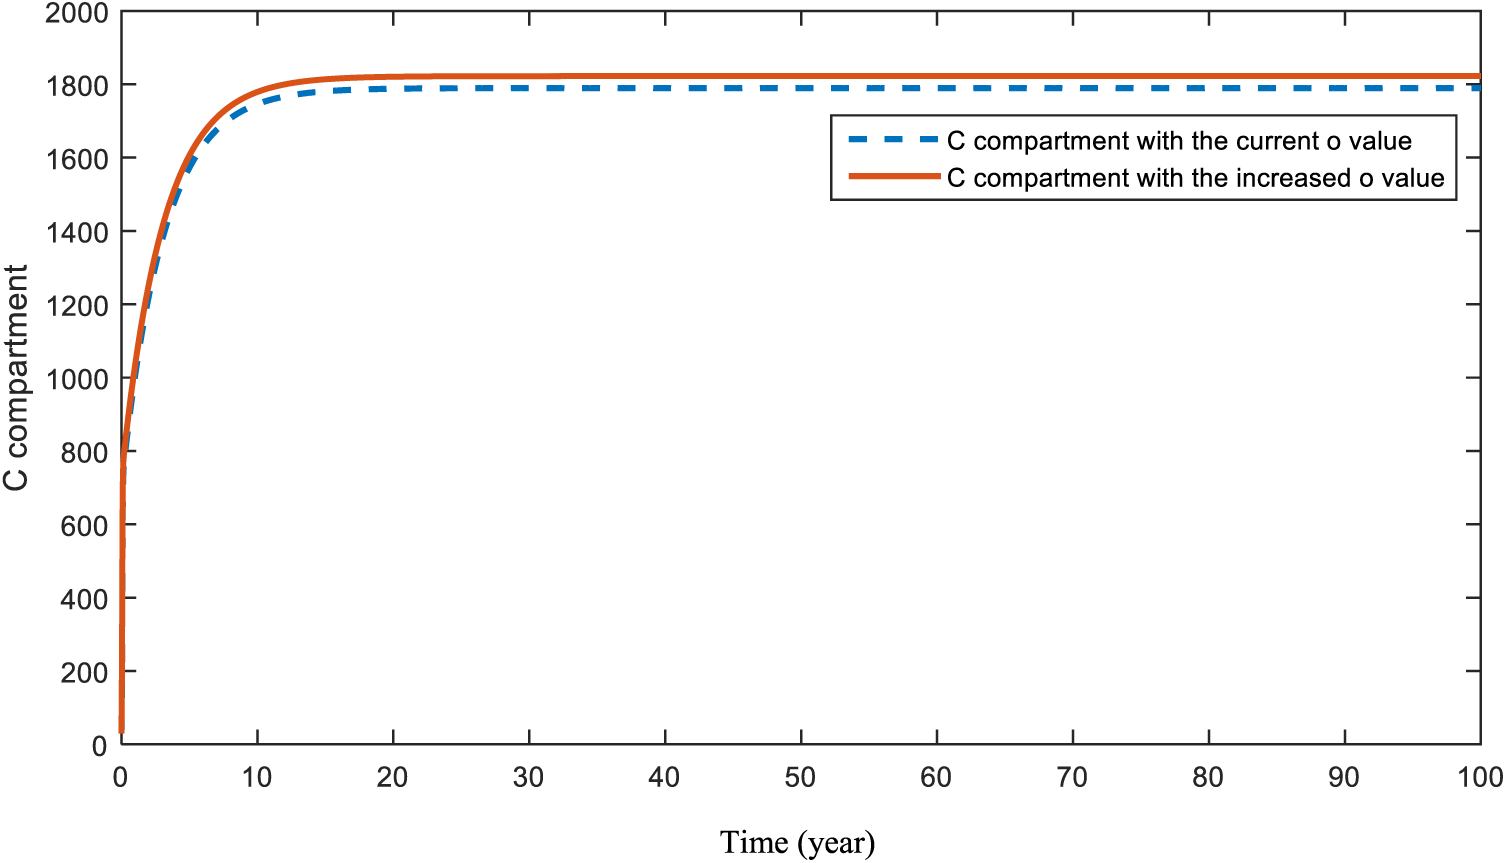
Figure 7: Sensitivity analysis of parameter
Figs. 8 and 9 present the effect of parameter
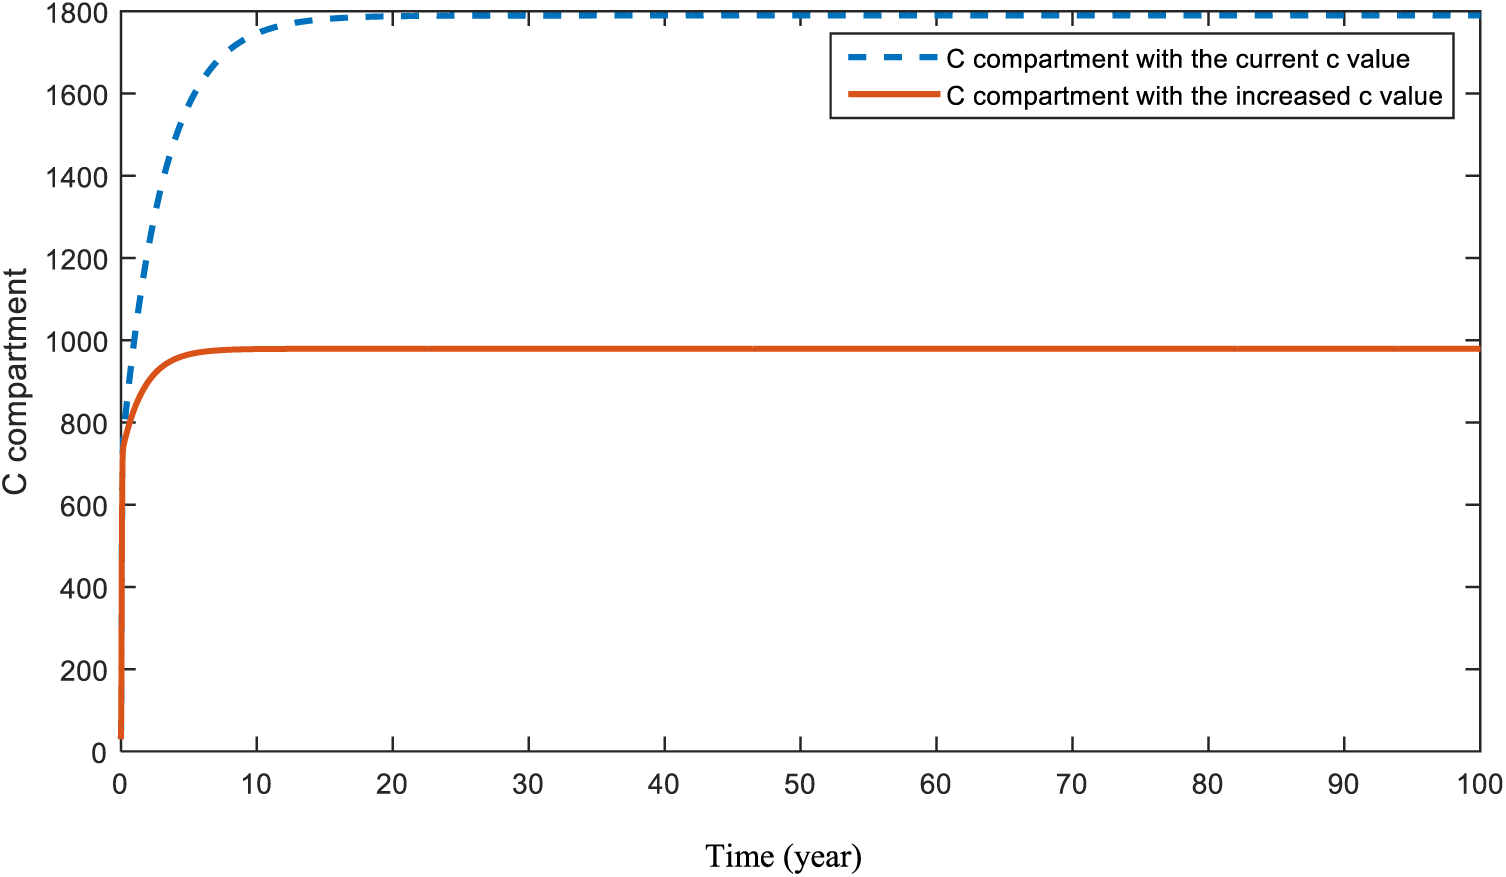
Figure 8: Sensitivity analysis of parameter
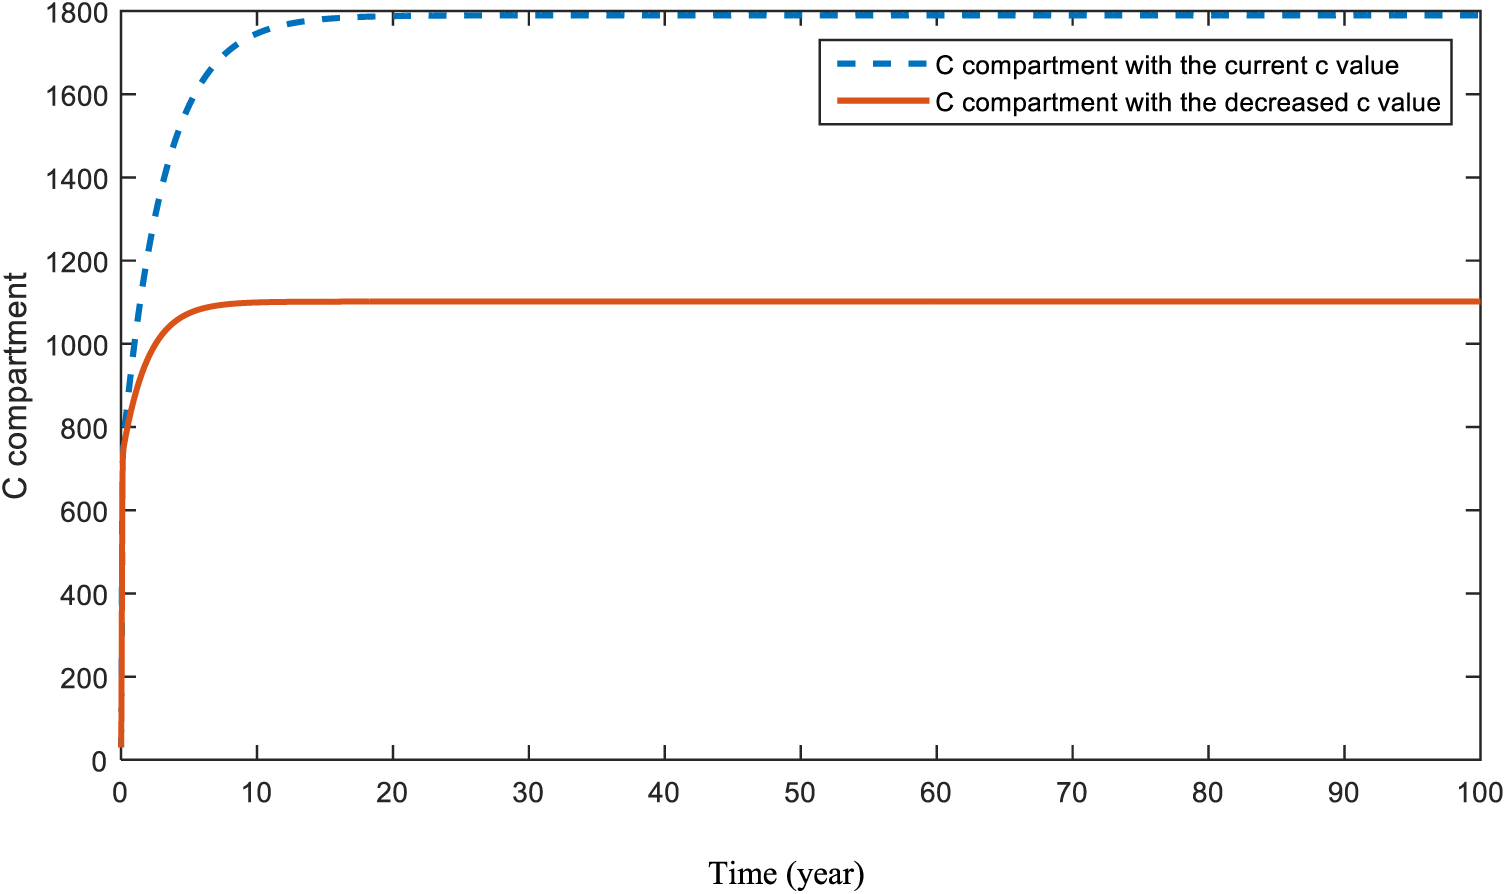
Figure 9: Sensitivity analysis of parameter
5.2 Sensitivity Analysis of the Second Model
In this part, a sensitivity analysis is implemented to the parameters of the second model.
In Figs. 10 and 11, the effects of the parameters
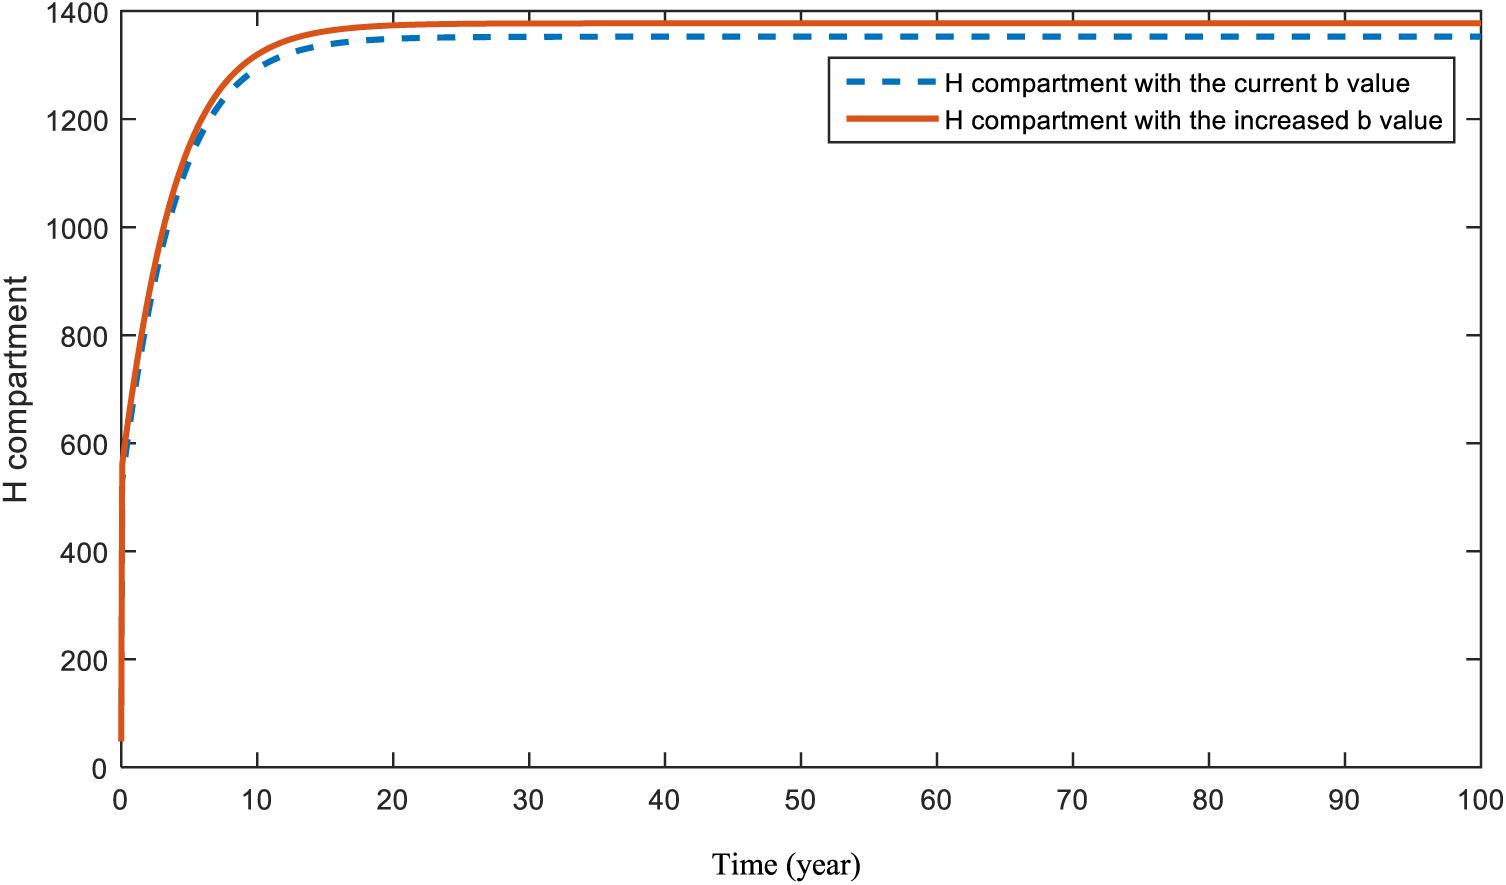
Figure 10: Sensitivity analysis of parameter
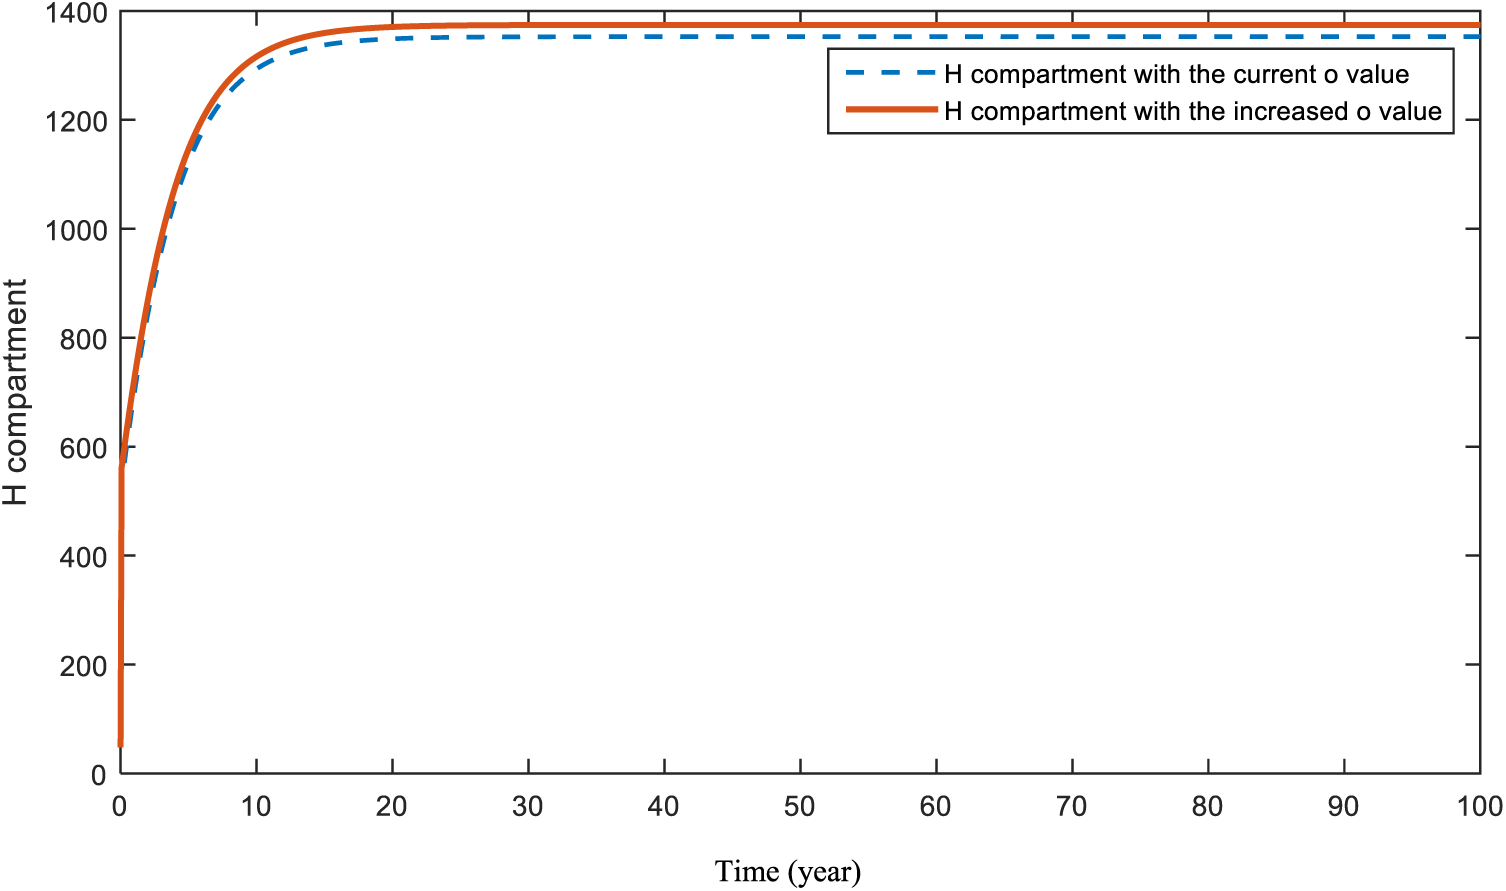
Figure 11: Sensitivity analysis of parameter
Fig. 12 represents what is expected to happen in compartment
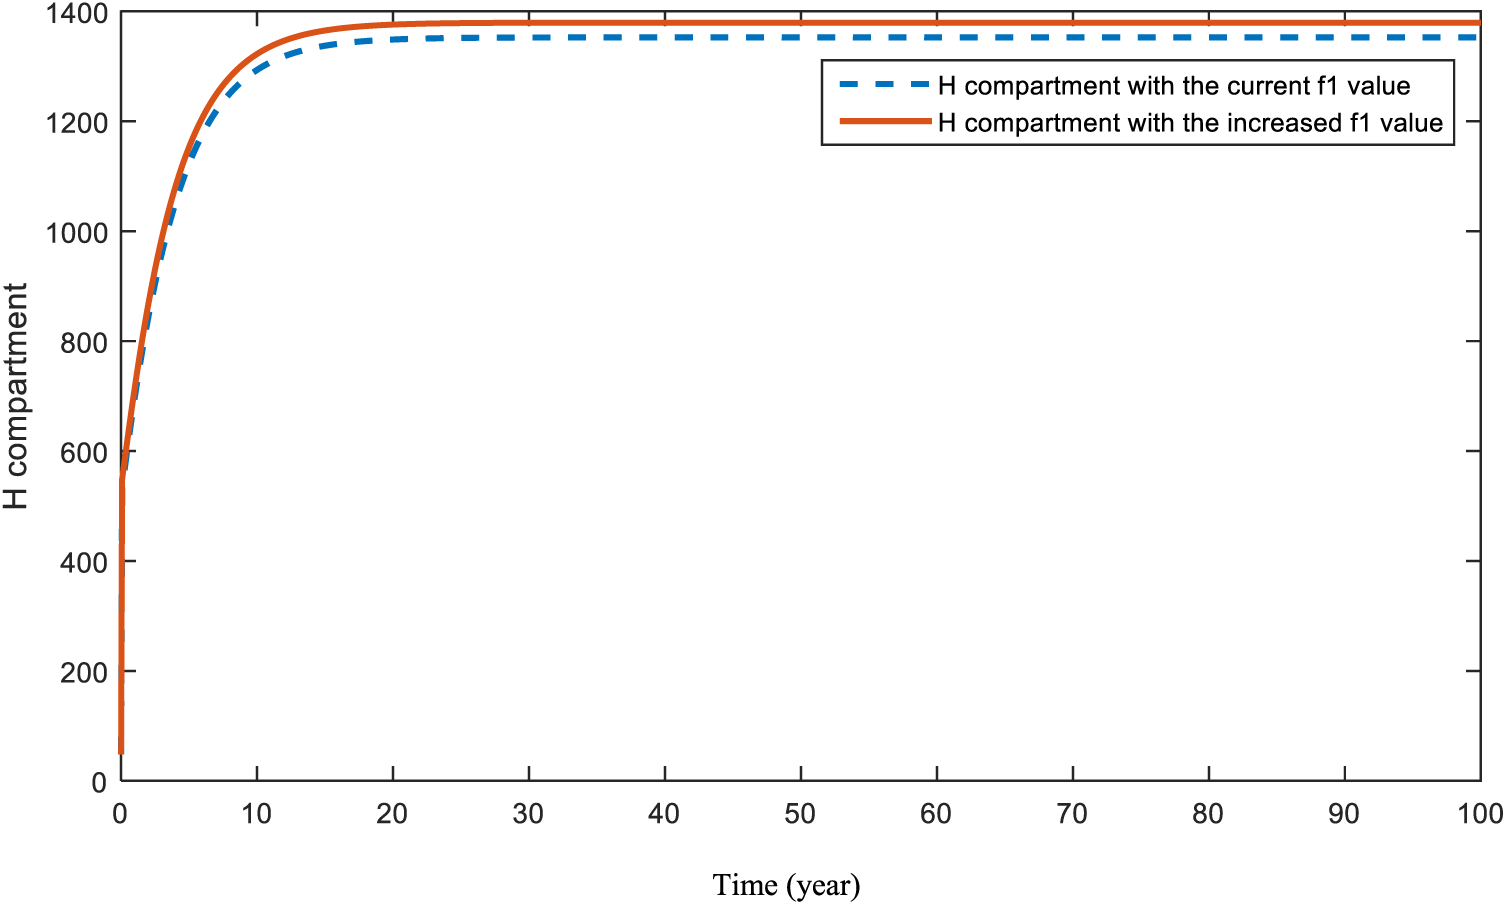
Figure 12: Sensitivity analysis of parameter
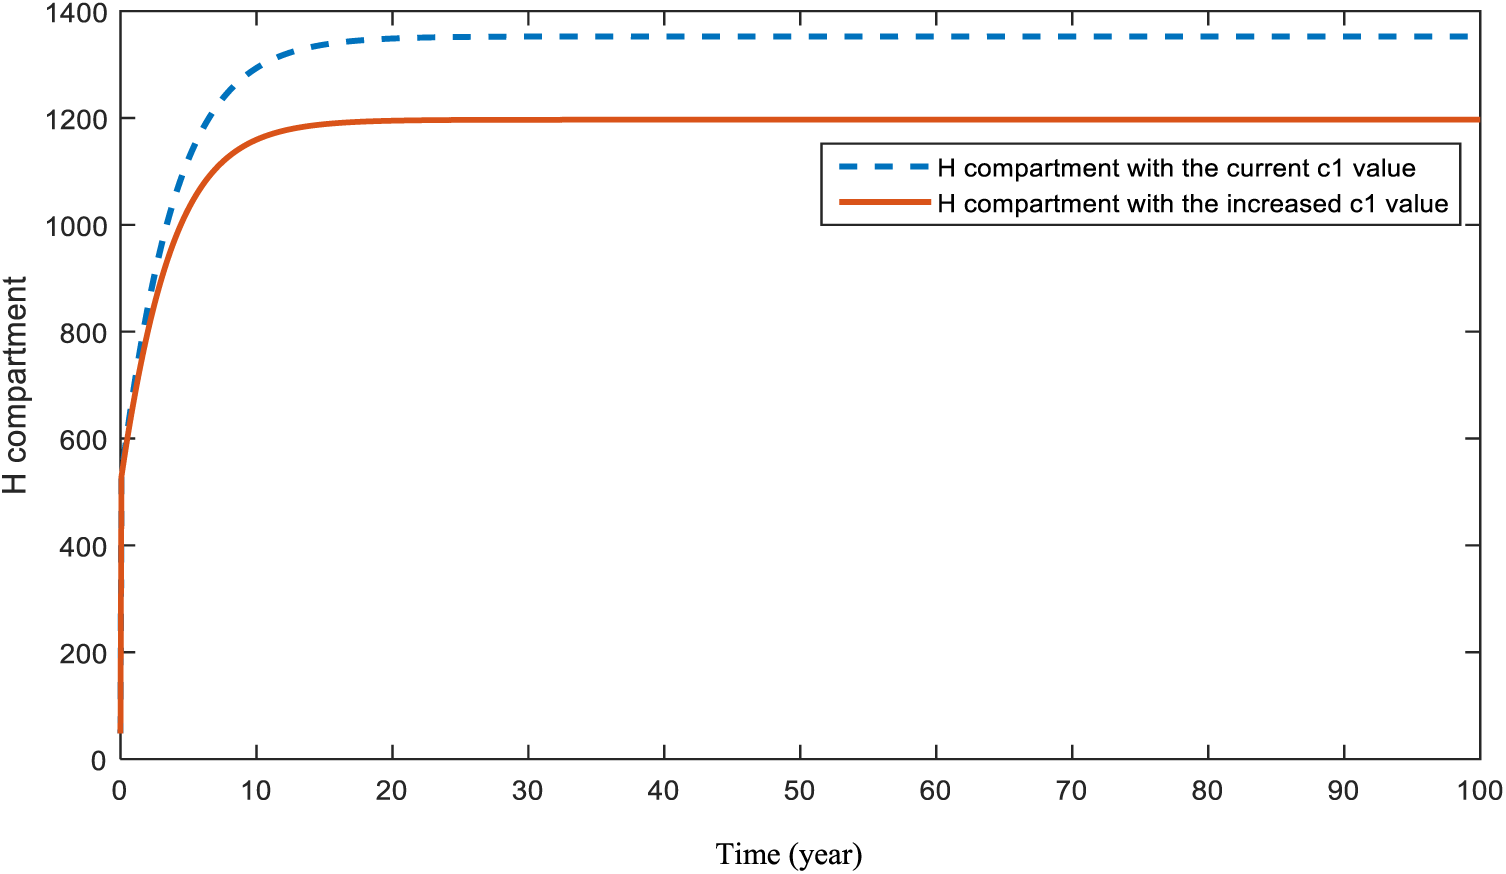
Figure 13: Sensitivity analysis of parameter
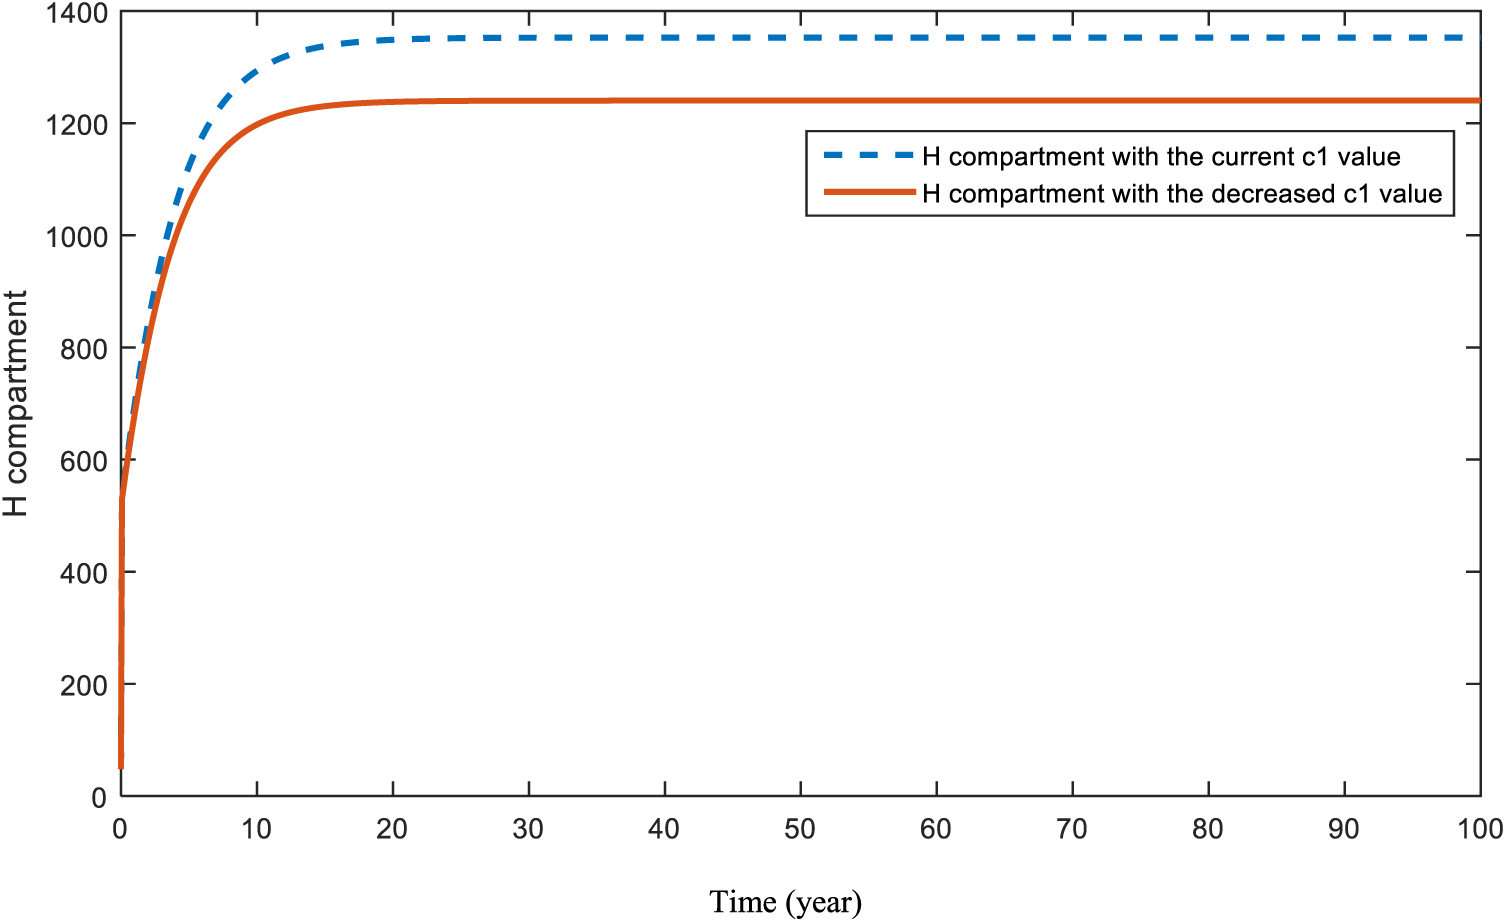
Figure 14: Sensitivity analysis of parameter
Fig. 15 demonstrates the pattern of heart-diseased individuals in the case of an increase in diabetes. This is the effect of diabetes on heart-diseases.
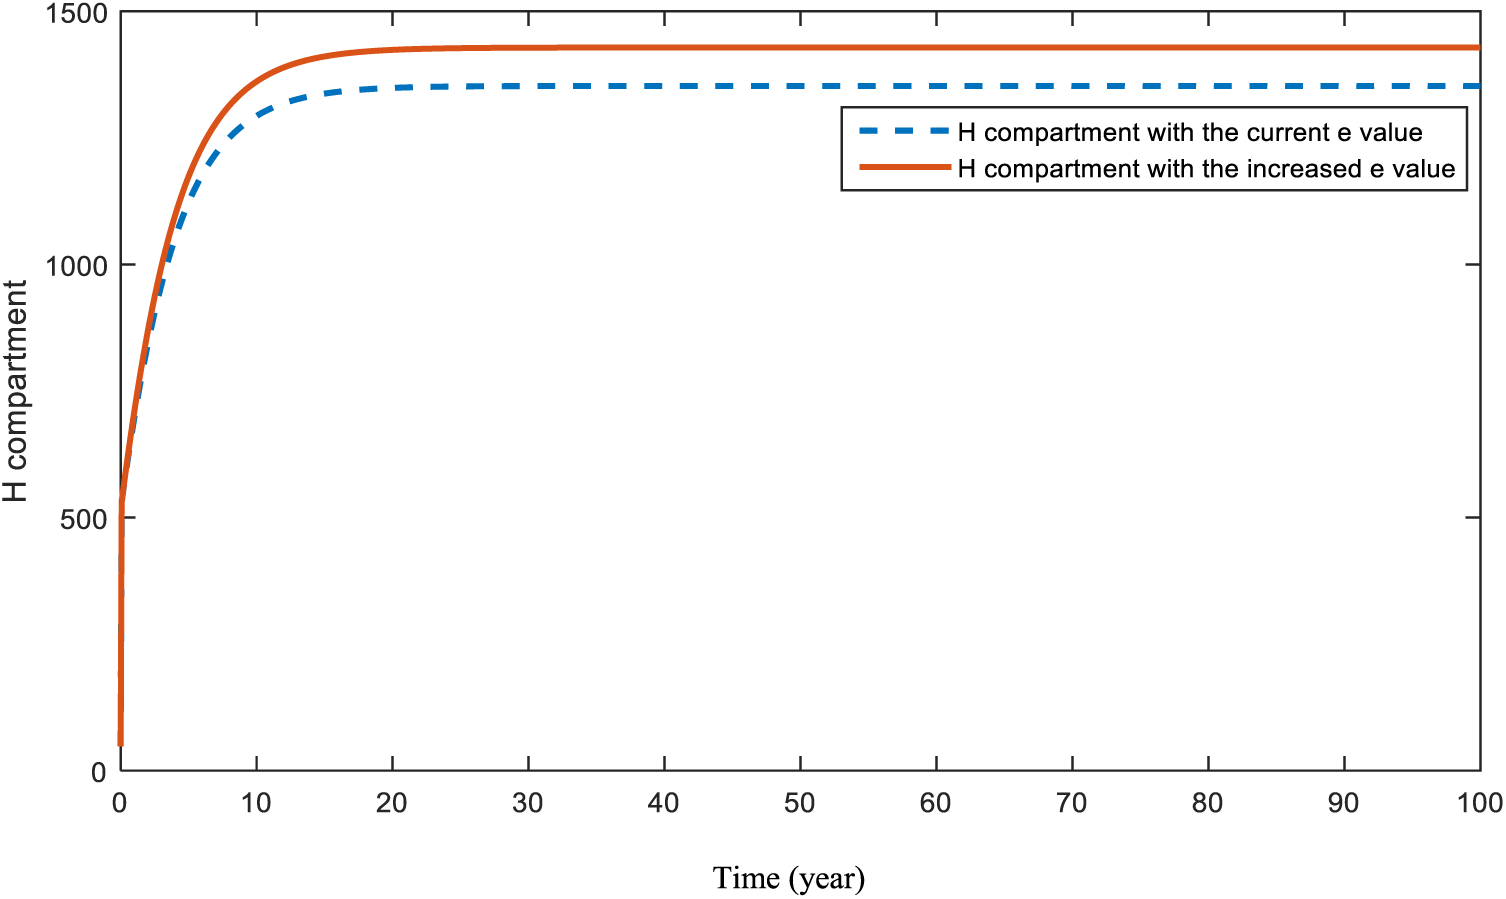
Figure 15: Sensitivity analysis of parameter
The effect of the obesity parameter,
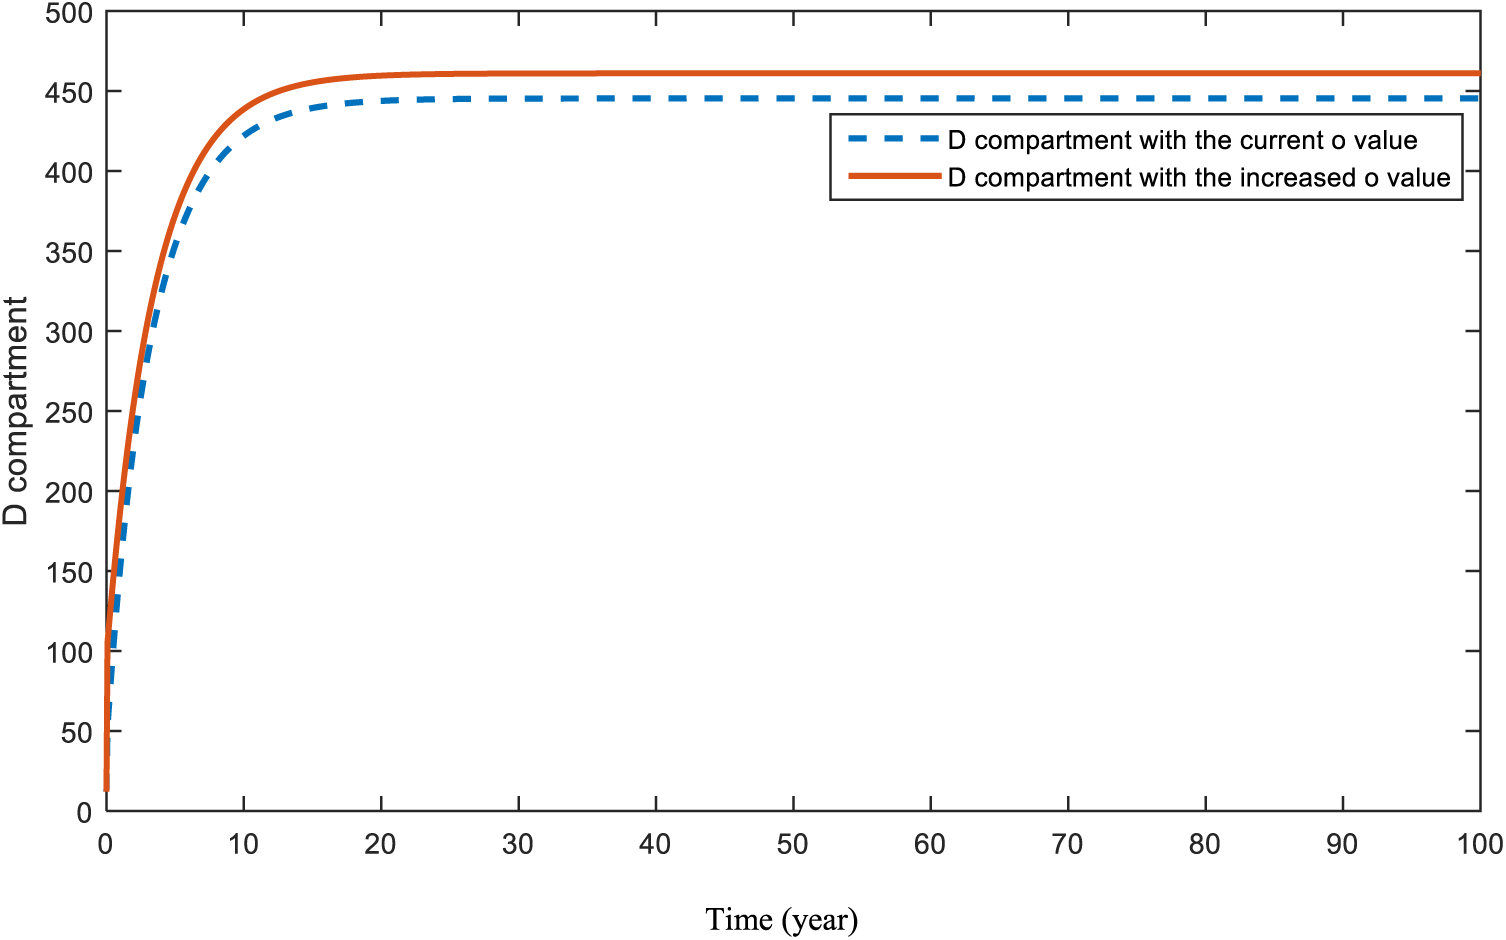
Figure 16: Sensitivity analysis of parameter
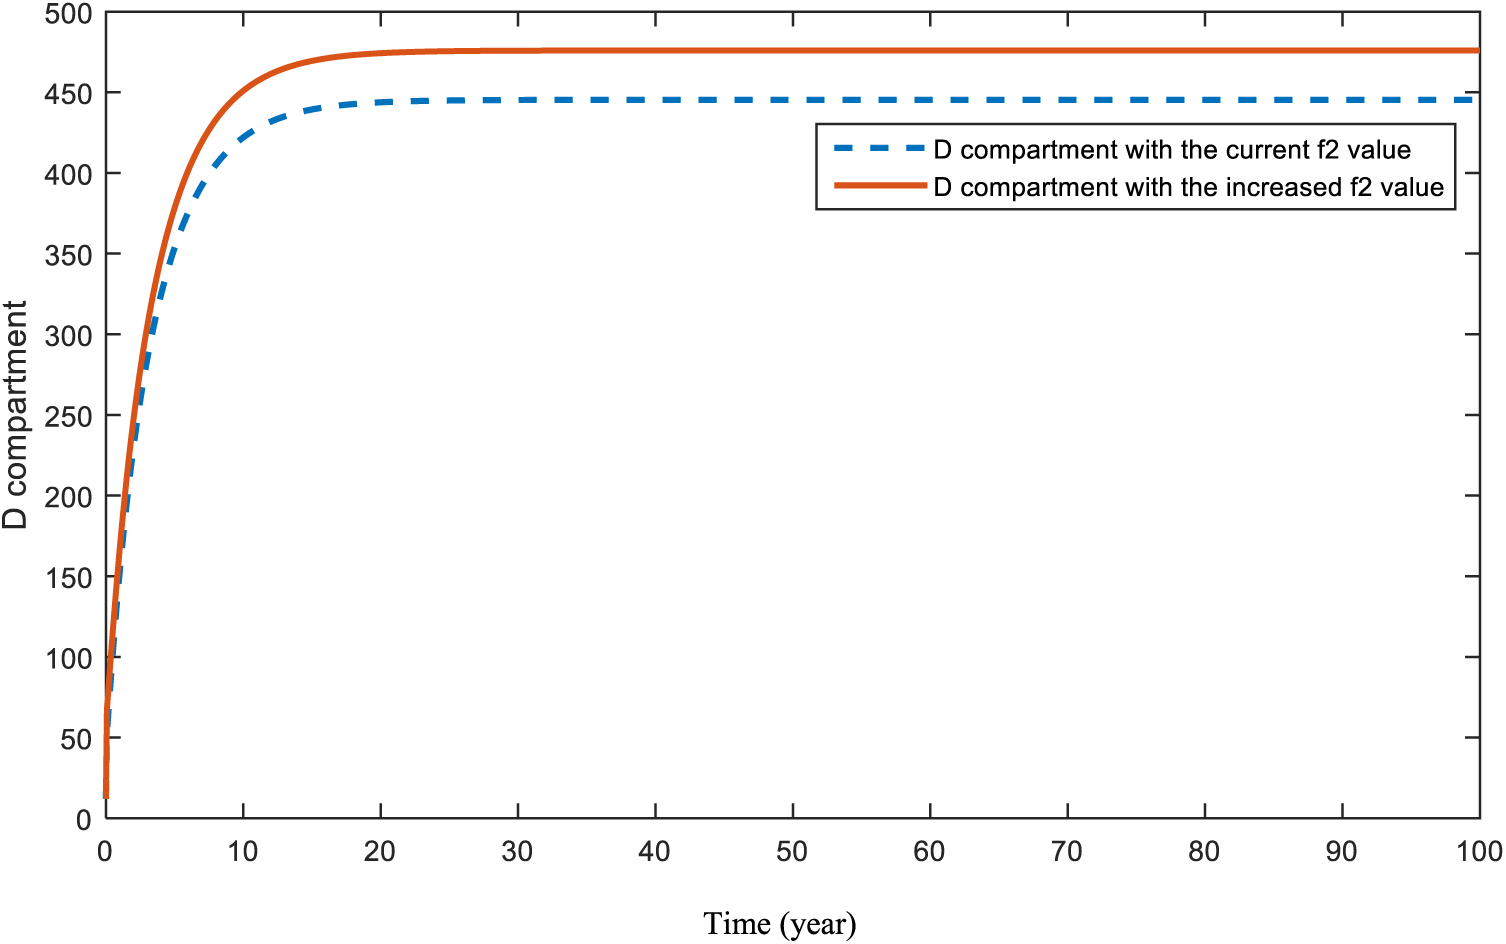
Figure 17: Sensitivity analysis of parameter
Figs. 18 and 19 are revealed in order to show the significance of the COVID-19 parameter,
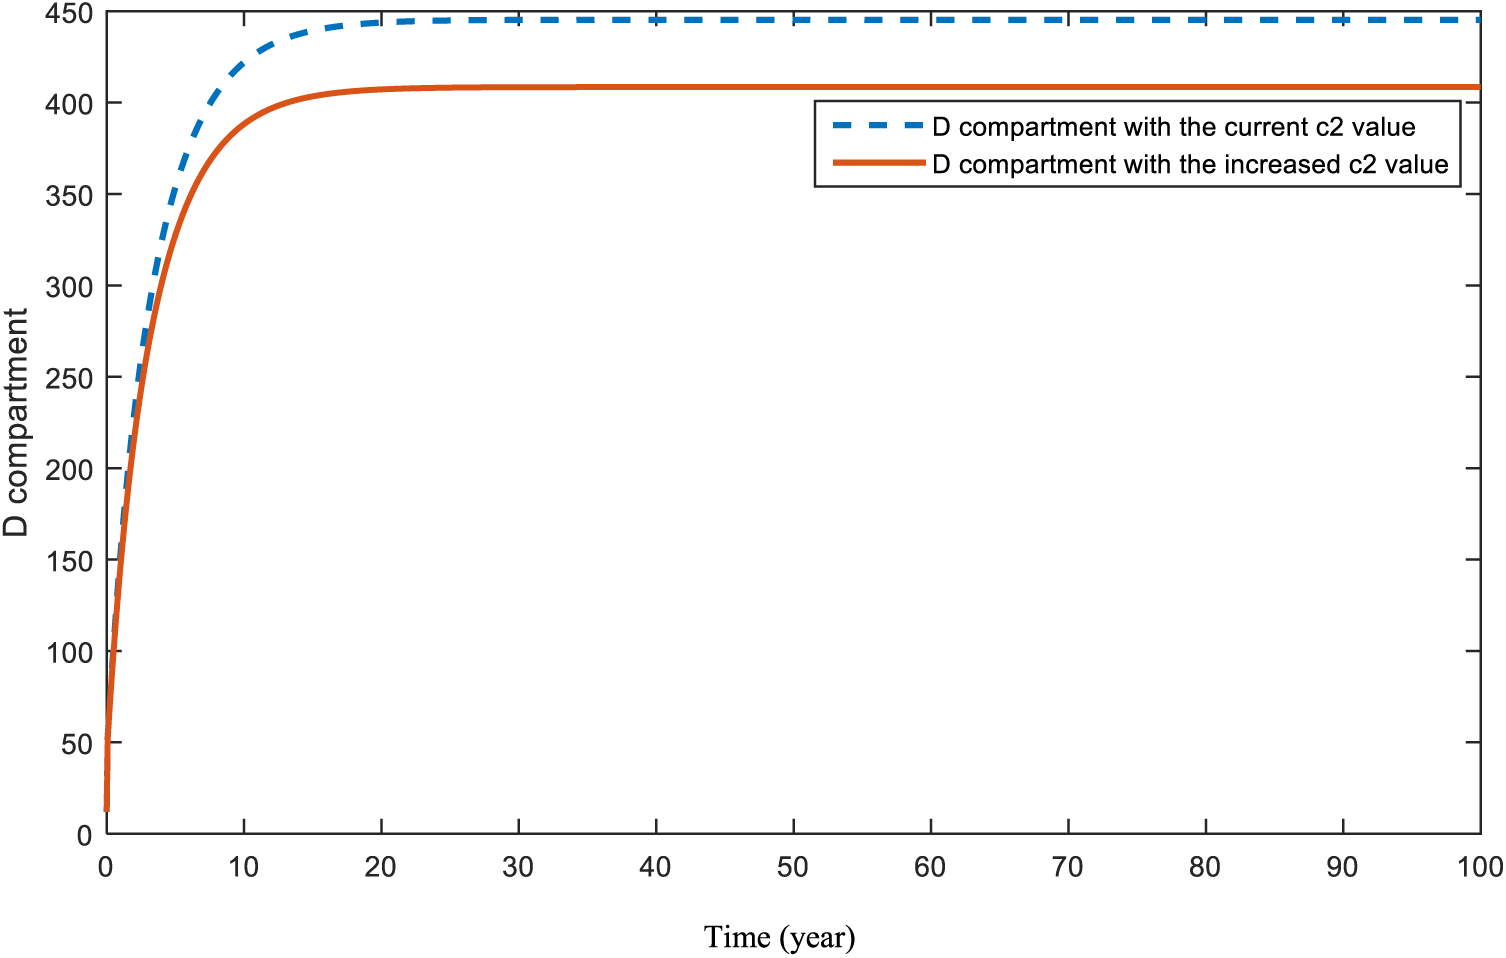
Figure 18: Sensitivity analysis of parameter
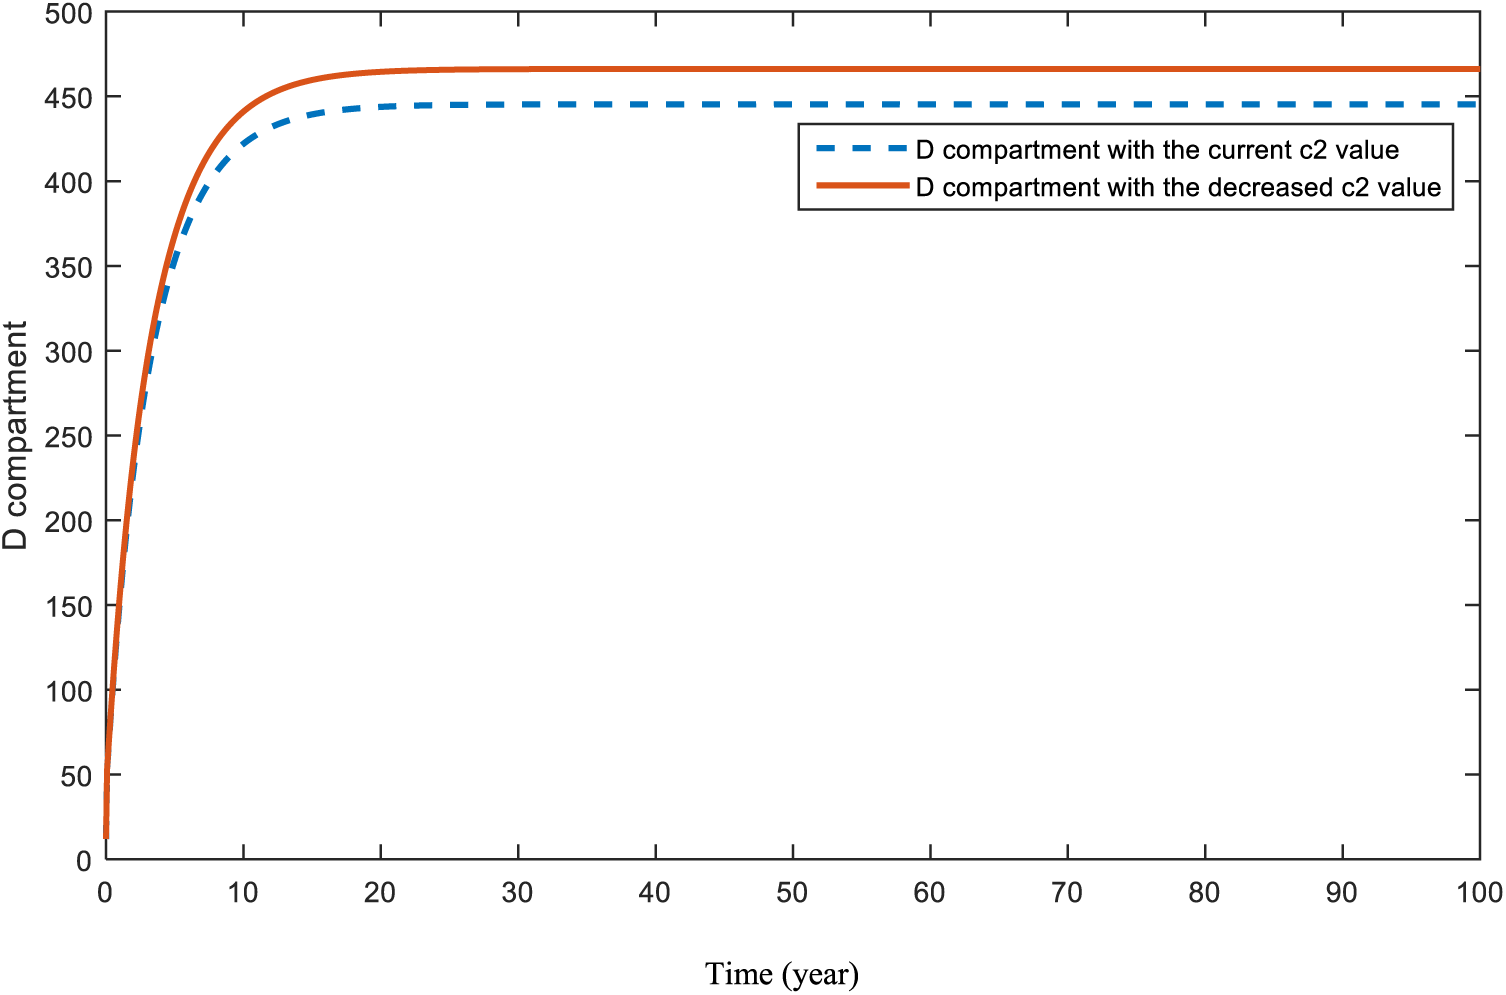
Figure 19: Sensitivity analysis of parameter
Fig. 20 demonstrates the pattern of diabetes patients in the case of an increase in patients with heart-diseases. This is the effect of heart-diseases on diabetes.
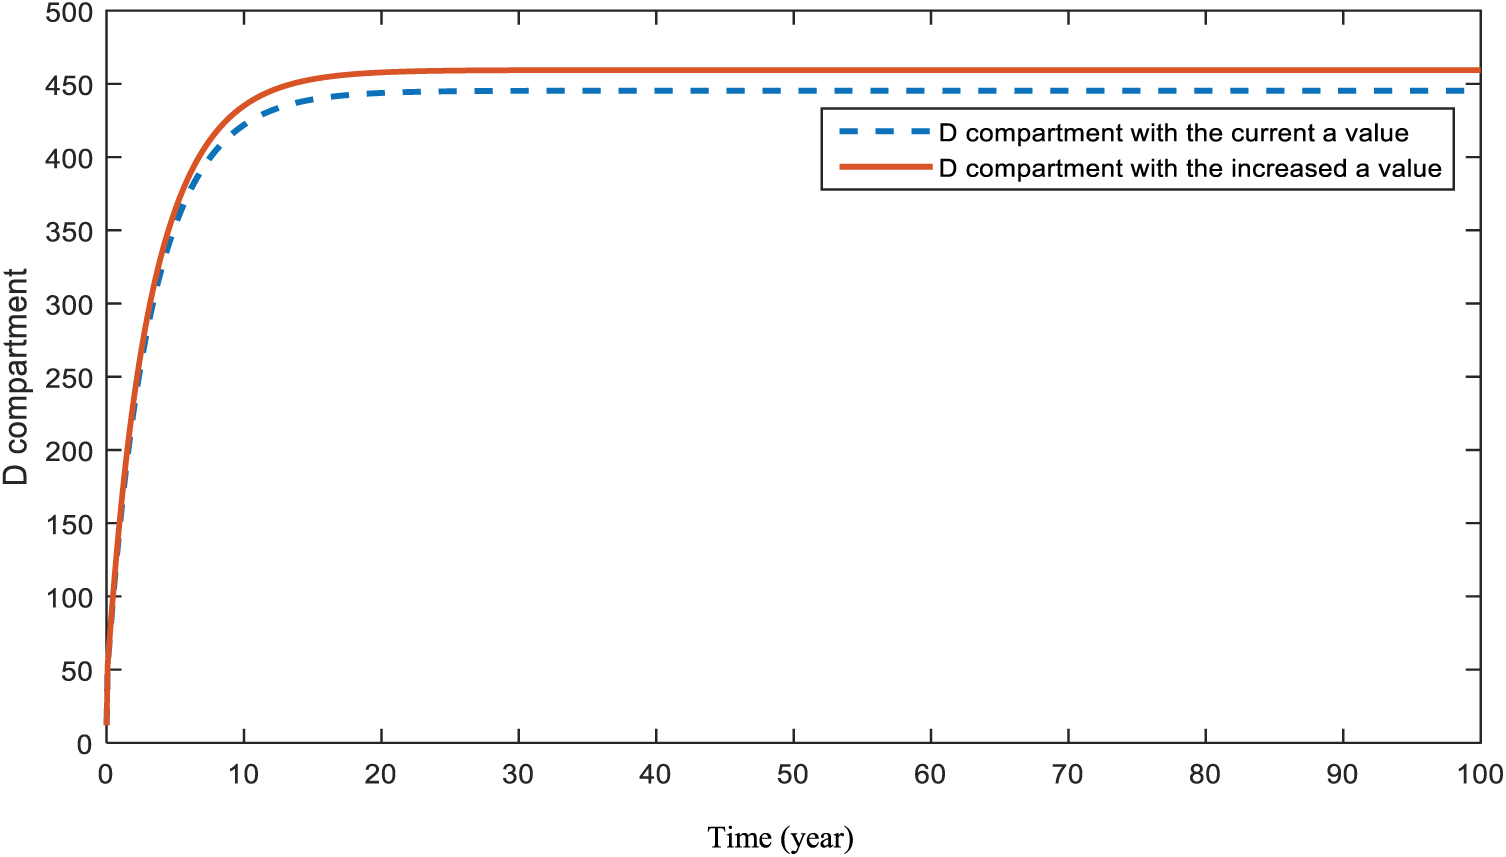
Figure 20: Sensitivity analysis of parameter
The main purpose of this study was to demonstrate how COVID-19 will affect the future of chronic diseases such as cancer, heart disease, and diabetes. In this regard, two mathematical models were proposed and proved with the required theorems. The first model consists of cancer-diagnosed and susceptible individuals, while in the second model, heart disease patients, diabetic patients, and susceptible individuals are included. The reason for the two separate models is the unrelated connection of cancer with heart disease and diabetes.
In the analysis of the first model, disease-free equilibrium,
In the same manner, the analysis of the second model demonstrated two existing equilibrium points for this model: the disease-free equilibrium point,
In Section 5, a sensitivity analysis was applied to the parameters of both models. This analysis aimed to specify the effects of the parameters on compartments C, H, and D. Figs. 6 and 7 demonstrate the result of an increase in smoking and obesity, respectively. Increases in both parameters will lead to an increase in the cancer compartment. However, even with a slight difference, the effect of smoking is bigger than the effect of obesity in compartment C. Similar results were also found and emphasized in papers [53–56]. In this model, the figure that shows the effect of hereditary transmission,
Fig. 8 shows the expectation when the effect of parameter c is increased. As expected, increases in people’s fear of seeing doctors will lead to a huge decrease in the diagnosis of cancer. Fig. 9 presents the situation of the cancer compartment a with a decreased c value. In this case, an increase is assumed again. However, this increase is much smaller than the increase in Fig. 8. Both Figs. 8 and 9 are a warning to the world about the COVID-19 pandemic. This problem can be solved by increasing people’s awareness and encouraging them not to postpone their doctor visits.
Figs. 10 and 11 display the effects of smoking and obesity on heart disease patients. According to the figures, an increase in both parameters will cause a rise in the
In [63], the authors dealt with the transmission of COVID-19 and the importance of preventive measures and lockdowns. On the other hand, reference [64] focused on discussing the complications of COVID-19 disease in diabetes-diagnosed individuals. This study mostly focuses on the effect of the COVID-19 lockdown on cancer, heart-related diseases, and diabetes-diagnosed individuals to determine what is expected to happen for these diseases in the future because of this lockdown.
Figs. 16 and 17 demonstrate the pattern of diabetes patients when obesity and hereditary rates are increased, respectively. In a recent study [65], the impact of both obesity and smoking were analyzed. Authors of [65] also emphasized the importance of obesity and smoking in diabetes patients. Although the increase in the parameters causes a rise in the pattern of the
As a result of the figures from the models, it is concluded that obesity is an effective parameter for the studied diseases and an increase in it will affect patients negatively. Smoking affects cancer and heart disease patients badly in the case of utilization. Heredity is a significant parameter for patients with diabetes and heart disease. Hence, people with a family history of these diseases should ensure that they attend their doctor visits. In addition, there is a strong relationship that cannot be ignored between diabetes and heart disease patients. As maintained in Figs. 15 and 20, people who are diagnosed with diabetes should be more careful and conscious about heart diseases.
On the other hand, both of the models indicated that the most dangerous parameter for the disease is c, (a negative effect of COVID-19), which is a result of the COVID-19 pandemic. In conclusion, the results showed that being aware of COVID-19 and its results may lead to a substantial decrease in deaths due to cancer, heart disease, and diabetes. That, combined with frequent doctor visits, could lead to the earlier diagnosis and treatment of these diseases.
This paper is prepared to emphasize the impact of COVID-19 on other serious diseases. The main purpose is to show that more epidemics and even pandemics may occur in the future in the case of insufficient control strategies. The study revealed that one of the reasons for this is to avoid doctor visits and regular checks because of the infectiousness of COVID-19. The presented study has a significant role in health sciences by being one of the strong models that discuss the effect of COVID-19 pandemic with different and serious perspectives.
The results of the sensitivity analysis should be utilized by healthcare systems and policymakers to develop control strategies to achieve better public health. Because obesity is linked to numerous health problems, tackling the issue is of the utmost significance. Public campaigns highlighting the dangers of obesity for one’s health should be launched immediately. In addition, funding smoking cessation programs is essential because of the harm that smoking causes to people with cancer and cardiovascular diseases. These campaigns may include anything from a public information campaign to the distribution of free or low-cost cessation aid and community resources. Genetic counselling can be extremely helpful for people who have a history of diabetes or cardiovascular disease in their families. Individuals can learn more about the hazards they face and receive direction on how to mitigate those dangers during these sessions. Furthermore, given the well-documented link between diabetes and cardiovascular disease, timely health checks are crucial. Patient results can be vastly improved by combining these checks with a holistic healthcare approach incorporating multidisciplinary teams. Cancer, heart disease, and diabetes are only some of the diseases whose rates and consequences have been significantly affected by the COVID-19 pandemic and its aftermath. Therefore, efforts to inform the public about the long-term consequences of the virus’s spread are crucial. The transmission of the virus and the ensuing health consequences can be reduced by ensuring universal vaccination and the use of preventative measures. At the same time, there is a critical need for more in-depth studies to understand the entire extent of the virus’s potential health effects. This knowledge is essential for the development of future public health treatments with greater precision. Individuals can be better prepared for disease treatment and prevention with the use of an integrated patient education framework that includes information on disease risks, symptom awareness, and the benefits of early diagnosis. Disease transmission that relies on memory qualities may also be better described by mathematical modeling with fractional derivatives [66–69], which is expected to increase degrees of freedom in the choice of order of the derivative. Finally, in order to effectively address the highlighted health risks and issues, it is essential to promote collaborations across health organizations, government bodies (Nongovernmental organizations), N.G.O.s, and other stakeholders.
Acknowledgement: As authors, we would like to thank the members of Mathematics Research Center of Near East University.
Funding Statement: The authors received no specific funding for this study.
Author Contributions: Study conception and design: F.N.E., N.G., E.H.; data collection: S.Q., K.H., A.S.; analysis and interpretation of results: S.Q., N.G., K.H., E.H.; draft manuscript preparation: F.N.E., S.Q., N.G., K.H., A.S. All authors reviewed the results and approved the final version of the manuscript.
Availability of Data and Materials: All data generated or analyzed during this study are included in this article.
Conflicts of Interest: The authors declare that they have no conflicts of interest to report regarding the present study.
References
1. Martcheva, M. (2015). Introduction. In: An Introduction to mathematical epidemiology, pp. 1–8. New York: Springer. [Google Scholar]
2. Khoury, M. J., Beaty, T. H., Cohen, B. H. (1993). Scope and strategies of genetic epidemiology. In: Fundamentals of genetic epidemiology, New York: Oxford University Press. [Google Scholar]
3. Gan, W. Q., Buxton, J. A., Scheuermeyer, F. X., Palis, H., Zhao, B. et al. (2021). Risk of cardiovascular diseases in relation to substance use disorders. Drug and Alcohol Dependence, 229, 109132. [Google Scholar] [PubMed]
4. World Health Organization. Cardiovascular diseases (CVDs). https://www.who.int/news-room/fact-sheets/detail/cardiovascular-diseases-(cvds). (accessed on 29/08/2023). [Google Scholar]
5. United Kingdom National Health Service. Cardiovascular disease. https://www.nhs.uk/conditions/cardiovascular-disease/. (accessed on 29/08/2023). [Google Scholar]
6. National Cancer Institute. Cancer statistics. https://www.cancer.gov/about-cancer/understanding/statistics. (accessed on 29/08/2023). [Google Scholar]
7. Imran Khan Cancer Appeal. What is cancer? https://www.ikca.org.uk/cancer-information/what-is-cancer/. (accessed on 29/08/2023). [Google Scholar]
8. American Cancer Society. Soft Tissue Sarcoma. https://www.cancer.org/cancer/types/soft-tissue-sarcoma.html. (accessed on 29/08/2023). [Google Scholar]
9. WHO, International Agency for Research on Cancer. Cancer today. https://gco.iarc.fr/today/home. (accessed on 29/08/2023). [Google Scholar]
10. World Health Organization. Cancer. https://www.who.int/news-room/fact-sheets/detail/cancer. (accessed on 29/08/2023). [Google Scholar]
11. American Cancer Society. Cancer Facts and Figures 2022. https://www.cancer.org/content/dam/cancer-org/research/cancer-facts-and-statistics/annual-cancer-facts-and-figures/2022/2022-cancer-facts-and-figures.pdf. (accessed on 29/08/2023). [Google Scholar]
12. Kalra, S., Zargar, A. H., Jain, S. M., Sethi, B., Chowdhury, S. et al. (2016). Diabetes insipidus: The other diabetes. Indian Journal of Endocrinology and Metabolism, 20, 9–21. [Google Scholar] [PubMed]
13. Chaudhary, N., Tyagi, N. (2018). Diabetes mellitus: An overview. International Journal of Research and Development in Pharmacy & Life Sciences, 7, 3030–3033. [Google Scholar]
14. World Health Organization. Diabetes. https://www.who.int/news-room/fact-sheets/detail/diabetes. (accessed on 29/08/2023). [Google Scholar]
15. Keeling, M. J., Danon, L. (2009). Mathematical modelling of infectious diseases. British Medical Bulletin, 92, 33–42. [Google Scholar] [PubMed]
16. Alridha, A. H., Al-Jilawi, A. S., Alsharify, F. H. S. (2022). Review of mathematical modelling techniques with applications in biosciences. Iraqi Journal for Computer Science and Mathematics, 3, 135–144. [Google Scholar]
17. White, P. J., Enright, M. C. (2010). Mathematical models in infectious disease epidemiology. In: Cohen J, Opal S. M., Powderly W. G. (Eds.Infectious diseases, pp. 70–75. Amsterdam, The Netherlands: Elsevier. [Google Scholar]
18. Columbia University Irving Medical Center. Responding to the COVID-19 pandemic. https://www.publichealth.columbia.edu/news/responding-covid-19-pandemic. (accessed on 29/08/2023). [Google Scholar]
19. Mathieu, E., Ritchie, H.,Rodés Guirao, L., Appel, C., Gavrilov, D. et al. Coronavirus Pandemic (COVID-19). https://ourworldindata.org/coronavirus. (accessed on 29/08/2023). [Google Scholar]
20. Yang, Z., Zeng, Z., Wang, K., Wong, S. S., Liang, W. et al. (2020). Modified SEIR and A.I. prediction of the epidemics trend of COVID-19 in China under public health interventions. Journal of Thoracic Disease, 12, 165–174. [Google Scholar] [PubMed]
21. Mwalili, S., Kimathi, M., Ojiambo, V., Gathungu, D., Mbogo, R. (2020). SEIR model for COVID-19 dynamics incorporating the environment and social distancing. BMC Research Notes, 13, 352. [Google Scholar]
22. Jentsch, P. C., Anand, M., Bauch, C. T. (2021). Prioritising COVID-19 vaccination in changing social and epidemiological landscapes: A mathematical modelling study. The Lancet Infectious Diseases, 21,1097–1106. [Google Scholar] [PubMed]
23. Matrajt, L., Eaton, J., Leung, T., Brown, E. R. (2021). Vaccine optimization for COVID-19: Who to vaccinate first? Science Advances, 7, eabf1374. [Google Scholar] [PubMed]
24. Alazman, I., Albalawi, K. S., Goswami, P., Malik, K. (2023). A restricted SIR model with vaccination effect for the epidemic outbreaks concerning COVID-19. Computer Modeling in Engineering & Sciences, 137(3), 2409–2425. https://doi.org/10.32604/cmes.2023.028674 [Google Scholar] [PubMed] [CrossRef]
25. Kaymakamzade, B., Hincal, E., Gokbulut, N., Sanlidag, T. (2022). Analyzing the relationship between COVID-19 and proportions of vaccine & mobility. In: Uzun Ozsahin, D., Uzun, B., Sanlidag, T., LaMoreaux, J. (Eds.Decision analysis applied to the field of environmental health. professional practice in earth sciences, pp. 65–76. Cham: Springer. [Google Scholar]
26. Shaikh, A. S., Shaikh, I. N., Nisar, K. S. (2020). A mathematical model of COVID-19 using fractional derivative: Outbreak in India with dynamics of transmission and control. Advances in Difference Equations, 2020, 373. [Google Scholar] [PubMed]
27. Ahmad, Z., El-Kafrawy, S. A., Alandijany, T. A., Giannino, F., Mirza, A. A. et al. (2022). A global report on the dynamics of COVID-19 with quarantine and hospitalization: A fractional order model with non-local kernel. Computational Biology and Chemistry, 98, 107645. [Google Scholar] [PubMed]
28. Ahmad, Z., Arif, M., Ali, F., Khan, I., Nisar, K. S. (2020). A report on COVID-19 epidemic in Pakistan using SEIR fractional model. Scientific Reports, 10, 22268. [Google Scholar] [PubMed]
29. Ahmad, S., Ullah, A., Al-Mdallal, Q. M., Khan, H., Shah, K. et al. (2020). Fractional order mathematical modeling of COVID-19 transmission. Chaos, Solitons & Fractals, 139, 110256. [Google Scholar]
30. Abdo, M. S., Shah, K., Wahash, H. A., Panchal, S. K. (2020). On a comprehensive model of the novel coronavirus (COVID-19) under Mittag-Leffler derivative. Chaos, Solitons & Fractals, 135, 109867. [Google Scholar]
31. Naughton, F., Ward, E., Khondoker, M., Belderson, P., Minihane, A. M. et al. (2021). Health behaviour change during the UK COVID-19 lockdown: Findings from the first wave of the C-19 health behaviour and well-being daily tracker study. British Journal of Health Psychology, 26, 624–643. [Google Scholar] [PubMed]
32. Albahri, O. S., Al-Obaidi, J. R., Zaidan, A. A., Albahri, A. S., Zaidan, B. B. et al. (2020). Helping doctors hasten COVID-19 treatment: Towards a rescue framework for the transfusion of best convalescent plasma to the most critical patients based on biological requirements via ml and novel MCDM methods. Computer Methods and Programs in Biomedicine, 196, 105617. [Google Scholar] [PubMed]
33. Albahri, O. S., Zaidan, A. A., Albahri, A. S., Zaidan, B. B., Abdulkareem, K. H. et al. (2020). Systematic review of artificial intelligence techniques in the detection and classification of COVID-19 medical images in terms of evaluation and benchmarking: Taxonomy analysis, challenges, future solutions and methodological aspects. Journal of Infection and Public Health, 13, 1381–1396. [Google Scholar] [PubMed]
34. Raza, A., Baleanu, D., Cheema, T. N., Fadhal, E., Ibrahim, R. I. H. et al. (2023). Artificial intelligence computing analysis of fractional order COVID-19 epidemic model. AIP Advances, 13, 085017. [Google Scholar]
35. Hedayati, M., Ezzati, R., Noeiaghdam, S. (2021). New procedures of a fractional order model of novel coronavirus (COVID-19) outbreak via wavelets method. Axioms, 10(2), 122. [Google Scholar]
36. Rezapour, S., Asamoah, J. K. K., Etemad, S., Akgül, A., Avcı, İ. et al. (2023). On the fractal-fractional Mittag-Leffler model of a COVID-19 and Zika co-infection. Results in Physics, 55, 107118. [Google Scholar]
37. Zafar, Z. U. A., Khan, M. A., Inc, M., Akgül, A., Asiri, M. et al. (2023). The analysis of a new fractional model to the Zika virus infection with mutant. Heliyon, 10, e23390. [Google Scholar] [PubMed]
38. Rakshit, P., Kumar, S., Noeiaghdam, S., Fernandez-Gamiz, U., Altanji, M. et al. (2022). Modified SIR model for COVID-19 transmission dynamics: Simulation with case study of UK, US and India. Results in Physics, 40, 105855. [Google Scholar] [PubMed]
39. Attaullah, Jan, R., Yüzbaşı, S. (2021). Dynamical behaviour of HIV infection with the influence of variable source term through Galerkin method. Chaos, Solitons & Fractals, 152, 111429. [Google Scholar]
40. Attaullah, Jan, R., Jabeen, A. (2020). Solution of the hiv infection model with full logistic proliferation and variable source term using galerkin scheme. Matrix Science Mathematic, 4, 37–43. [Google Scholar]
41. Savasan, A., Kaymakamzade, B., Gokbulut, N., Hincal, E., Yoldascan, E. (2022). Sensitivity analysis of COVID-19 in mediterranean island. Computer Modeling in Engineering & Sciences,130(1), 133–148. https://doi.org/10.32604/cmes.2022.017815 [Google Scholar] [CrossRef]
42. Panetta, J. C., Chaplain, M. A. J., Adam, J. A. (1998). The mathematical modelling of cancer: A review: Mathematical models in medical and health science. In: Webb, G. F. (Ed.Mathematical models in medical and health science, pp. 281–309. Nashville, Tennessee: Vanderbilt University Press. [Google Scholar]
43. Cancer Research U.K. Worldwide cancer statistics. https://www.cancerresearchuk.org/health-professional/cancer-statistics/worldwide-cancer#heading-Zero. (accessed on 29/08/2023). [Google Scholar]
44. Taylor, C. J., Ordonez-Mena, J. M., Roalfe, A. K., Lay-Flurrie, S., Jones, N. R. et al. (2019). Trends in survival after a diagnosis of heart failure in the United Kingdom 2000–2017: Population-based cohort study. BMJ, 364, l223. [Google Scholar]
45. Cardiovascular disease. https://fingertips.phe.org.uk/profile-group/cardiovascular-disease-diabetes-kidney-disease/profile/cardiovascular/data#page/4/gid/1938133107/pat/159/par/K02000001/ati15/are/E92000001/iid/241/age/187/sex/4/cat/-1/ctp/-1/yrr/1/cid/4/tbm/1. (accessed on 29/08/2023). [Google Scholar]
46. Salehidoost, R., Mansouri, A., Amini, M., Yamini, S. A., Aminorroaya, A. (2020). Diabetes and all-cause mortality, a 18-year follow-up study. Scientific Reports, 10, 3183. [Google Scholar] [PubMed]
47. British Heart Foundation, Heart statistics. https://www.bhf.org.uk/what-we-do/our-rese. (accessed on 18/10/2023). [Google Scholar]
48. Zeeman, E. C. (1988). Stability of dynamical systems. Nonlinearity, 1, 115. [Google Scholar]
49. Michel, A. N., Hou, L., Liu, D. (2015). On the role of monotonic and non-monotonic lyapunov functions. In: Stability of dynamical systems. Switzerland: Birkhauser. [Google Scholar]
50. Worldometer. https://www.worldometers.info/. (accessed on 18/10/2023). [Google Scholar]
51. World Health Organization. Diabetes. https://www.who.int/health-topics/diabetes#tab=tab_1. (accessed on 18/10/2023). [Google Scholar]
52. Gibson, M. Endemic (epidemiology). https://www.wikidoc.org/index.php/Endemic_(epidemiology). (accessed on 29/08/2023). [Google Scholar]
53. Arnold, M., Leitzmann, M., Freisling, H., Bray, F., Romieu, I. et al. (2016). Obesity and cancer: An update of the global impact. Cancer Epidemiology, 41, 8–15. [Google Scholar] [PubMed]
54. Colditz, G. A., Peterson, L. L. (2018). Obesity and cancer: Evidence, impact, and future directions. Clinical Chemistry, 64, 154–162. [Google Scholar] [PubMed]
55. Schuller, H. M. (2019). The impact of smoking and the influence of other factors on lung cancer. Expert Review of Respiratory Medicine, 13, 761–769. [Google Scholar] [PubMed]
56. Jacob, L., Freyn, M., Kalder, M., Dinas, K., Kostev, K. (2018). Impact of tobacco smoking on the risk of developing 25 different cancers in the UK: A retrospective study of 422,010 patients followed for up to 30 years. Oncotarget, 9, 17420–17429. [Google Scholar] [PubMed]
57. Henrikson, N. B., Webber, E. M., Goddard, G. A., Scrol, A., Piper, M. et al. (2015). Family history and the natural history of colorectal cancer: Systematic review. Genetics in Medicine, 17, 702–715. [Google Scholar] [PubMed]
58. Murff, H. J., Byrne, S., Syngal, S. (2004). Cancer risk assessment: Quality and impact of the family history interview. American Journal of Preventive Medicine, 27, 239–245. [Google Scholar] [PubMed]
59. Buttar, H. S., Li, T., Ravi, N. (2005). Prevention of cardiovascular diseases: Role of exercise, dietary interventions, obesity and smoking cessation. Journal of Clinical and Experimental Cardiology, 10, 229–249. [Google Scholar]
60. Akbartabartoori, M., Lean, M. E. J., Hankey, C. R. (2006). Smoking combined with overweight or obesity markedly elevates cardiovascular risk factors. European Journal of Preventive Cardiology, 13, 938–946. [Google Scholar]
61. Moonesinghe, R., Yang, Q., Zhang, Z., Khoury, M. J. (2019). Prevalence and cardiovascular health impact of family history of premature heart disease in the United States: Analysis of the national health and nutrition examination survey, 2007–2014. Journal of the American Heart Association, 8, e012364. [Google Scholar] [PubMed]
62. McCusker, M. E., Yoon, P. W., Gwinn, M., Malarcher, A. M., Neff, L. et al. (2004). Family history of heart disease and cardiovascular disease risk-reducing behaviors. Genetics in Medicine, 6, 153–158. [Google Scholar] [PubMed]
63. Bugalia, S., Bajiya, V. P., Tripathi, J. P., Li, M. T., Sun, G. Q. (2020). Mathematical modeling of COVID-19 transmission: The roles of intervention strategies and lockdown. Mathematical Biosciences and Engineering, 17, 5961–5986. [Google Scholar] [PubMed]
64. Okyere, S., Ackora-Prah, J. A. (2022). Mathematical model of transmission dynamics of SARS-CoV-2 (COVID-19) with an underlying condition of diabetes. International Journal of Mathematics and Mathematical Sciences, 2022, 1–15. [Google Scholar]
65. Ahmad, H., Khan, M. N., Ahmad, I., Omri, M., Alotaibi, M. F. (2023). A meshless method for numerical solutions of linear and nonlinear time-fractional black-scholes models. AIMS Mathematics, 8, 19677–19698. [Google Scholar]
66. Zarin, R., Khan, M., Khan, A., Yusuf, A. (2023). Deterministic and fractional analysis of a newly developed dengue epidemic model. Waves in Random and Complex Media. https://doi.org/10.1080/17455030.2023.2226765 [Google Scholar] [CrossRef]
67. Sabir, Z., Guirao, J. L. (2023). A soft computing scaled conjugate gradient procedure for the fractional order majnun and layla romantic story. Mathematics, 11, 835. [Google Scholar]
68. Abdel-Gawad, H. I., Sulaiman, T. A., Ismael, H. F. (2023). Study of a nonlinear Schrodinger equation with truncated M proportional derivative. Optik, 290, 171252. [Google Scholar]
69. Jamil, S., Farman, M., Akgül, A., Saleem, M. U., Hincal, E. et al. (2023). Fractional order age dependent COVID-19 model: An equilibria and quantitative analysis with modeling. Results in Physics, 53, 106928. [Google Scholar]
Cite This Article
 Copyright © 2024 The Author(s). Published by Tech Science Press.
This work is licensed under a Creative Commons Attribution 4.0 International License , which permits unrestricted use, distribution, and reproduction in any medium, provided the original work is properly cited.
 Downloads
 Citation Tools