
 Submit a Paper
 Propose a Special lssue
 Open Access
ARTICLE

Methodology for Detecting Non-Technical Energy Losses Using an Ensemble of Machine Learning Algorithms
1 Department of Computer Modeling and Design Automation, Faculty of Information Technology and Electronic Engineering, North Caucasian Institute of Mining and Metallurgy (State Technological University), Vladikavkaz, 362021, Russia
2 Department of Automation and Control, Moscow Polytechnic University, Moscow, 107023, Russia
* Corresponding Author: Roman Klyuev. Email:
Computer Modeling in Engineering & Sciences 2025, 143(2), 1381-1399. https://doi.org/10.32604/cmes.2025.064502
Received 17 February 2025; Accepted 08 May 2025; Issue published 30 May 2025
 View Full Text
 Download PDF
Abstract
Non-technical losses (NTL) of electric power are a serious problem for electric distribution companies. The solution determines the cost, stability, reliability, and quality of the supplied electricity. The widespread use of advanced metering infrastructure (AMI) and Smart Grid allows all participants in the distribution grid to store and track electricity consumption. During the research, a machine learning model is developed that allows analyzing and predicting the probability of NTL for each consumer of the distribution grid based on daily electricity consumption readings. This model is an ensemble meta-algorithm (stacking) that generalizes the algorithms of random forest, LightGBM, and a homogeneous ensemble of artificial neural networks. The best accuracy of the proposed meta-algorithm in comparison to basic classifiers is experimentally confirmed on the test sample. Such a model, due to good accuracy indicators (ROC-AUC-0.88), can be used as a methodological basis for a decision support system, the purpose of which is to form a sample of suspected NTL sources. The use of such a sample will allow the top management of electric distribution companies to increase the efficiency of raids by performers, making them targeted and accurate, which should contribute to the fight against NTL and the sustainable development of the electric power industry.Keywords
Like any other type of loss, electricity losses are lost profits for businesses and are one of the most serious problems in the electric power industry worldwide. The monetary value of global non-technical losses (NTL) is about 96 billion dollars [1], of which about 60 billion dollars is in developing electricity markets [2].
The causes of NTL are related to fraud, theft of electricity by consumers, and problems with metering [3]. Unlike technical losses, NTLs are not inevitable, and the electric power system can never be 100% protected from them. For this reason, the creation of tools for their timely detection is an important task that will reduce these costs [4,5]. In turn, the saved financial resources, depending on the company’s policy, can be directed to the modernization of equipment or the reduction of tariffs for consumers. Therefore, taking measures and addressing the NTL problem contributes to the implementation of the seventh goal of the sustainable development program: “Ensuring universal access to affordable, reliable, sustainable and modern energy for all” [6].
For example, the financial damage from NTL in the USA is estimated at 6 billion dollars per year, and in the UK, it is 175 million pounds sterling per year [7]. In the USA, electricity is the third largest theft item after credit card data and cars [8]. At the same time, it should be considered that in developing countries, the problem of electricity losses is more significant [9]. For example, India’s losses from NTL are estimated at more than 25% of generated electricity or more than 4.8 billion rupees per year [10]. In Brazil, losses from NTL were about 16%. The local electricity distribution company calculated the volume of electricity losses to be about 15% in the Republic of Turkey [11]. Electricity losses amount to 0.89 billion rupees annually due to NTL in Pakistan [12]. In sub-Saharan Africa, about 50% of the supplied electricity is lost [13]. In Jamaica in 2013, NTLs amounted to 46 million dollars, representing 18% of the total energy bill [14]. In comparison, in more technologically advanced and economically strong countries such as China and the United States, total electricity losses are around 4.5% and 5% per year, respectively [15,16].
Thus, the problem of electricity losses is relevant to all countries, especially for developing countries, where the share of NTL in the structure of total losses is high. Detection and elimination of NTL are associated with the inspection and implementation of measures directly at the consumer’s place of residence. This makes the detection of NTL a labor-intensive and complex task for employees of electricity distribution companies.
It should be considered that the future of the energy industry largely depends on its ability to adapt to rapidly changing conditions and optimize internal processes [17]. The methodological basis for the possibility of adaptation is the implementation of the “Smart Grid” (SG) concept [18].
NTL is an intentional act of illegal use of electricity, which is the main reason for non-payment. The cause of such violation is either the illegal use of electricity or the occurrence of technical faults. However, the NTL problem is characterized by many fraudulent activities, so it is a complex problem that requires not only advanced metering infrastructure (AMI) but also comprehensive measures, including the use of advanced achievements in data analytics and machine learning. Various studies in the field of NTL detection can identify certain customer behavior characteristics of a specific type of NTL. The methods of NTL occurrence can be classified into intentional theft, electricity fraud, and systemic errors in electricity metering. This problem can be solved by developing intelligent data processing methods based on machine learning to detect difficult-to-detect fraudulent activities [19].
Currently, this concept is partially implemented in many countries, and some of its features have a positive effect on reducing losses. SG involves the introduction of more hack-resistant AMI and automated collection of energy consumption data. Using this collected information opens opportunities for NTL detection using machine learning methods.
Ge et al. [20] developed a double-layer stacking optimization methodology for electricity theft detection, considering data incompleteness and intra-class imbalance. This methodology consists of a two-stage time series generative adversarial network (TimeGAN) with an integrated two-layer stacking optimization configuration. The first stage addresses the problem of data incompleteness by using an improved version of TimeGAN that uses embedding and restoration layers to reconstruct incomplete electricity user data. It introduces an analog denoising learning method and supervised information assistance to improve the interpolation accuracy. In the second stage, the method eliminates class imbalances in electricity theft detection by using a K-shape clustering algorithm to identify unique patterns in theft data. The performance of this method is better than that of the baseline methods in terms of AUC, which is 3.45%, and the F1-score is 5.6%.
Chen et al. [21] proposed a method that combines discrete wavelet transform for feature extraction, fuzzy C-means clustering for anomaly grouping, and weighted multiclass logistic regression for ensemble learning. This approach removes restrictions on existing methods that struggle with limited labeled data and the emergence of new, unobservable theft patterns. The effectiveness of the proposed method was demonstrated through extensive experiments. The proposed methodology outperformed traditional NTL detection methods and achieved an average Area Under the Precision-Recall Curve (AUC-PR) of 0.76 and an Area Under the Receiver Operating Characteristic Curve (AUC-ROC) of 0.84 across five different types of energy theft.
Nirmal et al. [22] proposed a hybrid method. The method solved various issues, such as the curse of dimensionality, data imbalance problems, and learning existing models that give low theft detection rates. The proposed model was divided into different modules. The first one is used for data preprocessing, which includes removing outliers and missing values and solving data imbalance problems. The second one contains a convolutional neural network (CNN), which receives the processed data from the first module as its input. CNN extracts the key features from the processed data, and the new dataset is fed to adaptive boosting, also called the AdaBoost algorithm, which performs the classification of legitimate and fraudulent users.
Ullah et al. [23] proposed a three-layer framework that uses a stacking ensemble model to combine the advantages of several machine learning algorithms. In the first stage, data preprocessing was performed. As a result of this stage, missing data were filled out using the linear interpolation method, and min-max normalization of features was performed. As is known, the problem of high-class imbalance is common in most real data sets. At the last stage of the structure proposed in [23], four basic Machine Learning (ML) classifiers and five meta-classifiers were employed to raise the accuracy of NTL detection.
As noted in [24], machine learning is widely utilized to solve the NTL problem. In particular, a promising way to identify NTL is to classify customers into normal and abnormal (suspicious, typical of NTL) consumption. The algorithms XGBoost [25], LightGBM [26] and CatBoost [27] were applied. Among the problems that need to be overcome, the authors highlighted the classic problems that can be found in similar data science projects, such as incomplete and unbalanced training data, which lead to unsatisfactory results.
Several other studies confirm the high efficiency of using machine learning methods. In compliance with the research by Gunturi and Sarkar [28], they proposed a method for detecting NTL in electricity using an ensemble machine learning classifier. The problem of data imbalance was solved using the synthetic minority oversampling technique (SMOTE) [29]. Boosting, random forest, and additional tree methods were utilized to classify consumers. The best results were obtained by the random forest method based on the Roc metric—AUC 0.9.
Avila et al. [30] proposed a framework including a rigorous outlier detection method using smoothing spline functions, discrete wavelet packet transform with maximum overlap for feature extraction and selection and a random undersampling boosting algorithm for NTL classification. The experimental results showed that the proposed framework has the Matthews correlation coefficient, Roc-AUC, F1-score, precision, and recall of 0.7300, 0.8187, 0.8263, 0.8864, and 0.6500, respectively.
Several research papers have successfully tested deep learning methods. Hasan et al. [31] proposed an electricity theft detection system based on a combination of convolutional neural network (CNN) and long short-term memory (LSTM) architecture. They indicated that this is a widely used method that automates the feature extraction and classification process. In this work, a data preprocessing algorithm was also implemented to calculate the missing instances in the dataset based on the linear interpolation algorithm. The target variable balancing was also performed using the SMOTE method.
Pereira and Saraiva [32] conducted comparative research between several strategies for balancing datasets and applied several ML methods to select the most accurate ML and data processing methods. The best combination was the combined use of SMOTE and a multilayer perceptron (artificial neural network) with two hidden layers with AUC and F1-score values of 0.6792 and 0.3169, respectively. Linear interpolation was utilized to fill in missing values [32].
Saqib et al. [33] developed a deep learning model to detect NTL in the power distribution network. During the research, the problem of an imbalanced dataset is substantiated, and various strategies are applied to correct this issue. The best combination, because of testing the sampling methods on the dataset, was obtained by the Random-Over-Sampler method and Multilayer Perceptron with three hidden layers by the metrics of precision (0.89), recall (0.94), and F1 score (0.91).
Hussain et al. [34] presented a new ML method using structured features and gradient descent with ensemble (NGBoost) for fraud detection in electricity consumption data. This method used random forest to fill in missing values and the majority-weighted minority oversampling technique (MWMOTE) to distribute data samples evenly. The resulting dataset was used by the NGBoost algorithm to classify consumers into normal and energy thieves. The proposed framework achieved accuracy of 93%, recall of 91%, and precision of 95%.
During the research by Coma-Puig and Carmona [35,36], regression methods for determining NTL were used. The results of the research [35,36] are aimed at making the process of NTL identification more explainable and interpretable. Despite the experiments conducted, which indicate some promise for this approach, the researchers also noted the following shortcomings: questionable efficiency for electricity markets with a high level of NTL, worse accuracy than difficult to interpret, and black box classification algorithms.
Morgoev et al. [24] employed regression analysis together with the K-means cluster method. Similar approaches [24,35,36] made the detection process more predictable, but such methodologies are not suitable for scenarios where NTL has occurred over a long time and the time series with thefts has acquired the property of stationarity. Such an approach can serve as a methodological basis for a consumption monitoring system aimed at preventing the occurrence of NTL.
The results of the brief analysis of studies on the considered problem of identifying NTL sources indicate that ML is a reasonably effective means for solving it. It can be stated that the implementation of AMI and the analysis of the information it collects allow for the identification of loss sources with high accuracy using ML methods. At the same time, the results in the considered works can differ due to the difference in samples and the complexity of distinguishing normal and NTL. Accordingly, due to the lack of an NTL detection methodology, the accuracy of which will be confirmed by many researchers, and the constant improvement of electricity theft methods, the development of new consumption classification methodologies is an urgent task. The solution to this problem will make raids by employees of energy distribution companies more targeted when detecting NTL and, therefore, more effective.
This research aims to develop an ML model that analyzes time series data of electricity consumption to reduce NTL. The output of this model is the NTL probability of the energy consumer.
The electricity consumption time series datasets are large, highly detailed samples and tend to be increasingly large (in many of the studies reviewed, the measurement period is 24 h, and the measurement duration can be several years). Based on this, the following hypotheses were formulated:
1. Identification of NTL by ML methods is effective using retrospective data on electricity consumption in distribution networks. Analysis of this data will allow employees of energy distribution organizations to carry out targeted, highly effective raids with less labor and time costs.
2. It is possible to identify all sources of NTL based on time series data on electricity consumption.
3. The ensemble algorithms for detecting NTL are more accurate than single classifiers for the task of data analysis and NTL detection.
Research was conducted, which included the development of an ensemble meta-algorithm (stacking) to test these hypotheses. The main stages of this development are presented in Fig. 1.
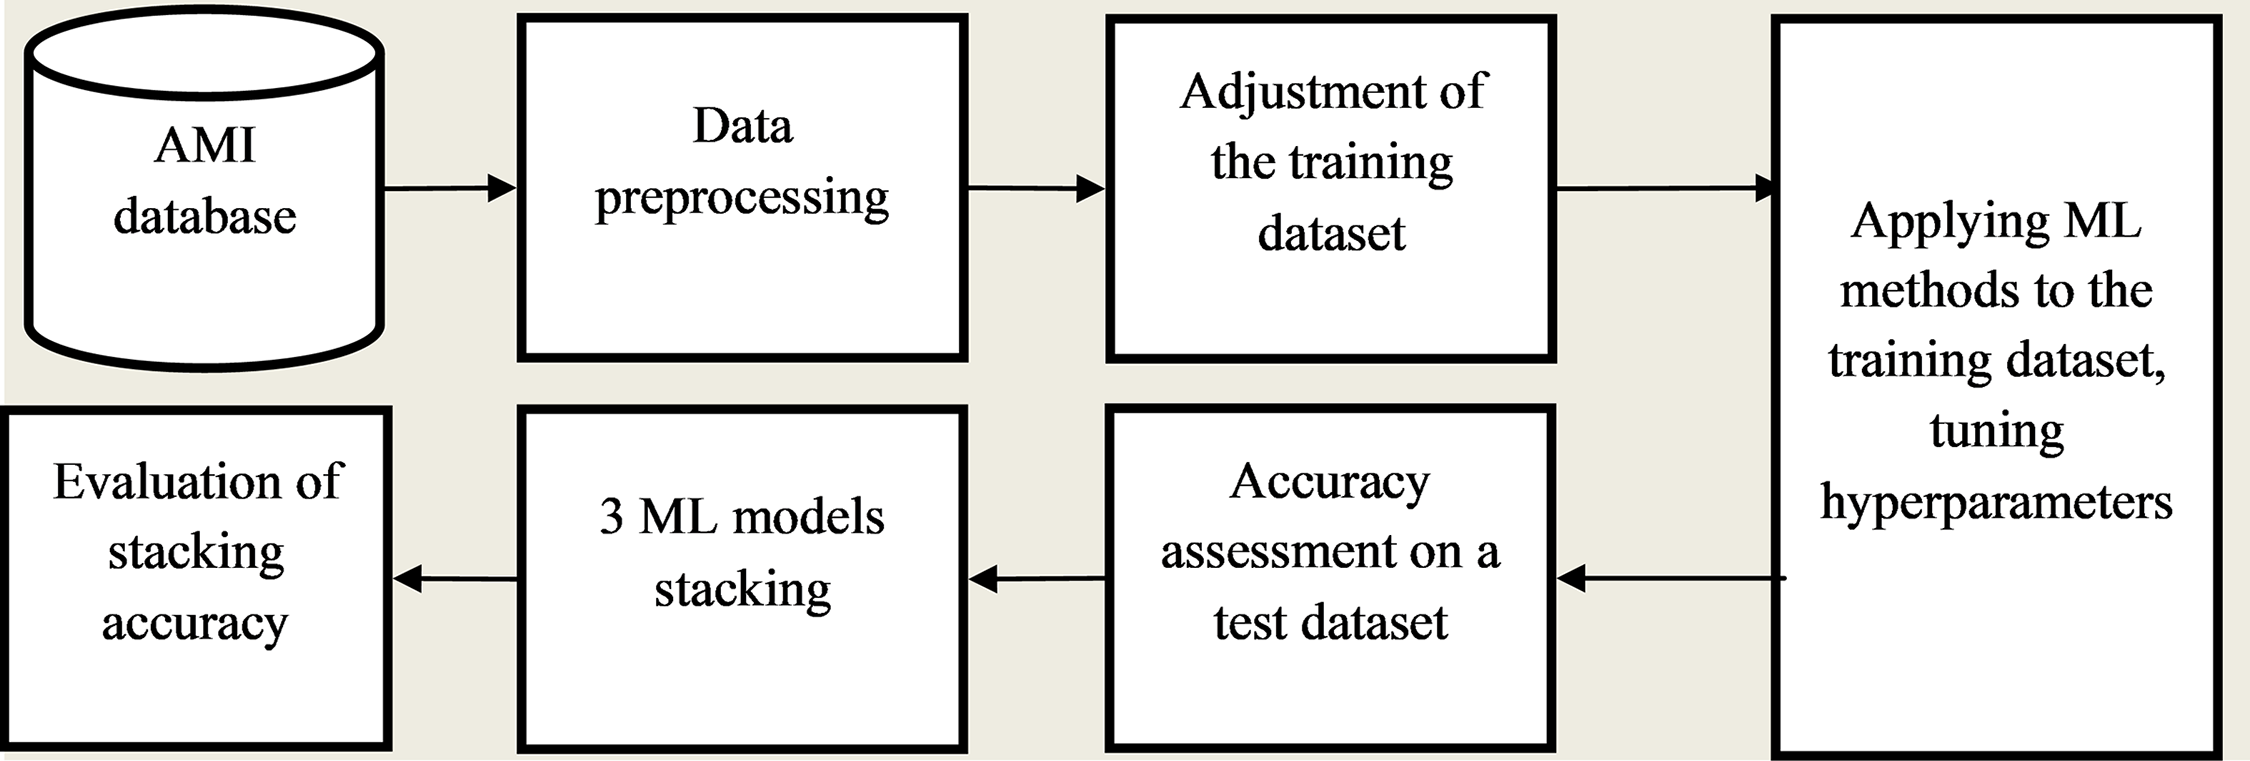
Figure 1: Architecture of the ensemble method (stacking) for detecting NTL
Further narration of the results of the research was conducted in accordance with the stages indicated in Fig. 1. At the same time, based on the brief literature review conducted, due to the difference in the samples used, the results of the modeling can differ somewhat from the results of the works reviewed.
2.1 Data Collection and Preprocessing
The dataset used in this study is composed of real electricity consumption data collected using the AMI. It consists of 24,957-time series of energy consumption over 1035 days, of which 21,342 profiles are normal consumption and 3615 are NTL. However, the data contains many missing values (more than 2 million), the causes of which are varied: failure of metering devices, adverse weather conditions for billing, errors, failures, damage to storage media, and others.
Missing values were filled out using different methods to identify the most suitable one. The following methods were used: replacement by a constant (mean), linear interpolation (LI) calculated by Eq. (1), and an enhanced version of Dynamic Time Warping based Imputation (eDTWBI) [37]. The choice of methods is determined by the structure of the time series and the different computational complexity of the methods. The expediency of using eDTWBI, along with simpler ones, is determined by many missing values in the time series, nonlinearity of the distribution of time series values, and high autocorrelation of the data. Table 1 presents the performance results of these methods for the metrics of the determination coefficient (R2), mean absolute error (MAE), and the square root of the root mean squared error (RMSE), calculated by Eqs. (2)–(4) for the actual values of the time series (y) and reconstructed using these methods (
where Xi is an element of a time series, n is the number of values of a time series.

The best results in filling in missing values for all metrics were obtained by the eDTWBI method. This is probably because the original data are a time series of electricity consumers, for some of which the number of missing values is quite large. Therefore, methods such as linear interpolation and others restore values worse than eDTWBI, which is adapted for time series with a nonlinear distribution and a large number of missing values. Let us consider the principle of method operation in more detail.
Their imputation was performed using linear interpolation (LI) methods for single missing values (where the gap was 1) and an enhanced version of Dynamic Time Warping based Imputation (eDTWBI) for sequences of missing values (where the gap was more than 1).
The basic principle of filling the missing values of eDTWBI is to find a reference window of previous or future known values of the time series. The essence of this algorithm is shown in Fig. 2. In this image, the following stages of applying the eDTWBI method are designated by numbers: 1—query construction, 2—comparison of sliding windows, 3—selection of the most similar windows, 4—filling missing values.
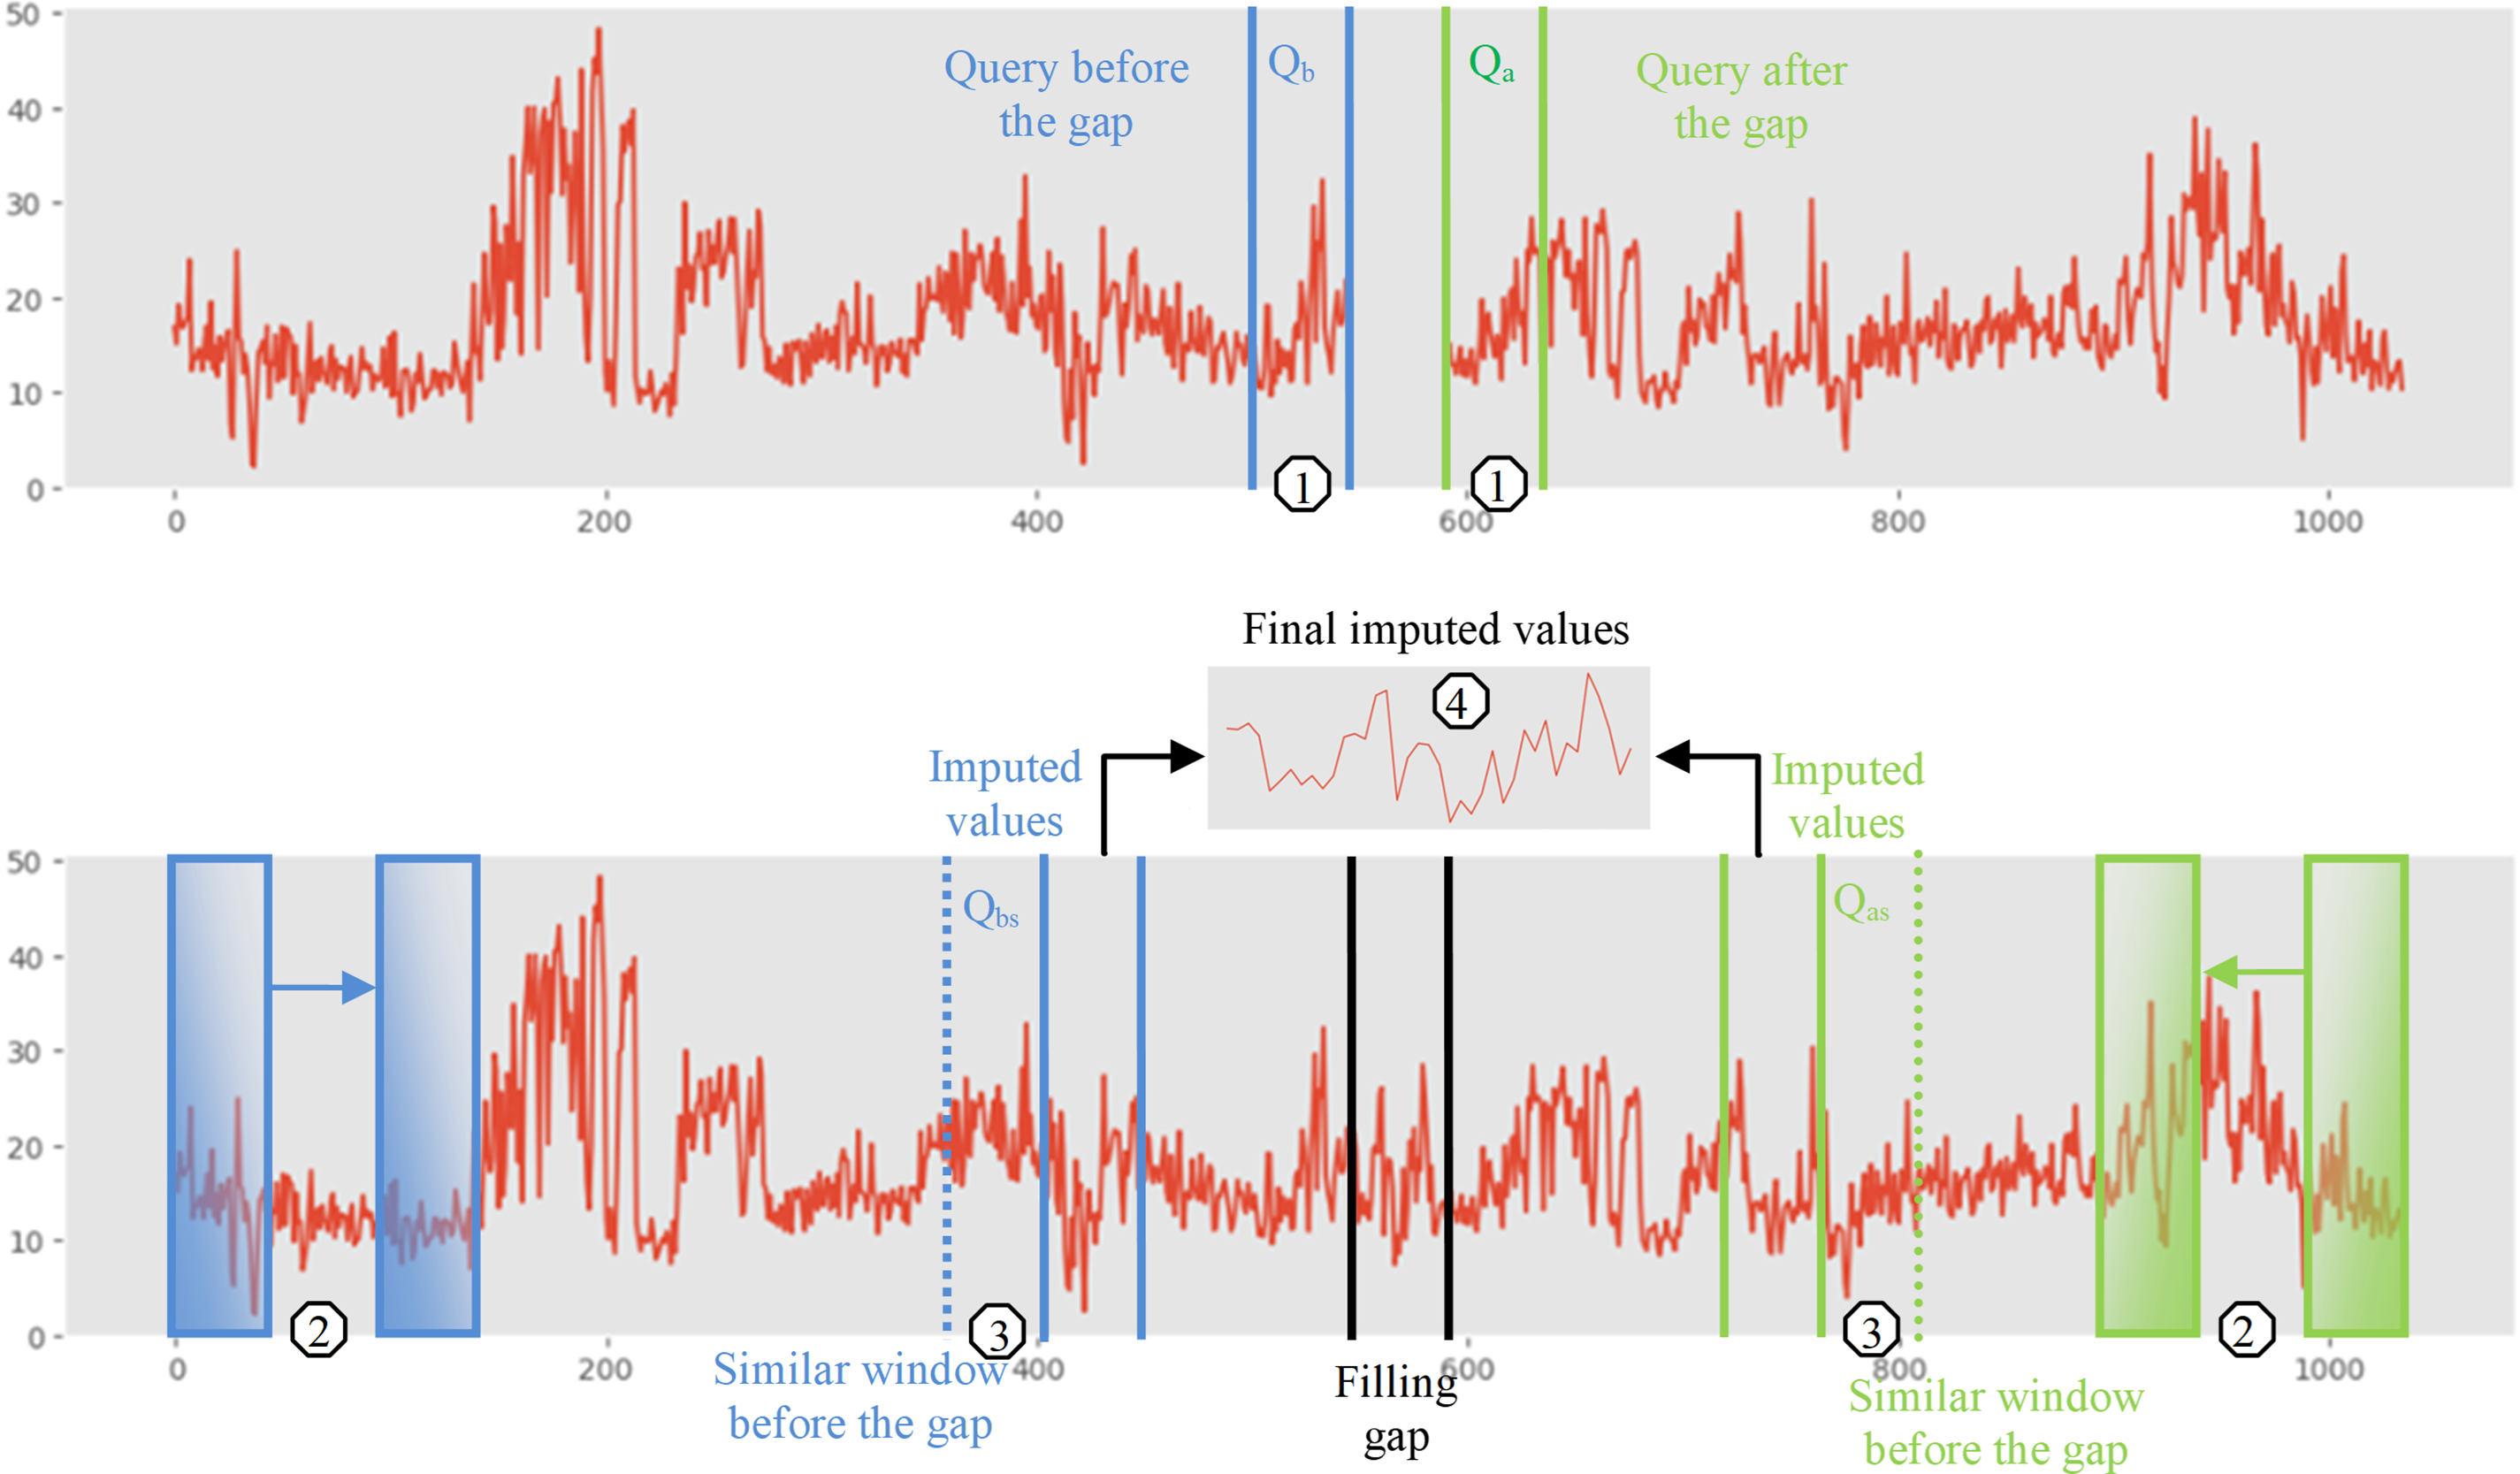
Figure 2: Schematic diagram of the eDTWBI method for the missing value replacement problem
The preprocessed dataset was visualized using the stochastic neighbor embedding algorithm with t-distribution [38], Fig. 3.
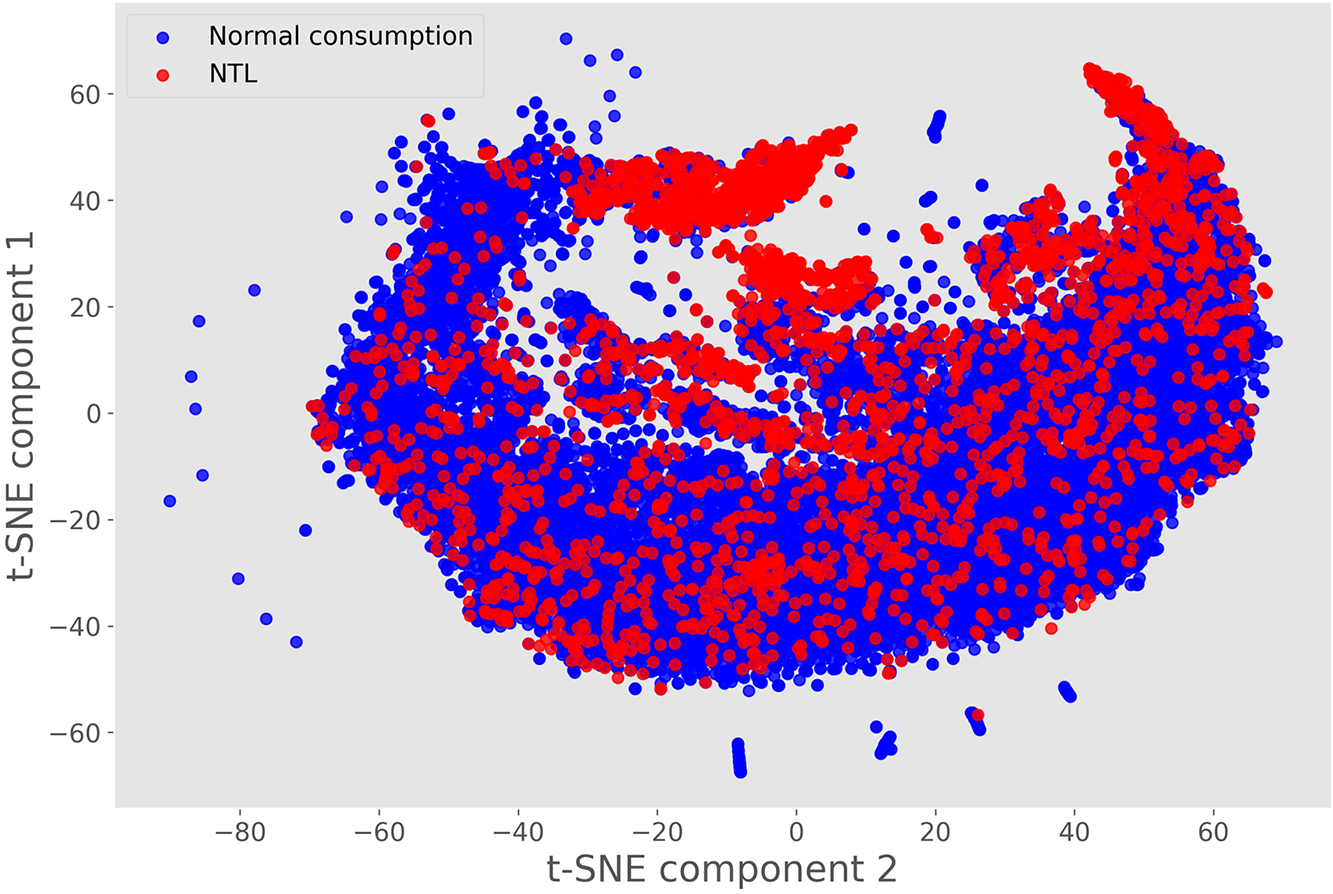
Figure 3: Visualization of the original dataset by using stochastic neighbor embedding algorithm with t-distribution (t-SNE method)
Visualizing the dataset indicates that many instances of NTL are difficult to separate from normal electricity consumption, which is a significant problem for classification.
After preliminary data processing for further modeling, the time series were brought to a single standard, and the class labels for the target variable were balanced.
2.2 Normalization, Splitting the Dataset, and Balancing the Target Variable for the Training Set
The need for normalization is caused by the fact that different time series of the original data set can be presented at different scales and vary in different ranges. The process of normalization solves this problem and allows the original data set to be brought to a common scale without losing information about the difference in data ranges.
This research used min-max normalization Eq. (5) since the resulting values will not always occupy the entire range [0, 1] but only a part of it, depending on the largest and smallest observed values.
where X′ is the time series of electricity consumption, Xi is the i-th value of the time series, X min is the minimum value of the time series, and X max is the maximum value of the time series.
The original data set was divided into training and test samples in the ratio of 80/20, i.e., the training sample was 19,965, and the test sample was 4251 load profiles. For the training set, an important task, the solution of which will allow the most accurate classification of electricity consumption, is to bring the target variable (class labels) to balance. Balance is understood as the equality of the number of labels of both classes. The training data set is initially very unbalanced (normal consumption—15,714, NTL—2857). Hence, the SMOTE method was applied. This algorithm is based on the idea of generating a certain number of artificial examples that will be similar to those in the minority class but will not duplicate them. After being applied to the training sample, the original set changed significantly during visualization (the volume of the training sample was 34,182 examples), Fig. 4.

Figure 4: Visualization of the balanced SMOTE training dataset by t-SNE method
The problem of adjusting the training sample was solved by normalizing the data set and balancing the target variable. The next step was to apply and evaluate the ML methods.
The research was conducted using the interpreted high-level programming language Python and its libraries. All measurements were performed in the Google Colab cloud service with the following computing hardware configuration: Intel(R) Xeon(R) CPU @ 2.20 GHz and 13 GB of RAM. The following machine learning methods were used in the work: logistic regression, naive Bayes algorithm, random forest, extreme gradient boosting (XGBoost), categorical boosting (CatBoost), lightweight gradient boosting LightGBM, and adaptive boosting (AdaBoost). The choice of these algorithms was based on personal experience [24], as well as due to their popularity among researchers in the field of detecting NTL. In addition, a comparative analysis of the performance of different methods is necessary. Therefore, both simpler computational classification algorithms (logistic regression, naive Bayes algorithm) and ensemble methods (Random Forest, XGBoost, CatBoost, LightGBM, AdaBoost) and neural networks were selected. It is necessary to indicate their key advantages and limitations to justify the choice of methods.
Logistic regression and naive Bayes algorithm are classical approaches used in the classification problem. Their choice as one of the methods for this research is due to the need for a comparative analysis with more complex modern algorithms. A hypothesis was formulated about the superiority of classical approaches over more modern intelligent ones, to confirm/refute, which an empirical research and comparative analysis of the performance of models were conducted. Considering that the initial data-time series of electricity consumption are stochastic, heterogeneous, and do not correspond to the normal distribution law, with a large spread of values around the mean, most likely, the hypothesis about the superiority of classical methods will not be confirmed. However, it was necessary to check this and justify the use of more expensive computational methods.
The Random Forest algorithm is an algorithm of classical machine learning; the combination of models into an ensemble occurs using bagging technology. This is a non-parametric method; therefore, the nature of the distribution of the time series does not matter, and the method is good at identifying complex nonlinear dependencies in the original data. The use of this algorithm often allows it to perform well in regression and classification problems. Due to the results in the literature [20], the accuracy of NTL classification using Random Forest is more than 90%. The advantages of Random Forest also include resistance to noise in the data, and the disadvantages include overfitting and insufficient interpretability. Given the nonlinear nature of the original data in this research, the use of this algorithm and other machine learning methods is justified by their ability to find non-trivial relationships in the data.
Boosting algorithms (XGBoost, CatBoost, LightGBM, AdaBoost) have the advantage of good generalization of results since models are ensembled. However, the principle of combining into an ensemble is different for each algorithm, and the quality of the method’s performance is also different depending on the characteristics of the time series. Thus, the AdaBoost algorithm assumes a small number of iterations and is computationally simpler than XGBoost, CatBoost, and LightGBM. The simplicity of interpreting the results distinguishes it, but with many iterations and the dimensionality of the time series, it is prone to overfitting. Due to research [22], the use of AdaBoost made it possible to obtain a classification accuracy of 91%. Extreme gradient boosting XGBoost is a more complex method that supports L1 and L2 regularization. The training time of models is significantly higher compared to AdaBoost, but it is possible to set the early stopping parameter of the training cycle e under the condition of not improving the ensemble after adding a given number of models early_stopping, which significantly saves resources (memory and time). XGBoost is well-suited for large amounts of data. In the research [39], the use of the XGBoost model allowed to obtain a classification accuracy of 97%, which is considered a good result. The CatBoost and LightGBM algorithms are also modern, support the handling of missing values and categorical variables, are robust to outliers, and perform well on large datasets. In the research [34], the use of the CatBoost model allowed for an accuracy of 93% for the NTL classification task, while in this research, the use of LightGBM gave a result of 83% accuracy. Artificial neural networks (ANN) are widely used, including for classification tasks. Based on the research [22], the use of ANN (1D CNN architecture) allows for obtaining an accuracy of classification of 94%. ANN is characterized by high performance on large sets of nonlinearly distributed data. The ability to find key patterns in data and good generalization ability determines the main advantages of ANN. However, a comprehensive justification for the use of ANN is necessary since they are resource-intensive (computationally and in terms of training time and selection of hyperparameters). Therefore, it is necessary to apply ANN to the data of this research under equal conditions (the same feature space) with other less computationally complex methods.
Thus, the superiority of each of the selected methods cannot be declared unambiguously. On each data set, the listed algorithms show different performance [22,24,34,39], so it is necessary to check for this research which of the methods will provide the highest classification accuracy. In addition, one of the approaches that allows for higher model performance is to combine several models into an ensemble instead of using models separately. Creating an ensemble of ANN models improved performance. Below are the results of the process of selecting model hyperparameters and their brief description.
For the logistic regression, naive Bayes algorithm, Random Forest, XGBoost, CatBoost, LightGBM, AdaBoost models, and hyperparameters were selected using a cross-validation tool named GridSearchCV. Table 2 presents the best values selected using cross-validation for all models except ANN.

An artificial neural network (ANN) was also used, the architecture of which consists of one-dimensional convolutional (1D convolutional neural network-1D CNN), Long short-term memory (LSTM), linear (Dense) layers, Batch normalization (BN) and Dropout regularization method, Fig. 5.
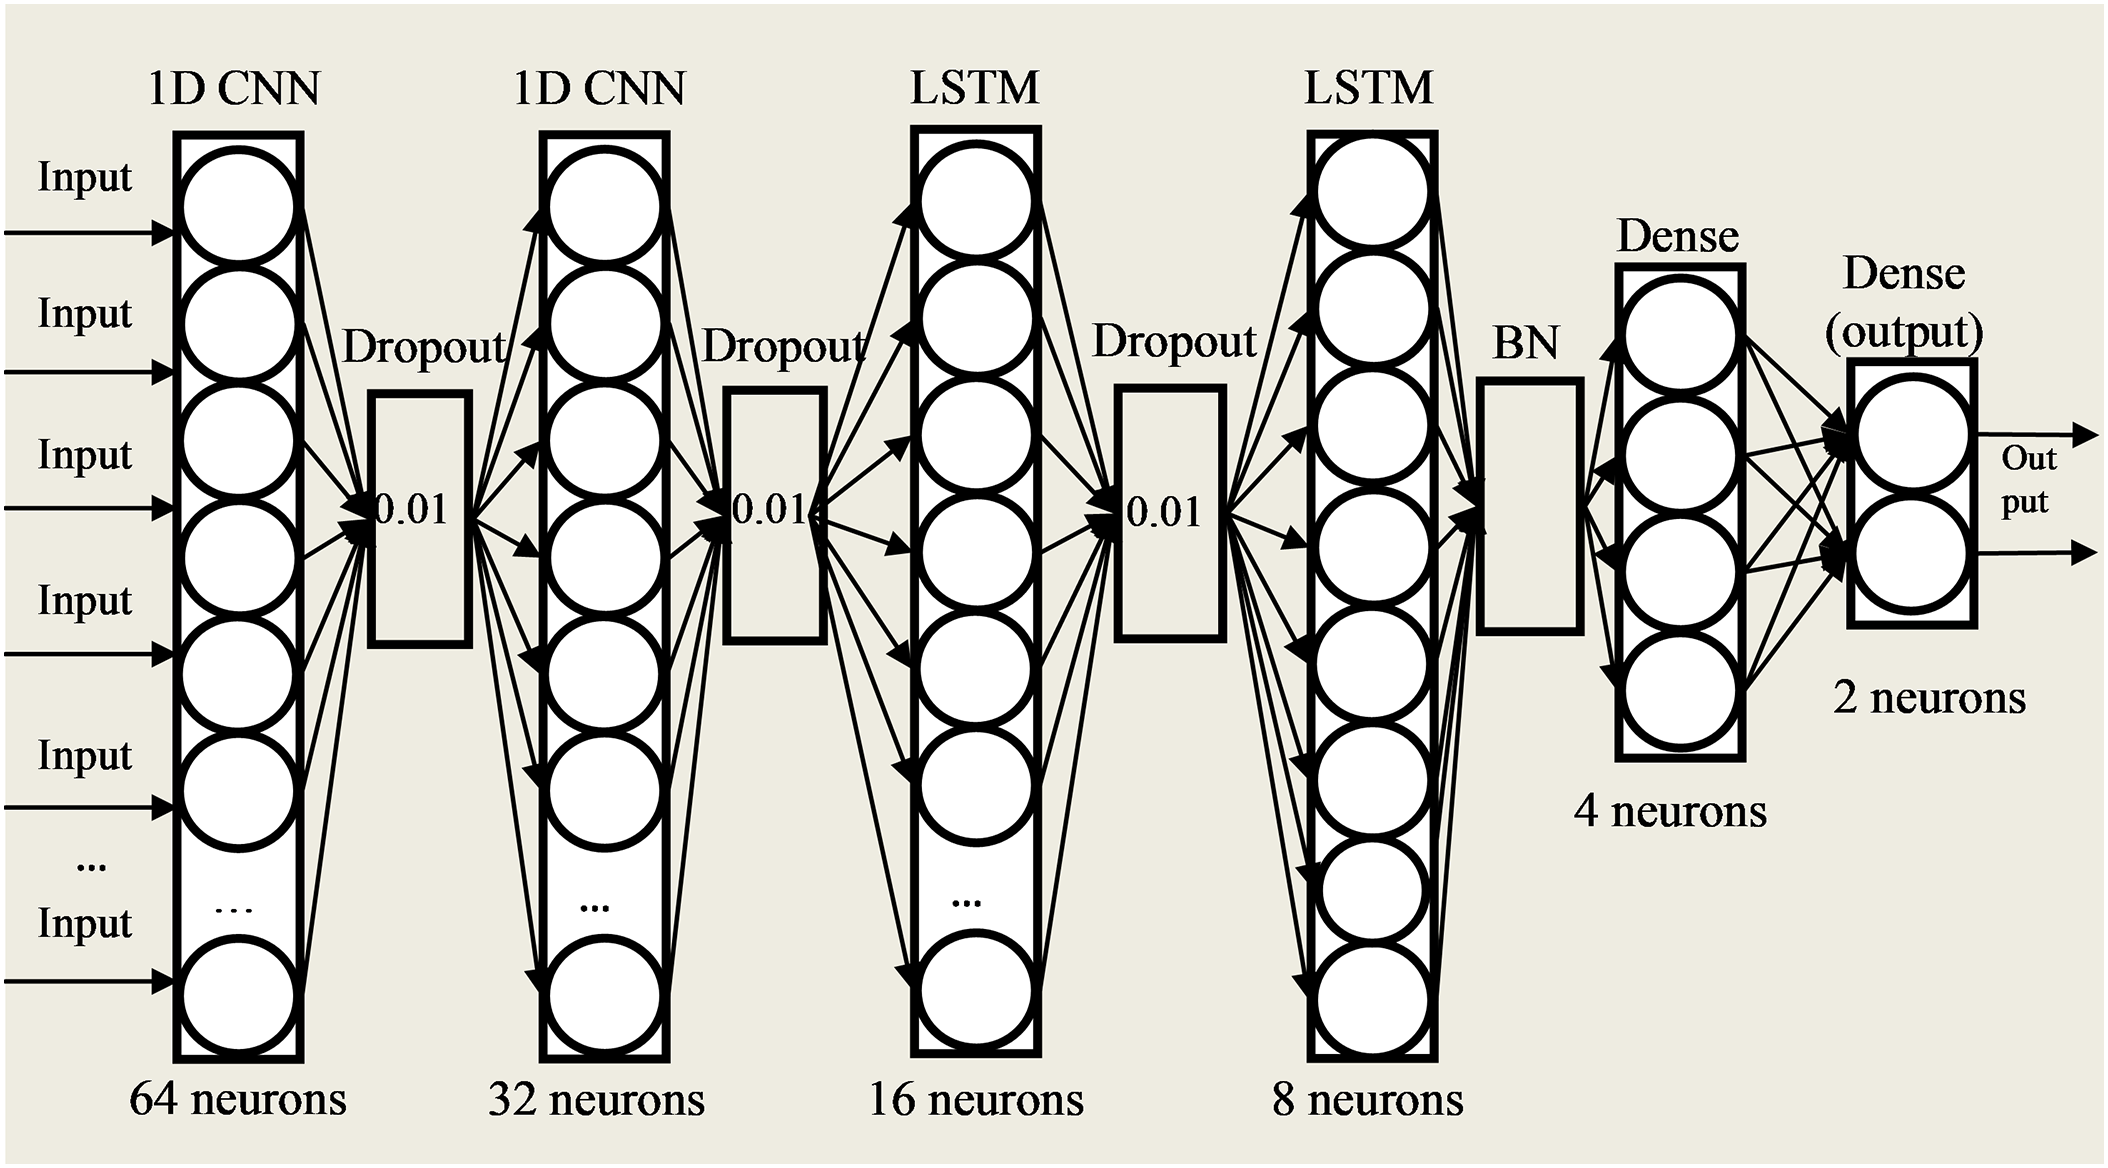
Figure 5: ANN model structure
The selection of the hyperparameters of the ANN model, including the number of hidden layers, the type of layers, activation functions, and the number of neurons, was performed using the Keras.tuner library. This allowed us to evaluate the quality of the model iteratively because of several training and optimization cycles (the trials parameter was chosen as 5). Let us consider the process of selecting parameters for this research in more detail. A function was created to select hyperparameters (the hp parameter of the function). The number of hidden layers was also selected using Kerastuner: the types of layers (1D CNN, LSTM, Dense, Dropout, BN) and their number (from 1 to 10) were specified. The first (input) and last (output) layers were specified considering the experience of the authors and a series of empirical studies, as in Fig. 5. The number of neurons for each layer (except for the input and output) was selected using a grid search in the range from 1 to 1024. Among the activation functions, an array consisting of such activation functions as Rectifier linear unit (ReLU), hyperbolic tangent (tanh), sigmoid (sigmoid), Exponential Linear Unit (ELU), Scaled Exponential Linear Units (SeLU), Leaky Rectified Linear Unit (Leaky_ReLU) was specified for selecting the optimal one. Thus, when training the network for five trials, the activation function with the highest accuracy (val_accuracy) was selected for each layer except the last one. For the last layer, the activation function was set to softmax to translate the obtained values into the probability of belonging to a class—obtaining the output value of the model. For the 1D CNN layers, the kernel_size and strides parameters were selected using a grid search. The optimal ones were kernel_size = 2 and strides = 1. For training and searching for optimal hyperparameters from a set of given values, five trials were performed, and the criterion of optimality was the highest classification accuracy val_accuracy. The number of epochs varied and was chosen as 20 because several training cycles are sufficient for the generalization ability of the algorithm. In this case, the batch size was also selected using a grid search among the values 4, 8, 16, 24, 32, 64, 125, 256. The optimal batch_size was 125. The parameters learning_rate, and dropout rate were selected using keras.tuner. For the learning_rate parameter, an array of possible values was specified using the hp.Choice (‘learning_rate’, values = [0.01, 0.001, 0.0001]) function when compiling the model, where hp is the designation of the parameter of the hyperparameter selection function. The best value for learning_rate was chosen to be equal to 0. 001. Dropout_rate was selected similarly and was 0.01. The optimizer was chosen similarly using keras.tuner at the stage of model compilation using the hp.Choice function: the choice was between such optimizers as Stochastic Gradient Descent (SGD), Root Mean Square Propagation (RMSprop), Adam, Adamax. Based on the results of 5 trials, the best generalization ability of the classification model was using the Adam optimizer. The loss function was set as Binary Cross-entropy, and AUC was chosen as the metric. As a result of 5 trials, the neural network architecture and hyperparameters were obtained as in Fig. 5.
Also, no value was specified for the random number generator for the initial values of the ANN parameters. Although this does not allow us to count on the reproducibility of the results (i.e., the accuracy of several trained models will differ slightly), it opens the possibility of using the developed ANN as a basis for a homogeneous ML ensemble. The scheme of this algorithm is shown in Fig. 6.
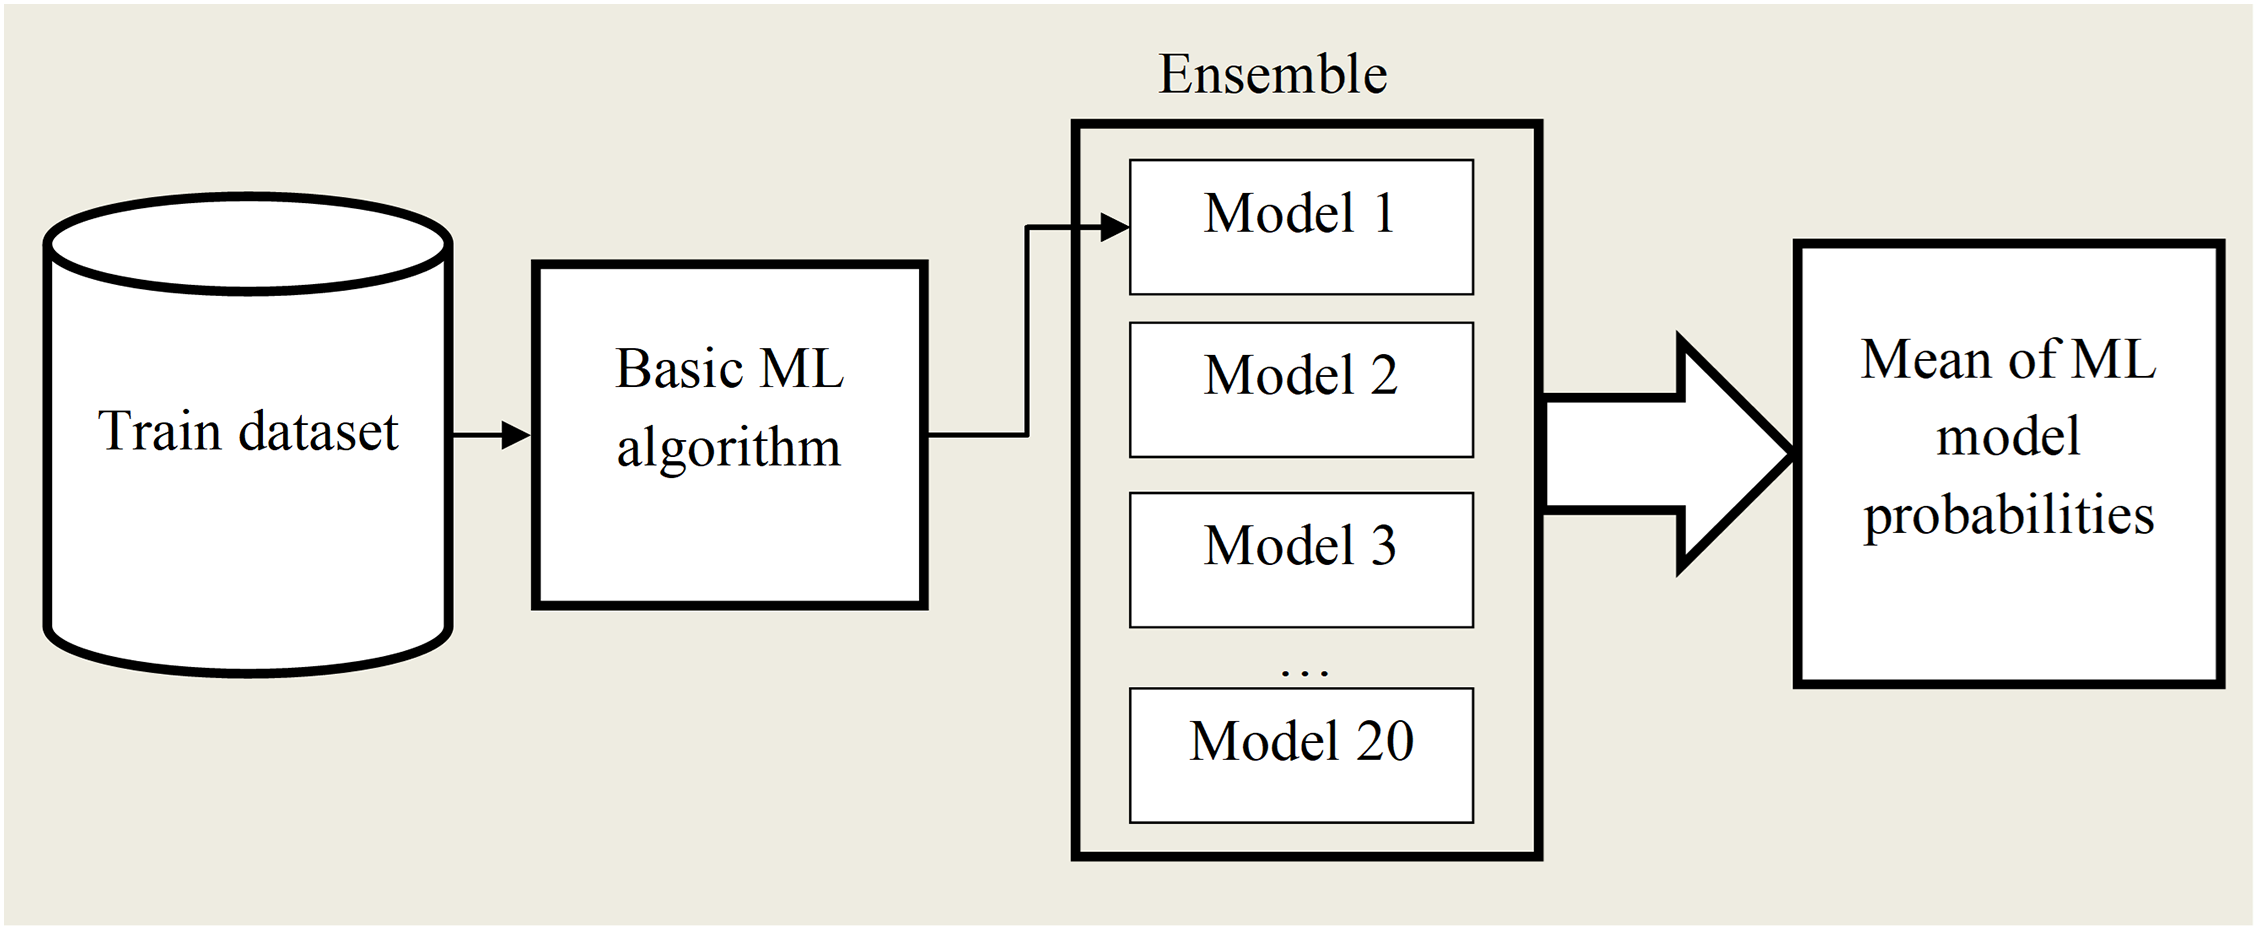
Figure 6: Scheme of the ensemble algorithm of ANN
Ensemble ML algorithms are a machine learning method that uses several trained algorithms whose predictions, combined with some empirical rules, allow for better predictive performance compared to each algorithm individually [40].
Since the random number generator was not specified during the training of the ANN model, 10 experiments were conducted to analyze the stability of the experimental results, the results of which are shown in Table 3. Since the primary goal of this research is related to probability prediction, the main metric chosen is Roc-AUC since it is capable of estimating the probabilities of belonging to a class and also very successfully estimates the dependence of the number of correctly classified examples on the number of incorrectly classified examples for a binary classification problem (with two possible class states). The following metrics were also used as auxiliary metrics: Accuracy, Precision, Recall, and F1-score.

Based on the results of repeated use of the proposed model, it is stable in solving the problem of NTL detection and is appropriate for further use.
The results of using such an ensemble algorithm are shown in Fig. 7, exhibiting the Roc-AUC (3) metric for the test data set with single training and averaging of the results.
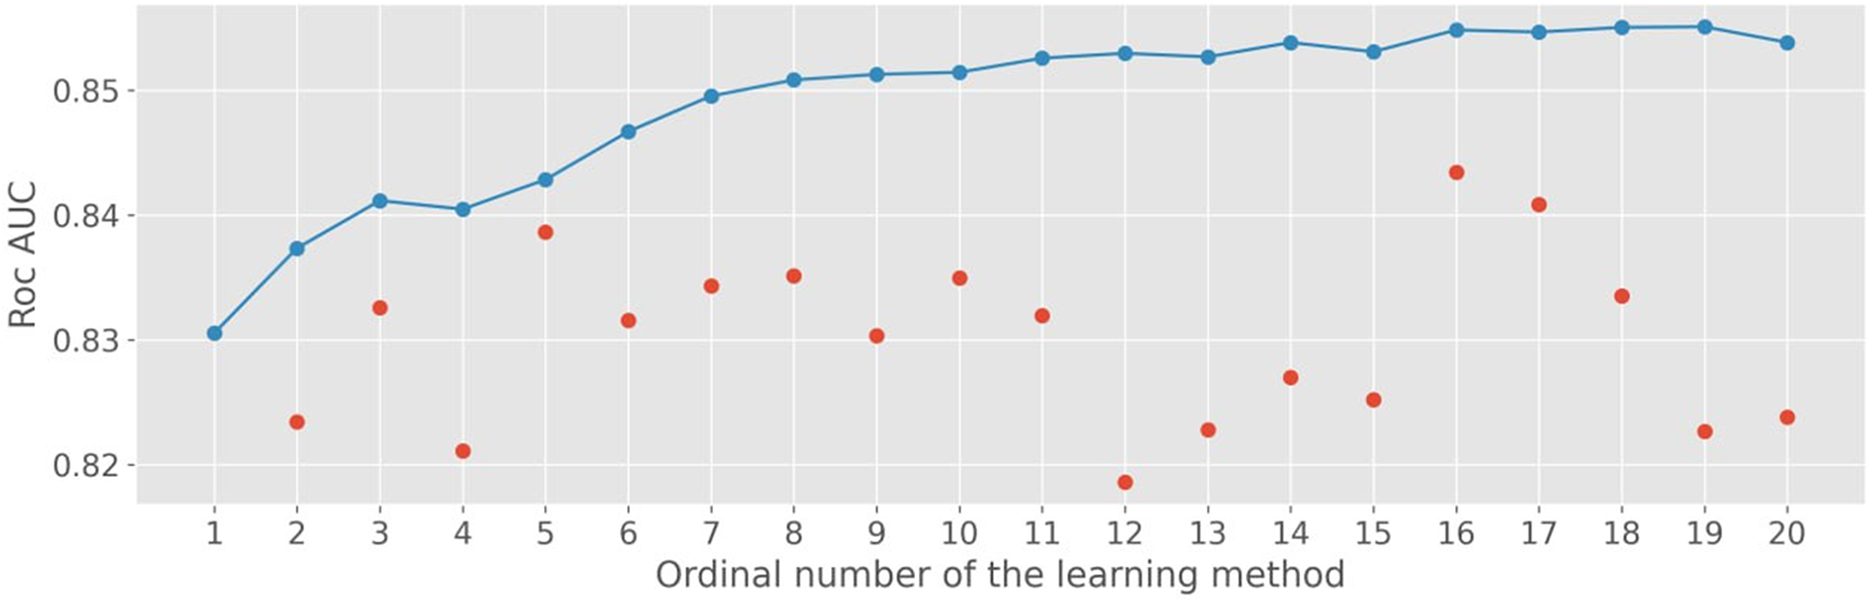
Figure 7: Roc-AUC metric values for single (red dots) and ensemble algorithm (blue line and dots)
It was possible to increase the Roc-AUC metric and achieve better results by training the ensemble ML algorithm. The results of applying machine learning algorithms are shown in Table 4.

The results of the modeling confirm hypothesis 1 that it is possible to determine the probability of NTL based on time series data on electricity consumption. The most relevant results were obtained using the Random Forest method. Similar results were also achieved using the LightGBM and ANN ensemble methods. These basic models were utilized to create an ensemble algorithm (stacking).
2.4 Stacking ML Models and Assessing Their Accuracy
Stack generalization (stacking) is one of the ways to combine classifiers, introducing the concept of an ML meta-algorithm. Unlike a homogeneous ensemble of ANNs, stacking uses classifiers of different natures. The idea of stacking is as follows:
1. Split the training sample into two disjoint subsets.
2. Train several base classifiers on the first subset.
3. Test base classifiers on the second subset.
4. Using the predictions from the previous step as input and the true object classes as output, train the meta-algorithm [40].
In the form of a diagram, stacking can be represented as given in Fig. 8.
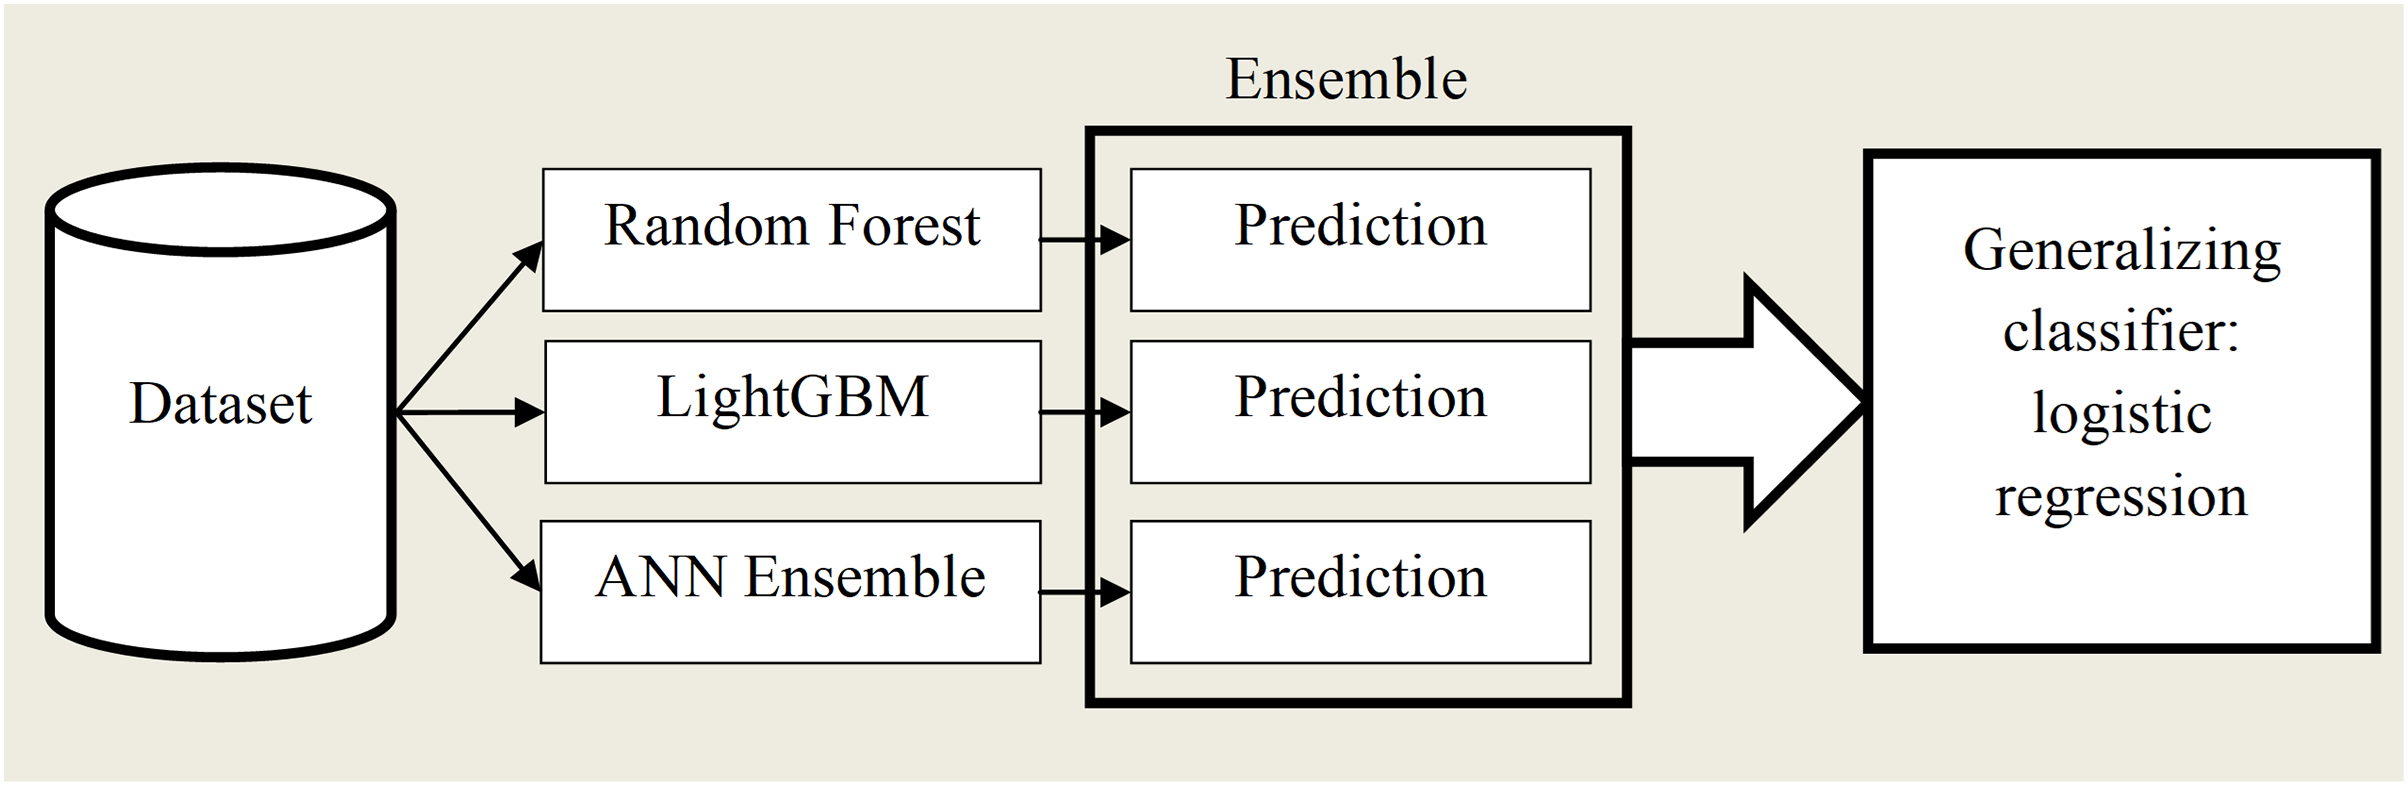
Figure 8: Machine learning algorithm stacking diagram
Three stages of stacking were performed at the previous point of the research—“training and evaluation”. Predictions were made on the training dataset of the three best algorithms: random forest, LightGBM, and ANN ensemble to perform the fourth point.
The obtained results and the probabilities of NTL presence were used as predictors for the generalized model and logistic regression. After training the generalized model, a prediction was made on the test data set. The results of the comparison of the detection accuracy of the random forest, LightGBM, the ANN ensemble, and the proposed ensemble method are shown in Fig. 9.
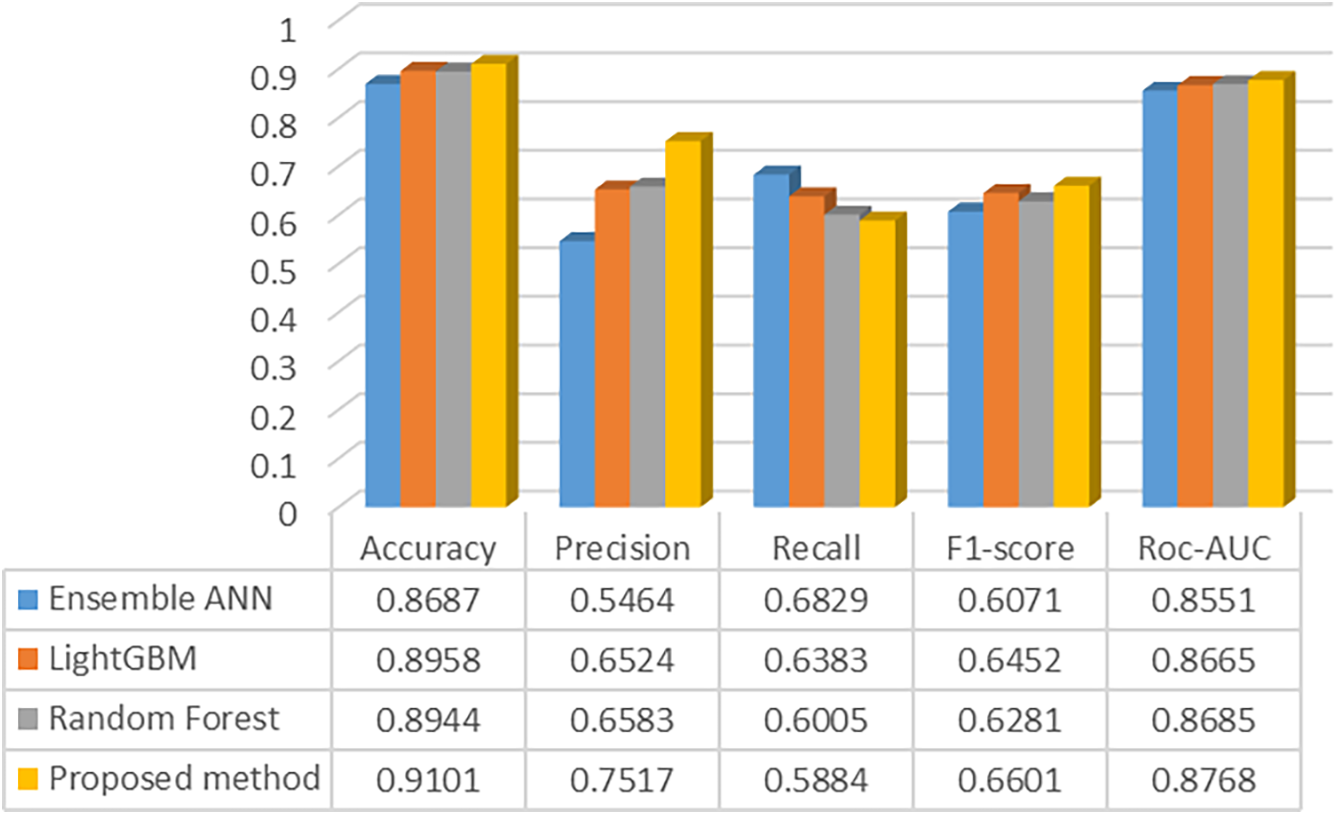
Figure 9: Performance evaluation of studied ML models
Thus, stacking ML models compared to single models, the results of which are shown in Table 1, increased the accuracy of NTL detection for the main and most auxiliary metrics. This confirms the validity of hypothesis 3 that the joint ensemble use of NTL detection algorithms is more accurate than single classifiers for the task of data analysis and NTL search. Fig. 10 shows the classification characteristics of the proposed method: the Roc-AUC curve and confusion matrix.
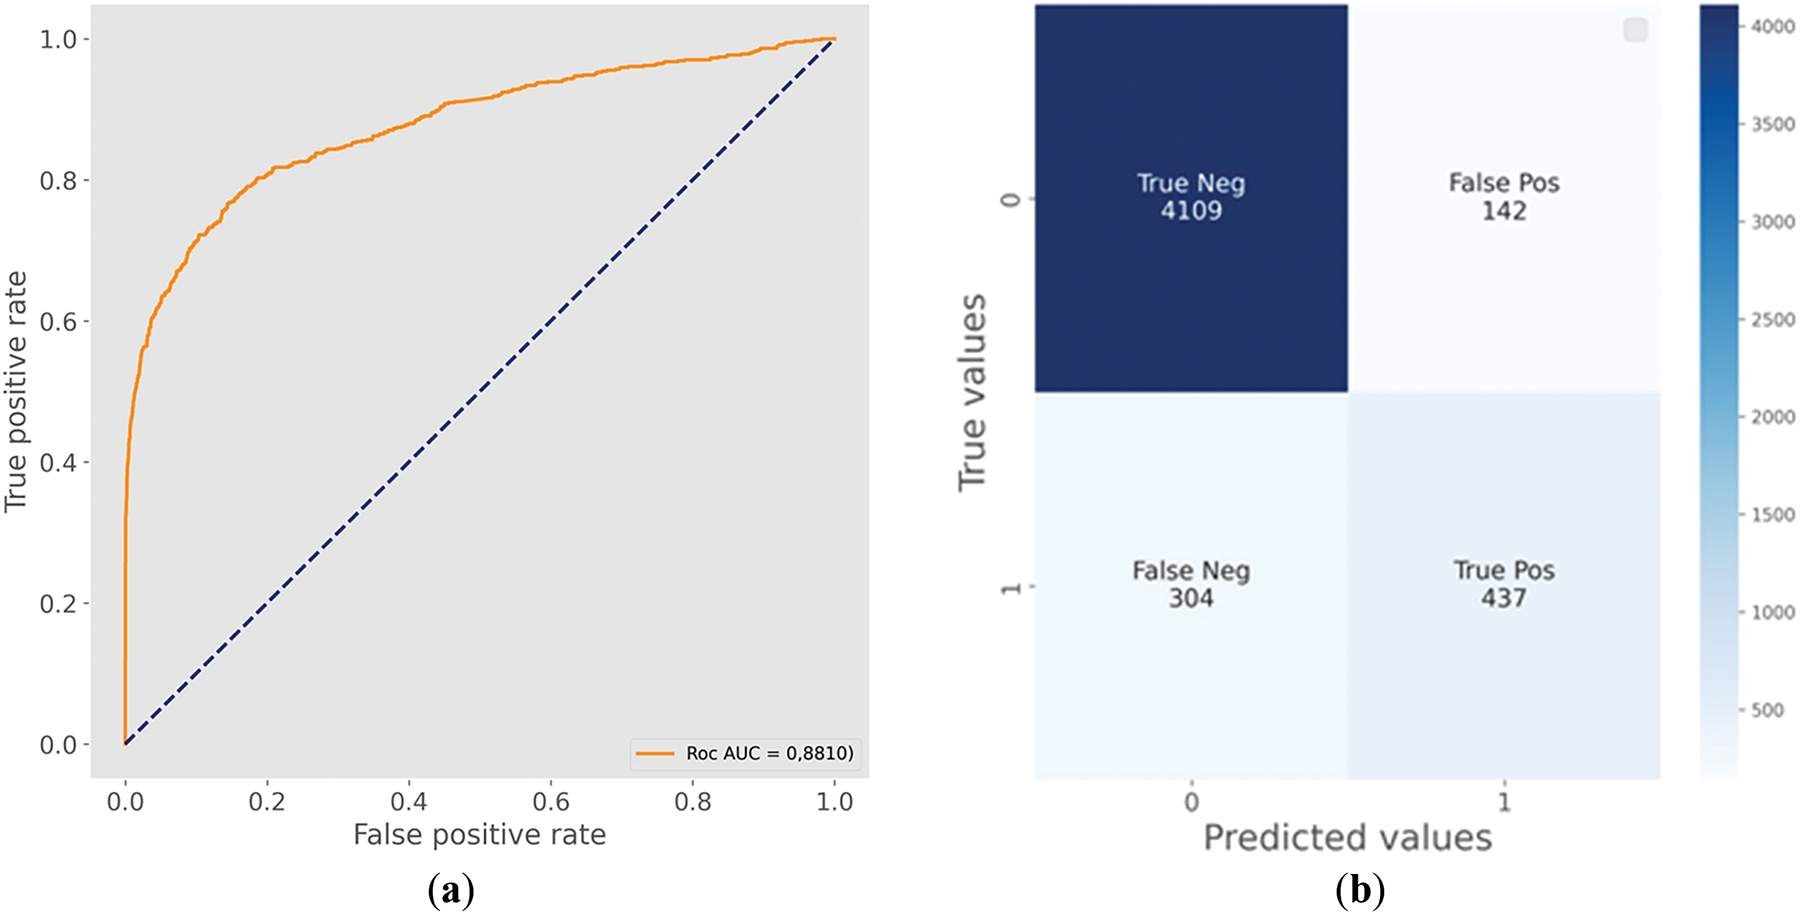
Figure 10: Roc-AUC curve of stacking and predicted values with rounded probabilities: (a) Roc-AUC curve; (b) Confusion matrix
The practical meaning of this meta-algorithm is that out of 4992 consumers of electricity in the test sample, 446 consumers (FP + FN) were incorrectly classified. At the same time, in the proposed methodology out of 579 classified consumers (TP + FP) with NTL 437 were classified (TP) correctly. This allows us to conclude that hypothesis 1 is true, i.e., it is possible to effectively identify sources of electricity losses by ML methods using retrospective data on electricity consumption in distribution networks.
Incorrectly determined normal consumption (based on Fig. 10 for 304 consumers) can be detected during scheduled inspections and equipment checks for correct operation. Failure to find such a significant number of NTL sources (304) proves the inconsistency of hypothesis 2, which is explained by the difficulty of detection due to the similarity in a few cases of load graphs with consumers without NTL.
Table 5 was compiled, reflecting the performance metrics of the models to compare the results of this research with previous works. Although the data used in these studies and the conditions are different, the quantitative characteristics allow us to analyze the accuracy of the proposed approach.

Table 4 demonstrates that the proposed approach outperforms some methods described in modern studies in terms of Roc-AUC. Considering that this metric is the main one for the classification task, despite the superiority of the CNN-AdaBoost method proposed in [22] in terms of accuracy, the method proposed in this study is more reliable, and its classification quality is better.
It is possible to identify not all but most of the NTL sources based on time series data on electricity consumption. This allows supporting decision-making during targeted raids by employees of electric distribution companies. At the same time, it is necessary to highlight the possible risks of suboptimal operation of this solution. Such risks include the improvement of electricity theft methods, which can take the form of partial theft (for example, when stealing 10%–20% of energy), which does not leave characteristic NTL fluctuations on energy consumption graphs. A possible solution is to save time in the electricity consumption series by employees of distribution companies and add them to new data sets to retrain models for detecting fraudulent consumption.
The proposed model can be integrated into the corporate Enterprise Resource Planning (ERP) management system and will allow monitoring of electricity consumption online. The method is based on the analysis of active power consumption data obtained from automated information and measuring systems for commercial electricity metering. It is assumed that with a known value of the actual imbalance of electricity in an open distribution network exceeding or comparable to the value of the permissible imbalance, an analysis of consumption data is performed to identify the most “suspicious” consumers with abnormally low electricity consumption. Based on this analysis, a subset of consumers is formed for subsequent in-depth energy surveys by employees of the electric distribution companies, which implies point raids at the place of connection of consumers to the distribution grid.
Sustainable development of the electric power industry is an important task since it involves providing electricity in the required quantity and of the established quality for the current and future needs of the population and industrial production. At the same time, not only are the environmental and economic aspects of sustainable development important, but they also ensure energy security. The stability and safety of the functioning of electric power systems depend on the balance of consumed and generated electric power. One of the reasons for the power imbalance in electric power systems and, therefore, the cause of their instability, is electricity losses. The ongoing process of AMI implementation in the electric power industry worldwide helps reduce total energy losses.
One of the current research areas in solving the problem of increasing the sustainability and reliability of electric power systems is the intelligent analysis of electricity consumption data in smart distribution networks. This study proposes a method for reducing NTL based on time series data on electricity consumption. During the research, data preprocessing is performed, which consists of filling in missing values using linear interpolation and eDTWBI methods. Min-max normalization is also performed; the original dataset is divided into training and test samples, and the training sample is balanced using the SMOTE method. Parameter selection and the most popular ML methods are used: logistic regression, naive Bayesian algorithm, random forest, extreme gradient boosting, categorical boosting, LightGBM, and adaptive boosting. An ANN is also built using long short-term memory, as well as convolutional and linear layers. The developed ANN for more stable results and increased accuracy in detecting NTL is used as the basis for a homogeneous ML ensemble. The three most accurate methods (random forest, LightGBM, and ANN ensemble) are used for a stack model with a generalizing classifier-logistic regression. The accuracy of detecting NTL is the highest for the stack model based on the main metric (ROC-AUC) and auxiliary ones. Thus, the research aims to develop an ML model for detecting NTL in the distribution of electricity grids. The prospect of further research is to search for more advanced mathematical models, adding additional factors to improve the accuracy of finding sources of electricity losses. The limitation of this study is the requirement to use the AMI as a modern means of accounting for consumed electricity. Using this infrastructure allows for the obtaining of time series data on electricity consumed for subsequent analysis. Also, since electricity theft methods are constantly being improved, it is necessary to take them into account for upgrading (retraining on data-containing instances with new NTL methods) the NTL detection model.
As a result of research, a method for the rapid search of NTL sources of electricity in distribution grids with automated collection of electricity consumption data was developed. Implementation on the stand is not provided; it is assumed that the results will be implemented in SmartGrid as a scientific basis for NTL detection.
Acknowledgement: None.
Funding Statement: The authors received no specific funding for this research.
Author Contributions: The authors confirm their contribution to the paper as follows: Conceptualization, Irbek Morgoev and Roman Klyuev; methodology, Irbek Morgoev and Angelika Morgoeva; software, Irbek Morgoev; validation, Irbek Morgoev and Roman Klyuev; formal analysis, Angelika Morgoeva; investigation, Irbek Morgoev; resources, Roman Klyuev; data curation, Irbek Morgoev; writing—original draft preparation, Irbek Morgoev and Angelika Morgoeva; writing—review and editing, Irbek Morgoev and Angelika Morgoeva; visualization, Irbek Morgoev; supervision, Roman Klyuev; project administration, Roman Klyuev. All authors reviewed the results and approved the final version of the manuscript.
Availability of Data and Materials: In accordance with the non-disclosure agreement between the power grid organization and our university, the data cannot be placed in the public domain. Therefore, the dataset is not available.
Ethics Approval: Not applicable.
Conflicts of Interest: The authors declare no conflicts of interest to report regarding the present research.
References
1. Electricity theft and non-technical losses: global markets, solutions & vendors 2017—Research and markets [Internet]. [cited 2025 Feb 17]. Available from: https://www.epicos.com/article/122764/electricity-theft-and-non-technical-losses-global-markets-solutions-vendors-2017. [Google Scholar]
2. World Loses $89.3 Billion to Electricity Theft Annually, $58.7 Billion in Emerging Markets [Internet]. [cited 2025 Feb 17]. Available from: https://www.prnewswire.com/news-releases/world-loses-893-billion-to-electricity-theft-annually-587-billion-in-emerging-markets-300006515.html. [Google Scholar]
3. Ibrahim ES. Management of loss reduction projects for power distribution systems. Electr Power Syst Res. 2000;55(1):49–56. doi:10.1016/S0378-7796(99)00073-5. [Google Scholar] [CrossRef]
4. Demidova GL, Lukichev DV. Introduction to the specialty of electric power engineering and electrical engineering. Saint Petersburg, Russia: ITMO University; 2016. 108 p. [Google Scholar]
5. Smith TB. Electricity theft: a comparative analysis. Energy Policy. 2004;32(18):2067–76. doi:10.1016/S0301-4215(03)00182-4. [Google Scholar] [CrossRef]
6. Ensure access to affordable, reliable, sustainable and modern energy [Internet]. [cited 2025 Feb 17]. Available from: https://www.un.org/sustainabledevelopment/energy/. [Google Scholar]
7. Lewis FB. Costly ‘throw-ups’: electricity theft and power disruptions. Electr J. 2015;28(7):118–35. doi:10.1016/J.TEJ.2015.07.009. [Google Scholar] [CrossRef]
8. Kelly-Detwiler P. Electricity theft: a bigger issue than you think [Internet]. 2013 [cited 2025 Feb 17]. Available from: http://www.forbes.com/sites/peterdetwiler/2013/04/23/electricity-theft-a-bigger-issue-than-you-think/. [Google Scholar]
9. Ventura L, Felix GE, Vargas R, Faria LT, Melo JD. Estimation of non-technical loss rates by regions. Electr Power Syst Res. 2023;223(6):109685. doi:10.1016/J.EPSR.2023.109685. [Google Scholar] [CrossRef]
10. Joseph KL. The politics of power: electricity reform in India. Energy Policy. 2010;38(1):503–11. doi:10.1016/J.ENPOL.2009.09.041. [Google Scholar] [CrossRef]
11. Terciyanli E, Eryigit E, Emre T, Caliskan S. Score based non-technical loss detection algorithm for electricity distribution networks. In: Proceedings of the 2017 5th International Istanbul Smart Grid and Cities Congress and Fair (ICSG); 2017 Apr 19–21; Istanbul, Turkey. p. 180–4. doi:10.1109/SGCF.2017.7947629. [Google Scholar] [CrossRef]
12. Hussain Z, Memon S, Shah R, Bhutto ZA, Aljawarneh M. Methods and techniques of electricity thieving in Pakistan. J Power Energy Eng. 2016;4(9):1–10. doi:10.4236/jpee.2016.49001. [Google Scholar] [CrossRef]
13. Reducing technical and non-technical losses in the power sector (English). Washington, DC, USA: World Bank Group [Internet]. [cited 2025 Feb 17]. Available from: http://documents.worldbank.org/curated/en/829751468326689826/Reducing-technical-and-non-technical-losses-in-the-power-sector. [Google Scholar]
14. Yurtseven Ç. The causes of electricity theft: an econometric analysis of the case of Turkey. Util Policy. 2015;37(3):70–8. doi:10.1016/J.JUP.2015.06.008. [Google Scholar] [CrossRef]
15. Otuoze AO, Mustafa MW, Abdulrahman AT, Mohammed OO, Salisu S. Penalization of electricity thefts in smart utility networks by a cost estimation-based forced corrective measure. Energy Policy. 2020;143(5):111553. doi:10.1016/J.ENPOL.2020.111553. [Google Scholar] [CrossRef]
16. Electricity transmission losses in China from 2010 to 2023 [Internet]. [cited 2025 Feb 17]. Available from: https://www.statista.com/statistics/302292/china-electric-power-transmission-loss/. [Google Scholar]
17. Zhukovskiy Y, Koshenkova A, Vorobeva V, Rasputin D, Pozdnyakov R. Assessment of the impact of technological development and scenario forecasting of the sustainable development of the fuel and energy complex. Energies. 2023;16(7):3185. doi:10.3390/en16073185. [Google Scholar] [CrossRef]
18. Gabriel LMN, Adebisi JA, Ndjuluwa LNP, Chembe DK. Investigation of smart grid technologies deployment for energy reliability enhancement in electricity distribution networks. Frankl Open. 2025;10(2):100227. doi:10.1016/J.FRAOPE.2025.100227. [Google Scholar] [CrossRef]
19. Javaid N, Jan N, Javed MU. An adaptive synthesis to handle imbalanced big data with deep siamese network for electricity theft detection in smart grids. J Parallel Distrib Comput. 2021;153(4):44–52. doi:10.1016/j.jpdc.2021.03.002. [Google Scholar] [CrossRef]
20. Ge L, Li J, Du T, Hou L. Double-layer stacking optimization for electricity theft detection considering data incompleteness and intra-class imbalance. Int J Electr Power Energy Syst. 2025;165(2):110461. doi:10.1016/J.IJEPES.2025.110461. [Google Scholar] [CrossRef]
21. Chen H, Ma R, Liu X, Liu R. Detecting energy theft with partially observed anomalies. Int J Electr Power Energy Syst. 2024;162(2):110323. doi:10.1016/J.IJEPES.2024.110323. [Google Scholar] [CrossRef]
22. Nirmal S, Patil P, Kumar JRR. CNN-AdaBoost based hybrid model for electricity theft detection in smart grid. E-Prime-Adv Electr Eng Electron Energy. 2024;7(3):100452. doi:10.1016/J.PRIME.2024.100452. [Google Scholar] [CrossRef]
23. Ullah A, Khan IU, Younas MZ, Ahmad M, Kryvinska N. Robust resampling and stacked learning models for electricity theft detection in smart grid. Energy Rep. 2025;13(3):770–9. doi:10.1016/J.EGYR.2024.12.041. [Google Scholar] [CrossRef]
24. Morgoev ID, Dzgoev AE, Kuzina AV. Algorithm for operational detection of abnormally low electricity consumption in distribution. In: Radionov AA, Gasiyarov VR, editors. Advances in automation V. RusAutoCon 2023. Lecture notes in electrical engineering; 2023 Sep 10–16; Sochi, Russia. Cham, Switzerland: Springer; 2024. p. 37–49. doi:10.1007/978-3-031-51127-1_4. [Google Scholar] [CrossRef]
25. Chen T, Guestrin C. XGBoost: a scalable tree boosting system. In: Proceedings of the 22nd ACM SIGKDD International Conference on Knowledge Discovery and Data Mining (KDD’16); 2016 Aug 13–17; San Francisco, CA, USA. New York, NY, USA: ACM; 2016. p. 785–94. [Google Scholar]
26. Ke G, Meng Q, Finley T, Wang T, Chen W, Ma W, et al. LightGBM: a highly efficient gradient boosting decision tree. In: Proceedings of the Neural Information Processing Systems (NIPS); 2017 Dec 4–9; Long Beach, CA, USA. 30 p. [Google Scholar]
27. Prokhorenkova L, Gusev G, Vorobev A, Dorogush AV, Gulin A. CatBoost: unbiased boosting with categorical features. In: 32nd Conference on Neural Information Processing Systems (NeurIPS 2018); 2018 Dec 2–8; Montreal, QC, Canada. p. 6638–48. [Google Scholar]
28. Gunturi SK, Sarkar D. Ensemble machine learning models for the detection of energy theft. Electr Power Syst Res. 2021;192(2):106904. doi:10.1016/J.EPSR.2020.106904. [Google Scholar] [CrossRef]
29. Chawla NV, Bowyer KW, Hall LO, Kegelmeyer WP. SMOTE: synthetic minority oversampling technique. J Artif Intell Res. 2002;16:321–57. doi:10.1613/jair.953. [Google Scholar] [CrossRef]
30. Avila NF, Figueroa G, Chu C-C. NTL detection in electric distribution systems using the maximal overlap discrete wavelet-packet transform and random undersampling boosting. IEEE Trans Power Syst. 2018;33(6):7171–80. doi:10.1109/TPWRS.2018.2853162. [Google Scholar] [CrossRef]
31. Hasan MN, Toma RN, Nahid A-A, Islam MMM, Kim J-M. Electricity theft detection in smart grid systems: a CNN-LSTM based approach. Energies. 2019;12(17):3310. doi:10.3390/en12173310. [Google Scholar] [CrossRef]
32. Pereira J, Saraiva F. A comparative analysis of unbalanced data handling techniques for machine learning algorithms to electricity theft detection. In: Proceedings of 2020 IEEE Congress on Evolutionary Computation (CEC); 2020 Jul 19–24; Glasgow, UK. p. 1–8. doi:10.1109/CEC48606.2020.9185822. [Google Scholar] [CrossRef]
33. Saqib SM, Mazhar T, Iqbal M, Shahazad T, Almogren A, Ouahada K, et al. Deep learning-based electricity theft prediction in non-smart grid environments. Heliyon. 2024;10(15):2405–8440. doi:10.1016/j.heliyon.2024.e35167. [Google Scholar] [PubMed] [CrossRef]
34. Hussain S, Mustafa MW, Al-Shqeerat KHA, Saeed F, Al-rimy BAS. A novel feature-engineered-NGBoost machine-learning framework for fraud detection in electric power consumption data. Sensors. 2021;21(24):8423. doi:10.3390/s21248423. [Google Scholar] [PubMed] [CrossRef]
35. Coma-Puig B, Carmona J. Bridging the gap between energy consumption and distribution through non-technical loss detection. Energies. 2019;12(9):1748. doi:10.3390/en12091748. [Google Scholar] [CrossRef]
36. Coma-Puig B, Carmona J. Non-technical losses detection in energy consumption focusing on energy recovery and explainability. Mach Learn. 2022;111(2):487–517. doi:10.1007/s10994-021-06051-1. [Google Scholar] [CrossRef]
37. Phan TTH, Poisson Caillault É, Bigand A. eDTWBI: effective imputation method for univariate time series. In: Advanced computational methods for knowledge engineering, Vol. 1121. Cham, Switzerland: Springer; 2020. p. 121–32. doi:10.1007/978-3-030-38364-0_11. [Google Scholar] [CrossRef]
38. Maaten LVD, Hinton GE. Visualizing high-dimensional data using t-SNE. J Mach Learn Res. 2008;9:2579–605. [Google Scholar]
39. Mehdary A, Chehri A, Jakimi A, Saadane R. Hyperparameter optimization with genetic algorithms and XGBoost: a step forward in smart grid fraud detection. Sensors. 2024;24(4):1230. doi:10.3390/s24041230. [Google Scholar] [PubMed] [CrossRef]
40. Zhang C, Ma Y. Ensemble machine learning: Methods and applications. Berlin/Heidelberg, Germany: Springer; 2012. 337 p. [Google Scholar]
Cite This Article
 Copyright © 2025 The Author(s). Published by Tech Science Press.
This work is licensed under a Creative Commons Attribution 4.0 International License , which permits unrestricted use, distribution, and reproduction in any medium, provided the original work is properly cited.
 Downloads
 Citation Tools