
 Submit a Paper
 Propose a Special lssue
 Open Access
ARTICLE

The Blockchain Neural Network Superior to Deep Learning for Improving the Trust of Supply Chain
Department of Computer Science and Engineering, National Chung Hsing University, Taichung City, 402202, Taiwan
* Corresponding Author: Der-Chen Huang. Email:
(This article belongs to the Special Issue: Key Technologies and Applications of Blockchain Technology in Supply Chain Intelligence and Trust Establishment)
Computer Modeling in Engineering & Sciences 2025, 143(3), 3921-3941. https://doi.org/10.32604/cmes.2025.065627
Received 18 March 2025; Accepted 18 May 2025; Issue published 30 June 2025
 View Full Text
 Download PDF
Abstract
With the increasing importance of supply chain transparency, blockchain-based data has emerged as a valuable and verifiable source for analyzing procurement transaction risks. This study extends the mathematical model and proof of ‘the Overall Performance Characteristics of the Supply Chain’ to encompass multiple variables within blockchain data. Utilizing graph theory, the model is further developed into a single-layer neural network, which serves as the foundation for constructing two multi-layer deep learning neural network models, Feedforward Neural Network (abbreviated as FNN) and Deep Clustering Network (abbreviated as DCN). Furthermore, this study retrieves corporate data from the Chunghwa Yellow Pages online resource and Taiwan Economic Journal database (abbreviated as TEJ). These data are then virtualized using ‘the Metaverse Algorithm’, and the selected virtualized blockchain variables are utilized to train a neural network model for classification. The results demonstrate that a single-layer neural network model, leveraging blockchain data and employing the Proof of Relation algorithm (abbreviated as PoR) as the activation function, effectively identifies anomalous enterprises, which constitute 7.2% of the total sample, aligning with expectations. In contrast, the multi-layer neural network models, DCN and FNN, classify an excessively large proportion of enterprises as anomalous (ranging from one-fourth to one-third), which deviates from expectations. This indicates that deep learning may still be inadequate in effectively capturing or identifying malicious corporate behaviors associated with distortions in procurement transaction data. In other words, procurement transaction blockchain data possesses intrinsic value that cannot be replaced by artificial intelligence (abbreviated as AI).Graphic Abstract
Keywords
Supply chain management plays a crucial role in shaping long-term partnerships between enterprises and customers [1]. The scope of the supply chain encompasses the entire process, from order signing to the final delivery of the product to the customer [2,3]. Throughout this process, even minor data errors or inaccuracies can lead to significant disruptions [4,5]. For example, if an online shopping platform displays incorrect inventory levels, inaccurate pricing, or erroneously marks a product as out of stock, it may result in customer dissatisfaction. In some cases, this can escalate to negative reviews on social media, ultimately damaging brand reputation and affecting sales performance [6]. To improve the accuracy of supply chain information, Refs. [7–10] applied blockchain technology to supply chain management. Refs. [11–13] demonstrated that blockchain technology enhances security, transparency, and trust within the supply chain. Meanwhile, Ref. [14] examined the challenges associated with utilizing blockchain technology to establish comprehensive, transparent, and tamper-proof records. The accuracy and integrity of data are critical across numerous domains. The application of blockchain architecture for secure data storage has not only become increasingly widespread but has also driven significant technological innovation. The recent study, such as [15], has explored the integration of blockchain with quantum technologies, leveraging the advantages of quantum computing to ensure the accuracy, integrity, and availability of clinical datasets. Technological advancements may further extend the application of blockchain to sensitive supply chain data, such as inter-enterprise procurement agreements.
According to [16], the rapid transformations in the global trade environment have led to increasing complexity in supply chains, necessitating further optimization to improve accuracy and efficiency. This has driven the expansion of deep learning (abbreviated as DL) applications in supply chain management and blockchain technology. Similarly, Ref. [1] highlighted that artificial intelligence (abbreviated as AI) is expected to have a profound impact on the supply chain industry in the coming years, with machine learning (abbreviated as ML) and DL playing a critical role in enhancing supply chain speed and efficiency. The market value of AI in supply chain management is projected to grow at an annual rate of 29%. Furthermore, the volume of academic research on DL applications in supply chain management continues to increase. Ref. [16] examined various applications of ML and DL in supply chain management, including leveraging ML for procurement and inventory analysis, forecasting, and optimizing transportation routes to enhance logistics efficiency. Additionally, Refs. [17,18] indicated that AI can be applied not only to pricing in supply chain management but also to real-time business decision-making using external data to refine commercial strategies. Ref. [19] employed digital twins to model supply chain disruption risks, combining model-based and data-driven approaches to uncover links between risk data, disruption modeling, and performance metrics. These AI-driven methods enhance supply chain resilience and facilitate recovery from major disruptions such as the COVID-19 pandemic. Moreover, recent work has emphasized the potential of integrating AI and blockchain into hybrid decision systems. Ref. [20] surveyed the use of intelligent decentralized systems powered by AI and blockchain, pointing to a growing convergence between these technologies for secure, automated decision-making.
Demand forecasting is also a critical aspect of supply chain management. Refs. [21,22] highlighted that transparent demand forecasting can reduce uncertainty, thereby enhancing overall efficiency. Refs. [23–25] examined the impact of demand opacity on supply chain trust and performance and proposed a new Proof of Relation (abbreviated as PoR) algorithm based on [26]. Ref. [24] virtualized procurement transaction data and presented its blockchain and peer-to-peer network architecture. Furthermore, it utilized the PoR algorithm to develop a mathematical model for ‘the Overall Performance Characteristics of the Supply Chain’. Ref. [24] also provided a mathematical proof demonstrating that this characteristic can be employed to detect corporate behaviors involving the distortion and exaggeration of performance information when recording procurement transaction data. This, in turn, contributes to greater demand transparency and reinforces trust across the supply chain.
A recent survey [14] identifies a lack of demand transparency as a critical factor contributing to conflicts and inefficiencies across the supply chain. In response, major retailers have invested significantly in digitalization initiatives. Nevertheless, despite efforts to implement blockchain technology, its practical impact has remained limited. With the recent emergence of generative AI and related technologies over the past two years, large retailers have increasingly leveraged AI for procurement demand analysis [27], inventory management [28], logistics and delivery optimization [29], and disruption risk management in supply chains [30]. However, Ref. [31] indicates that while most AI technologies have reached the production deployment stage, blockchain remains largely in the proof-of-concept phase. Similarly, Ref. [30] has shown that AI’s contributions to supply chain resilience and predictive capabilities have already surpassed those of other digital technologies, including blockchain. The rapid commercialization of AI applications in supply chain contexts has prompted discussions regarding the long-term relevance of blockchain and raised concerns over its potential marginalization within an increasingly AI-dominated technological landscape. In response, this study aims to demonstrate that blockchain possesses unique value that AI alone cannot replicate—particularly through the PoR mechanism—which has the potential to further enhance transparency and trust within supply chains.
A closer examination of the academic literature reveals that both DL and blockchain are emerging technological advancements, and some academic disciplines have begun exploring their integrated applications, as noted in [32,33]. However, there is currently no academic research that systematically compares the differences between these two technologies. On the other hand, the PoR proposed in [23] is a blockchain-based algorithm, and subsequent research [24] has demonstrated that PoR can effectively identify malicious corporate behaviors involving the distortion of procurement information. Therefore, this study extends the mathematical model proposed in [24] to develop a mathematical model for ‘the Overall Performance Characteristics of the Supply Chain’ incorporating 13 variables derived from procurement transaction blockchain data. And then this study further expands the mathematical model into a neural network representation using graph theory, serving as a basis for comparison with deep learning algorithms. This approach is intended to bridge a gap in the current academic literature. Besides, in the context of anomaly detection, graph-based deep learning approaches such as graph neural networks (abbreviated as GNNs) are also gaining attention for modeling structured relational data [34], providing potential alternatives to conventional DL models in complex supply chain scenarios. In addition to constructing a neural network model based on PoR, this study also develops two comparable DL neural network models, including Feedforward Neural Network (abbreviated as FNN) and Deep Clustering Network (abbreviated as DCN) architectures. Empirical results demonstrate that blockchain data can effectively detect malicious corporate behaviors related to information distortion. However, such malicious activities remain undetectable using DL. This finding reinforces the idea that procurement-related blockchain information possesses intrinsic detection value that current AI approaches may not yet fully capture.
The reminder of the paper is organized as follows: Section 2 covers the literature review. Section 3 describes methodologies. Section 4 presents the data and empirical results. Section 5 are the conclusion and future research directions.
Supply chain management plays a critical role in fostering long-term partnerships and ensuring sustainable business operations [1]. The supply chain encompasses the entire process from order acquisition to final product delivery, including raw material procurement, warehousing, production, inventory management, order fulfillment, and transportation and distribution [2,3]. With the proliferation of social media, the impact of supply chain disruptions on businesses has grown increasingly significant. Even minor data inaccuracies or errors can lead to substantial consequences [4,5]. For example, an online shopping platform displaying incorrect inventory levels, inaccurate pricing, or falsely indicating product unavailability may result in customer dissatisfaction. In some cases, such issues can escalate into negative reviews on social media, ultimately damaging brand reputation and affecting performance [6]. Furthermore, Refs. [7–10] applied blockchain technology to supply chain management, while Refs. [11–13] demonstrated its potential to enhance security, transparency, and trust within the supply chain. Additionally, Ref. [14] investigated the challenges associated with leveraging blockchain technology to establish comprehensive, transparent, and tamper-proof records.
The accuracy and integrity of data are critical across numerous domains. The application of blockchain architecture for secure data storage has not only become increasingly widespread but has also driven significant technological innovation. The recent study, such as [15], has explored the integration of blockchain with quantum technologies, leveraging the advantages of quantum computing—such as accelerated patient identification and tracking—to ensure the accuracy, integrity, and availability of clinical datasets. Technological advancements may further extend the application of blockchain to sensitive supply chain data, such as inter-enterprise procurement agreements.
Meanwhile, in the context of economic globalization, supply chain relationships are undergoing significant transformations. In addition to increasing complexity, the demand for accuracy and efficiency is also rising. To address these challenges, Ref. [16] highlighted the growing need for supply chain optimization, which is driving the extensive application of DL in supply chain management and blockchain technology. DL has the potential to help enterprises reduce operational costs, enhance responsiveness to market demands, and improve overall operational efficiency. Ref. [1] cited Gartner’s survey report, which emphasized that AI is expected to have a profound impact on the supply chain industry in the coming years. ML and DL are critical for managing the increasing complexity of supply chain challenges. In 2023, the market value of ML/DL in supply chain management was approximately USD 1.5 billion and is projected to grow at an annual rate of 29%. The applications of DL in supply chain management include supplier selection, production, inventory control, transportation, and demand and sales forecasting. Additionally, the number of academic publications on DL applications in supply chain management continues to increase. Ref. [16] examined various applications of ML and DL in supply chain management, including the use of ML for procurement and inventory analysis and forecasting, as well as the optimization of transportation routes to enhance logistics efficiency. Furthermore, Refs. [17,18] pointed out that AI can be applied not only to pricing in supply chain management but also to storage capacity adjustment, transportation planning based on weather forecasting, and real-time business decision-making using external data. Ref. [19] employed digital twins to model supply chain disruption risks, combining model-based and data-driven approaches to uncover links between risk data, disruption modeling, and performance metrics. This AI-driven methods enhances supply chain resilience and facilitate recovery from major disruptions such as the COVID-19 pandemic. Moreover, recent work has emphasized the potential of integrating AI and blockchain into hybrid decision systems. Ref. [20] surveyed the use of intelligent decentralized systems powered by AI and blockchain, pointing to a growing convergence between these technologies for secure, automated decision-making.
Demand forecasting is a critical aspect of supply chain management. Enhancing demand transparency not only strengthens trust within the supply chain but also helps enterprises mitigate risks and avoid unnecessary losses. Refs. [21,22] highlighted that transparent demand forecasting can transform uncertainties into controllable macro-level variables, providing a scientific basis for supply chain management. Furthermore, Refs. [23–25] examined the impact of demand opacity on supply chain trust and performance and proposed a new PoR algorithm based on [26]. For instance, malicious enterprises may procure goods from suppliers while exaggerating their future performance outlook to persuade suppliers to agree to deferred payment upon delivery. However, they may ultimately fail to fulfill their payment commitments, resulting in losses for suppliers. This not only forces suppliers to become more cautious when accepting orders but also undermines trust and efficiency within the supply chain. Although suppliers can choose to cease transactions with such customers, these firms may simply shift to new suppliers and repeat the same deceptive tactics, ultimately affecting the overall performance of the supply chain. However, Refs. [23,26] argue that while such malicious behavior is relatively rare in decentralized peer-to-peer networks, it is not entirely random but rather follows identifiable patterns. Accordingly, they introduced the PoR algorithm, demonstrating that by analyzing historical records, it is possible to identify these patterns and use them to detect such malicious activities. Additionally, Ref. [24] virtualized the extensive procurement transaction data accumulated in enterprise resources planning system (abbreviated as ERP) using ‘the Metaverse Algorithm’. The virtualized data retains the structural of blockchain and decentralized peer-to-peer network. A mathematical model of this blockchain data was then constructed, followed by the application of the PoR algorithm to develop a mathematical model for ‘the Overall Performance Characteristics of the Supply Chain’. Ref. [24] further provided mathematical proof demonstrating that this characteristic can be utilized to detect corporate behavior involving the distortion and exaggeration of procurement transaction records. This, in turn, contributes to greater demand transparency and reinforces trust across the supply chain.
A recent survey [14] identifies a lack of demand transparency as a critical factor contributing to conflicts and inefficiencies across the supply chain. In response, major retailers have invested significantly in digitalization initiatives. Nevertheless, despite efforts to implement blockchain technology, its practical impact has remained limited. With the recent emergence of generative AI and related technologies over the past two years, large retailers have increasingly leveraged AI for procurement demand analysis [27], inventory management [28], logistics and delivery optimization [29], and disruption risk management in supply chains [30].
However, Ref. [31] indicates that while most AI technologies have reached the production deployment stage, blockchain remains largely in the proof-of-concept phase. Similarly, Ref. [30] has shown that AI’s contributions to supply chain resilience and predictive capabilities have already surpassed those of other digital technologies, including blockchain. The rapid commercialization of AI applications in supply chain contexts has prompted discussions regarding the long-term relevance of blockchain and raised concerns over its potential marginalization within an increasingly AI-dominated technological landscape. In response, this study aims to demonstrate that blockchain possesses unique value that AI alone cannot replicate—particularly through the PoR mechanism—which has the potential to further enhance transparency and trust within supply chains.
On the other hand, both deep learning and blockchain are emerging technologies whose significance continues to grow, each playing a critical role in different application domains. Blockchain is a decentralized distributed ledger technology characterized by immutability, transparency, and security, with widespread applications in supply chain management and other industries. Deep learning, a branch of AI, mimics neural networks in the human brain to perform data analysis and pattern recognition, achieving significant advancements in image and speech recognition. In recent years, some academic disciplines have begun exploring the integration of these two technologies. For instance, Ref. [32] proposed a decentralized federated learning model based on blockchain, incorporating homomorphic encryption to protect the privacy of intermediate parameters in collaborative training. The model aggregation and collaborative decryption processes are governed by an elected federated learning committee, ensuring privacy protection while maintaining high model performance. Similarly, Ref. [33] leveraged DL to enhance blockchain system performance and security, introducing a deep learning-based honeypot contract detection method. This method analyzes the characteristics of honeypot contracts to define key opcodes and develops a keyword extraction technique for selecting critical opcodes within smart contracts, thereby improving the accuracy of malicious contract detection. However, no academic research has yet systematically compared these two technologies. To address this gap, this study introduce that the PoR proposed in [23] is a blockchain-based algorithm, and subsequent research [24] has demonstrated that PoR can effectively identify malicious corporate behaviors involving the distortion of procurement information.
Based on [23,24], this study builds and compares neural network models, extending the mathematical model proposed in [24] to develop a model incorporating 13 variables representing ‘the Overall Performance Characteristics of the Supply Chain’ and procurement transaction blockchain data. This mathematical model is then expanded into a neural network model using graph theory. Based on this foundation, two comparable DL neural network model were constructed, FNN and DCN. Empirical results demonstrate that DL remains insufficient in capturing or identifying malicious corporate behaviors related to information distortion, as well as trust and transparency within the supply chain. Despite the structural similarity of these models, the difference in activation functions leads to a fundamental distinction in their capabilities. The procurement transaction blockchain model employs the PoR algorithm as its activation function, creating an intrinsic value that AI alone cannot replace.
While AI has been widely applied in supply chain forecasting and management, limited academic research has compared its effectiveness with blockchain in detecting data manipulation and ensuring information integrity. Most existing studies focus on blockchain’s transparency, yet overlook its potential in identifying malicious procurement behaviors. This study addresses this gap by constructing a neural network model of the blockchain based PoR and empirically comparing it with DL models for anomaly detection in supply chain transactions.
3.1 A Neural Network Embedded in Blockchain
Ref. [24] applied ‘the Metaverse Algorithm’ to virtualize the extensive procurement transaction data accumulated in ERP. The resulting virtualized data maintains the structural of blockchain and decentralized peer-to-peer network. This blockchain data is subsequently expressed using the following mathematical model:
In the derivation of Eq. (1), Ref. [24] assumes that the supply chain consists of twelve enterprises, represented by A through L, forming an upstream–midstream–downstream structure in which companies C, F, and H serve as retailers. These twelve firms engage in mutual procurement transactions, and Ref. [24] models each firm’s procurement behavior toward its upstream partners using a directed graph in Graph Theory. From the opposite direction, corporate performance is interpreted as deriving from procurement initiated by downstream customers. For internal management purposes, each enterprise records such procurement data within systems such as ERP, and these data are subsequently aggregated. The recorded, stored, and consolidated procurement transaction information is denoted as Pi; for instance, PA represents the procurement data of company A stored in its ERP system. Since these actions are performed autonomously by each enterprise to meet its own internal operational needs, Ref. [24] argues that the underlying logic and function are consistent with the concept of smart contracts. Moreover, because each firm records its own transaction data independently and publishes such data at its own discretion—ensuring that its information is not alterable by others—Ref. [24] represents this structure as a decentralized peer-to-peer network in which each firm documents and discloses its participation in procurement transactions. Furthermore, Ref. [24] asserts that within a supply chain, each enterprise can only record transactions in which it is directly involved. The supply chain itself, not being a legal entity, cannot be represented by any organization that centrally records all transaction data on its behalf. Consequently, the entirety of the supply chain’s transaction information is inherently distributed across the ERP systems of individual firms. Each enterprise operates independently and is not subject to external control. Based on these premises, Ref. [24] expresses this structure mathematically in Eq. (1) and contends that the procurement transaction data stored in ERP systems constitute a form of blockchain information within the supply chain.
And then, Ref. [24] applied the PoR algorithm to the virtualized procurement transaction blockchain data to establish relationships between corporate procurement transaction figures. These relationships are then defined as ‘the Overall Performance Characteristics of the Supply Chain’. The mathematical model for these characteristics is formulated as follows:
The meaning of Eq. (2) is that Ref. [24] applies the PoR algorithm proposed in [23] to the supply chain context, thereby formulating the Supply Chain PoR Algorithm and introducing the concept of ‘the Overall Performance Characteristics of the Supply Chain’. The original PoR algorithm in [23] was designed to address the limitations of the Proof of Work (abbreviated as PoW) algorithm commonly used in cryptocurrencies—specifically its vulnerability to 51% attacks and excessive energy consumption. By drawing from Byzantine consensus algorithm, Ref. [23] proposed a novel PoR algorithm that not only minimizes energy consumption but also offers complete resistance to 51% attacks and other types of impersonation threats. In [24], an analysis of procurement transactions using a directed graph reveals underlying relationships among enterprises in the supply chain. For instance, within the twelve companies labeled A through L, firm H sells goods directly to consumers. These goods are procured from G, who processes items purchased from F; F, in turn, sources materials from E, who originally procures from A. In this HG → F → E → A supply chain path, each firm’s procurement expenditure becomes the sales revenue for its upstream supplier. For example, H’s procurement amount constitutes G’s sales performance. This mean that H’s material cost reflects G’s sales revenue, and so on, and the relationship between H and G is gross margin ratio. Given that the industry’s gross profit margin remains relatively stable, Ref. [24] establishes a mathematical relationship between these inter-firm transactions. Specifically, the procurement amount of firm H, equivalent to G’s sales revenue, is related to G’s own procurement amount by the expression: H = G*(1–G’s gross margin ratio). In Eq. (2), the term bi represents “1−gross margin ratio”, and due to the stability of gross margins across the industry, the value of bi also remains stable. This stability enables bi to serve two functions: (1) as an indicator of the overall supply chain characteristic (i.e., gross profit margin level), and (2) as a basis for anomaly detection, since any intentional inflation or distortion of procurement records by a firm would disrupt the expected consistency of bi values across the chain. Therefore, Ref. [24] further provides the following mathematical proof demonstrating that ‘the Overall Performance Characteristics of the Supply Chain’ can be used to detect corporate behavior involving the distortion and exaggeration of performance when recording procurement transaction data:
The meaning of Eq. (3) is as follows: In the directed graph constructed in [24], firms B, C, D, and E are downstream entities of firm A, each procuring goods from A. Consequently, A’s ERP system records the procurement amounts from these four companies. At the same time, each of these firms also records the amount it procures from A within its own ERP system. Therefore, the gross margin characteristic b1A of firm A is composed of the individual gross margin relationships associated with B, C, D, and E—denoted as b1B, b1C, b1D, and b1E—as expressed in Eq. (3). Specifically, b1B refers to the gross margin relationship derived from the procurement amount recorded by firm B in its own system when purchasing from A, and the same interpretation applies analogously to the other three terms. Therefore, if firm A intentionally exaggerates or distorts its procurement records, the equality in Eq. (3) will no longer hold, resulting in a mathematical inconsistency. Based on this, Ref. [24] further provides a formal mathematical proof demonstrating that Eq. (3) can be effectively used to detect improper or anomalous behavior on the part of firm A.
However, the procurement transaction data recorded in any company’s ERP system comprises numerous variables. According to the Supply Chain PoR Algorithm, a certain relationship exists among the procurement transaction variables of different enterprises. Consequently, Ref. [24] applied an algorithm to 13 variables within the virtualized procurement blockchain data to capture the deviation of b1A in Eq. (3) from bA in ‘the Overall Performance Characteristics of the Supply Chain.’ Based on this, the present study expands the relationship between b1A and each variable into the following mathematical model:
Ref. [24]’s experimental method essentially applies a deviation algorithm to each variable within the blockchain. Therefore, based on Eq. (4), the present study expands Eq. (3) as follows:
We can replace the right-hand side of all equations from (5) to (17) uniformly with v1i, as they are conceptually equivalent. Thus, it can be rewritten as follows:
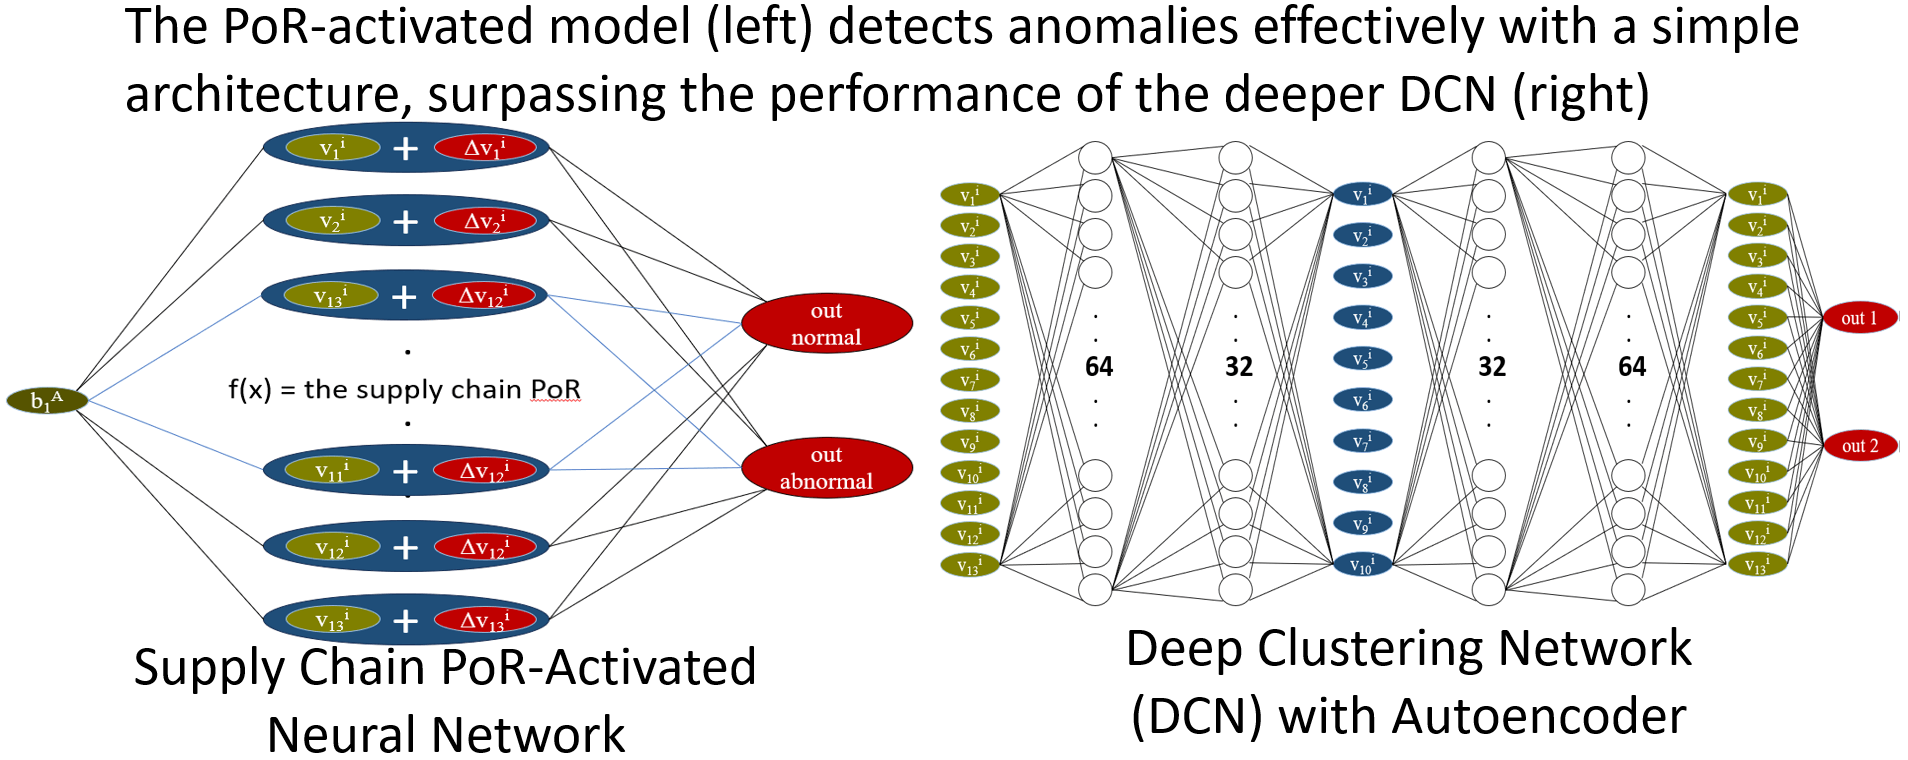
where, Δv1A represents the discrepancy in the inequality component where v1A ≠ {v1B, v1C, v1D, v1E}. Following the execution of the deviation algorithm on 13 variables, Ref. [24] computed the mean deviation magnitude of each variable and used it to quantify the deviation of b1A from b1i. Consequently, this process can be formulated into a single-layer neural network model, see Fig. 1 below. This model, referred to as ‘A Neural Network Embedded in Blockchain-Based Supply Chain Information’, encapsulates the implicit structure of procurement transaction blockchain data within the supply chain. These neural network models have been successfully implemented for effective classification using machine learning algorithms by [25].

Figure 1: A neural network embedded in blockchain-based supply chain information
Ref. [25] successfully identified corporate behaviors that distort or exaggerate performance by leveraging the informational content obtained through PoR execution on blockchain data. However, can DL replace the informational value provided by blockchain? Could DL even achieve superior identification performance? To address these questions, this study employs two DL techniques tailored to the characteristics of such classification tasks.
Ref. [25] classified unlabeled data directly using the K-means clustering algorithm and successfully identified abnormal corporate behaviors associated with information distortion. A comparable deep learning algorithm is DCN, a DL approach specifically designed for clustering in unsupervised learning. DCN is capable of directly generating classification results while optimizing feature values within the same cluster to enhance classification performance. Moreover, Refs. [23,26] highlighted that corporate information distortion is relatively rare. For example, in the classification results of [25], anomalous corporations comprised approximately 7% of the total sample, indicating a significant imbalance in cluster proportions. A key advantage of DCN is its ability to effectively construct models that distinguish different group characteristics even in the presence of an imbalanced sample distribution. The specifications of the neural network model used in DCN for this study are as follows (see Fig. 2 below):
(a) Input Layer: Consists of 13 neurons corresponding to 13 variables.
(b) Encoder Hidden Layers:
First Layer: Composed of 64 neurons with ReLU activation, defined as follows:
Second Layer: Composed of 32 neurons with ReLU activation.
Third Layer: Composed of 10 neurons with linear activation.
(c) Decoder Hidden Layers:
First Layer: Composed of 32 neurons with ReLU activation.
Second Layer: Composed of 64 neurons with ReLU activation.
Third Layer: Composed of 13 neurons with linear activation.
(d) Clustering Layer: Consists of 2 cluster centers.

Figure 2: Deep clustering network, DCN
On the other hand, since supervised learning is the dominant approach in deep learning, this study assigns labels to the sample data based on the classification results of machine learning. The labeled data is then used for model training and prediction through DL. This approach aims to compare the differences between the informational content of blockchain data and AI’s identification capabilities. For this part, this study employs FNN, with the neural network model specifications as follows:
(a) Input Layer: Consists of 13 variables.
(b) Hidden Layer (64 Neurons): Uses ReLU as the activation function.
(c) Hidden Layer (32 Neurons): Activated using ReLU.
(d) Dropout Applied to Hidden Layers: Prevents overfitting.
(e) Output Layer (2 Neurons): Uses Softmax as the activation function (see Fig. 3 below).

Figure 3: Feedforward neural network, FNN
This study develops the system architecture for comparing the identification capabilities of deep learning and supply chain blockchain information, see Fig. 4 below.

Figure 4: System architecture
4 Data and Empirical Evidences
This study builds upon the mathematical model proposed in [24] by developing a model that integrates ‘the Overall Performance Characteristics of the Supply Chain’ and 13 variables derived from procurement transaction blockchain data. This model is further extended into a neural network representation using graph theory. To assess corporate information deviations, machine learning algorithms are applied to the characteristics to quantify the degree of deviation. This deviation measure is then used to identify malicious enterprises that distort procurement transaction data. Furthermore, this study employs multi-layer neural network models, specifically FNN and DCN, to detect these malicious enterprises and compares the classification performance across all three approaches. The experimental setup, data processing methods, and empirical results are described as follows.
The programming language used for the implementation in this study is Python, version 3.9. The computer specifications are as follows:
(a) Processor: Intel 12th Gen i7 2.3 GHz
(b) Memory: 32 GB DDR5-4800
(c) Dedicated GPU: NVIDIA® GeForce RTX™ 3060 6 GB GDDR6
(d) Operating System: Windows 11.
This study selected approximately 2000 large-scale enterprises from Chunghwa Telecom’s Chunghwa Yellow Pages [35], based on company size. The procurement-related data used in this research were not obtained directly from internal enterprise systems, but rather from publicly disclosed information. These enterprises regularly publish procurement-related data in standardized formats generated by their ERP systems. Such disclosures are collected, verified, and aggregated by professional data providers, the Taiwan Economic Journal (abbreviated as TEJ)—and are made available through subscription-based services. In this study, all relevant data were obtained from TEJ’s Databank Solution (https://www.tejwin.com/en/databank-solution/financial-data/ (accessed on 10 March 2025)). Further, this study obtained 13 procurement-related data items, along with the total asset values of the 2000 companies, from the TEJ. Based on the total asset figures, the top 856 companies with the largest asset sizes were selected for analysis. Following the “Metaverse Algorithm” proposed in [24], each of the 13 procurement-related data items was normalized by the corresponding company’s total assets, thereby transforming the data into 13 ratio-based variables.
When variables exhibit a high degree of correlation, the model may learn redundant information, potentially reducing training efficiency. Moreover, this redundancy can cause certain neurons to acquire highly similar weights, which may disrupt gradient computation and lead to training instability. In severe cases, such issues can result in vanishing gradients or exploding gradients. For these reasons, this study conducts correlation analysis to assess whether these 13 variables exhibit high correlation due to overlapping informational content, which could bias the analysis results. Pearson correlation coefficients (see Eq. (20) for an example) are calculated for all variable pairs, and the results are visualized using a heatmap to depict the strength and direction of variable correlations, see Fig. 5 below.

Figure 5: Correlation matrix of selected features
Among the 13 variables analyzed, only two pairs exhibited relatively high correlation, both remaining below 0.7. When the correlation exceeds 0.8, it may introduce significant redundancy. In the model with hundreds of variables, a considerable number of variables demonstrating correlations in the range of 0.6 to 0.7 can affect learning efficiency. However, in this study, only 13 variables were used, with just two pairs exceeding 0.6 and none surpassing 0.8. Therefore, the impact on deep learning is expected to be negligible.
4.2.1 Classification Results Based on Blockchain Information
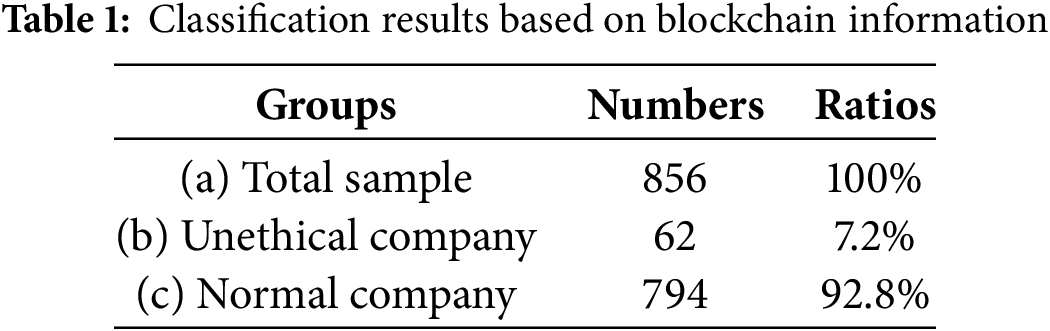
This study first virtualized all procurement transaction data from enterprises’ ERP systems using ‘the Metaverse Algorithm’. The virtualized data retained the blockchain and decentralized symmetric network architecture. Subsequently, 13 variables were selected from the virtualized blockchain data, and ‘the Overall Performance Characteristics of the Supply Chain’ were extracted using the PoR algorithm. Based on these characteristics, 856 sample companies were classified. Machine learning identified 62 companies (7.2% of the total) as potentially distorting procurement transaction information, while the remaining 794 companies (92.8%) were classified as normal, see Table 1 below. The proportion of companies exhibiting potential malicious behavior was relatively low, aligning with the expectations of this study and corroborating the findings of [23–26].
Although the PoR algorithm successfully identified 62 companies as potentially distorting procurement transaction information, as anticipated, additional objective validation is necessary to strengthen the robustness of this classification. As proposed by [24,25], one effective method is to examine the degree of consistency between internal and external performance evaluations. Internally, firms typically generate annual performance metrics from their ERP systems for managerial purposes, while external stakeholders—such as media, analysts, and market observers—evaluate firm performance based on publicly available information, including news reports. According to [24,25], firms that report their internal performance data truthfully should demonstrate a positive correlation between internal and external assessments. Conversely, if a firm manipulates its internal data, this correlation is likely to be broken. Their findings support the reliability of this discrepancy-based validation method in detecting distortions. Following this rationale, the present study collected internal performance metrics from each of the sample firms, along with corresponding external performance evaluations from public sources. Based on the PoR classification, the 62 firms identified as potentially malicious were separated from the remaining 794 firms deemed normal. The Pearson correlation coefficient between internal and external performance data was then calculated for each group, see Table 2 below.

As illustrated in Table 2, the Pearson correlation coefficient for the 794 firms classified as normal was 0.0600. This value is consistent with those reported in [24,25]. Besides, it is substantially higher than the coefficient of –0.0017 observed for the 62 firms flagged as potentially anomalous, further reinforcing the conclusion that firms distorting procurement information are likely to exhibit disrupted alignment between internal and external performance indicators. Based on these findings, the PoR classification results will serve as the foundation for subsequent comparisons with the DCN and FNN models. In particular, since FNN requires labeled data for supervised learning, the 62 firms identified by PoR are labeled as class 1 (indicating anomalies), and the remaining 794 firms are labeled as class 0 (normal). These labels provide the ground truth for both model training and performance evaluation.
This independent validation offers strong empirical support for the reliability of PoR classification. By revealing a clear disruption in the correlation between internal and external performance indicators among firms identified as anomalous, the analysis introduces an additional layer of objectivity to the model’s outcomes. This approach aligns with the framework proposed by [24,25], which highlights consistency as a crucial indicator of data integrity. Furthermore, the validation emphasizes the practical value of the PoR method. While deep learning models such as DCN and FNN may yield compelling classification results, their limited external validation capabilities can constrain their interpretability and reliability in real-world decision-making contexts. In contrast, employing the PoR classification as a foundation for subsequent modeling enhances both the transparency of training data and the comparability between different classification approaches. This comprehensive perspective contributes meaningfully to the study’s broader objective of promoting procurement transparency and reinforcing trust within supply chain networks.
4.2.2 DCN Classification Results
This study then applied DCN for unsupervised training and classified the 856 sample companies. A total of 644 companies (75.2%) were classified as normal, while 212 companies (24.8%) were classified as abnormal, see Table 3 below. The results indicate that the proportion of companies identified by deep learning as distorting procurement transaction information is relatively high, suggesting that approximately one-fourth of the entire supply chain consists of malicious entities. This finding contradicts the expectations of this study and differs from the results of [23–26], indicating that the DCN fails to accurately identify companies that may distort procurement transaction information.

In addition to comparing the classification outcomes with those derived from PoR, this study further assessed the correlation between internal and external performance metrics as a form of supplementary validation. According to the DCN classification, 212 firms identified as potentially anomalous were grouped together, while the remaining 644 firms deemed normal formed a separate group. The Pearson correlation coefficients between internal and external performance data were calculated for each group, see Table 4 below.

As shown in Table 4, the correlation coefficient for the 644 firms classified as normal by DCN was 0.0445—an even lower value than that observed for the normal group in the PoR classification. This result indirectly strengthens the credibility of PoR. More notably, the coefficient for the 212 firms identified as potentially anomalous by DCN was 0.0484, which is unexpectedly higher than that of the normal group. This contradicts both the theoretical expectations and the empirical findings of [24,25], further suggesting that the DCN model fails to effectively identify firms that manipulate procurement transaction information. When compared with the blockchain-based PoR algorithm, DCN demonstrates inferior performance, thereby reinforcing the unique and indispensable value of blockchain-based methods in procurement anomaly detection.
A comparative analysis of the blockchain based PoR and DCN models reveals notable differences in their capacity to detect corporate anomalies. The blockchain based PoR model classified 794 firms as normal, with a Pearson correlation of 0.0600 between internal and external performance indicators. In comparison, the same measure for the 644 firms classified as normal by DCN was only 0.0445, suggesting that blockchain based PoR is more effective in capturing consistency in firm-reported performance. More critically, the 62 firms flagged as anomalous by PoR exhibited a near-zero correlation (–0.0017), in line with the theoretical expectations and empirical findings of [24,25], which posit that data distortion disrupts the alignment between internal and external evaluations. Conversely, the 212 firms identified as anomalous by DCN showed a higher correlation (0.0484) than the normal group, contradicting both theoretical assumptions and empirical evidence. This inconsistency raises concerns about the DCN model’s effectiveness in capturing the behavioral characteristics associated with procurement data manipulation. In summary, the blockchain based PoR model not only aligns more closely with established theory but also benefits from independent external validation, making it better suited for practical applications where accuracy and interpretability are critical. The inability of the unsupervised DCN model to produce meaningful distinctions between normal and anomalous firms highlights the limitations of relying exclusively on AI-based approaches without integrating domain-specific structures such as blockchain. These findings underscore the distinctive value of blockchain-integrated algorithms in promoting data integrity and fostering trust across supply chain networks.
4.2.3 FNN Classification Results
This study first labeled the data based on the identification results from Blockchain. Among the 856 sample companies, 62 were labeled as enterprises that distort procurement transaction information, while 794 were labeled as normal. A FNN was then applied for supervised training, and the 856 sample companies were classified accordingly. The FNN model was trained using 80% of the samples, with the remaining 20% used for testing. A total of 569 companies (66.4%) were classified as normal, whereas 287 companies (33.6%) were classified as abnormal, see Table 5 below. The results indicate that the number of companies classified as distorting procurement transaction information is four times higher than the initially labeled instances. Approximately one-third of the entire supply chain was classified as malicious entities, which contradicts the expectations of this study and differs from the findings of [23–26]. This suggests that FNN fails to accurately identify companies that may distort procurement transaction information.

Additionally, considering the Accuracy (0.7371) and F1-score (0.3553), while the model demonstrates a certain level of accuracy, its predictive performance for label = 1 (positive class) is suboptimal. This can be analyzed from the Confusion Matrix: [[569,225],[0,62]].
(a) True Negative (TN) = 569 → The model correctly predicted 569 instances as label = 0 (the model classified them as 0, and they were actually 0).
(b) False Positive (FP) = 225 → The model incorrectly classified 225 instances as label = 1 (the model predicted them as 1, but they should have been 0).
(c) False Negative (FN) = 0 → The model made no incorrect predictions where label = 1 was classified as 0 (no cases of misclassifying 1 as 0).
(d) True Positive (TP) = 62 → The model correctly predicted 62 instances as label = 1 (the model classified them as 1, and they were actually 1).
In this context, identifying malicious enterprises that distort procurement transactions is undoubtedly important. However, the FNN misclassified 225 normal enterprises as entities that distort public procurement information. This misclassification undermines the reliability of the model’s predictions, ultimately preventing the FNN from achieving the expected performance.
In addition, the FNN model achieved a perfect recall of 1.0 on the test data, indicating that it successfully identified all actual anomalous firms without any false negatives. This demonstrates a high level of sensitivity in detecting the target class. In contrast, the precision was only 0.216, suggesting that among the 287 firms predicted as anomalous, only 62 were indeed anomalous. This outcome implies that, although the model has a certain level of detection capability, it also generates a high number of false positives—misclassifying many normal firms as anomalous—which corresponds to the 225 false positive cases discussed earlier. While the objective of this study is to support firms in identifying clients who may distort procurement transaction information to enhance transparency and trust, an excessive number of false alarms—where normal firms are incorrectly classified as anomalous—could not only harm business performance and reduce supply chain efficiency but also intensify distrust between firms and their clients. Consequently, such misclassifications may ultimately undermine the reliability of the model and pose risks to the overall stability of the supply chain.
Furthermore, as illustrated by the ROC curve (see Fig. 6 below), the FNN model developed in this study achieved an Area Under the Curve (abbreviated as AUC) of 0.776 on the test set, indicating a moderately strong ability to discriminate between normal and anomalous samples. However, when interpreted in conjunction with the confusion matrix, precision, and F1-score, it becomes evident that the model entails certain risks in practical applications. Specifically, the high number of false positives reveals a tendency to misclassify normal firms as anomalous, which may result in unnecessary disruptions within the supply chain. Such misclassifications could undermine the model’s overall reliability and limit its applicability in real-world scenarios.

Figure 6: The ROC curve for FNN model
In addition to comparing the classification results with those derived from the PoR model, this study also evaluated the correlation between internal and external performance metrics as an independent validation. Based on the FNN model’s classification, the 287 firms identified as potentially anomalous were grouped separately from the 569 firms classified as normal. The Pearson correlation coefficients for each group were calculated, see Table 6 below.

As presented in Table 6, the correlation coefficient for the 569 firms classified as normal by FNN was 0.0621—slightly higher than the corresponding figure in the PoR classification, and thus broadly consistent. In contrast, the coefficient for the 287 firms labeled as anomalous by FNN was 0.0363. Although lower than that of the normal group, it is still substantially higher than the –0.0017 reported for the anomalous group in the blockchain based PoR classification. These results suggest that FNN lacks the discriminatory power of the blockchain based PoR and do not substantiate the claim that AI models can effectively replace blockchain-based methods in detecting procurement anomalies. Relative to DCN, the FNN model appears to perform better in terms of internal-external consistency. This may be attributed to its supervised nature, whereas DCN operates without labeled data. Nevertheless, the operational assumptions of the two models differ substantially. Supervised models require labeled datasets, which entail additional costs and, in many real-world settings, are difficult or even impossible to obtain. Therefore, asserting the superiority of FNN over DCN is not straightforward. Furthermore, the number of firms classified as anomalous by FNN (287) exceeds that of DCN (212). As emphasized earlier, the core objective of this study is to help firms identify clients that may distort procurement transaction data, thereby fostering transparency and trust. A high false positive rate—wherein normal firms are misclassified as anomalous—can jeopardize business performance, impair supply chain efficiency, and erode inter-organizational trust. These unintended consequences may ultimately compromise the very goals the model seeks to advance.
A comprehensive analysis of the results across the three models—the blockchain based PoR, DCN, and FNN—reveals important differences in their effectiveness and practical implications for anomaly detection in procurement transactions. The blockchain based PoR model consistently aligns with theoretical expectations, as demonstrated by both its classification outcomes and correlation-based validation. Its ability to distinguish clearly between normal and anomalous firms underscores its theoretical soundness and practical reliability. In contrast, although the DCN model offers the advantage of requiring no labeled data, it failed to produce meaningful distinctions in internal-external performance correlations, thereby undermining its validity in identifying genuinely anomalous behavior. The FNN model, as a supervised approach, showed modest improvements in precision and validation outcomes. However, its high false positive rate and the large number of firms classified as anomalous (287) raise concerns about its applicability in real-world settings. In supply chain contexts where trust and operational efficiency are paramount, such misclassifications may lead to unnecessary disruptions and erode inter-organizational relationships. The operational differences among the models are also noteworthy. FNN relies on labeled data—which may be expensive or unavailable in practice—while DCN, although label-free, suffers from limited interpretability and lacks external validation mechanisms. The blockchain based PoR, by contrast, integrates structural rigor and transparency through its blockchain foundation and correlation-based validation strategy. These qualities make it particularly well-suited for high-stakes environments that demand both accuracy and interpretability. In conclusion, this study illustrates the limitations of relying exclusively on AI models for procurement anomaly detection. The findings highlight the value of incorporating domain-specific, verifiable algorithms—such as blockchain-based approaches—into decision-support systems aimed at enhancing data integrity, fostering inter-firm trust, and promoting resilience in supply chain management.
4.2.4 Practical Constraints of Deep Learning Models
The primary objective of this study is to explore the unique value of the blockchain-based PoR algorithm in detecting procurement anomalies, rather than to discredit existing AI-based approaches. Both theoretical foundations and prior empirical research ([24,25]) suggest that firms engaging in distorted procurement practices constitute a small minority—approximately 7% of the population. This creates a highly imbalanced dataset for machine learning models, further compounded by the limited sample size in this study. This study anticipated from the beginning that such conditions would pose challenges for AI model performance and could potentially lead to unfair comparisons, which empirical findings confirmed. Despite these concerns, this study choses to proceed with the comparison because data imbalance is a common characteristic of real-world datasets and not something researchers can readily control. Avoiding model comparisons solely due to imbalance may obscure a key limitation in the generalizability of AI models. Thus, this study also aims to highlight the significant impact of data imbalance and to encourage further attention to this issue beyond conventional efforts to improve prediction accuracy.
Although many AI algorithms exist, only a limited subset is appropriate for the research context of this study. The selected models—FNN and DCN—are widely used, well-understood, and based on standard architectures with established training procedures. Accordingly, the scope for further architectural or hyperparameter experimentation in this study was relatively limited. It is also important to note that the blockchain based PoR algorithm used here incorporates K-means clustering is unsupervised, whereas FNN is a supervised learning model. A direct comparison is therefore inherently limited due to their fundamentally different learning paradigms. The inclusion of FNN serves primarily to broaden the comparative scope, with the main benchmark comparison remaining between PoR and DCN, both unsupervised approaches.
Given the combined challenges of class imbalance and limited data size, the DCN model failed to demonstrate meaningful classification capability. In this context, conducting an ablation study focused on architecture or hyperparameters is unlikely to yield substantive insights. Therefore, this study does not pursue further tuning analysis and instead focuses on interpreting model outcomes in relation to theoretical alignment and practical relevance.
5 Conclusion and Future Research Directions
This study extends the mathematical model proposed in [24] by establishing a relationship between “the Overall Performance Characteristics of the Supply Chain” and 13 procurement transaction variables derived from blockchain information. Building upon this model, a single-layer neural network model incorporating graph theory was developed, which served as the foundation for two multi-layer deep learning neural network models: the Feedforward Neural Network (abbreviated as FNN) and the Deep Clustering Network (abbreviated as DCN). Experimental results show that the single-layer model using the Proof of Relation (abbreviated as PoR) algorithm as the activation function successfully identified abnormal enterprises, accounting for 7.2% of the total sample. In contrast, the more complex DCN and FNN models demonstrated a tendency to overclassify, identifying one-fourth and one-third of the enterprises as malicious, respectively—deviating significantly from expected distributions. These findings suggest that while blockchain-derived variables carry potential for detecting anomalies in procurement transactions, current deep learning models may not effectively capture the nuanced characteristics of such distortions. In summary, procurement transaction blockchain information possesses intrinsic analytical value that current AI models may not yet fully harness or replicate.
However, the findings of this study are based on a limited sample size, which may affect the generalizability of the results to other contexts. Additionally, the proportion of anomalous enterprises related to procurement data distortion is likely to be relatively low in real-world supply chains, leading to a class imbalance that may impact the classification performance of deep learning models. This study also employed relatively traditional and simple deep learning architectures; therefore, it is possible that more advanced models could achieve better classification outcomes.
Building upon prior work—specifically, the development of the PoR algorithm in [23] and its anomaly detection validation in [24]—this study integrates PoR with machine learning models and demonstrates that even with simplified computation in each step, the resulting detection performance can surpass that of deep learning, offering both high efficiency and low power consumption. Based on these findings, several future directions are proposed:
(a) Applying the PoR-based approach to optimize AI deployment in Internet of Things (IoT) devices, thereby mitigating the high energy and hardware costs typically associated with deep learning.
(b) Integrating PoR with Information Security Management Systems (abbreviated as ISMS) to enhance data protection in cloud environments and prevent large-scale data breaches during system maintenance.
(c) Exploring the use of PoR-enhanced algorithms in military-grade unmanned aerial vehicles (abbreviated as UAVs), particularly to counteract energy constraints and electronic interference vulnerabilities faced by conventional AI-driven drones.
Acknowledgement: The authors want to thank Der-Chen Huang, the Supervising professor of this research.
Funding Statement: The authors received no specific funding for this study.
Author Contributions: The authors confirm contribution to the paper as follows: study conception and design, data collection, analysis and interpretation of results, and draft manuscript preparation: Hsiao-Chun Han and Der-Chen Huang. All authors reviewed the results and approved the final version of the manuscript.
Availability of Data and Materials: Readers can access the data used in the study by Chunghwa Yellow Pages and request enterprises to provide procurement transaction data from their ERP, MRP, SCM, and PLM systems, excluding any trade secrets. Additionally, this study is willing to share the original data used in the research.
Ethics Approval: Not applicable.
Conflicts of Interest: The authors declare no conflicts of interest to report regarding the present study.
References
1. Khedr AM, Rani SS. Enhancing supply chain management with deep learning and machine learning techniques: a review. J Open Innov Technol Mark Complex. 2024;10(4):100379. doi:10.1016/j.joitmc.2024.100379. [Google Scholar] [CrossRef]
2. Rahmani D, Abadi MQH, Hosseininezhad SJ. Joint decision on product greenness strategies and pricing in a dual-channel supply chain: a robust possibilistic approach. J Clean Prod. 2020;256(6):120437. doi:10.1016/j.jclepro.2020.120437. [Google Scholar] [CrossRef]
3. Hasani A, Mokhtari H, Fattahi M. A multi-objective optimization approach for green and resilient supply chain network design: a real-life case study. J Clean Prod. 2021;278(1):123199. doi:10.1016/j.jclepro.2020.123199. [Google Scholar] [CrossRef]
4. Radivojevic G, Mitrovic M, Popovic D. Overview of criteria and methods of machine learning for supplier selection. In: Proceedings of the 5th Logistics International Conference; 2022 May 26–27; Belgrade, Serbia. [Google Scholar]
5. Tirkolaee EB, Sadeghi S, Mooseloo FM, Vandchali HR, Aeini S. Application of machine learning in supply chain management: a comprehensive overview of the main areas. Math Probl Eng. 2021;2021(1):1476043–50. doi:10.1155/2021/1476043. [Google Scholar] [CrossRef]
6. Mitrovic M, Radivojevic G, Popovic D. Machine learning methods for selection of suppliers. Math Probl Eng. 2021;11(7):1–16. [Google Scholar]
7. Blossey G, Eisenhardt J, Hahn G. Blockchain technology in supply chain management: an application perspective. In: Proceedings of the 52nd Hawaii International Conference on System Sciences; 2019 Jan 8–11; Grand Wailea, HI, USA. [Google Scholar]
8. Chen CL, Lim ZY, Liao HC. Blockchain-based alcoholic beverages supply chain management system. J Ambient Intell Hum Comput. 2023;14(3):2493–523. doi:10.1007/s12652-022-04500-w. [Google Scholar] [CrossRef]
9. Chen CL, Chiang ML, Deng YY, Weng W, Wang K, Liu CC. A traceable firearm management system based on blockchain and IoT technology. Symmetry. 2021;13(3):439. doi:10.3390/sym13030439. [Google Scholar] [CrossRef]
10. Chen CL, Zhu ZP, Zhou M, Tsaur WJ, Wu CM, Sun H. A secure and traceable vehicles and parts system based on blockchain and smart contract. Sensors. 2022;22(18):6754. doi:10.3390/s22186754. [Google Scholar] [PubMed] [CrossRef]
11. Sharabati AA, Jreisat ER. Blockchain technology implementation in supply chain management: a literature review. Sustainability. 2024;16(7):2823. doi:10.3390/su16072823. [Google Scholar] [CrossRef]
12. Ai Y, Chen CL, Weng W, Chiang ML, Deng YY, Lim ZY. A traceable vaccine supply management system. Sensors. 2022;22(24):9670. doi:10.3390/s22249670. [Google Scholar] [PubMed] [CrossRef]
13. Chen J, Chen X, Chen CL. A traceable blockchain-based vaccination record storage and sharing system. J Healthc Eng. 2022;2022:2211065. doi:10.1155/2022/2211065. [Google Scholar] [PubMed] [CrossRef]
14. Gaur V, Gaiha A. Building a transparent supply chain: blockchain can enhance trust, efficiency, and speed. Harv Bus Rev. 2020;98(3):94–103. [Google Scholar]
15. Bala PM, Rajmohan R, Kumar TA, Ajagbe SA, Adigun MO. Quantum blockchain-oriented data integrity scheme for validating clinical datasets. In: Kumar A, Dubey AK, Piuri V, Rodrigues JJPC, editors. Exploring intelligent healthcare with quantum computing. Hertfordshire, UK: The Institution of Engineering and Technology; 2023. p. 259–78. doi:10.1049/PBHE060E_ch13. [Google Scholar] [CrossRef]
16. Lin H, Lin J, Wang F. An innovative machine learning model for supply chain management. J Innov Knowl. 2022;7(4):100276. doi:10.1016/j.jik.2022.100276. [Google Scholar] [CrossRef]
17. Ghorashi SB, Hamedi M, Sadeghian R. Modeling and optimization of a reliable blood supply chain network in crisis considering blood compatibility using MOGWO. Neural Comput Appl. 2020;32(16):12173–200. doi:10.1007/s00521-019-04343-1. [Google Scholar] [CrossRef]
18. Gholizadeh H, Tajdin A, Javadian N. A closed-loop supply chain robust optimization for disposable appliances. Neural Comput Appl. 2020;32(8):3967–85. doi:10.1007/s00521-018-3847-9. [Google Scholar] [CrossRef]
19. Ivanov D, Dolgui A. A digital supply chain twin for managing the disruption risks and resilience in the era of Industry 4.0. Prod Plan Control. 2022;161(9):102658. doi:10.1080/09537287.2020.1768450. [Google Scholar] [CrossRef]
20. Khan A, Mahmood K, Ahmed J, Ali A, Khan K, Amin SU, et al. AI agents meet blockchain: a survey on secure and scalable collaboration. Future Internet. 2025;17(2):57. doi:10.3390/fi17020057. [Google Scholar] [CrossRef]
21. Xu X, Lee SD, Kim HS, You SS. Management and optimisation of chaotic supply chain system using adaptive sliding mode control algorithm. Int J Prod Res. 2021;59(9):2571–87. doi:10.1080/00207543.2020.1735662. [Google Scholar] [CrossRef]
22. Angos Mediavilla M, Dietrich F, Palma D. Review and analysis of artificial intelligence methods for demand forecasting in supply chain management. CIRP Conf Manuf Syst. 2022;107(16):131–6. doi:10.1016/j.procir.2022.05.119. [Google Scholar] [CrossRef]
23. Han H. Proof of work blockchain technology and byzantine fault tolerance consensus algorithm in cryptocurrency, along with proof of relation [Internet]. [cited 2023 Aug 30]. Available from: https://soc.cs.nchu.edu.tw/SOCLAB/PDF/Consensus_Algorithm.pdf. (In Chinese). [Google Scholar]
24. Han H-C, Huang D-C. Graph-theoretic detection of anomalies in supply chains: a PoR-based approach using Laplacian flow and sheaf theory. Mathematics. 2025;13:1795. doi:10.3390/math13111795. [Google Scholar] [CrossRef]
25. Han H. Application of the proof of relation algorithm to multicollinearity problems caused by a large number of blockchain variables and the resolution using the random forest algorithm [Internet]. [cited 2024 Apr 30]. Available from: https://soc.cs.nchu.edu.tw/SOCLAB/PDF/Random_Forest_Algorithm.pdf. (In Chinese). [Google Scholar]
26. Lamport L, Shostak R, Pease M. The byzantine generals problem. ACM Trans Progr Lang Syst. 1982;4(3):382–401. doi:10.1145/357172.357176. [Google Scholar] [CrossRef]
27. Seyedan M, Mafakheri F. Predictive big data analytics for supply chain demand forecasting: methods, applications, and research opportunities. J Big Data. 2020;7(1):53. doi:10.1186/s40537-020-00329-2. [Google Scholar] [CrossRef]
28. Samuels A. Examining the integration of artificial intelligence in supply chain management from Industry 4.0 to 6.0: a systematic literature review. Front Artif Intell. 2025;7:1477044. doi:10.3389/frai.2024.1477044. [Google Scholar] [PubMed] [CrossRef]
29. Culot G, Podrecca M, Nassimbeni G. Artificial intelligence in supply chain management: a systematic literature review of empirical studies and research directions. Comput Ind. 2024;162(5/6):104132. doi:10.1016/j.compind.2024.104132. [Google Scholar] [CrossRef]
30. Modgil S, Singh RK, Hannibal C. Artificial intelligence for supply chain resilience: learning from COVID-19. Int J Logist Manag. 2021;32(4):1246–68. doi:10.1108/ijlm-02-2021-0094. [Google Scholar] [CrossRef]
31. Gartner Research. Hype cycle for supply chain strategy; 2023 [Internet]. [cited 2025 Mar 10]. Available from: https://www.gartner.com/en/documents/4671899. [Google Scholar]
32. Zhou W, Wang C, Xu J, Hu K, Wang J. Privacy-preserving and decentralized federated learning model based on the blockchain. J Comput Res Dev. 2022;59(11):2423–36. (In Chinese). doi:10.7544/issn1000-1239.20220470. [Google Scholar] [CrossRef]
33. Zhang H, Wang Q, Wang D, Wang B. Honeypot contract detection of blockchain based on deep learning. J Commun. 2022;43(1):194–202. (In Chinese). doi:10.11959/j.issn.1000-436x.2022011. [Google Scholar] [CrossRef]
34. Zhou J, Cui G, Zhang Z, Yang C, Liu Z, Wang L, et al. Graph neural networks: a review of methods and applications. AI Open. 2020;1(1):57–81. doi:10.1016/j.aiopen.2021.01.001. [Google Scholar] [CrossRef]
35. Company Information. IYP Taiwan [Internet]. [cited 2025 Mar 10]. Available from: https://www.iyp.com.tw. [Google Scholar]
Cite This Article
 Copyright © 2025 The Author(s). Published by Tech Science Press.
This work is licensed under a Creative Commons Attribution 4.0 International License , which permits unrestricted use, distribution, and reproduction in any medium, provided the original work is properly cited.
 Downloads
 Citation Tools