
 Submit a Paper
 Propose a Special lssue
 Open Access
ARTICLE

Predicting Immunotherapy Outcomes in Colorectal Cancer Using Machine Learning and Multi-Omic Biomarkers: Development of a Real-Time Predictive Web Application
1 Data Science, Department of Applied Mathematics and Statistics, Whiting School of Engineering, Johns Hopkins University, Baltimore, MD, USA
2 Biomedical Engineering, Department of Biomedical Engineering, Whiting School of Engineering, Johns Hopkins University, Baltimore, MD, USA
3 Electrical Engineering, Department of Electrical and Computer Engineering, Whiting School of Engineering, Johns Hopkins University, Baltimore, MD, USA
4 Smart Systems Engineering Laboratory, College of Engineering, Prince Sultan University, Riyadh, Saudi Arabia
5 Department of Robotics and Intelligent Machines, Faculty of Artificial Intelligence, Kafrelsheikh University, Kafrelsheikh, Egypt
6 Automated Systems and Computing Lab (ASCL), Computer Science Department, Prince Sultan University, Riyadh, Saudi Arabia
7 Department of Electronics and Electrical Communications Engineering, Faculty of Electronic Engineering, Menoufia University, Menouf, Egypt
8 School of Computing, Gachon University, Seongnam, Republic of Korea
* Corresponding Author: Jawad Khan. Email:
(This article belongs to the Special Issue: Exploring the Impact of Artificial Intelligence on Healthcare: Insights into Data Management, Integration, and Ethical Considerations)
Computer Modeling in Engineering & Sciences 2026, 146(2), 41 https://doi.org/10.32604/cmes.2026.076798
Received 26 November 2025; Accepted 19 January 2026; Issue published 26 February 2026
 View Full Text
 Download PDF
Abstract
Colorectal cancer is the third most diagnosed cancer worldwide, and immune checkpoint inhibitors have shown promising therapeutic outcomes in selected patient groups. This study performed a comprehensive analysis of multi-omics data from The Cancer Genome Atlas colorectal adenocarcinoma cohort (TCGA-COADREAD), accessed through cBioPortal, to develop machine learning models for predicting progression-free survival (PFS) following immunotherapy. The dataset included clinical variables, genomic alterations in Kirsten Rat Sarcoma Viral Oncogene Homolog (KRAS), B-Raf Proto-Oncogene (BRAF), and Neuroblastoma RAS Viral Oncogene Homolog (NRAS), microsatellite instability (MSI) status, tumor mutation burden (TMB), and expression of immune checkpoint genes. Kaplan–Meier analysis showed that KRAS mutations were significantly associated with reduced PFS, while BRAF and NRAS mutations had no significant impact. MSI-high tumors exhibited elevated TMB and increased immune checkpoint expression, reflecting their immunologically active phenotype. We developed both survival and classification models, with the Extra Trees classifier achieving the best performance (accuracy = 0.86, precision = 0.67, recall = 0.70, F1-score = 0.68, AUC = 0.84). These findings highlight the potential of combining genomic and immune biomarkers with machine learning to improve patient stratification and guide personalized immunotherapy decisions. An interactive web application was also developed to enable clinicians to input patient-specific molecular and clinical data and visualize individualized PFS predictions, supporting timely, data-driven treatment planning.Keywords
Colorectal cancer (CRC) is the third most commonly diagnosed cancer and the second most common cause of cancer-related death worldwide, contributing significantly to the global burden of disease [1]. In the United States alone, there are over 135,000 new cases and 50,000 deaths due to CRC annually [2]. Despite advances in surgical approaches, chemotherapy, and radiotherapy, treatment resistance and recurrence remain significant clinical challenges. Recently, immunotherapy, and specifically immune checkpoint blockade, has emerged as a novel treatment strategy for multiple malignancies, including CRC [3]. However, only part of patients, notably those with microsatellite instability-high (MSI-H) tumors, receive substantial and durable clinical benefit from immune checkpoint inhibitors (ICIs) [4]. This variability underscores the importance of robust biomarkers and predictive modeling to personalize immunotherapy and enhance outcomes in CRC.
Microsatellite instability (MSI) results from defects in the DNA mismatch repair (MMR) system, leading to insertion–deletion mutations within repetitive microsatellite regions [5]. The MSI tumor phenotype exhibits a hypermutation, resulting in a high tumor mutation burden (TMB) and the generation of neoantigens, thereby increasing tumor immunogenicity. Approximately 15% of CRC tumors are MSI-H and exhibit higher densities of cytotoxic T lymphocytes and increased levels of immune checkpoint molecules such as programmed cell death protein 1 (PD-1), cytotoxic T-lymphocyte-associated protein 4 (CTLA-4), and programmed death-ligand 1 (PD-L1) compared to non-MSI-H tumors [6,7]. These immunologic characteristics contribute to the high response rate of MSI-H tumors to ICIs (e.g., pembrolizumab and nivolumab) with sustained response and prolonged survival in landmark clinical trials (KEYNOTE-177 and CheckMate-142) [8,9].
In addition to MSI status, oncogenic alterations in the RAS-RAF signaling pathway play a pivotal role in modulating tumor biology and antitumor response. Mutations in the Kirsten rat sarcoma viral oncogene homolog (KRAS) occur in approximately 40%–45% of CRC cases and lead to constitutive activation of the MAPK pathway, promoting uncontrolled proliferation and immune evasion [10]. KRAS mutations are strongly correlated with resistance to anti–epidermal growth factor receptor (EGFR) therapies and are simultaneously linked to immunologically “cold” tumor phenotypes characterized by low levels of T-cell infiltration [11]. The B-Raf proto-oncogene (BRAF) V600E mutation, present in roughly 10% of CRCs, is associated with poor prognosis, increased metastatic potential, and variable immunotherapy response. Mutations in the Neuroblastoma RAS viral oncogene homolog (NRAS) are less common (2%–5%) but also contribute to oncogenic signaling and resistance to immune modulation [12,13]. Collectively, these genomic alterations represent distinct subtypes of CRC characterized by unique biologically relevant immunologic microenvironments and differential response to therapy. Tumor Mutation Burden (TMB) has been identified as an independent predictor of response to ICIs in various cancers [14]. High TMB is associated with greater somatic mutation load, including more neoantigens, leading to increased immune activation. However, in CRC, the predictive value of tumor mutational burden (TMB) is dependent on context; tumors exhibiting microsatellite instability-high (MSI-H) generally present with high
TMB and a high level of immunogenicity, whereas the majority of CRC cases (microsatellite stable, MSS) present low TMB and limited immune response potential [15]. Thus, combining TMB with other genomic and transcriptomic biomarkers may yield improved predictive performance in identifying responders to immunotherapy.
Despite the effectiveness of immunotherapy in patients with MSI-H CRC, nearly 85% of patients with CRC (the MSS cohort), derive minimal benefit from checkpoint blockade, delivering response rates in the clinical setting of less than 5% [16]. Of the patients with MSI-H, at least one in two suffered from a lack of response to ICIs. This indicates that MSI status alone cannot fully differentiate/or stratify patients [17]. Thus, there is a need for multi-parametric predictive models that can integrate prognostic molecular, transcriptomic, and immunologic features to facilitate identifying patients most likely to benefit from treatment and to avoid unnecessary toxicity in those unlikely to respond.
In this study, we used an integrated dataset of clinical, genomic, and transcriptomic data from the TCGA-COADREAD cohort to predict the progression-free survival (PFS) in patients with colorectal cancer receiving immunotherapy. The dataset contains clinical and demographic information, mutational profiles (including KRAS, BRAF, and NRAS mutations), MSI, TMB, and expression of immune checkpoint genes (PD-1, CTLA-4, PD-L1). We implemented both survival modeling and classification machine learning frameworks to predict patient outcomes and, more broadly, the risk of progression over time. By integrating molecular and immunologic biomarkers, our approach aimed to enhance patient stratification and identify individuals most likely to benefit from immunotherapy. Moreover, we created an interactive, real-time predictive web application that enables clinicians and researchers to enter patient-specific genomic and clinical data to view their individual predicted PFS probabilities. This tool bridges computational modeling with clinical decision-making, offering a practical interface for personalized treatment guidance. The overall methodological workflow of the proposed framework is shown in Fig. 1.
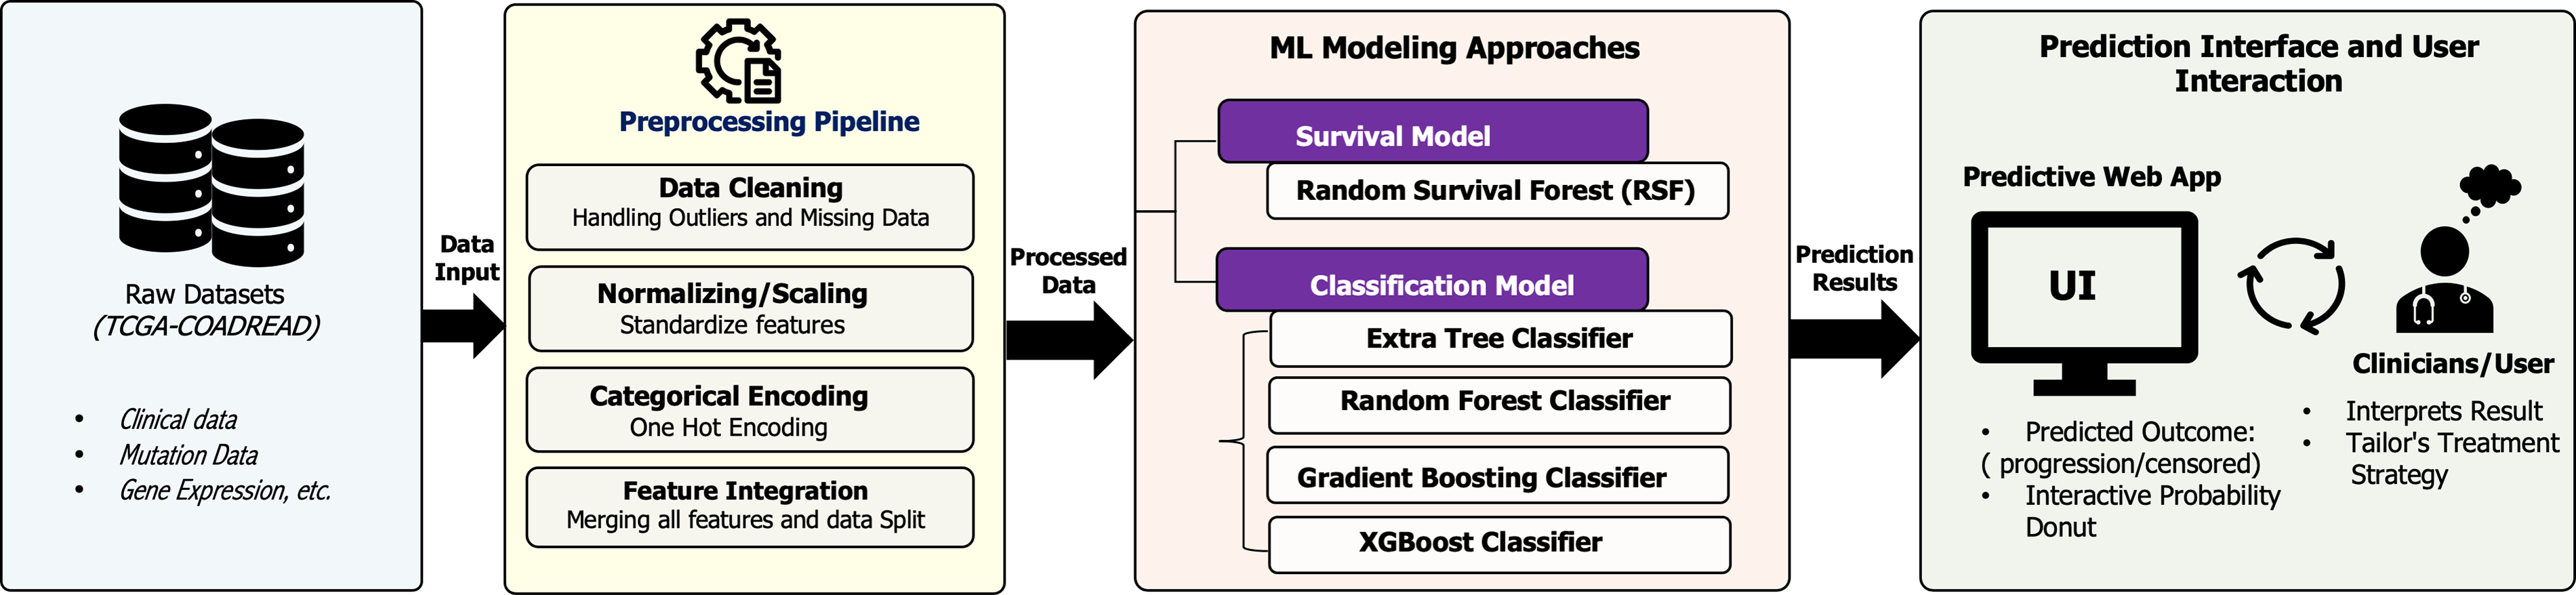
Figure 1: Overview of the proposed machine learning workflow for predicting immunotherapy outcomes in colorectal cancer.
2.1 Data Collection and Cleaning
The dataset used in this study was obtained from cBioPortal [18]. We extracted the TCGA Colorectal Adenocarcinoma (TCGA-COADREAD) dataset, which comprised multi-omics data including clinical characteristics, somatic mutation profiles, and gene expression measurements. The clinical dataset originally consists of 594 patient samples, including demographic information as well as progression-free survival (PFS) outcomes. Due to the sensitive nature of cancer-related data and the need for high fidelity, we chose to remove the data samples with missing values. Therefore, the final cohort included 513 patients. The demographic characteristics of the cohort were representative of a wide age range of patients (ages 31–90 years old) and represented gender diverse groups (53% male, 47% female). The tumor stage for each patient was assigned according to the clinical AJCC pathological staging (Stages I–IV), providing evidence for comprehensive comparisons across clinical representation. The PFS status of patients was composed of 74% being censored (no progression at last follow-up visit) and 26% indicating progression was confirmed. Progression-free survival time was recorded as a continuous variable in months, measured from the date of diagnosis to disease progression or last follow-up. Clinical features extracted for analysis included age, sex, AJCC tumor stage, and survival endpoints. A comprehensive summary of baseline demographic, clinical, and molecular characteristics of the study population is provided in Appendix Table A1.
2.2 Rationale for Biomarker Selection and Feature Definition
We selected candidate biomarkers using three criteria. First, selection was literature-driven and focused on features linked to immune checkpoint inhibitor response in colorectal cancer. We included microsatellite instability and mismatch repair status based on the established sensitivity of mismatch repair-deficient tumors to checkpoint blockade [5–7,17]. We included tumor mutational burden because it reflects neoantigen load and has been associated with immunotherapy benefit across cancers [4,14]. We also included RAS–RAF pathway mutations, including KRAS, BRAF, and NRAS, because they are common drivers of colorectal cancer and associated with prognosis and treatment response [8–12]. Finally, we included immune checkpoint pathway expression as a transcript-level marker of tumor immune activity and checkpoint engagement [3,19]. We specifically selected PDCD1, CTLA4, and CD274 because they represent core, clinically actionable immune checkpoint axes. PDCD1 encodes PD-1, and CD274 encodes PD-L1, which define the PD-1, PD-L1 pathway targeted by approved therapies, and their expression is commonly used to reflect adaptive immune resistance and T-cell exhaustion within the tumor microenvironment. CTLA4 is a key negative regulator of T-cell priming and is relevant to combination checkpoint blockade strategies. Together, these genes provide a compact transcriptomic proxy for checkpoint engagement and immune activity, complementing MSI and TMB. Second, we prioritized features with consistent definitions across TCGA-COADREAD clinical, mutation, and expression modalities, available through cBioPortal [18]. This ensured alignment of clinical variables with somatic mutation calls and gene expression measurements for the same patients. Third, we aimed for a compact feature set that is feasible to measure in routine workflows and practical to deploy in a web-based prediction tool.
Somatic mutation data were extracted from the mutation annotation format (MAF) file, which included 332,610 mutation events, given as 114 different annotation columns. Gene identities are given using the HUGO gene nomenclature standardized format. We focused on important oncogenes within the RAS/RAF signaling pathway: KRAS (Kirsten rat sarcoma viral oncogene homolog), BRAF (v-raf murine sarcoma viral oncogene homolog B1), and NRAS (neuroblastoma RAS viral oncogene homolog). To perform further statistical and machine learning analyses, the mutation status for each gene was converted to a binary variable for each patient sample (1 = mutant, 0 = wild-type).
As shown in Fig. 2, using Kaplan-Meier survival analysis [20], we determined whether RAS/RAF pathway mutation status was correlated with PFS. Patients with KRAS-mutant tumors had a significantly worse PFS compared to those with wild-type tumors (log-rank test, p = 0.0087). In contrast, BRAF and NRAS mutation status did not significantly impact prognosis (p = 0.1778 and p = 0.5881, respectively). Generally, the results suggest that the KRAS mutation may have clinical significance as a prognostic marker for progression in colorectal cancer.
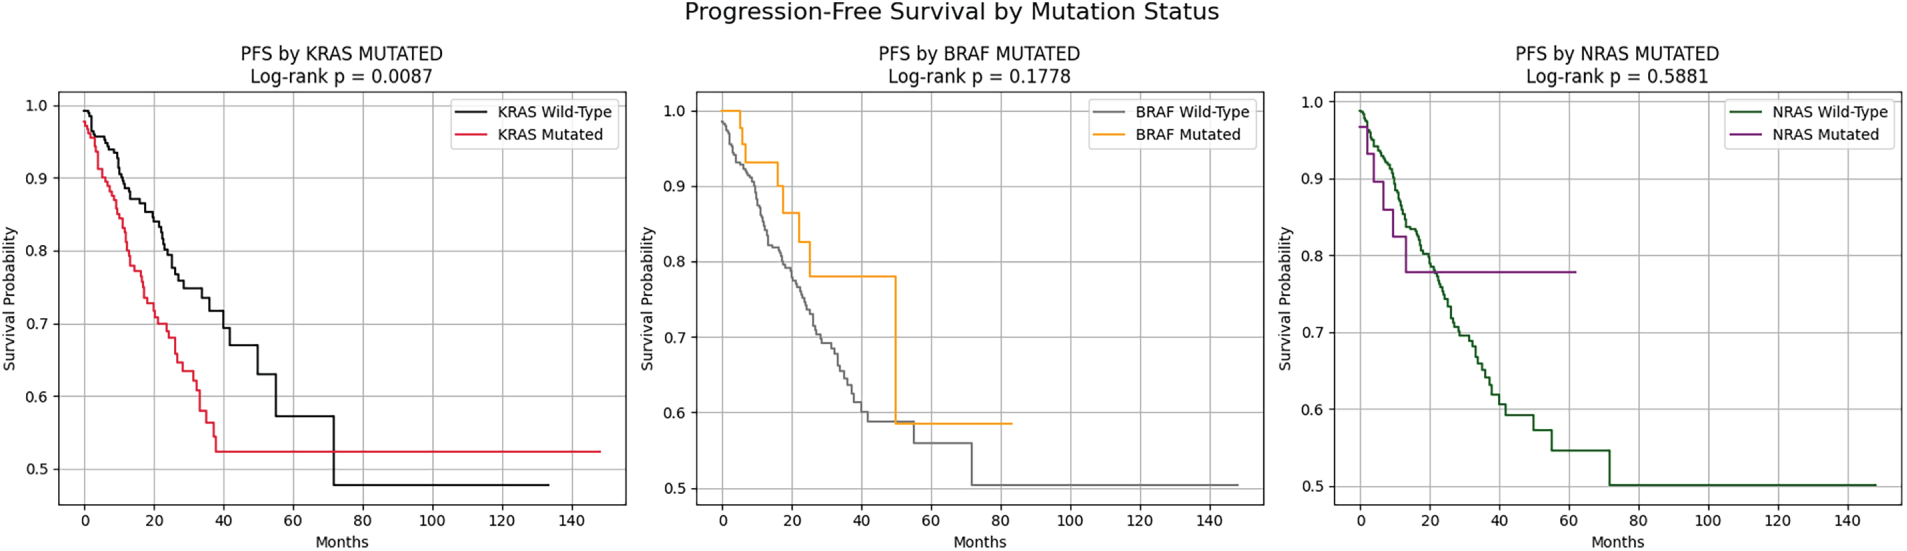
Figure 2: Progression-Free Survival (PFS) stratified by mutation status of KRAS, BRAF, and NRAS.
2.4 Tumor Mutational Burden and Microsatellite Instability Assessment
Tumor Mutational Burden (TMB) was defined as the total number of non-synonymous somatic mutations per tumor sample, calculated by summing all mutational events for each patient identifier in the mutation data. TMB is a numerical indicator of genomic instability and has been associated with response rates to immunotherapy [14]. Microsatellite Instability (MSI) status was derived from the MSI sensor scores obtained from a clinical data file. MSI is caused by defects in DNA mismatch repair (MMR) machinery that lead to an accumulation of insertion-deletion mutations at microsatellite loci. The sensor scores from the MSI were categorized into a binary classification variable (MSI_BINARY), with samples classified as MSI-High (MSI-H) or Microsatellite Stable (MSS/MSI-Low) based on established thresholds.
2.5 Gene Expression Profiling of Immune Checkpoint Molecules
The gene expression data were derived from the RNA-sequencing data normalized using the RSEM (RNA-Seq by Expectation-Maximization) algorithm. This dataset contained a total of 20,531 genes and was profiled across 593 patient samples. The data were subsequently transposed so that samples were observations and genes were considered features (data shape: 593 × 20,531). The expression values for three immune checkpoint genes were identified: PDCD1 (PD-1, Programmed Cell Death Protein 1), CTLA4 (Cytotoxic T-Lymphocyte-Associated Protein 4), and CD274 (PD-L1, Programmed Death-Ligand 1). These three molecules act as prominent negative regulators of T-cell activation and are established therapeutic targets for cancer immunotherapy [19].
The expression data of these immune checkpoint genes were then merged with datasets/clinical information and mutation status for richer multi-omics data analyses. Based on the exploratory data analysis, we found PDCD1 expression levels were higher in MSI-H tumors than in MSS tumors (Fig. 3), consistent with the hyper-mutated, immunogenic phenotype associated with MSI-H colorectal cancers. On the contrary, CTLA4 expression showed no significant difference between the KRAS-mutant and wild-type groups.
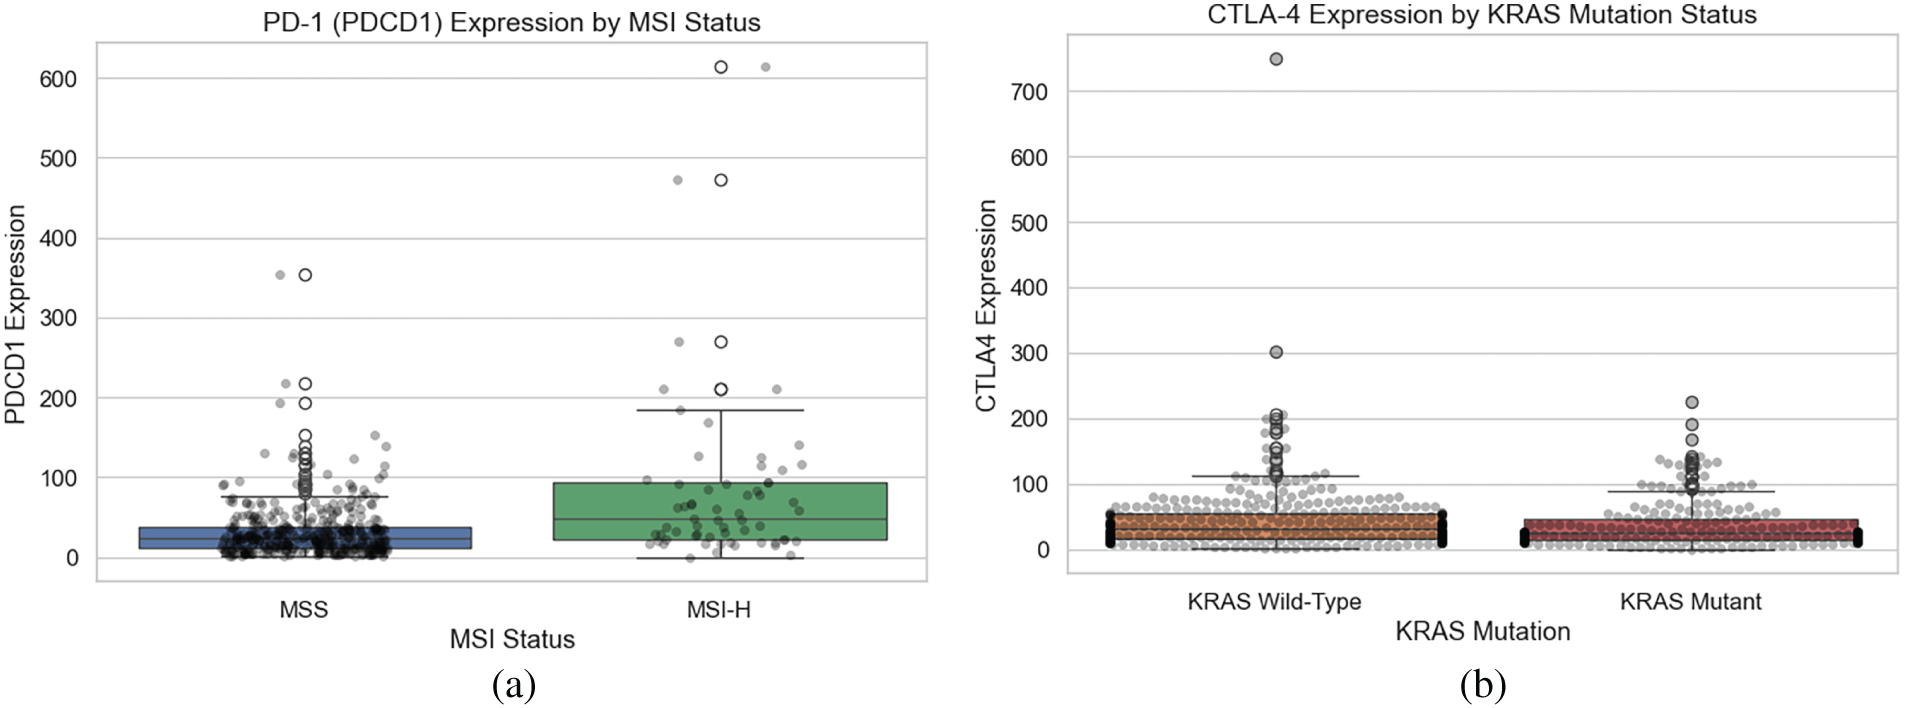
Figure 3: Expression of immune checkpoint genes by MSI and KRAS mutation status. (a) PDCD1 expression stratified by MSI status. (b) CTLA4 expression stratified by KRAS mutation status,.
2.6 Immunogenomic Feature Correlation and Interaction Analysis
We explored whether immune checkpoint molecules from gene expression levels exhibited co-regulation patterns using Pearson correlation analyses. The results of the correlation analysis are displayed in the heat-map in Fig. 4, with the analyses showing moderate positive correlations across all gene pairs. PDCD1 and CTLA4 had the highest correlation (r = 0.51), followed by PDCD1 and CD274 (r = 0.47). These data suggest coordinated expression or shared regulations that modulate the immune checkpoint molecules within a tumor micro-environment, which may impact response to immunotherapy.
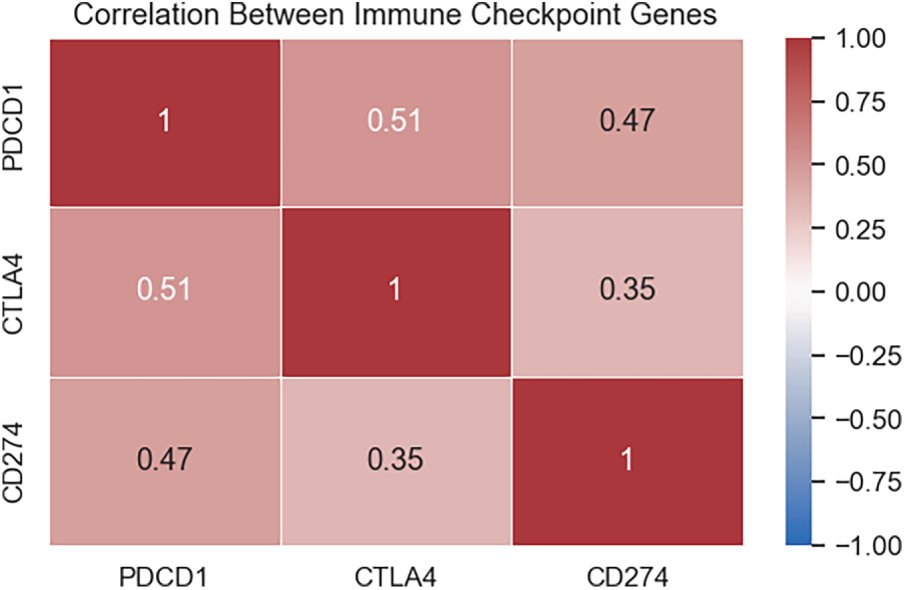
Figure 4: Correlation between immune checkpoint gene expression.
We further analyzed the relationship between immune checkpoint gene expression and disease progression outcomes. As shown in Fig. 5, boxplot of PDCD1, CTLA4, and CD274 expression stratified by progression status (0 = censored/no progression, 1 = progression) showed a trend toward lower expression levels in patients who progressed. However, substantial inter-patient variability and overlapping distributions between groups were observed, suggesting these biomarkers alone may not be definitive prognostic indicators.
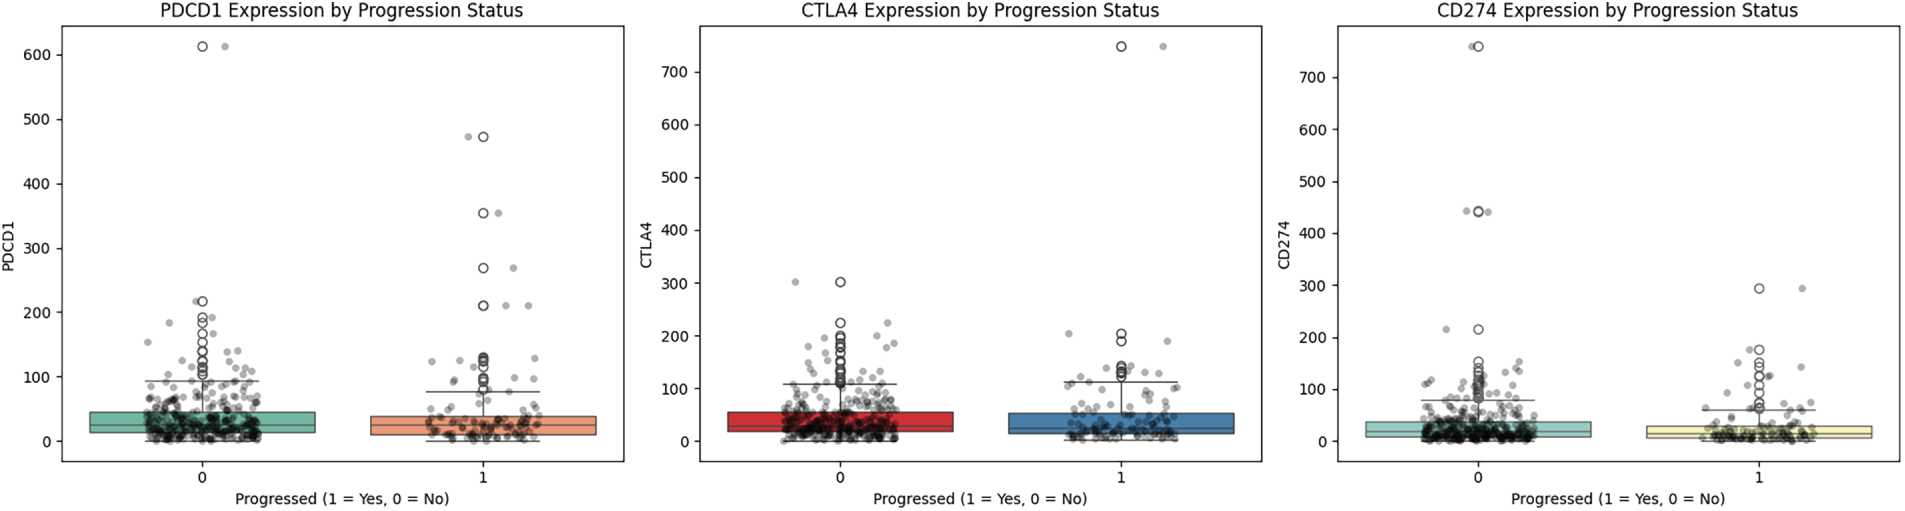
Figure 5: Expression of immune checkpoint genes by progression status.
Lastly, we explored multidimensional relationships with key immunogenomic features and used scatter plot visualization stratified by PFS status (Fig. 6). In the left panel, patients who progressed had slightly higher TMB values, which connects to the negative association with PDCD1; as expected, the middle panel shows a positive correlation between the MSI sensor score and TMB, associated with the hypermutated phenotype with MMR deficiency. The right panel illustrates moderate positive co-expression of PDCD1 and CTLA4, with no clear separation between progression groups. Overall, each analysis shows that immunogenomics features exhibit complex interactions that could elucidate PFS and response to immunotherapy in colorectal cancers.
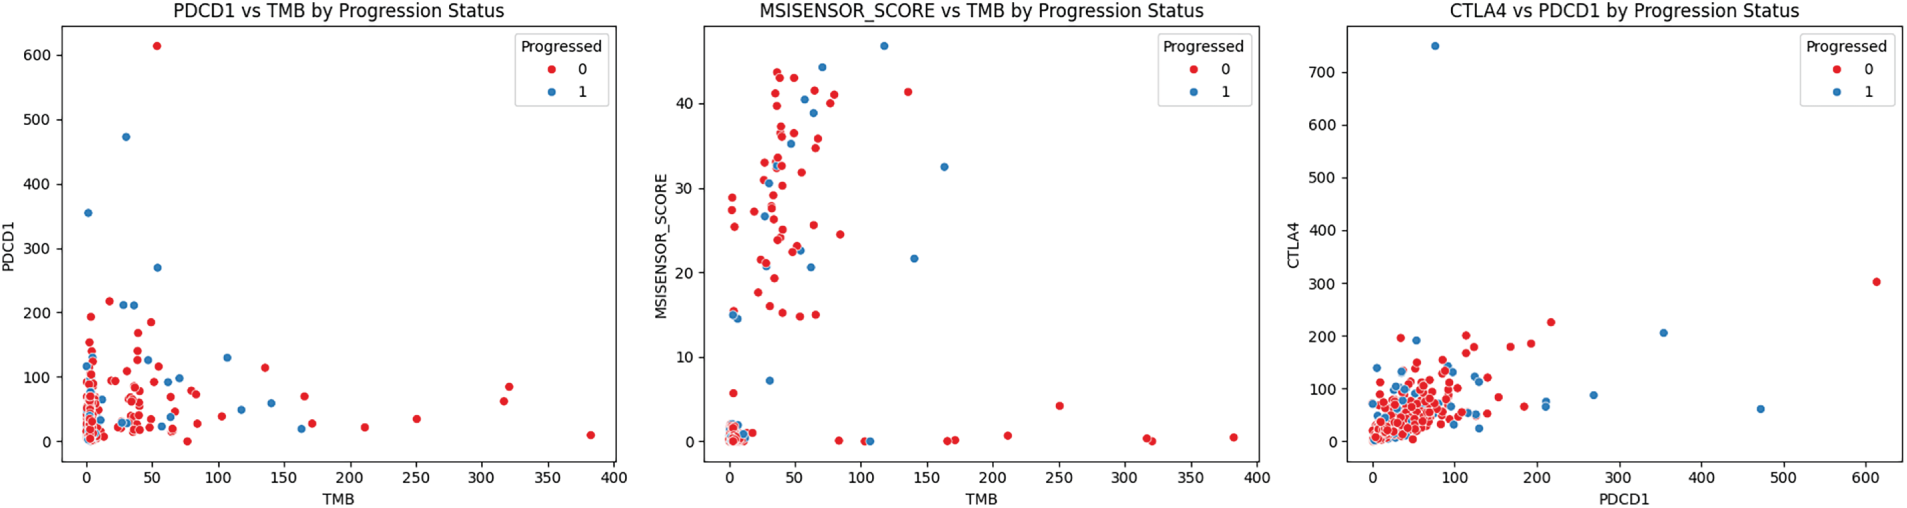
Figure 6: Immune and genomic biomarker relationships stratified by progression status.
The following section outlines the machine learning approaches implemented to predict progression-free survival (PFS) outcomes in colorectal cancer patients. Specifically, we employed two distinct but complementary modeling approaches: survival analysis models for predicting time-to-event outcomes, and classification models for predicting a binary outcome.
Before modeling the data, we standardized all continuous numerical variables, including age, TMB, MSI sensor score, and immune checkpoint gene expression (PDCD1, CTLA4, CD274), using z-score normalization to ensure a uniform scale across variables. We then converted the categorical variables, such as sex and tumor stage, into binary indicator variables using one-hot encoding, which is required before training the machine learning algorithms. Finally, the preprocessed dataset was randomly stratified to split the data into training (80%) and testing (20%) sets, retaining proportional representation of progression events across the training and testing datasets.
3.2.1 Survival Analysis Modeling
To model time-to-event data while accounting for censoring, we implemented a Random Survival Forest (RSF) model [21]. The RSF model is a non-parametric ensemble method that extends the random forest framework to survival analysis, enabling estimation of individual survival probabilities that incorporate both event times and censoring status. We specifically selected this model because it accommodates censoring and captures nonlinear effects and interactions without assuming proportional hazards. Other survival models, such as Cox models, are interpretable, but their performance can be sensitive to violations of proportional hazards and to how continuous predictors and interactions are specified. In addition, Neural survival approaches generally require larger cohorts with more events and may overfit in small, highly censored datasets. The RSF algorithm creates an ensemble of B survival trees, each built independently from a bootstrapped training sample, and assigns a subset of predictors at each node split. For a given patient with covariate vector x, the predicted survival function is obtained by averaging the cumulative hazard estimates across B, as shown in Eq. (1):
where
In addition to the survival analysis, we built multiple tree-based ensemble classifiers to predict PFS status (0 = censored/no progression, 1 = progression) in binary format. Specifically, four state-of-the-art algorithms were developed and compared.
Random Forest (RF): This ensemble method generates multiple decorrelated decision trees from bootstrap aggregation (bagging) and randomly selected features for each split [22]. Each tree in the forest is trained independently on a bootstrap sample from the data, randomly selecting some subset of features at each node to maximize information gain (or minimize Gini impurity) for a given feature threshold. The final predictions of an RF model are determined by the majority vote in the ensemble; therefore, the predictions will have less variance and improve the model’s generalization performance.
Extremely Randomized Trees (Extra Trees): This algorithm builds on the RF framework by applying additional randomization to the tree-building stage [23]. Extra Trees applies random sampling to candidate thresholds for each feature rather than searching for the optimal split threshold, then selects the best among these candidates. The additional randomization can prevent overfitting, improve performance in high dimensions or noisy data, and reduce computational costs.
Gradient Boosting Machine (GBM): Unlike bagging-based methods, gradient boosting employs a sequential ensemble approach that builds trees continuously [24]. The next tree is trained to predict the residual errors of the previous ensemble, and the entire process can be thought of as performing gradient descent in function space. The final prediction will be the weighted sum of the predictions from each tree.
Extreme Gradient Boosting (XGBoost): This is a refined version of a gradient boosting algorithm that includes a crucial algorithmic enhancements [25]: (1) second-order Taylor approximation to the loss function for a more accurate optimization strategy, (2) L1 (Lasso) and L2 (Ridge) regularization terms to mitigate overfitting, (3) faster, parallel tree construction capability through histogram-based finding of the more optimal splits, and (4) automatically handles missing values instead of simply ignoring them. Due to these developments, XGBoost can often outperform other methods by improving predictive accuracy and reducing the training time on structured tabular data.
For all classification models, tuning hyperparameters, including max tree depth, shrinkage parameter (learning rate), and the number of boosting iterations, was performed on stratified cross-validation on the training dataset.
To evaluate the performance of the survival model, we used the Concordance Index, or C-index. The C-index is a common metric used in the context of survival analysis [26]. The C-index evaluates the model’s ability to correctly rank patients based on predicted risk and survival time. The prediction of an outcome is concordant if the model assigned a higher risk (or shorter predicted survival time) to the subject that experienced the event first. The C-index is then defined as:
where
where TP represents the number of true positive progression predictions, TN represents the number of true negative non-progression predictions, FP represents the number of false positive predictions of progression, and FN represents the number of false negative missed predictions of progression. Accuracy provides an overall view of performance but can be misleading when there is a censored outcome in the data set and/or a degree of class imbalance, as models can achieve high accuracy by predicting only the majority class. Precision (positive predictive value) evaluates the proportion of predicted progression cases that are progression:
It reflects the model’s ability to reduce false positives, which is important when deciding whether to treat patients with a low risk of progression. Recall (sensitivity) measures the proportion of true progression cases that the model successfully identifies:
This is important in clinical settings to avoid delaying treatment for patients at high risk of progression. Therefore, high recall is prioritized to ensure reliable detection of at-risk individuals. F1-score is the harmonic mean of precision and recall, balancing the trade-off between false positives and false negatives.
In this work, correctly identifying high-risk patients (progressors) is essential for clinical decision-making. Therefore, we prioritized the recall and F1-score metrics to ensure that the models did not overlook potential progression cases. AUC was also reported to summarize overall model discrimination capability across different decision thresholds.
3.3.1 Survival Model Performance
The RSF model was evaluated for its ability to predict PFS while appropriately handling censored observations and time-to-event data. The model achieved a concordance index (C-index) of 0.7770 on the training set and 0.7213 in the test cohort, indicating its ability to rank patients by progression risk. Fig. 7a illustrates the confusion matrix at 24 months, using a survival probability threshold of 0.7 to classify patients as censored (no progression) or as having progression. This threshold and time point were chosen based on the relevance to expected clinical follow-up schedules and timelines for decisions regarding treatment options in colorectal cancer. At this cutoff, the model correctly classifies 67 as censored and 11 as progression cases and misclassifies 16 as progression and 9 as censoring. This shows the trade-off between sensitivity and specificity in translating the probabilistic survival estimates into binary outputs.
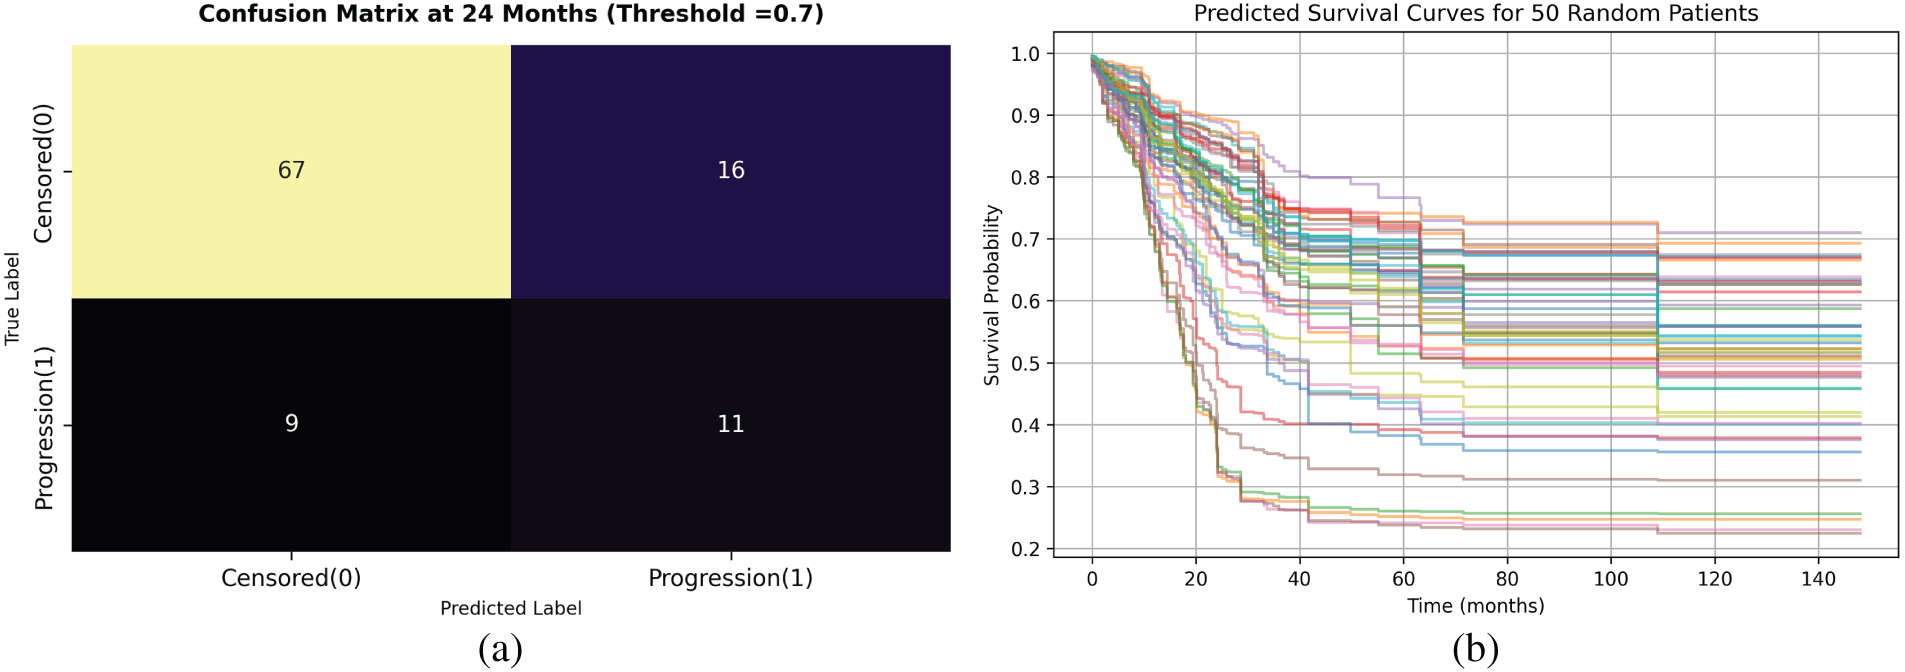
Figure 7: Random Survival Forest model performance. (a) Confusion matrix for binary classification at 24 months using threshold = 0.7. (b) Predicted survival curves for 50 test patients illustrating patient-specific risk variability.
Predicted survival curves for 50 randomly selected patients from the test sets are shown in Fig. 7b. Each curve represents a patient-specific progression-free survival function over time, with substantial heterogeneity observed across the cohort. The figure demonstrates varying degrees of predicted decline in survival probability, from patients who appear to have steeply decreasing survival probability early (high progression risk profiles) to patients who maintain elevated PFS probabilities even beyond 150 months, indicating low-risk profiles. This variability reflects the model’s ability to capture individual-level heterogeneity in the risk of progression, which is important for personalized treatment planning and risk stratification in clinical practice.
3.3.2 Classification Model Performance
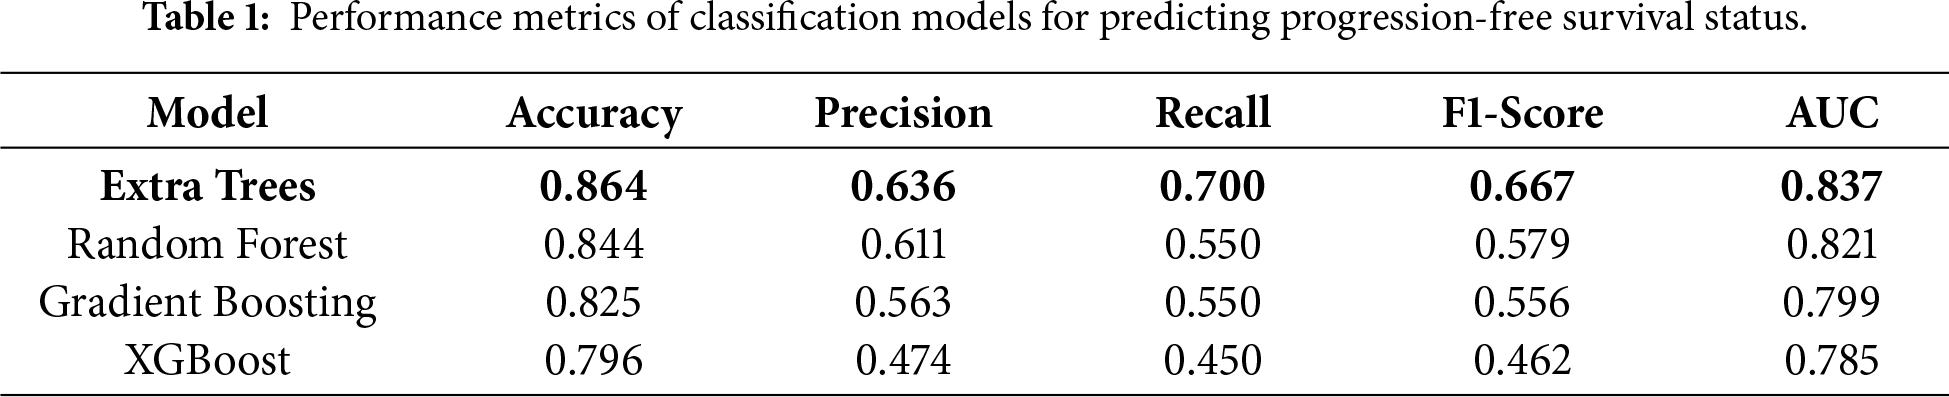
The performance of four tree-based ensemble classifiers in predicting binary PFS status (0 = censored, 1 = progression) was evaluated using standard classification metrics and summarized in Table 1. The Extra Trees model achieved the best overall performance, with accuracy of 0.864, precision of 0.636, recall = 0.700, F1 = 0.667, and AUC = 0.837, and showed the best balance between sensitivity and specificity. In addition to point metrics, the model outputs probabilistic estimates that can support risk ranking across patients rather than only a hard class label. The Extra Trees classifier yielded the most favorable probability separation between classes, which supports its use as the primary model for downstream decision support. Random Forest model showed comparable accuracy and precision to Extra Trees, but a lower recall and F1 score, implying somewhat reduced sensitivity in detecting progression events. Gradient Boosting showed similar performance with Random Forest, but with slightly lower predictive power. It can be noted that XGBoost exhibited the weakest performance across all evaluation metrics.
To assess the robustness and generalizability of the selected classifier, we further evaluated the Extra Trees model using repeated stratified 5-fold cross-validation with 10 repeats. In each repeat, the data were split into five folds while preserving the class distribution (progression vs. censored); the model was trained on four folds and evaluated on the held-out fold, repeating until each fold served once as the test fold. This process was repeated 10 times with different random partitions to reduce sensitivity to any single split and provide a more stable estimate of performance. Across the 50 total validation runs (5 folds × 10 repeats), Extra Trees demonstrated consistently strong performance, achieving mean (±SD) accuracy 0.864 ± 0.034, precision 0.636 ± 0.106, recall 0.700 ± 0.086, F1-score 0.667 ± 0.085, and AUC 0.837 ± 0.044, with corresponding 95% confidence intervals reported in Appendix Table A2. These results support the stability of the Extra Trees classifier and indicate that the performance reported in Table 1 is not driven by a favorable single split, but is reproducible across repeated stratified resampling
In addition, to provide more insight into the classification behavior, we presented the confusion matrices for each of the four models as displayed in Fig. 8. Extra Trees predicted 75 censored and 14 progressions, which had the highest sensitivity prediction (70%) across all the models, suggesting it is the best performer in the detection of patients at risk of progression. Random Forest produced a similar performance with 76 TN but much lower sensitivity, with 11 TP and 9 TN. Gradient Boosting correctly predicted 76 censored cases and 9 progression cases, with 7 FP, and 11 FN, resulting in moderate balanced performance. XGBoost demonstrated the poorest performance in both sensitivity and specificity, limiting its utility in clinical practice for identifying patients at high risk. Overall, the Extra Trees classifier achieved the most balanced and clinically interpretable performance, minimizing both false negatives and false positives. This balance is critical for real-world deployment, where accurate identification of high-risk patients can directly guide treatment prioritization and monitoring strategies.
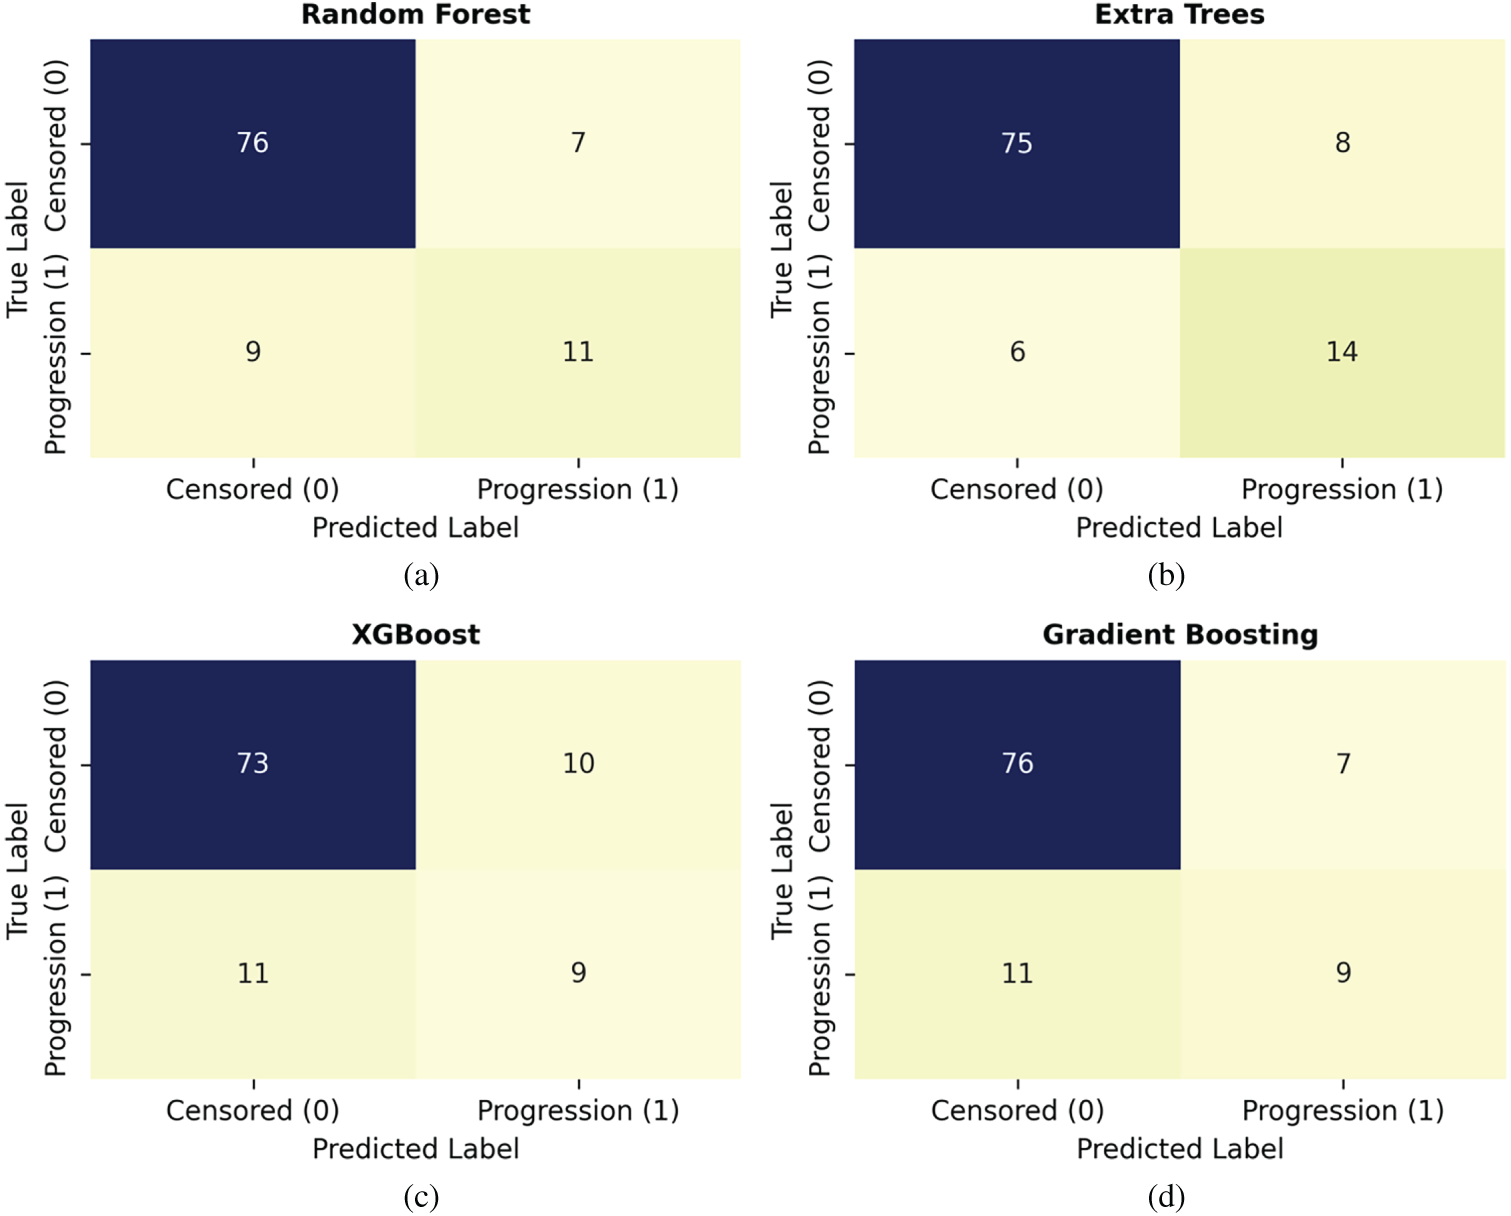
Figure 8: Confusion matrices for classification models: (a) Random Forest, (b) Extra Trees, (c) XGBoost, (d) Gradient Boosting.
3.4 Model Interpretability Using SHAP Analysis
To improve the interpretability of the final Extra Trees model, we applied SHapley Additive exPlanations (SHAP) to quantify the contribution of each feature to progression-free survival predictions. Fig. 9 presents the SHAP summary plot, where features are ranked by mean absolute SHAP value and colored by feature magnitude. The analysis identified PFS duration, immune checkpoint gene expression, and tumor stage variables as the strongest contributors to model output. Higher values of CD274 and PDCD1 expression were associated with shifts in predicted outcomes, consistent with immune activation patterns observed in immunotherapy-responsive tumors. Tumor burden indicators, including tumor mutation burden and MSI status, also demonstrated meaningful influence, supporting their established role in immunotherapy response. Clinical staging variables, particularly pathologic T and N stages, showed substantial impact on predictions, reflecting disease extent as a key determinant of progression risk. KRAS mutation status emerged as a relevant contributor, with mutated cases generally shifting predictions toward higher progression risk. In contrast, BRAF and NRAS mutations had a limited effect, consistent with their lower prevalence in the cohort. Overall, the SHAP analysis demonstrates that the model integrates both clinical and molecular signals in a biologically coherent manner, rather than relying on a single dominant feature.
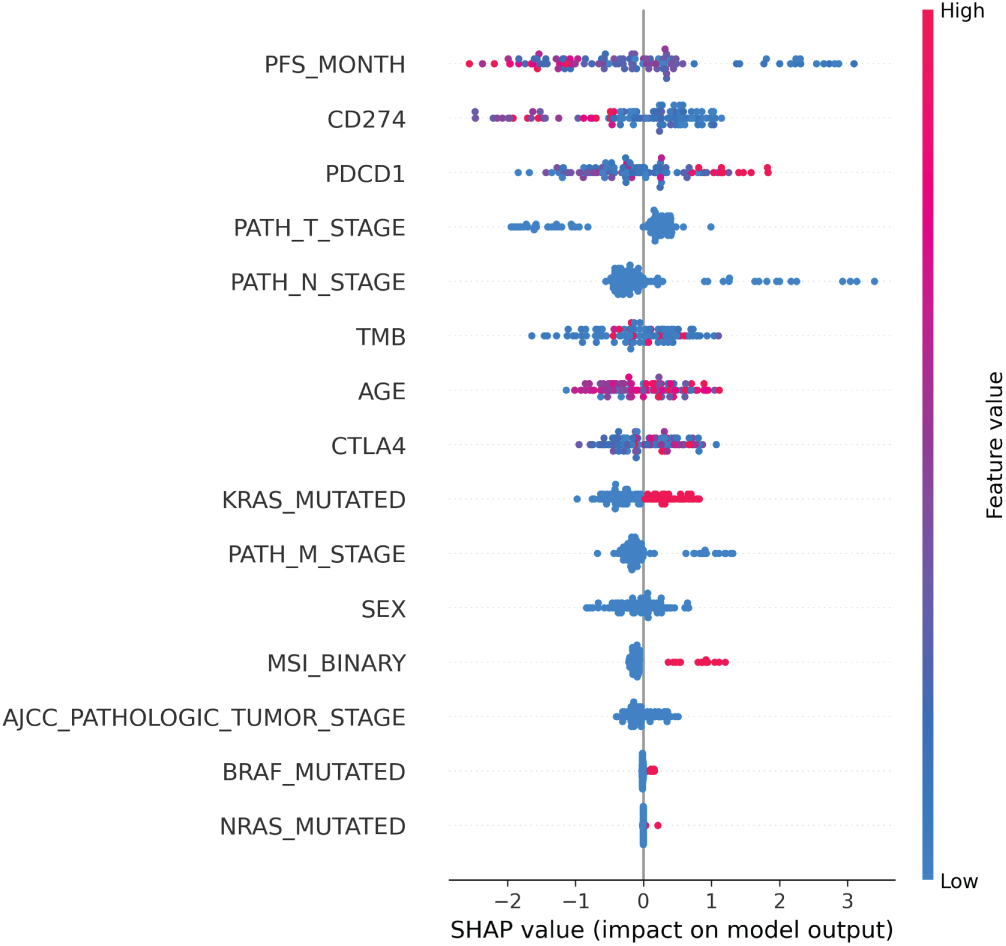
Figure 9: SHAP summary plot for the Extra Trees classifier. Features are ranked by mean absolute SHAP value. Each point represents a patient sample, with red indicating higher feature values and blue indicating lower feature values. Positive SHAP values indicate higher predicted progression risk, while negative values indicate lower risk.
3.5 Real-Time Web Application Development
To facilitate clinical use of the predictive model, we developed a web application that render real-time probabilities of PFS for colorectal cancer patients (shown in Appendix A, in Fig. A1). The web application was developed using Streamlit, a Python framework that allows rapid implementation of machine learning (ML) models in user-friendly web applications. The platform was designed to allow a clinician or researcher to provide patient-specific clinical information, organized into four sections: (1) Clinical Factors (age, sex, and tumor staging, etc.); (2) Mutation Information (KRAS, BRAF, NRAS, MSI status, and TMB); (3) Gene Expression Information (PDCD1, CTLA4, and CD274); and, (4) Survival Time Input (PFS in months). After data entry, the app automatically standardizes numeric variable values and encodes the categorical input values. Subsequently, submissions are processed using the pretrained Extra Trees classifier, the best-performing model in this study.
Once the users complete all inputs, the web app displays the submitted data and provides an estimated probability of progression, along with the results of the prediction in a donut pie chart of showing the probability of Progression to censored outcomes. Probabilities are classified using a default threshold of 0.5, offering immediate interpretability for clinicians. The web-based interactive app serves as an effective tool for integrating computational modeling and clinical decision-making, enabling user-friendly and actionable methods for predictive analysis in immunotherapy for colorectal cancer research.
This study integrated clinical, genomic, and transcriptomic features from the TCGA-COADREAD dataset to predict immunotherapy outcomes in colorectal cancer using various ML models. Our findings demonstrated that KRAS mutations were significantly associated with poor progression-free survival, whilst BRAF and NRAS mutations did not demonstrate any clear prognostic value. Tumors with MSI-high subtypes displayed increased TMB and higher rates of immune checkpoint gene expression, confirming their immunologically active tumor phenotype. The co-expression of PDCD1, CTLA4, and CD274 highlighted the important role of immune-related biomarkers in reflecting heterogeneity in the tumor micro-environment.
From a modeling perspective, our results provide important insights regarding the comparative performance of survival vs. classification modeling approaches. While survival models are theoretically beneficial for time-to-event analysis because they directly account for censoring data, the designed RSF model demonstrated an average performance, with moderate predictive power. In contrast, the classification models, particularly the Extra Trees classifier, exhibited higher predictive accuracy and achieved a better balance between precision and recall. Related oncology studies also report strong performance from ensemble learning and optimized classifiers for cancer prediction tasks, which supports our choice to evaluate tree-based ensembles in this work [27–29]. Although the model achieved the best overall performance, its precision indicates a non-trivial false-positive rate. In clinical practice, false positives could lead to additional testing in patients who would remain progression-free. The operating threshold is therefore a clinical choice. A lower threshold prioritizes recall and reduces missed high-risk patients, while a higher threshold improves precision and reduces unnecessary interventions. Prospective validation is needed before deployment as a decision-support tool. Given the relatively small sample size and high censoring rate, the difference in performance is likely due to limitations of the survival model. In small sample datasets, it appears tree-based classifier models may provide more generalizable predictions than survival-based models.
The SHAP-based interpretation confirms that the model leverages clinically meaningful features rather than spurious correlations. The prominence of immune checkpoint expression, MSI status, TMB, and tumor stage aligns with current understanding of colorectal cancer immunotherapy response. This interpretability supports the clinical relevance of the proposed framework and strengthens confidence in its use as a decision-support tool [30]. The development of a real-time web application further demonstrates the translational potential of this work, enabling real-time, patient-specific predictions through an intuitive interface. The web-based application demonstrates the potential to create clinician-facing tools that bridge computational modeling and clinical decision support, a significant advance for clinicians evaluating actionable treatment decisions. External validation on independent cohorts is also essential to confirm robustness and real-world applicability.
Despite the promising results of this study, the sample size limits the model’s generalizability, and the class imbalance also contributed to reduced sensitivity in detecting progression cases. In addition, the single-cohort design and the absence of external validation on independent real-world immunotherapy datasets. This is important for the microsatellite stable subgroup, where response rates to immune checkpoint blockade remain low and clinical need is high. Future work should focus on external cohort validation, cohort expansion, and richer biology where available, such as tumor microenvironment composition and other omics signals, alongside prospective evaluation of deployment workflows and therefore strengthen clinician trust in AI-based tools [31].
This work developed and validated different machine learning models for predicting PFS outcomes in colorectal cancer using integrated multi-omic features. The Extra Trees classifier model outperformed all other models, achieving the best predictive performance and an effective balance between sensitivity and specificity for clinical risk stratification. Key biological insights include the prognostic significance of KRAS mutations and the immunologically active phenotype of MSI-high tumors, characterized by elevated TMB and increased expression of immune checkpoints. Deploying the designed model via an accessible web application enhances clinical translation, providing an actionable tool for personalized treatment planning and surveillance. While the current performance in this study is promising, expanding the dataset, validating in independent cohorts, and incorporating advanced deep learning architectures will be essential to build more robust, generalizable, and clinically implementable prognostic tools for colorectal cancer immunotherapy.
Acknowledgement: The authors would like to acknowledge the support of Prince Sultan University for paying the Article Processing Charges of this publication. This work was funded by the Research, Development, and Innovation Authority (RDIA)—Kingdom of Saudi Arabia (Grant No. 13292-psu-2023-PSNU-R-3-1-EF-).
Funding Statement: This work was funded by the Research, Development, and Innovation Authority (RDIA)—Kingdom of Saudi Arabia (Grant No. 13292-psu-2023-PSNU-R-3-1-EF-).
Author Contributions: Conceptualization, Thomas Kidu and Harini Kethar; methodology, Thomas Kidu and Harini Kethar; software, Thomas Kidu and Haben Gebrekidan; validation, Thomas Kidu, Harini Kethar and Jawad Khan; formal analysis, Thomas Kidu and Haleem Farman; investigation, Thomas Kidu and Harini Kethar; data curation, Thomas Kidu, Ahmed Sedik and Harini Kethar; writing—original draft preparation, Thomas Kidu and Harini Kethar; writing—review and editing, Thomas Kidu, Harini Kethar and Jawad Khan; visualization, Thomas Kidu and Walid El-Shafai; supervision, Jawad Khan and Haleem Farman. All authors reviewed and approved the final version of the manuscript.
Availability of Data and Materials: The datasets analyzed in this study are publicly available from the cBioPortal for Cancer Genomics (https://www.cbioportal.org) under the TCGA Colorectal Adenocarcinoma (COADREAD) study. All genomic, transcriptomic, and clinical data used were obtained in compliance with open-access guidelines provided by The Cancer Genome Atlas (TCGA) consortium (https://www.cancer.gov/tcga).
Ethics Approval: Not applicable.
Conflicts of Interest: The authors have no conflicts of interest.
Abbreviations
The following abbreviations are used in this manuscript
| CRC | Colorectal Cancer |
| MSI | Microsatellite Instability |
| MSS | Microsatellite Stable |
| TMB | Tumor Mutation Burden |
| PFS | Progression-Free Survival |
| PD-1 | Programmed Cell Death Protein 1 |
| PD-L1 | Programmed Death-Ligand 1 |
| CTLA-4 | Cytotoxic T-Lymphocyte Associated Protein 4 |
| KRAS | Kirsten Rat Sarcoma Viral Oncogene Homolog |
| BRAF | B-Raf Proto-Oncogene |
| NRAS | Neuroblastoma RAS Viral Oncogene Homolog |
| RSF | Random Survival Forest |
| GBM | Gradient Boosting Machine |
| AUC | Area Under the Curve |
| XAI | Explainable Artificial Intelligence |
| TCGA | The Cancer Genome Atlas |
| COADREAD | Colon and Rectal Adenocarcinoma |
| UI | User Interface |
| ML | Machine Learning |
| AJCC | American Joint Committee on Cancer |
| ROC | Receiver Operating Characteristic |
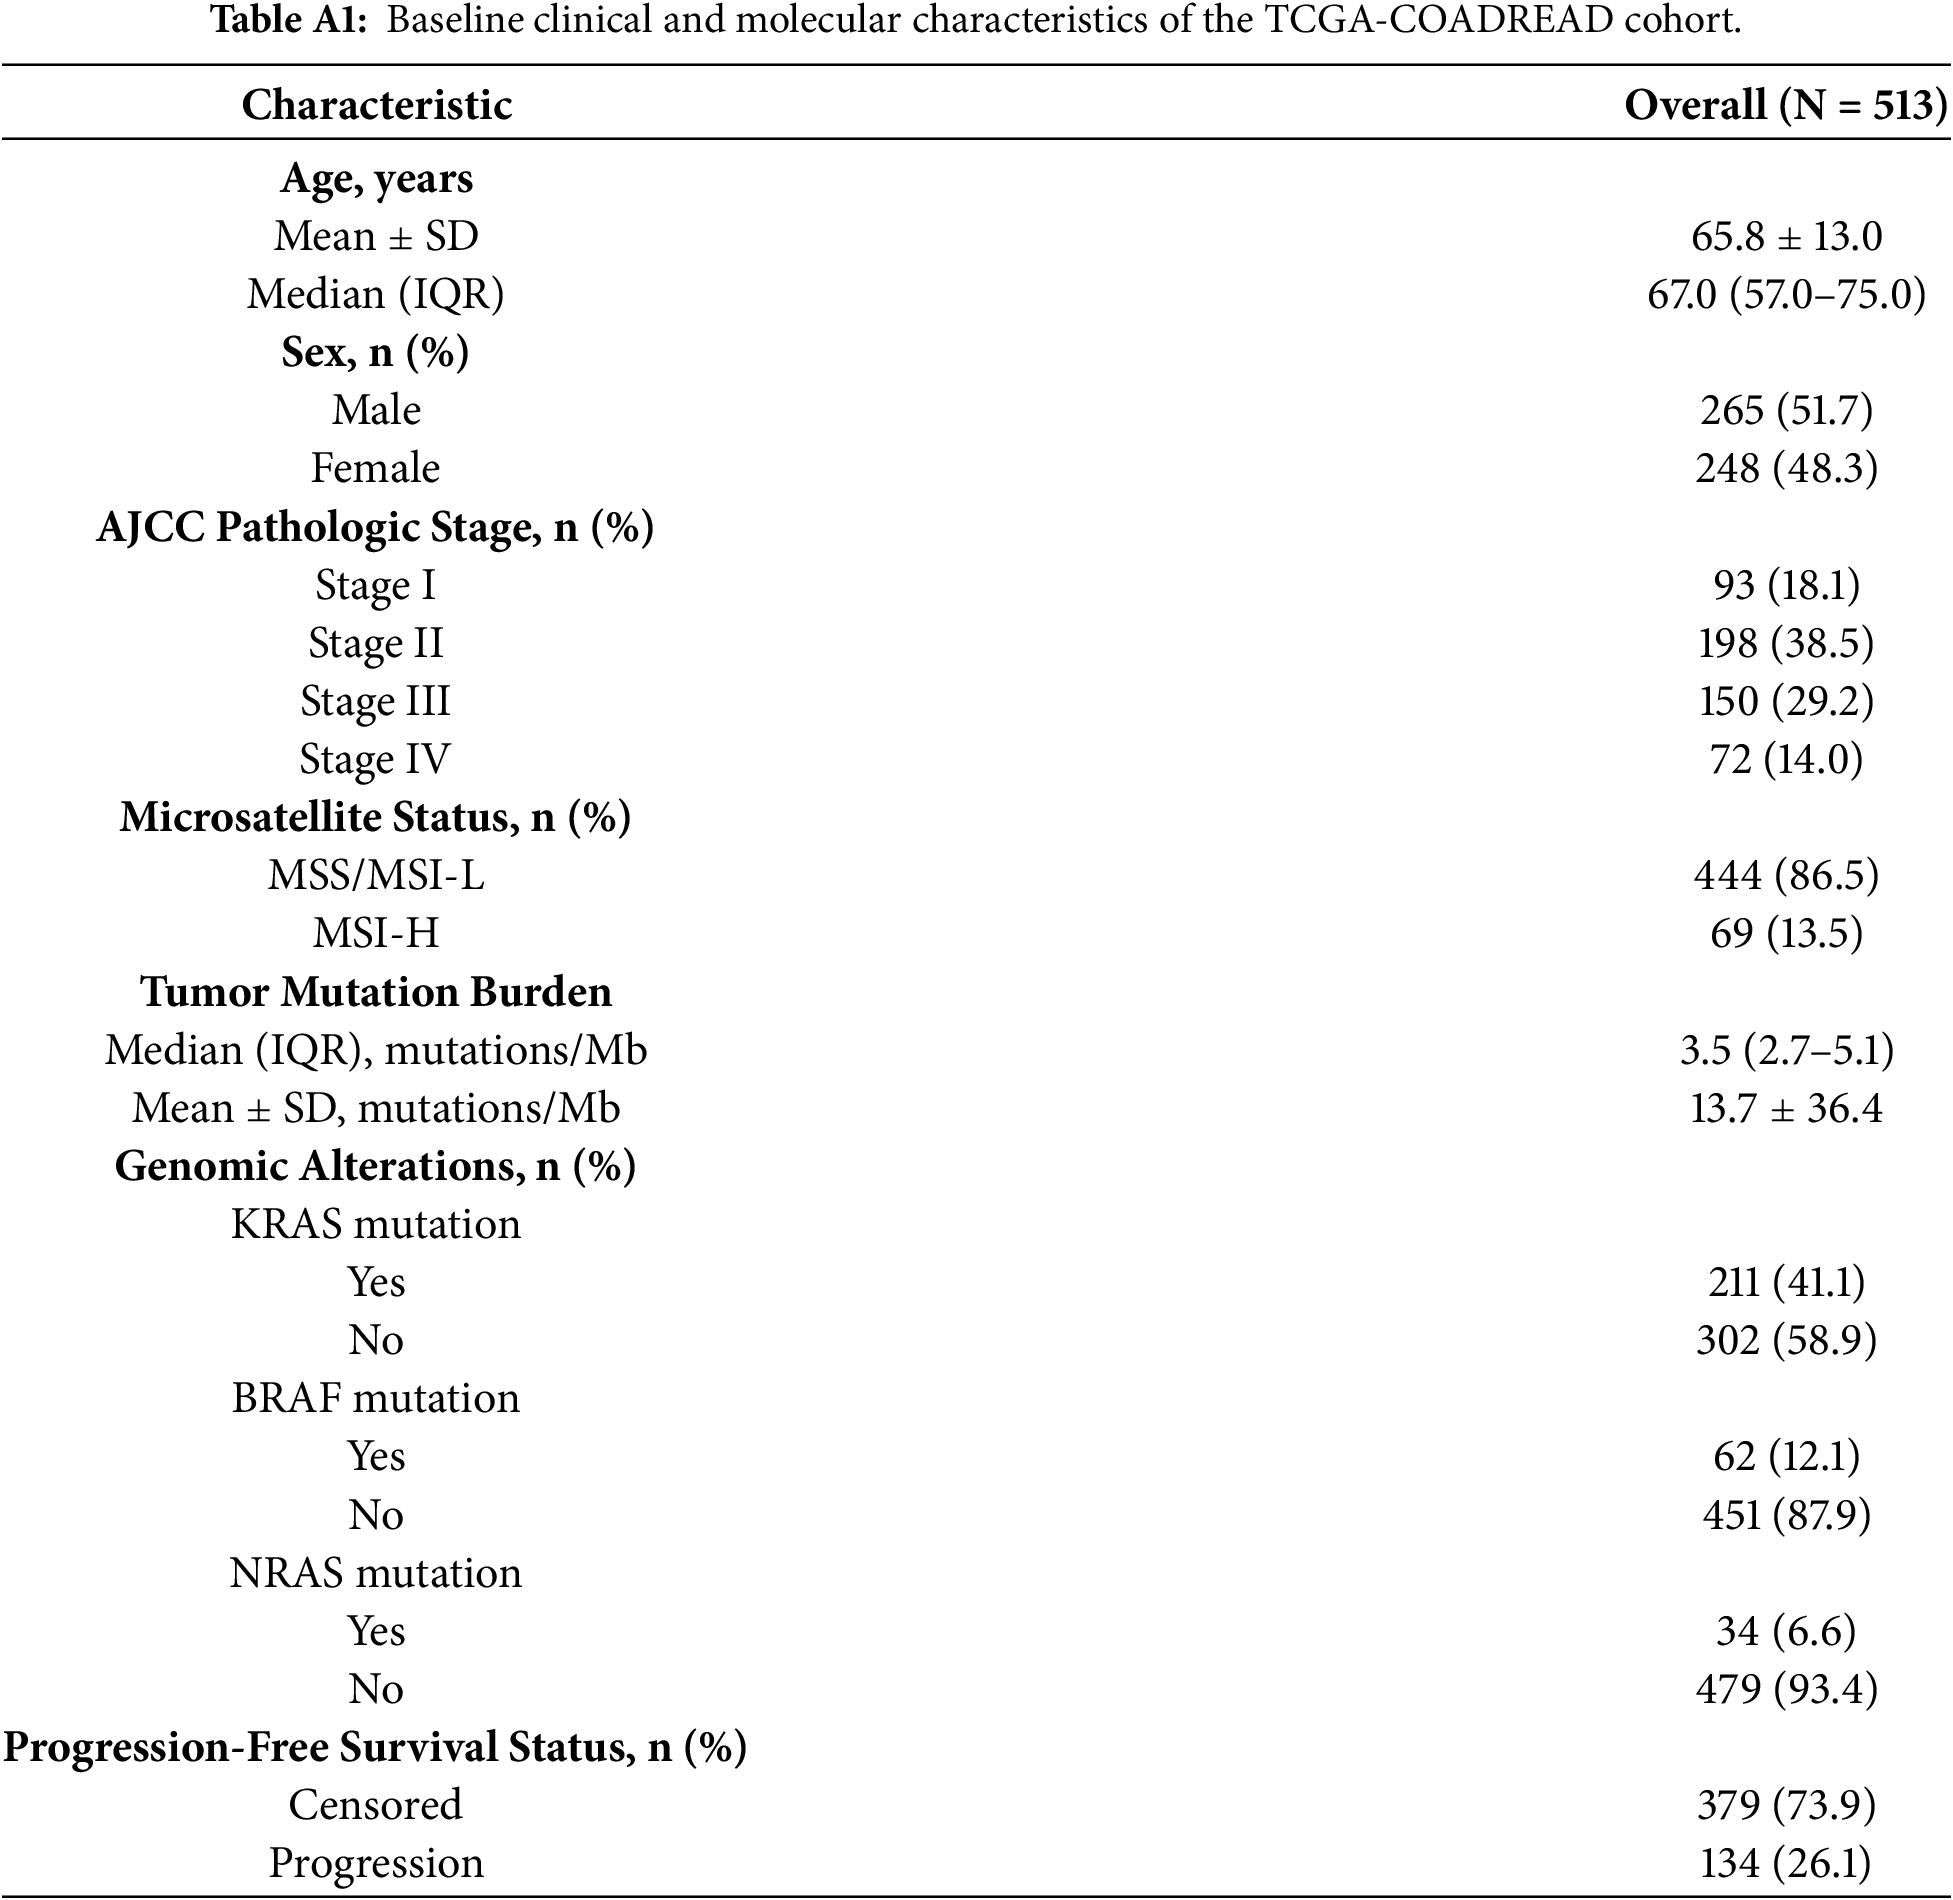
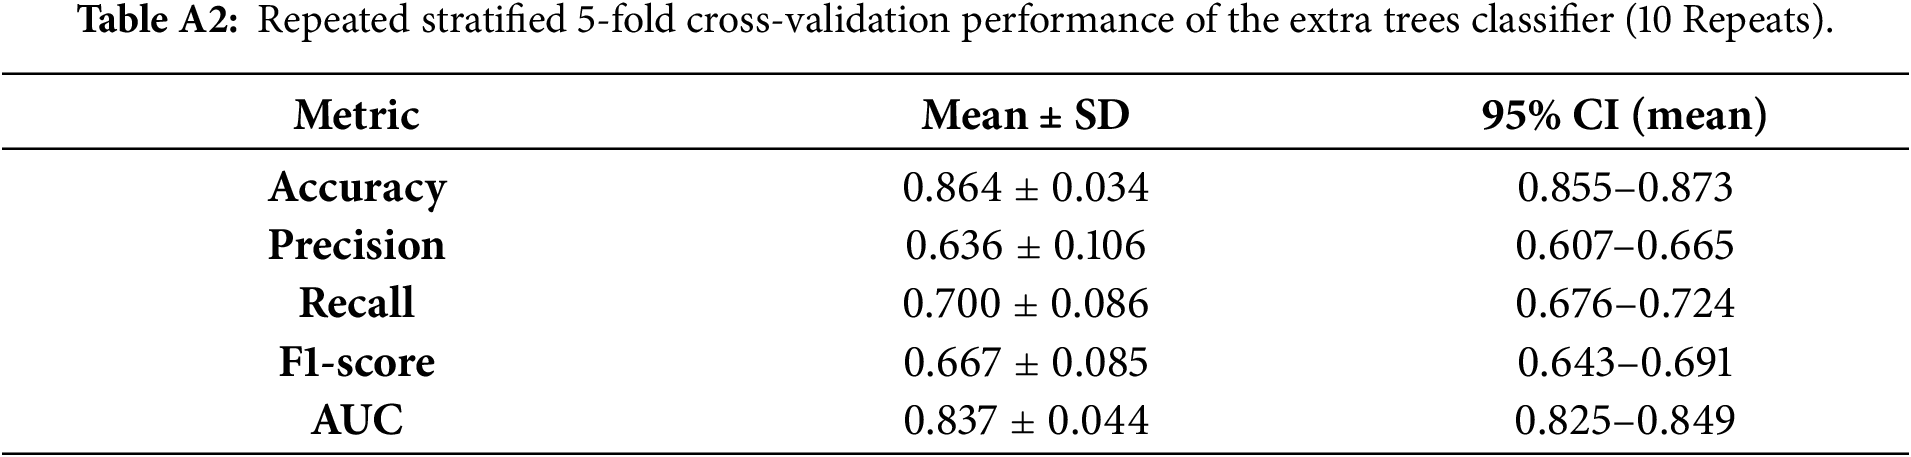
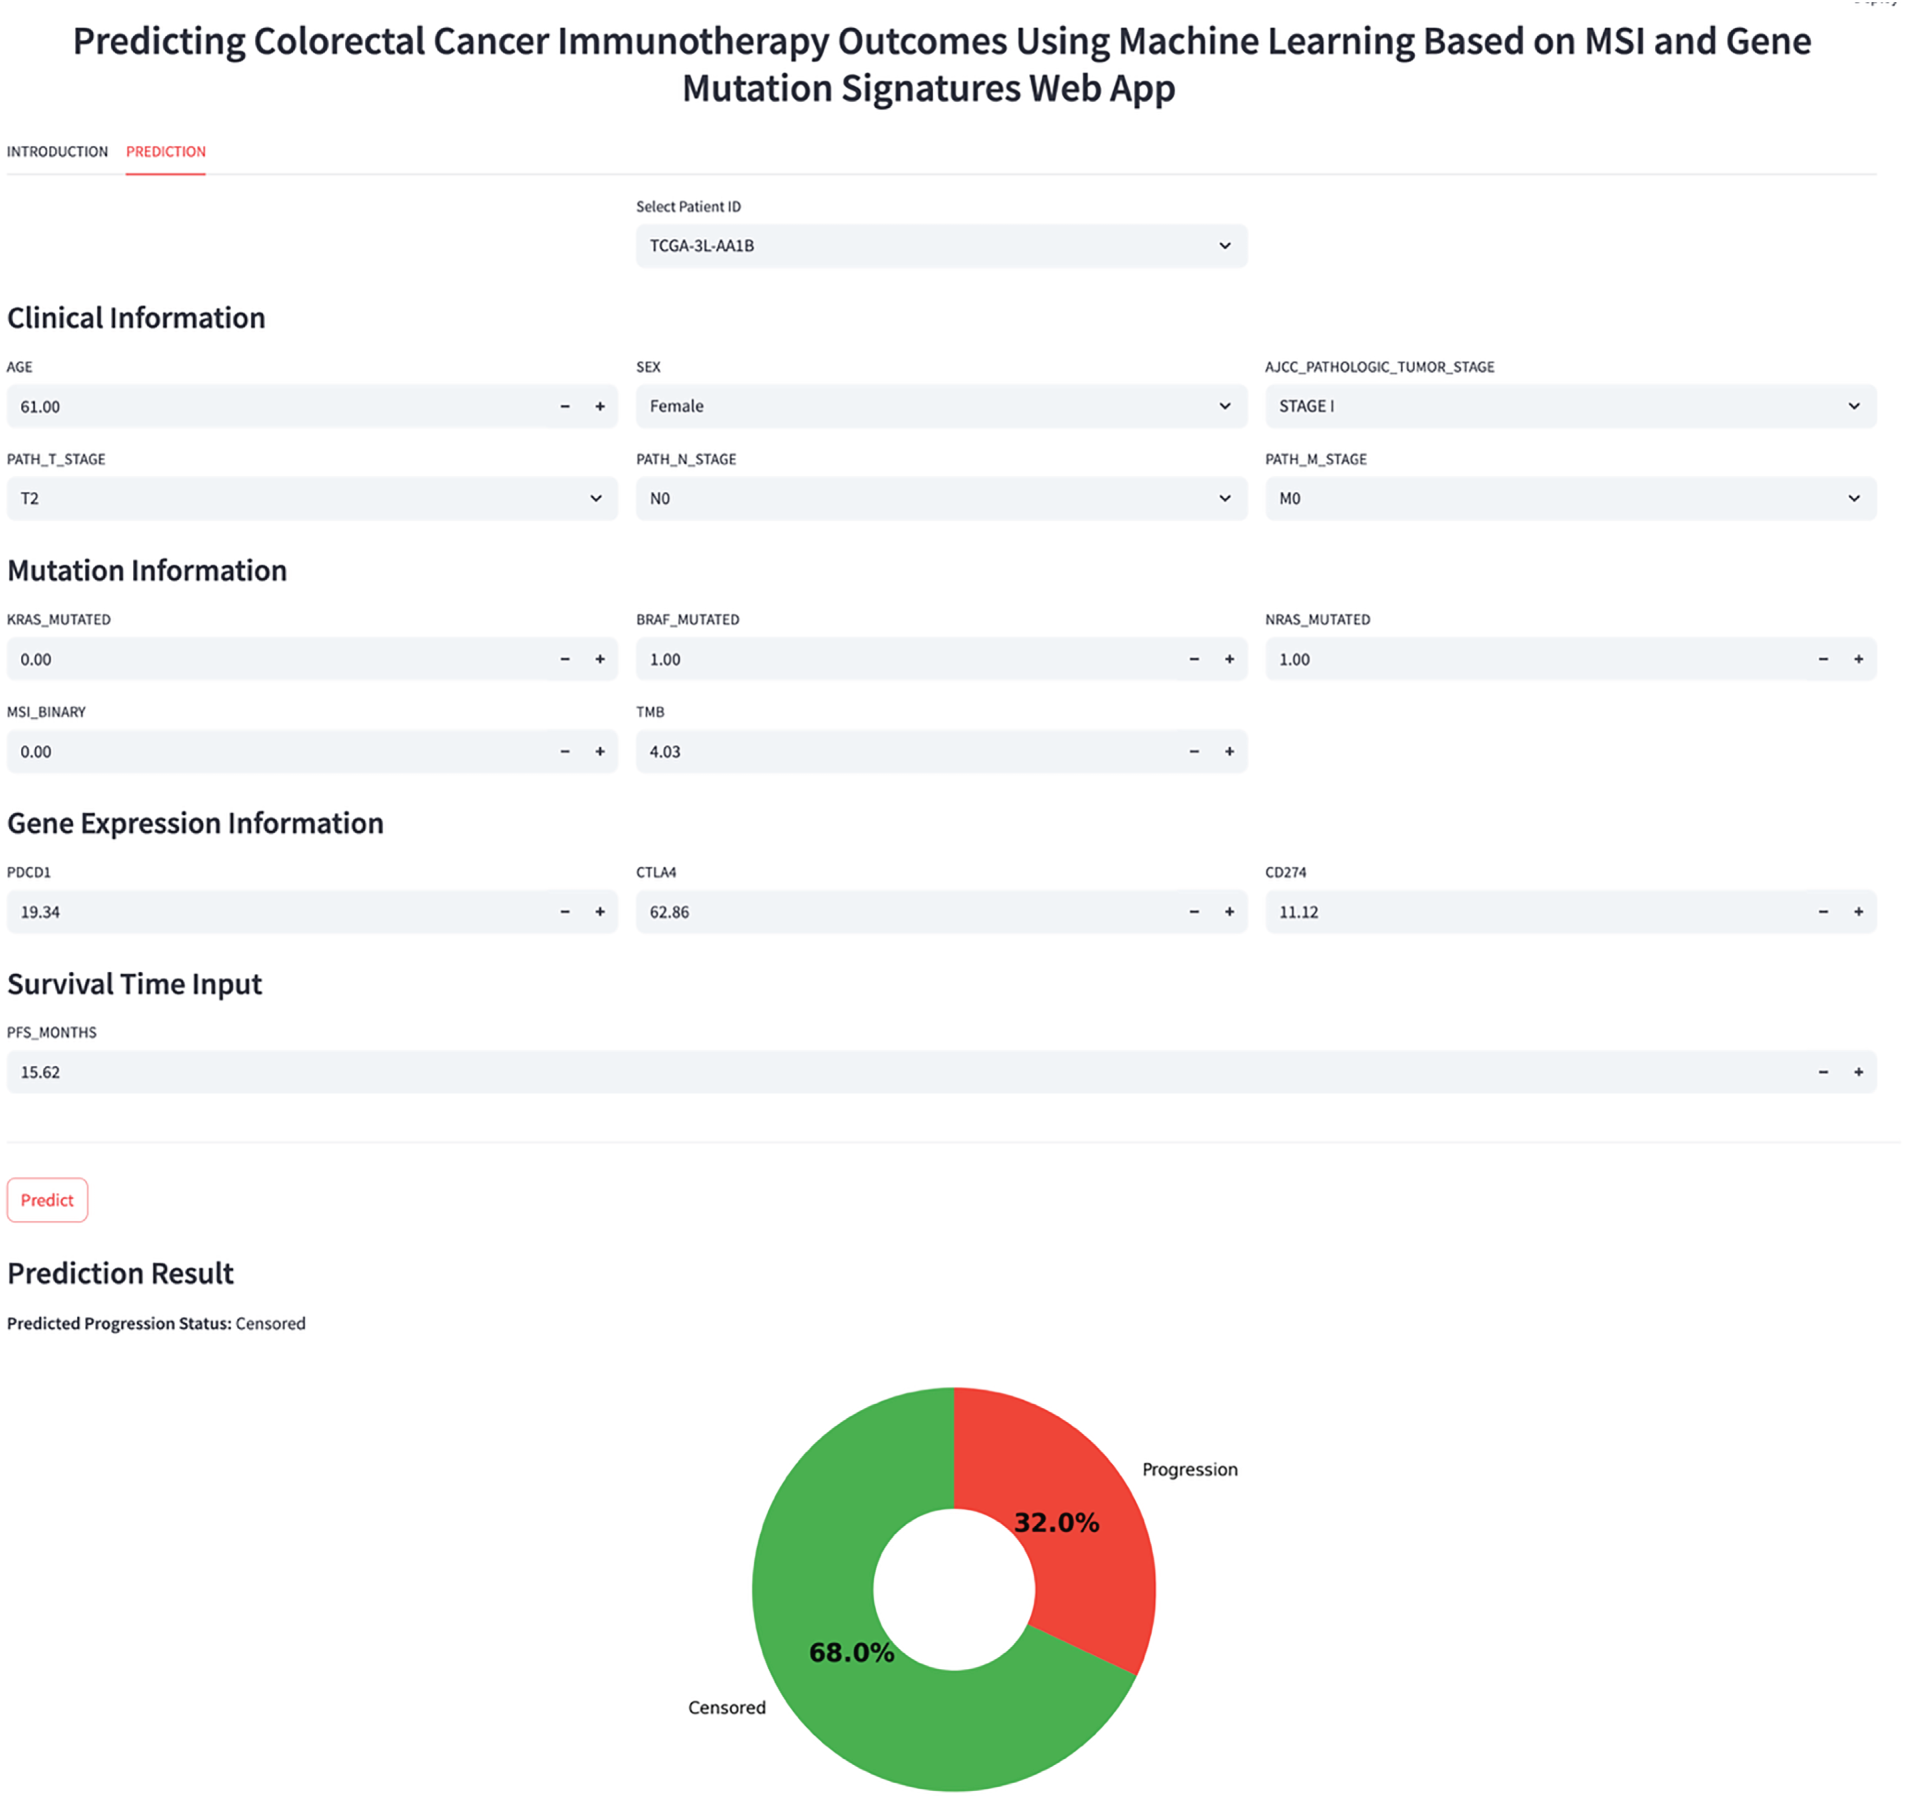
Figure A1: Interactive web application interface for real-time PFS prediction.
References
1. Sung H, Ferlay J, Siegel RL, Laversanne M, Soerjomataram I, Jemal A, et al. Global cancer statistics 2020: GLOBOCAN estimates of incidence and mortality worldwide for 36 cancers in 185 countries. CA Cancer J Clin. 2021;71(3):209–49. doi:10.3322/caac.21660. [Google Scholar] [PubMed] [CrossRef]
2. American Cancer Society. Cancer facts & figures 2017. Atlanta, GA,USA: American Cancer Society; 2017. [Google Scholar]
3. Patel SP, Kurzrock R. PD-L1 expression as a predictive biomarker in cancer immunotherapy. Mol Cancer Ther. 2015;14(4):847–56. doi:10.1158/1535-7163.MCT-14-0983. [Google Scholar] [PubMed] [CrossRef]
4. Goodman AM, Kato S, Bazhenova L, Patel SP, Frampton GM, Miller V, et al. Tumor mutational burden as an independent predictor of response to immunotherapy in diverse cancers. Mol Cancer Ther. 2017;16(11):2598–608. doi:10.1158/1535-7163.MCT-17-0386. [Google Scholar] [PubMed] [CrossRef]
5. Le DT, Uram JN, Wang H, Bartlett BR, Kemberling H, Eyring AD, et al. PD-1 blockade in tumors with mismatch-repair deficiency. N Engl J Med. 2015;372(26):2509–20. doi:10.1056/nejmoa1500596. [Google Scholar] [PubMed] [CrossRef]
6. André T, Shiu KK, Kim TW, Jensen BV, Jensen LH, Punt C, et al. Pembrolizumab in microsatellite-instability-high advanced colorectal cancer. N Engl J Med. 2020;383(23):2207–18. doi:10.1056/nejmoa2017699. [Google Scholar] [PubMed] [CrossRef]
7. Overman MJ, McDermott R, Leach JL, Lonardi S, Lenz HJ, Morse MA, et al. Nivolumab in patients with metastatic DNA mismatch repair-deficient or microsatellite instability-high colorectal cancer (CheckMate 142an open-label, multicentre, phase 2 study. Lancet Oncol. 2017;18(9):1182–91. doi:10.1016/S1470-2045(17)30422-9. [Google Scholar] [PubMed] [CrossRef]
8. Taieb J, Sinicrope FA, Pederson L, Lonardi S, Alberts SR, George TJ, et al. Different prognostic values of KRAS exon 2 submutations and BRAF V600E mutation in microsatellite stable (MSS) and unstable (MSI) stage III colon cancer: an ACCENT/IDEA pooled analysis of seven trials. Ann Oncol. 2023;34(11):1025–34. doi:10.1016/j.annonc.2023.08.006. [Google Scholar] [PubMed] [CrossRef]
9. Shu Y, Zheng S. The current status and prospect of immunotherapy in colorectal cancer. Clin Transl Oncol. 2024;26(1):39–51. doi:10.1007/s12094-023-03235-0. [Google Scholar] [PubMed] [CrossRef]
10. Nusrat M, Yaeger R. KRAS inhibition in metastatic colorectal cancer: an update. Curr Opin Pharmacol. 2023;68:102343. doi:10.1016/j.coph.2022.102343. [Google Scholar] [PubMed] [CrossRef]
11. Uniyal P, Kashyap VK, Behl T, Parashar D, Rawat R. KRAS mutations in cancer: understanding signaling pathways to immune regulation and the potential of immunotherapy. Cancers. 2025;17(5):785. doi:10.3390/cancers17050785. [Google Scholar] [PubMed] [CrossRef]
12. Crisafulli G. Mutational signatures in colorectal cancer: translational insights, clinical applications, and limitations. Cancers. 2024;16(17):2956. doi:10.3390/cancers16172956. [Google Scholar] [PubMed] [CrossRef]
13. Strickler JH, Hanks BA, Khasraw M. Tumor mutational burden as a predictor of immunotherapy response: is more always better? Clin Cancer Res. 2021;27(5):1236–41. doi:10.1158/1078-0432.CCR-20-3054. [Google Scholar] [PubMed] [CrossRef]
14. Samstein RM, Lee CH, Shoushtari AN, Hellmann MD, Shen R, Janjigian YY, et al. Tumor mutational load predicts survival after immunotherapy across multiple cancer types. Nat Genet. 2019;51(2):202–6. doi:10.1038/s41588-018-0312-8. [Google Scholar] [PubMed] [CrossRef]
15. Overman MJ, Lonardi S, Wong KYM, Lenz HJ, Gelsomino F, Aglietta M, et al. Durable clinical benefit with nivolumab plus ipilimumab in DNA mismatch repair-deficient/microsatellite instability-high metastatic colorectal cancer. J Clin Oncol. 2018;36(8):773–9. doi:10.1200/JCO.2017.76.9901. [Google Scholar] [PubMed] [CrossRef]
16. Guven DC, Kavgaci G, Erul E, Syed MP, Magge T, Saeed A, et al. The efficacy of immune checkpoint inhibitors in microsatellite stable colorectal cancer: a systematic review. Oncologist. 2024;29(5):e580–600. doi:10.1093/oncolo/oyae013. [Google Scholar] [PubMed] [CrossRef]
17. Diaz LA Jr, Shiu KK, Kim TW, Jensen BV, Jensen LH, Punt C, et al. Pembrolizumab versus chemotherapy for microsatellite instability-high or mismatch repair-deficient metastatic colorectal cancer (KEYNOTE-177final analysis of a randomised, open-label, phase 3 study. Lancet Oncol. 2022;23(5):659–70. doi:10.1016/S1470-2045(22)00197-8. [Google Scholar] [PubMed] [CrossRef]
18. cBioPortal for Cancer Genomics [Internet]. [cited 2026 Jan 1]. Available from: https://www.cbioportal.org. [Google Scholar]
19. Pardoll DM. The blockade of immune checkpoints in cancer immunotherapy. Nat Rev Cancer. 2012;12(4):252–64. doi:10.1038/nrc3239. [Google Scholar] [PubMed] [CrossRef]
20. Goel MK, Khanna P, Kishore J. Understanding survival analysis: kaplan-Meier estimate. Int J Ayurveda Res. 2010;1(4):274–8. doi:10.4103/0974-7788.76794. [Google Scholar] [PubMed] [CrossRef]
21. Ishwaran H, Kogalur UB, Blackstone EH, Lauer MS. Random survival forests. Ann Appl Stat. 2008;2(3):841–60. doi:10.1214/08-aoas169. [Google Scholar] [CrossRef]
22. Breiman L. Random forests. Mach Learn. 2001;45(1):5–32. doi:10.1023/A:1010933404324. [Google Scholar] [CrossRef]
23. Bulut MG, Unal S, Hammad MA, Plawiak P. Deep CNN-based detection of cardiac rhythm disorders using PPG signals from wearable devices. PLoS One. 2025;20(2):e0314154. doi:10.1371/journal.pone.0314154. [Google Scholar] [PubMed] [CrossRef]
24. Friedman JH. Greedy function approximation: a gradient boosting machine. Ann Stat. 2001;29(5):1189–232. doi:10.1214/aos/1013203451. [Google Scholar] [CrossRef]
25. Rahman H, Aoun NB, Bukht TFN, Ahmad S, Tadeusiewicz R, Plawiak P, et al. Automatic liver tumor segmentation of CT and MRI volumes using ensemble ResUNet-InceptionV4 model. Inf Sci. 2025;704:121966. doi:10.1016/j.ins.2025.121966. [Google Scholar] [CrossRef]
26. Hammad MA, ElAffendi M, Abd El-Latif AA. CardioECGNet: A novel deep learning architecture for accurate and automated ECG signal classification across diverse cardiac conditions. Biomed Signal Process Control. 2025;106:107720. doi:10.1016/j.bspc.2025.107720. [Google Scholar] [CrossRef]
27. Ahmed SE, Marey MM, Almustafa KM, Elsharkawy ZF. Breast cancer diagnosis using support vector machines optimized by whale optimization and dragonfly algorithms. IEEE Access. 2022;10:69688–99. doi:10.1109/ACCESS.2022.3186021. [Google Scholar] [CrossRef]
28. Malibari AA, Alshahrani R, Al-Wesabi FN, Ben Haj Hassine S, Alkhonaini MA, Hilal AM. Artificial intelligence based prostate cancer classification model using biomedical images. Comput Mater Contin. 2022;72(2):3799–813. doi:10.32604/cmc.2022.026131. [Google Scholar] [CrossRef]
29. Reshan MS, Amin S, Zeb MA, Sulaiman A, Alshahrani H, Azar AT, et al. Enhancing breast cancer detection and classification using advanced multi-model features and ensemble machine learning techniques. Life. 2023;13(10):2093. doi:10.3390/life13102093. [Google Scholar] [PubMed] [CrossRef]
30. Chen CS, Lin TH, Chung HY, Jian MJ, Chang CK, Perng CL, et al. Web-based explainable machine-learning tool for predicting five-year recurrence of colorectal cancer after curative resection: multicentre retrospective cohort study. Discov Oncol. 2025;16(1):2017. doi:10.1007/s12672-025-03840-1. [Google Scholar] [PubMed] [CrossRef]
31. Abas Mohamed Y, Ee Khoo B, Shahrimie Mohd Asaari M, Ezane Aziz M, Rahiman Ghazali F. Decoding the black box: explainable AI (XAI) for cancer diagnosis, prognosis, and treatment planning-a state-of-the art systematic review. Int J Med Inform. 2025;193:105689. doi:10.1016/j.ijmedinf.2024.105689. [Google Scholar] [PubMed] [CrossRef]
Cite This Article
 Copyright © 2026 The Author(s). Published by Tech Science Press.
This work is licensed under a Creative Commons Attribution 4.0 International License , which permits unrestricted use, distribution, and reproduction in any medium, provided the original work is properly cited.
 Downloads
 Citation Tools