
 Login
Login Register
 Submit a Paper
 Propose a Special lssue
 Open Access
ARTICLE

Machine Learning Knowledge Driven Nonlinear Autoregressive Exogenous Networks for Fractional Order Proteasome-Fibril Interaction Model in Parkinson’s Disease Dynamics
1 Graduate School of Engineering Science and Technology, National Yunlin University of Science and Technology, Yunlin, Taiwan
2 Department of Computer Science and Information Engineering, National Yunlin University of Science and Technology, Yunlin, Taiwan
* Corresponding Author: Muhammad Asif Zahoor Raja. Email:
(This article belongs to the Special Issue: Recent Developments on Computational Biology-II)
Computer Modeling in Engineering & Sciences 2026, 147(2), 28 https://doi.org/10.32604/cmes.2026.079390
Received 20 January 2026; Accepted 30 March 2026; Issue published 27 May 2026
 View Full Text
 Download PDF
Abstract
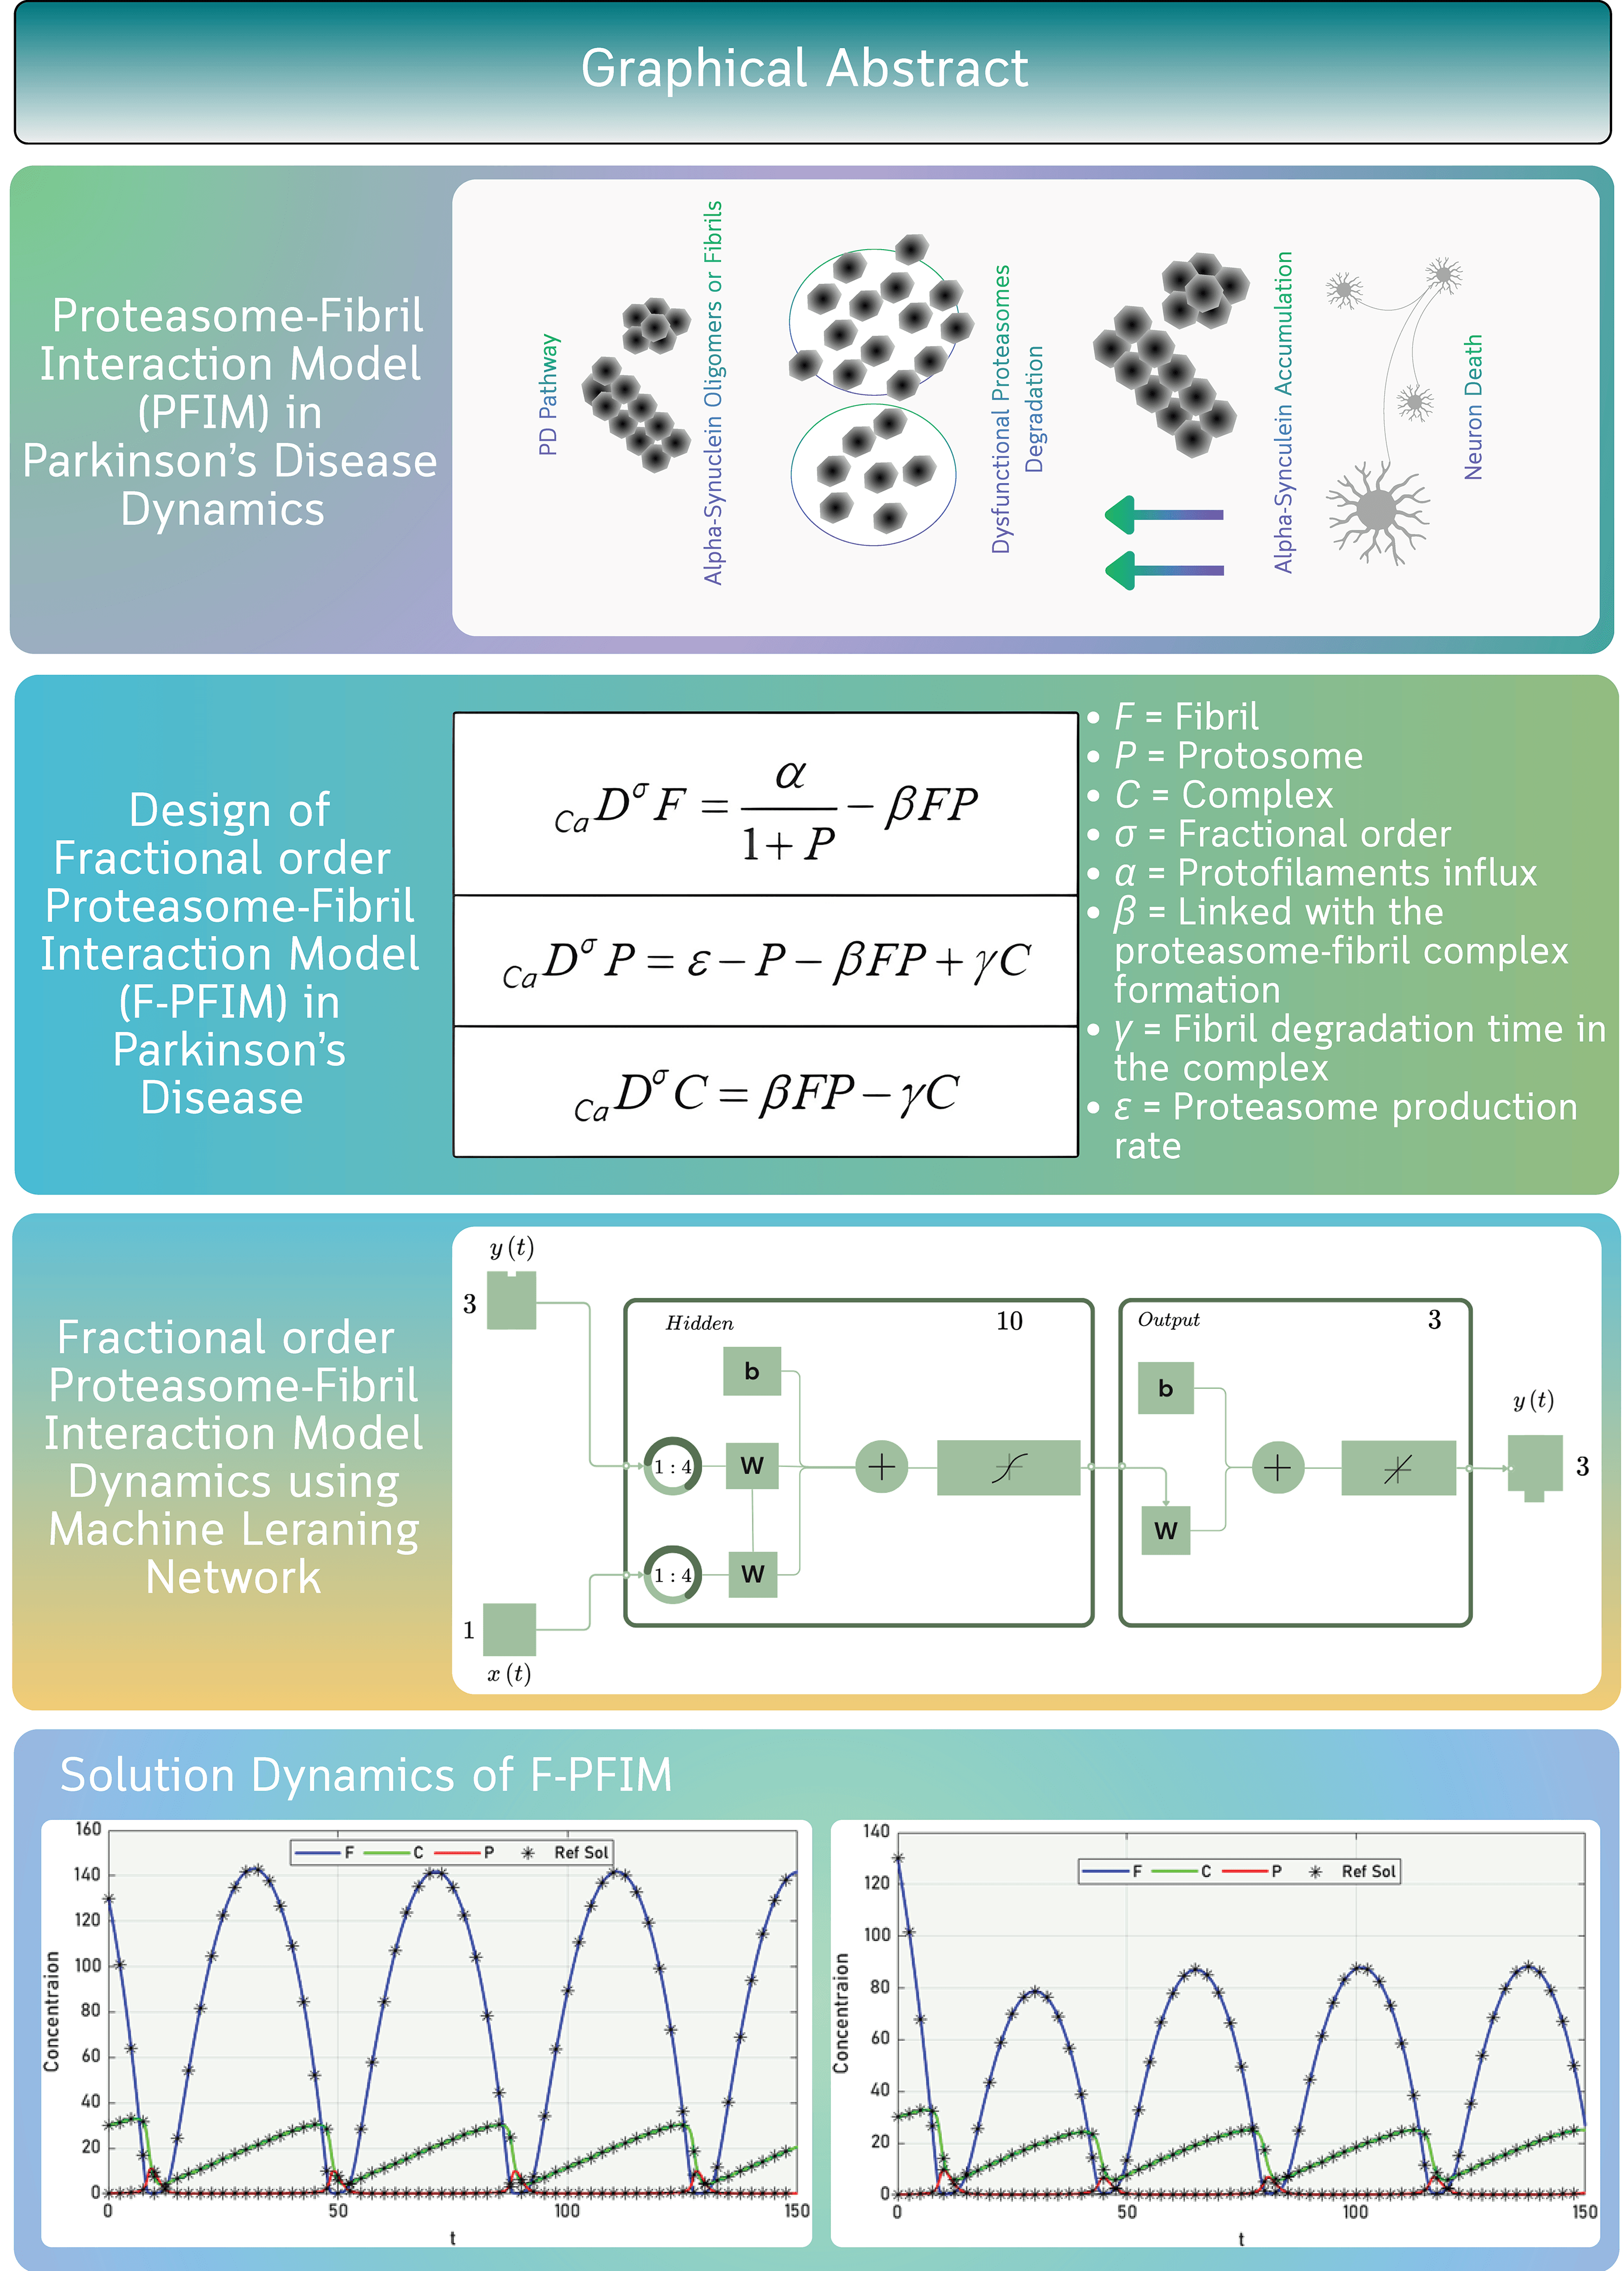
Parkinson’s disease (PD) is a complex neurodegenerative disease associated with the accumulation of α-synuclein, which is linked to the dysfunctional ubiquitin–proteasome system. Fractional calculus has emerged as a powerful tool for modeling complex disease dynamics due to its promising features that inherently capture memory and hereditary effects. This paper presents a fractional-order Proteasome-Fibril interaction model (F-PFIM) for the dynamics of PD, represented by three fractional differential classes, showing concentrations of fibrils (F), proteasomes (P), and proteasome fibril complex (C). The three classes of the F-PFIM collectively make a controlling system that works for the clearance of unnecessary protein from the cell to maintain cell hemostasis. When the P levels are very low, and F accumulation is high, the cell degradation machinery becomes overburdened. The prolonged instability of accumulated proteins leads to slow and progressive neurodegeneration associated with the onset of PD. Machine learning knowledge-driven nonlinear autoregressive exogenous networks backpropagated with Levenberg-Marquardt optimization (NAREN-LM) are presented to analyze the temporal evolution dynamics of F, C, and P in F-PFIM for different fractional orders varying from (0.89, 0.90, …, 1). The reference dataset is generated through the fractional Adams method (FAM) and is given to NAREN-LM in the form of training, testing, and validation sets. The performance of NAREN-LM is verified by analyzing the solution dynamics of F-PFIM in terms of mean square error-based convergence curves for training and testing, histogram plots, regression, and correlation results. Furthermore, the comparison of the NAREN-LM solution dynamics and corresponding absolute errors with those of the FAM endorses the accuracy of machine learning knowledge-driven predictive networks for F-PFIM.Graphic Abstract
Keywords
In this section, the study’s background is presented first, followed by its contributions and the paper’s organization.
Parkinson’s disease (PD) is a complex neurological disorder common among elderly people and is characterized by loss of neurons that leads to a number of motor and non-motor symptoms, such as tremors, stiffness, slow movement, constipation, depression, and irregular sleep patterns [1]. PD duration spans decades, resulting in a huge personal effect and great consequences for caregivers [2]. Thus, PD has a great socioeconomic burden, according to a comprehensive study regarding the global burden of the disease [3]. As reported in [4], the prevalence of PD has risen in the past two decades. The exact causes of PD are not yet fully understood; however, researchers have proposed various mathematical models to gain a better understanding of PD dynamics and, consequently, more effective treatment plans [5]. PD is associated with the accumulation of α-synuclein (αS), which is linked to the dysfunctional ubiquitin–proteasome system [6]. The hereditary and memory-driven features of FC may help better to capture the dynamics of Proteasome-Fibril interactions in PD. Therefore, this study aims to first develop a fractional-order Proteasome-Fibril interaction model (F-PFIM) and then present a machine learning knowledge-driven methodology for solution dynamics of the proposed F-PFIM under various fractional order variations.
The salient features of the current investigation are:
• A novel fractional-order Proteasome-Fibril interaction model is presented for the onset and progression dynamics of PD, represented by three fractional differential classes, showing concentrations of fibrils, proteasomes, and proteasome fibril complex.
• Machine learning knowledge-driven NAREN-LM, i.e., nonlinear autoregressive exogenous networks backpropagated with Levenberg-Marquardt optimization, are presented to analyze the proposed F-PFIM for different fractional orders.
• The accuracy of the NAREN-LM is verified by comparing the outcomes of the F-PFIM solution dynamics with the fractional Adams method.
• The convergence, stability, and reliability of the NAREN-LM are endorsed by the learning curves for training and testing, histogram plots, regression, and correlation analyses.
The remaining article is structured as follows: Section 2 presents the related work, providing the critical literature review. Section 3 presents the design of the fractional order Proteasome model. Section 4 provides details on the fractional Adam method and the machine-learning knowledge-driven NAREN-LM architecture. Section 5 discusses the results of the NAREN-LM for F-PFIM across different evaluation metrics. Section 6 provides concluding remarks and possible future directions for interested readers.
Fractional calculus (FC) is the generalization of traditional calculus to real order by allowing derivatives and integrals of non-integer (fractional) order [7,8]. Over recent years, FC has emerged as a powerful tool for modeling various processes in diversified fields [9–11] including physics [12], engineering [13,14], control systems [15], neuroscience [16,17], and biology [18] due to its promising features that inherently capture memory and hereditary effects. FC has been exploited to effectively model the biological processes and disease dynamics, such as monkeypox virus [19], hepatitis B transmission dynamics [20], measles infection [21], diabetes mellitus [22], and PD with therapeutic involvement [23].
Different mathematical models of the PD have been proposed. For instance, Qi et al. modeled dopamine metabolism [24], Braatz and Coleman developed an insulin resistance model [25], Baston et al. modeled the levodopa medication effect [26], Al-Tuwairqi and Badrah modeled the innate and adaptive immune responses to PD [27], Parakkal Unni et al. developed a gait freezing model in PD [28], Elfouly presented an improved PD model with Hopf bifurcation analysis [29], Yang et al. modeled the degradation dynamics αS in PD [30], and Kuznetsov and Kuznetsov modeled the αS transportation dynamics in PD [31]. PD is linked with αS aggregation, which is related to the dysfunctional ubiquitin–proteasome system. Sneppen et al. modeled the proteasome dynamics [6] and discovered that when αS accumulates in the form of oligomers and becomes a burden for the protein degradation machinery, which is responsible for the clearance of misfolded proteins. As per the authors’ exhaustive literature survey, most existing models describing the interaction between the proteasome degradation pathway and αS fibril formation have been developed through integer order systems. These classical models provide useful insights into protein aggregation and clearance dynamics, but they often fail to capture the memory effects and hereditary dynamics. The hereditary and memory-driven features of FC may help better to capture the dynamics of Proteasome-Fibril interactions in PD.
Generally, the machine learning-based neural architectures have demonstrated promising performance in disease dynamics [32,33], including PD diagnosis [34]. However, the nonlinear autoregressive exogenous networks (NAREN) have shown superior results over traditional machine learning algorithms and famous neural architectures. The superior performance of the NAREN over its counterparts motivated the authors to investigate the solution dynamics of F-PFIM using NAREN. The summary of the related work is provided in Table 1.

3 Fractional Proteasome-Fibril Interaction Model
In this section, the design of the F-PFIM for the onset and progression of PD is presented.
The integer-order proteasome model for the onset and progression dynamics of PD is described by three differential classes, which show concentrations of fibrils (F), proteasomes (P), and the proteasome fibril complex (C). F is characterized by the accumulation of misfolded and aggregated proteins in the cell, like the αS protein in the PD. When αS accumulates in the form of oligomers and F, it becomes a burden for the protein degradation machinery (PDM) in the cell. PDM is responsible for the clearance of misfolded proteins, and P is part of the PDM. When αS fibril binds with P of the PDM, immediately C is formed, which facilitates the exclusion of F from the cell. The governing mathematical relations of the model are presented in Eqs. (1)–(3), where t represents the changes in the concentration levels of F, P, and C [6]. The graphical description of the proteasome fibril workflow in terms of the normal pathway and PD pathway is given in Fig. 1.
where the variables involved in the proteasome model are defined as:

Figure 1: Proteasome workflow description in terms of the normal pathway and PD pathway.
This study aims to develop the fractional order Proteasome model by incorporating the concept of fractional derivatives into the integer model presented in (1)–(3). Fractional calculus allows us to compute the derivatives of real order (fractional order). Fractional derivatives are the generalization of the conventional integer derivatives and can be defined in different ways. Although in recent times, new definitions of fractional derivatives have been introduced [35–37], the commonly used definitions, including Grunwald-Letnikov (GL), Riemann-Liouville (RL), and Caputo (Ca), for the fractional order
Now, describe the fractional-order proteasome model, F-PFIM, by three fractional differential classes, as shown in Eqs. (7)–(9).
This section first presents the details of the fractional Adams method (FAM) used to generate synthetic data for the machine learning knowledge-driven NAREN-LM scheme to analyze the solution dynamics of the F-PFIM presented in Section 3. A fractional order differential equation (FDE) is generally defined as in Eq. (10).
The implementation of FAM to solve a general FDE given in Eq. (10) required three steps: summation, prediction, and correction. These three stages are mathematically expressed in Eqs. (11)–(13), respectively [39,40].
The NAREN-LM is developed in Matlab using ‘ntstool’ by considering the following specifications: layer size 10, log sigmoid activation function, input and feedback delay of 1:4, and Levenberg-Marquardt optimization algorithm for backpropagation of weights to optimize the NAREN. The dataset consists of the time-series solutions generated from the proposed fractional-order model, where the input features correspond to the delayed time-series states, and the target outputs represent the system variables at subsequent time steps. The dataset generated through FAM is given to NAREN-LM by arbitrarily splitting into train, test, and validation sets with a proportion of 80%, 10%, and 10%, respectively. The selection of the NAREN hyperparameters is based on preliminary experimentation and validation performance to achieve a balance between model accuracy and overfitting prevention. The block diagram of the NAREN is presented in Fig. 2.

Figure 2: NAREN architecture diagram.
This section presents the results of the NAREN-LM for the solution dynamics of F-PFIM in terms of various graphical illustrations for different fractional orders, i.e.,
To investigate the convergence of the NAREN-LM scheme for the solution dynamics of the F-PFIM, learning curves are plotted in terms of training, testing, and validation, and the results are presented in Figs. 3–5a for

Figure 3: Analysis of the NAREN-LM for F-PFIM with

Figure 4: Analysis of the NAREN-LM for F-PFIM with

Figure 5: Analysis of the NAREN-LM for F-PFIM with
The performance evaluation of the NAREN-LM is further conducted through histogram analyses, and the results are presented in Figs. 3–5b for
To get deeper insight into the performance of the NAREN-LM for the solution dynamics of F-PFIM, error correlation and input-error correlation analyses are conducted, defining the proportional trends, and the results are presented in Figs. 3–5c for
The hyperparameter conditions play a fundamental role in the performance of any machine learning algorithm. In this regard, the variation in the hyperparameters of the NAREN-LM over the epochs during the training process is demonstrated in Figs. 3–5e for
The time response for element 1 of the F-PFIM, i.e., F (Fibrils), is presented in Figs. 3–5f for
To further validate the performance of the NAREN-LM, time response graphs along with the corresponding absolute errors are plotted for all three elements of F-PFIM, i.e., F, C, and P, and are demonstrated in Fig. 6 for

Figure 6: Comparative analyses of NAREN-LM solution dynamics with FAM for

Figure 7: Comparative analyses of NAREN-LM solution dynamics with FAM for

Figure 8: Comparative analyses of NAREN-LM solution dynamics with FAM for
In order to have a clear understanding of the temporal evolutions of the F, C, and P, and how they relate to each other, results are demonstrated in Fig. 9 for

Figure 9: Temporal evolution analyses of F, C, and P for
6 Conclusions and Future Works
In this work, a novel fractional-order Proteasome Fibril Interaction model, F-PFIM, is presented for the onset and progression dynamics of PD, represented by three fractional differential classes, showing concentrations of Fibrils, Proteasomes, and Proteasome Fibril Complex (F, P, and C). Machine learning knowledge-driven nonlinear autoregressive exogenous networks backpropagated with Levenberg-Marquardt optimization, NAREN-LM, are presented to analyze the dynamics of the proposed F-PFIM for different fractional orders.
The NAREN-LM accurately modeled the temporal evolution dynamics of the F-PFIM. The three components (F, P, and C) of the F-PFIM collectively make a controlling system that works for the clearance of excess or unnecessary protein from the cell to maintain cell hemostasis. When the P levels are very low, and F accumulation is high, the cell degradation machinery becomes overburdened and is not able to fully clear the toxic aggregates of protein. For extended time periods, this instability of accumulated proteins and partial clearance leads to slow and progressive degeneration that may be associated with the onset of PD. As the process of aggregation is very slow, the PD progression is slow as well. Regarding the fractional dynamics of the F-PFIM, the peak concentration of F, C, and P consistently decreases as
The convergence and reliability of the NAREN-LM are verified by the learning curves for training and testing, histogram, and correlation analyses. Moreover, the comparative analyses of the NAREN-LM with the FAM outcomes validate the accuracy of the machine learning knowledge framework through consistent overlapping of the NAREN-LM and FAM outcomes, along with low values of corresponding absolute errors. The presented machine learning knowledge driven approach is a supervised learning scheme that requires labeled training data. Therefore, the accuracy of the NAREN-LM is dependent on the reliability of the numerical baseline algorithm that is used to generate training data.
Future studies would extend the application of a machine learning knowledge-driven framework to model the dynamics of other, more complex and complicated biological systems. Moreover, fractional dynamics would be explored in the modeling of other neurodegenerative diseases to get a better understanding of the complex neurodegenerative disorders.
Acknowledgement: None.
Funding Statement: The authors received no specific funding.
Author Contributions: Conceptualization, Roshana Mukhtar and Muhammad Asif Zahoor Raja; Writing—original draft, Roshana Mukhtar; Writing—review and edit, Muhammad Asif Zahoor Raja and Chuan-Yu Chang; Validation, Muhammad Asif Zahoor Raja; Visualization, Roshana Mukhtar; Formal analysis, Roshana Mukhtar; Supervision, Chuan-Yu Chang and Muhammad Asif Zahoor Raja; Project administration, Chuan-Yu Chang. All authors reviewed and approved the final version of the manuscript.
Availability of Data and Materials: The datasets generated during the current study are available from the corresponding author on reasonable request.
Ethics Approval: Not applicable.
Conflicts of Interest: The authors declare no conflicts of interest.
References
1. Bloem BR, Okun MS, Klein C. Parkinson’s disease. Lancet. 2021;397(10291):2284–303. doi:10.1016/S0140-6736(21)00218-X. [Google Scholar] [PubMed] [CrossRef]
2. Macchi ZA, Koljack CE, Miyasaki JM, Katz M, Galifianakis N, Prizer LP, et al. Patient and caregiver characteristics associated with caregiver burden in Parkinson’s disease: a palliative care approach. Ann Palliat Med. 2020;9(Suppl 1):S24–33. doi:10.21037/apm.2019.10.01. [Google Scholar] [PubMed] [CrossRef]
3. Dorsey ER, Elbaz A, Nichols E, Abbasi N, Abd-Allah F, Abdelalim A, et al. Global, regional, and national burden of Parkinson’s disease, 1990-2016: a systematic analysis for the Global Burden of Disease Study 2016. Lancet Neurol. 2018;17(11):939–53. doi:10.1136/bmj.l94. [Google Scholar] [PubMed] [CrossRef]
4. Dorsey ER, Sherer T, Okun MS, Bloem BR. The emerging evidence of the Parkinson pandemic. J Park Dis. 2018;8(s1):S3–8. doi:10.3233/jpd-181474. [Google Scholar] [PubMed] [CrossRef]
5. Sarbaz Y, Pourakbari H. A review of presented mathematical models in Parkinson’s disease: black- and gray-box models. Med Biol Eng Comput. 2016;54(6):855–68. doi:10.1007/s11517-015-1401-9. [Google Scholar] [PubMed] [CrossRef]
6. Sneppen K, Lizana L, Jensen MH, Pigolotti S, Otzen D. Modeling proteasome dynamics in Parkinson’s disease. Phys Biol. 2009;6(3):036005. doi:10.1088/1478-3975/6/3/036005. [Google Scholar] [PubMed] [CrossRef]
7. Machado JT, Kiryakova V, Mainardi F. Recent history of fractional calculus. Commun Nonlinear Sci Numer Simul. 2011;16(3):1140–53. doi:10.1016/j.cnsns.2010.05.027. [Google Scholar] [CrossRef]
8. Baleanu D, Diethelm K, Scalas E, Trujillo JJ. Fractional calculus: models and numerical methods. Singapore: World Scientific; 2011. doi:10.1142/8180. [Google Scholar] [CrossRef]
9. Kumar S, Kumar R, Cattani C, Samet B. Chaotic behaviour of fractional predator-prey dynamical system. Chaos Solitons Fractals. 2020;135(17):109811. doi:10.1016/j.chaos.2020.109811. [Google Scholar] [CrossRef]
10. Rayal A, Dogra P, Thabet STM, Kedim I, Vivas-Cortez M. A numerical study of the Caputo fractional nonlinear rössler attractor model via ultraspherical wavelets approach. Comput Model Eng Sci. 2025;143(2):1895–925. doi:10.32604/cmes.2025.060989. [Google Scholar] [CrossRef]
11. Wu F, Cattani C, Song W, Zio E. Fractional ARIMA with an improved cuckoo search optimization for the efficient Short-term power load forecasting. Alex Eng J. 2020;59(5):3111–8. doi:10.1016/j.aej.2020.06.049. [Google Scholar] [CrossRef]
12. Ciancio A, Ciancio V, D’Onofrio A, Flora BFF. A fractional model of complex permittivity of conductor media with relaxation: theory vs. experiments. Fractal Fract. 2022;6(7):390. doi:10.3390/fractalfract6070390. [Google Scholar] [CrossRef]
13. Ali MA, Chaudhary NI, Ali Khan T, Mao WL, Lin CC, Khan ZA, et al. Auxiliary model-based chameleon swarm optimization for robust parameter estimation of fractional order nonlinear Hammerstein systems. J Comput Nonlinear Dyn. 2025;20(9):091005. doi:10.1115/1.4068718. [Google Scholar] [CrossRef]
14. Singh H, Srivastava HM, Nieto JJ. Handbook of fractional calculus for engineering and science. Boca Raton, FL, USA: CRC Press; 2022. [Google Scholar]
15. Chaudhary NI, Raja MAZ, Khan ZA, Mehmood A, Shah SM. Design of fractional hierarchical gradient descent algorithm for parameter estimation of nonlinear control autoregressive systems. Chaos Solitons Fractals. 2022;157(3):111913. doi:10.1016/j.chaos.2022.111913. [Google Scholar] [CrossRef]
16. Alam MN, Rahman MA. Study of the parametric effect of the wave profiles of the time-space fractional soliton neuron model equation arising in the topic of neuroscience. Partial Differ Equ Appl Math. 2024;12(2):100985. doi:10.1016/j.padiff.2024.100985. [Google Scholar] [CrossRef]
17. Alam MN, Akash HS, Saha U, Hasan MS, Parvin MW, Tunç C. Bifurcation analysis and solitary wave analysis of the nonlinear fractional soliton neuron model. Iran J Sci. 2023;47(5):1797–808. doi:10.1007/s40995-023-01555-y. [Google Scholar] [CrossRef]
18. Amilo D, Sadri K, Hincal E, Hafez M. A hybrid machine learning and fractional-order dynamical framework for multi-scale prediction of breast cancer progression. Comput Model Eng Sci. 2025;145(2):2189–222. doi:10.32604/cmes.2025.070298. [Google Scholar] [CrossRef]
19. Ramaswamy R, Mani G, Kumar D, Ege O. Mathematical model of the monkeypox virus disease via fractional order derivative. Comput Model Eng Sci. 2025;143(2):1843–94. doi:10.32604/cmes.2025.063672. [Google Scholar] [CrossRef]
20. Guedri K, Zarin R, Makhdoum BM, Niyazi HA, Fadhl BM, Peter OJ. Fractional modeling of hepatitis B virus transmission via heterosexual and homosexual contacts and its disability burden. BMC Infect Dis. 2025;26(1):87. doi:10.1186/s12879-025-12117-5. [Google Scholar] [PubMed] [CrossRef]
21. Peter OJ, Fahrani ND, Fatmawati, Windarto, Chukwu CW. A fractional derivative modeling study for measles infection with double dose vaccination. Healthc Anal. 2023;4(1):100231. doi:10.1016/j.health.2023.100231. [Google Scholar] [CrossRef]
22. Yadav P, Jahan S, Shah K, Peter OJ, Abdeljawad T. Fractional-order modelling and analysis of diabetes mellitus: utilizing the Atangana-Baleanu Caputo (ABC) operator. Alex Eng J. 2023;81(10):200–9. doi:10.1016/j.aej.2023.09.006. [Google Scholar] [CrossRef]
23. Mukhtar R, Chang CY, Raja MAZ, Chaudhary NI, Ali Asif Raja MJ, Shu CM. Design of fractional innate immune response to nonlinear Parkinson’s disease model with therapeutic intervention: intelligent machine predictive exogenous networks. Chaos Solitons Fractals. 2025;191:115947. doi:10.1016/j.chaos.2024.115947. [Google Scholar] [CrossRef]
24. Qi Z, Miller GW, Voit EO. Mathematical models of dopamine metabolism in Parkinson’s disease. In: Systems biology of parkinson’s disease. New York, NY, USA: Springer; 2012. p. 151–71. doi:10.1007/978-1-4614-3411-5_8. [Google Scholar] [CrossRef]
25. Braatz EM, Coleman RA. A mathematical model of insulin resistance in Parkinson’s disease. Comput Biol Chem. 2015;56(1):84–97. doi:10.1016/j.compbiolchem.2015.04.003. [Google Scholar] [PubMed] [CrossRef]
26. Baston C, Contin M, Calandra Buonaura G, Cortelli P, Ursino M. A mathematical model of levodopa medication effect on basal ganglia in Parkinson’s disease: an application to the alternate finger tapping task. Front Hum Neurosci. 2016;10(174):280. doi:10.3389/fnhum.2016.00280. [Google Scholar] [PubMed] [CrossRef]
27. Al-Tuwairqi SM, Badrah AA. Modeling the dynamics of innate and adaptive immune response to Parkinson’s disease with immunotherapy. AIMS Math. 2023;8(1):1800–32. doi:10.3934/math.2023093. [Google Scholar] [CrossRef]
28. Parakkal Unni M, Menon PP, Wilson MR, Tsaneva-Atanasova K. Ankle push-off based mathematical model for freezing of gait in Parkinson’s disease. Front Bioeng Biotechnol. 2020;8:552635. doi:10.3389/fbioe.2020.552635. [Google Scholar] [PubMed] [CrossRef]
29. Elfouly MA. Improved mathematical models of Parkinson’s disease with Hopf bifurcation and Huntington’s disease with chaos. Acta Biotheor. 2024;72(3):11. doi:10.1007/s10441-024-09485-x. [Google Scholar] [PubMed] [CrossRef]
30. Yang B, Yang Z, Hao L. Dynamics of a model for the degradation mechanism of aggregated α-synuclein in Parkinson’s disease. Front Comput Neurosci. 2023;17:1068150. doi:10.3389/fncom.2023.1068150. [Google Scholar] [PubMed] [CrossRef]
31. Kuznetsov IA, Kuznetsov AV. Mathematical models of α-synuclein transport in axons. Comput Meth Biomech Biomed Eng. 2016;19(5):515–26. doi:10.1080/10255842.2015.1043628. [Google Scholar] [PubMed] [CrossRef]
32. Zarin R, Guedri K, Makhdoum BM, Niyazi HA, Fadhl BM, El-Wahed Khalifa HA. Advanced ANN-LMB modeling of hepatitis B transmission across sexual networks and its disability burden. Sci Rep. 2025;15(1):44325. doi:10.1038/s41598-025-31252-2. [Google Scholar] [PubMed] [CrossRef]
33. Zarin R, Guedri K, Makhdoum BM, Niyazi HA, Khalifa HAE. Nonlinear modeling of cerebral malaria transmission with neuro-disability via ANN-LMB enhanced SITRM model. J Appl Math Comput. 2025;71(6):9191–224. doi:10.1007/s12190-025-02615-9. [Google Scholar] [CrossRef]
34. Ibrahim AM, Abed Mohammed M. A comprehensive review on advancements in artificial intelligence approaches and future perspectives for early diagnosis of Parkinson’s disease. IJMSCS. 2024;1:173–82. doi:10.59543/ijmscs.v2i.8915. [Google Scholar] [CrossRef]
35. Caputo M, Fabrizio M. A new definition of fractional derivative without singular kernel. Prog Fract Differ Appl. 2015;1(2):73–85. doi:10.18576/pfda/090405. [Google Scholar] [CrossRef]
36. Zheng Z, Zhao W, Dai H. A new definition of fractional derivative. Int J Non Linear Mech. 2019;108(2):1–6. doi:10.1016/j.ijnonlinmec.2018.10.001. [Google Scholar] [CrossRef]
37. Gao W, Ghanbari B, Baskonus HM. New numerical simulations for some real world problems with Atangana-Baleanu fractional derivative. Chaos Solitons Fractals. 2019;128(834):34–43. doi:10.1016/j.chaos.2019.07.037. [Google Scholar] [CrossRef]
38. Li C, Qian D, Chen Y. On Riemann-Liouville and Caputo derivatives. Discrete Dyn Nat Soc. 2011;2011(1):562494. doi:10.1155/2011/562494. [Google Scholar] [CrossRef]
39. Garrappa R. On linear stability of predictor-corrector algorithms for fractional differential equations. Int J Comput Math. 2010;87(10):2281–90. doi:10.1080/00207160802624331. [Google Scholar] [CrossRef]
40. Garrappa R. Numerical solution of fractional differential equations: a survey and a software tutorial. Mathematics. 2018;6(2):16. doi:10.3390/math6020016. [Google Scholar] [CrossRef]
Cite This Article
 Copyright © 2026 The Author(s). Published by Tech Science Press.
This work is licensed under a Creative Commons Attribution 4.0 International License , which permits unrestricted use, distribution, and reproduction in any medium, provided the original work is properly cited.
 Downloads
 Citation Tools
