
 Submit a Paper
 Propose a Special lssue
 Open Access
ARTICLE
Regulation of RNA methylation and immune infiltration patterns by m5C regulators in head and neck squamous cell carcinoma
1 Guanghua School of Stomatology, Hospital of Stomatology, Guangdong Province Key Laboratory of Stomatology, Sun Yat-sen University, Guangzhou, 510095, China
2 Department of Oral and Maxillofacial Surgery, Sun Yat-sen Memorial Hospital of Sun Yat-sen University, Guangzhou, 510010, China
3 Department of Orthopedics, The Second Xiangya Hospital, Central South University, Changsha, 410000, China
4 Department of Stomatology, Affiliated Hospital of Hangzhou Normal University, Hangzhou, 310015, China
5 Department of Stomatology, Shunde Hospital, Southern Medical University (The First People’s Hospital of Shunde), Foshan, 528308, China
6 Hospital of Stomatology, The First Affiliated Hospital of Jinan University, Guangzhou, 510632, China
7 Department of Stomatology, Nanfang Hospital, Southern Medical University, Guangzhou, 510515, China
8 Department of Endodontics, Stomatological Hospital, Southern Medical University, Guangzhou, 510280, China
* Corresponding Authors: RONGSHENG ZENG. Email: ; ZIJING HUANG. Email:
# These authors contributed equally to this work
(This article belongs to the Special Issue: Frontiers in cancer: tumor microenvironment)
BIOCELL 2023, 47(12), 2641-2660. https://doi.org/10.32604/biocell.2023.043291
Received 27 June 2023; Accepted 06 October 2023; Issue published 27 December 2023
 View Full Text
 Download PDF
Abstract
Background: 5-Methylcytosine (m5C) methylation contributes to the development and progression of various malignant tumors. This study aimed to explore the potential role of m5C methylation regulators (m5CMRs) in head and neck squamous cell carcinoma (HNSCC). Methods: The transcription data of HNSCC samples were obtained from The Cancer Genome Atlas (TCGA) and the Gene Expression Omnibus (GEO) databases. Subsequently, the m5C patterns in HNSCC were evaluated based on 14 m5CMRs. Then, the m5Cscore was developed to quantify m5C patterns by using principal component analysis (PCA) algorithms. Two single-cell RNA sequencing datasets and various methods were employed to assess the prognostic value and sensitivity to immunotherapy. Finally, key prognostic m5CMRs were identified using univariate COX regression analysis, and their clinical significance was validated based on the Human Protein Atlas (HPA) database and by using immunohistochemistry. Results: Two distinct m5C clusters were identified. m5C cluster A is characterized by an immune-activated microenvironment and is associated with a favorable prognosis. Notable differences were observed in prognosis, immune infiltration, and immunotherapy response between the high- and low-m5Cscore groups. Patients in the high-m5Cscore group exhibited high TMB, which is correlated with poor prognosis. The m5Cscore of epithelial cells in HNSCC was higher than that in other cells. Key prognostic m5CMRs, including NSUN2, DNMT3B, ALKBH1, and Y-Box Binding Protein 1 (YBX1), were associated with poor prognosis. Conclusion: Our research indicates that in head and neck squamous cell carcinoma, the m5C modification profoundly affects the TME’s diversity and complexity, influencing prognosis and the success of immunotherapy. Targeting m5C regulatory elements may be a new method for enhancing the efficacy of immunotherapy in HNSCC.Keywords
Head and neck squamous cell carcinoma (HNSCC) are a common malignant tumor that arises from squamous epithelial cells in the mouth, oropharynx, larynx, and hypopharynx (Johnson et al., 2020; Sung et al., 2021). It is the sixth most prevalent malignant tumor, accounting for over 830,000 new cases and approximately 450,000 deaths worldwide every year, among which 225,000 new cases per year were recorded in China alone (Xia et al., 2022; Yang et al., 2023). Smoking, alcohol consumption, chewing betel nut, and high-risk HPV infection are the primary carcinogenic factors of HNSCC (Lechner et al., 2022; Lee et al., 2023; Nam et al., 2022). Due to the hidden onset site, lack of early-stage symptoms, and difficulty in detection, palpation, or examination, patients with HNSCC are often diagnosed in the late stage with a poor prognosis. Surgical resection is usually the first choice for treatment, followed by adjuvant radiotherapy or chemotherapy, depending on the clinical and pathological staging of the tumor (Amaral et al., 2022). Despite significant progress in the prevention, early detection, diagnosis, and multimodal combination therapy of various tumors in recent years, the overall prognosis of patients with HNSCC remains poor, and the five-year overall survival (OS) rate is still less than 60% (Solomon et al., 2018). Therefore, investigating the potential molecular mechanisms underlying the occurrence and malignant progression of HNSCC can provide new ideas and strategies for clinical treatment and is of great significance for improving the OS of patients.
The epigenetic modification, 5-methylcytosine (m5C), is commonly found in eukaryotes, specifically in the untranslated regions of mRNA transcripts (Balachander et al., 2022). The formation of m5C is catalyzed by RNA m5C methylation enzymes such as NOL1/NOP2/sun (NSUN) 1–7 and DNA methyltransferase analogues DNMT (DNMT1, DNMT2, DNMT3A, and DNMT3B). Tet methylcytosine dioxygenase 2 (TET2) is the key enzyme that catalyzes the removal of RNA m5C. This modification is crucial to biological processes in both eukaryotes and prokaryotes and is often linked to various diseases. For instance, the imbalance in m5C regulatory protein expression is notably associated with cardiovascular disease, demonstrating the vital role of these proteins in biological and cellular functions (Balachander et al., 2022). Additionally, RNA m5C methylation modification contributes to the development and progression of many tumors, including bladder cancer, liver cancer, colorectal cancer, and glioma (Chen et al., 2019; Liang et al., 2022; Wang et al., 2020). In lung squamous cell carcinoma, the regulatory factors NSUN3 and NSUN4 of m5C methylation are significantly overexpressed compared with healthy lung tissue, and they are associated with poor prognosis (Pan et al., 2021). Furthermore, a recent study revealed that the interplay between NSUN2 expression and T cell activation influences the survival rate in patients with HNSCC, suggesting that NSUN2 is a potential marker for immune checkpoint blockade and a therapeutic target (Saloura et al., 2018). The expression level of m5C regulators is associated with the tumor immune microenvironment (TME). A bioinformatic analysis revealed that the elevated expression levels of m5C regulators are correlated with decreased immune activity in tumor-infiltrating lymphocytes (TILs), such as CD8 T cells, dendritic cells (DCs), and natural killer (NK) cells in oral squamous cell carcinoma (Gao et al., 2021). However, the influence of m5C methylation regulators (m5CMRs) in determining the heterogeneity of the TME and managing HNSCC immune cell infiltration remains uncertain.
This study involves a comprehensive analysis of m5CMRs by summarizing and screening 14 genes from previous literature (Song et al., 2022). Then, unsupervised clustering analysis was employed to identify molecular subtypes and explore the m5C methylation regulation pattern and immune infiltration in HNSCC. The findings were validated using the single-cell sequencing data for HNSCC from the GEO database. Furthermore, four key prognostic genes of m5C methylation, namely NSUN2, DNMT3B, ALKBH1, and YBX1, were identified and verified using the HPA database and via immunohistochemical staining of clinical tissue samples. Our study provides novel insights into the prognostic biomarkers and therapeutic targets for HNSCC.
In this study, four HNSCC datasets (TCGA-HNSCC, GSE41613, GSE42743, and GSE65858) were included. The TCGA-HNSCC cohort contained 502 samples from patients with HNSCC and 44 normal tissues. The GSE41613 cohort consisted of 97 HPV-negative patients with HNSCC (Zhao et al., 2022). The GSE42743 included 74 HNSCC samples and 29 normal tissues (Lohavanichbutr et al., 2013). The GSE65858 cohort contained 270 patients with HNSCC, including 196 HPV-negative patients with HNSCC, 73 HPV-positive patients with HNSCC, and 1 HNSCC patient with unknown HPV status (Wichmann et al., 2015). The transcription data and clinical data of the four datasets above were obtained for further analysis in the present study. The FPKM values of the transcription expression profile data of HNSCC were obtained from the TCGA database and then converted into TPM values for downstream analysis. The confounding effects caused by differences in data collection were minimized across multiple databases by using the ComBat algorithm to integrate transcription data from four distinct sources pertaining to HNSCC.
Unsupervised clustering for m5CMRs
In the present study, 14 m5CMRs from previous publications were identified and summarized, including nine m5C methyltransferases (NSUN2, NSUN3, NSUN4, NSUN5, NSUN6, NSUN7, NOP2, DNMT3A, and DNMT3B), four m5C demethylases (TET1, TET2, TET3, and ALKBH1), and one m5C methylation binding protein (YBX1). Then the basic characteristics of these genes, such as the expression differences between tumor tissue and normal tissue, frequency of CNV and SNP, and positions on chromosomes, were investigated. The expression pattern of m5CMRs was explored using the ConsensusClusterPlus package to cluster the expression profiles of the 14 m5CMRs. The survival package and single-sample Gene Set Enrichment Analysis (ssGSEA) algorithm were applied to investigate the functional characteristics of the molecular subtypes. The difference in immune infiltration was validated using gene set variation analysis (GSVA), which is a powerful gene set enrichment method that evaluates whether different pathways are enriched between different samples by converting the expression matrix of genes into the expression matrix of gene sets.
For a good understanding of the role of m5C in HNSCC, an m5C signature was constructed to quantify the degree of m5C methylation in patients with HNSCC. First, the limma package was used to identify differentially expressed genes (DEGs) between the m5CMR modification patterns based on threshold values of FDR < 0.05 and |log2FC| > 1. Then, the ConsensusClusterPlus package was applied to perform 1,000 unsupervised cluster analyses based on the above DEG expression profile data. Next, the limma package was employed to identify the DEGs between the consensus clusters. Prognostic genes were pinpointed using univariate Cox regression analysis. Lastly, a m5C signature was constructed via PCA, and the signature score was calculated based on the principal components 1 and 2. The calculation formula is as follows: m5Cscore = PC1 + PC2. The maxstat package was utilized to determine the optimal threshold to classify the patients with HNSCC into the high- and low-m5Cscore group. Patients with high m5Cscores were considered to have elevated levels of m5C methylation, whereas those with low m5Cscores were considered to have decreased levels.
Tumor mutation burden (TMB) is deemed to be tightly associated with the prognosis of malignant tumors. In this study, the somatic mutation data of HNSCC were retrieved from the TCGA database, and the TMB score was computed for each patient by using the maftools package. Subsequently, the relationship between TMB and the prognosis of HNSCC was assessed via survival analysis. The correlation between TMB and m5Cscore was also analyzed using correlation analysis.
Immunotherapy response prediction
The correlation between m5C methylation levels and the response to immunotherapy was investigated using the Cancer Immunograph Atlas (TCIA) database to examine the relationship between m5C score and treatment results. TCIA is a database developed upon the TCGA database, and it provides immune data analysis for 20 types of cancer (Charoentong et al., 2017).
Single-cell RNA sequencing analysis for m5Cscore
Two single cell RNA sequencing data (GSE195832 and GSE123813) were applied in this study. The GSE195832 dataset includes eight tumor tissue samples from four HNSCC patients; four samples were biopsy samples collected prior to the administration of the anti-PD-1 monoclonal antibody Navulizumab, while the four remaining samples were obtained after two cycles of Navulizumab treatment (Obradovic et al., 2022). The GSE123813 dataset contains 24 tissue samples from 11 patients with basal cell carcinoma (BCC), in which tissue sequencing was conducted before and after the administration of the anti-PD-1 monoclonal antibody pabolizumab for each patient (Yost et al., 2019). First, two single cell RNA sequencing data were read using Read10X, and CreateSeuratObject was used to generate the S4 object required for subsequent analysis. Next, the cell cycle score was calculated using CellCycleScoring. Finally, the three following conditions were applied for further quality control: (1) removal of cells with less than 300 or more than 6,000 genes; (2) removal of cells with UMI values less than 1,000 or greater than 50,000; and (3) removal of cells with a mitochondrial gene ratio greater than 15%. For the accuracy of analysis results, the DoubletFinder package was used to identify and eliminate doublets (McGinnis et al., 2019). The effect batch effects between samples were minimized by applying the Harmony algorithm to integrate these single cell sequencing data. Subsequently, the Louvain algorithm was used to cluster the cells. Finally, the t-Distributed Random Neighbor Embedding (t-SNE) dimensionality reduction technology was used to achieve further dimensionality reduction visualization.
Immunohistochemistry (IHC) staining
The key prognosis m5CMRs were identified using univariate COX regression analysis. Genes with a p value less than 0.05 were selected for further validation. Then, the HPA database was used as basis to verify the correlation between the expression of key prognosis m5CMRs and prognosis (Uhlen et al., 2015). HPA is a publicly available resource that contains proteomics, transcriptomics, and systems biology data for both tumor and normal tissues. This database can assist researchers in creating maps of tissues, cells, and organs and in consulting survival curves for cancer patients.
Moreover, the role of key prognostic m5CMRs in the prognosis of HNSCC was confirmed by conducting IHC experiments on 10 specimens of patients with primary HNSCC who received surgical treatment at the Affiliated Stomatological Hospital of Sun Yat-sen University between September 2018 and September 2019. Based on the follow-up results, the 10 patients were divided into a group with survival time of more than 3 years (≥3y group) and a group with a survival time of less than 3 years (<3y group).
After slicing the tissue by using the PANNORAMIC (3DHISTECH, Budapest, Hungary) panoramic slicing scanner, the slices were gradually moved under the scanner’s lens, imaging was carried out while moving, and all the tissue information on the tissue slices were scanned to form a folder that contains all the tissue information on the slices. After opening the folder by using the CaseViewer2.4 software (3DHISTECH, Budapest, Hungary), the samples can be observed at any magnification from 1× to 400×. The TMA plugin in Quant Center2.3 (3DHISTECH, Budapest, Hungary) analysis software was used to set the organizational edge contour, and the software automatically generated a number. The H-score was quantified by calculating the sum of the product of the percentage of cells of weak, moderate, and strong intensity and their respective staining intensity (H-SCORE = Σ(PI) of the target area for each chip and point using the Densito Quant module in Quant Center2.3 analysis software × I) = (percentage of cells of weak intensity × 1) + (percentage of cells of moderate intensity × 2) + (percentage of cells of strong intensity × 3). In the formula, PI represents the proportion of positive signal pixel area, and I represent the coloring intensity.
Wilcoxon test was used to compare the difference between two groups. The survival package was applied for survival analysis. All statistical p values were two-sided, with p < 0.05 indicating statistical significance. All data-processing steps were conducted in R 4.0.1 software.
A total of 987 HNSCC specimens were collected, including 32 normal tissues and 955 tumor tissues. The specific data information is shown in Table 1. In the TCGA dataset, the basic characteristics of 14 m5CMRs in HNSCC were explored. In comparison with normal tissues, NSUN2, NSUN3, NSUN4, NSUN5, NSUN6, NOP2, DNMT3A, DNMT3B, TET1, TET3, ALKBH1, and YBX1 are highly expressed in tumor tissues, whereas NSUN7 and TET2 are highly expressed in normal tissues, indicating that these genes may play a role in tumor development (Fig. 1A). The 14 m5CMRs were distributed on different chromosomes (Fig. 1B). Then, the frequency of SNP for 14 m5CMRs was analyzed, and the results show that the total mutation frequency was 10.67%, and DNMT3A, DNMT3B, and TET1 had the highest mutation frequency (Fig. 1C). Therefore, the m5CMRs may not affect downstream RNA transcription and translation levels through somatic mutations. Through CNV analysis, NSUN2, NSUN3, NSUN4, NOP2, DNMT3B, TET3, ALKBH1, YBX1, NSUN7, and TET2 were mainly subjected to copy number variation in the form of gain of function, while NSUN5, NSUN6, DNMT3A, and TET1 were subjected to copy number variation in the form of loss of function (Fig. 1D).
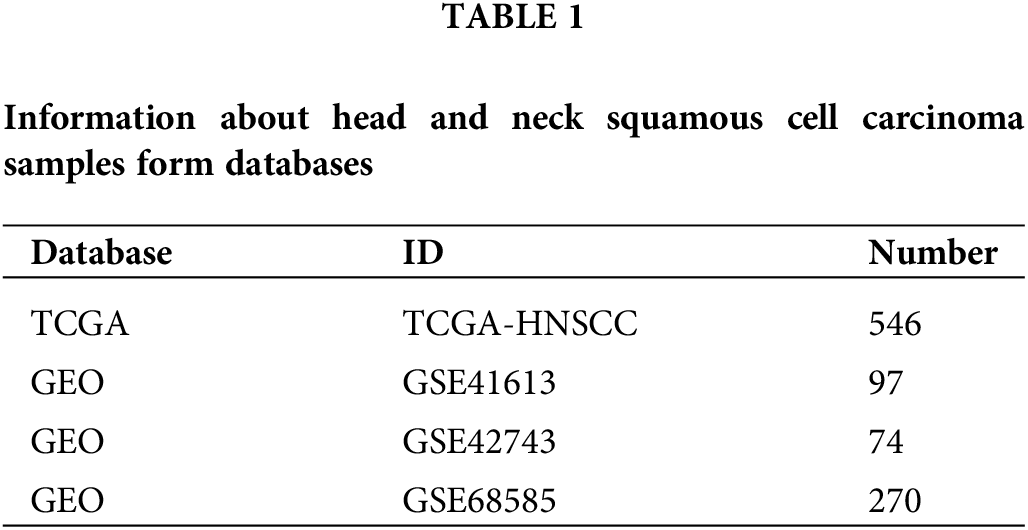

Figure 1: Basic characteristics of m5CMRs in The Cancer Genome Atlas dataset. (A) The differential expression of 14 m5CMRs between tumor and normal tissues; Normal, normal tissue; Tumor, tumor tissue. (B) Distribution of 14 m5CMRs in DNA. (C) Somatic mutation of 14 m5CMRs. (D) Copy number variation of 14 m5CMRs; GAIN, gain of function; LOSS, loss of function. *p < 0.05, **p < 0.01, ***p < 0.001.
We merged the four HNSCC cohorts to investigate the relationship between the 14 m5CMRs and the prognosis. By using the Kaplan–Meier (KM) method, 12 m5CMRs (TET1, TET2, TET3, DNMT3A, DNMT3B, NSUN2, NSUN3, NSUN4, NSUN7, NOP2, ALKBH1, and YBX1) were confirmed to affect the prognosis of the patients with HNSCC (Fig. 2). The high expression of DNMT3A, NSUN7, TET2, and TET3 indicates the long-term survival of patients with HNSCC, while the high expression of TET1, DNMT3B, NSUN2, NSUN3, NSUN4, NOP2, ALKBH1, and YBX1 indicates poor prognosis (Fig. 2).
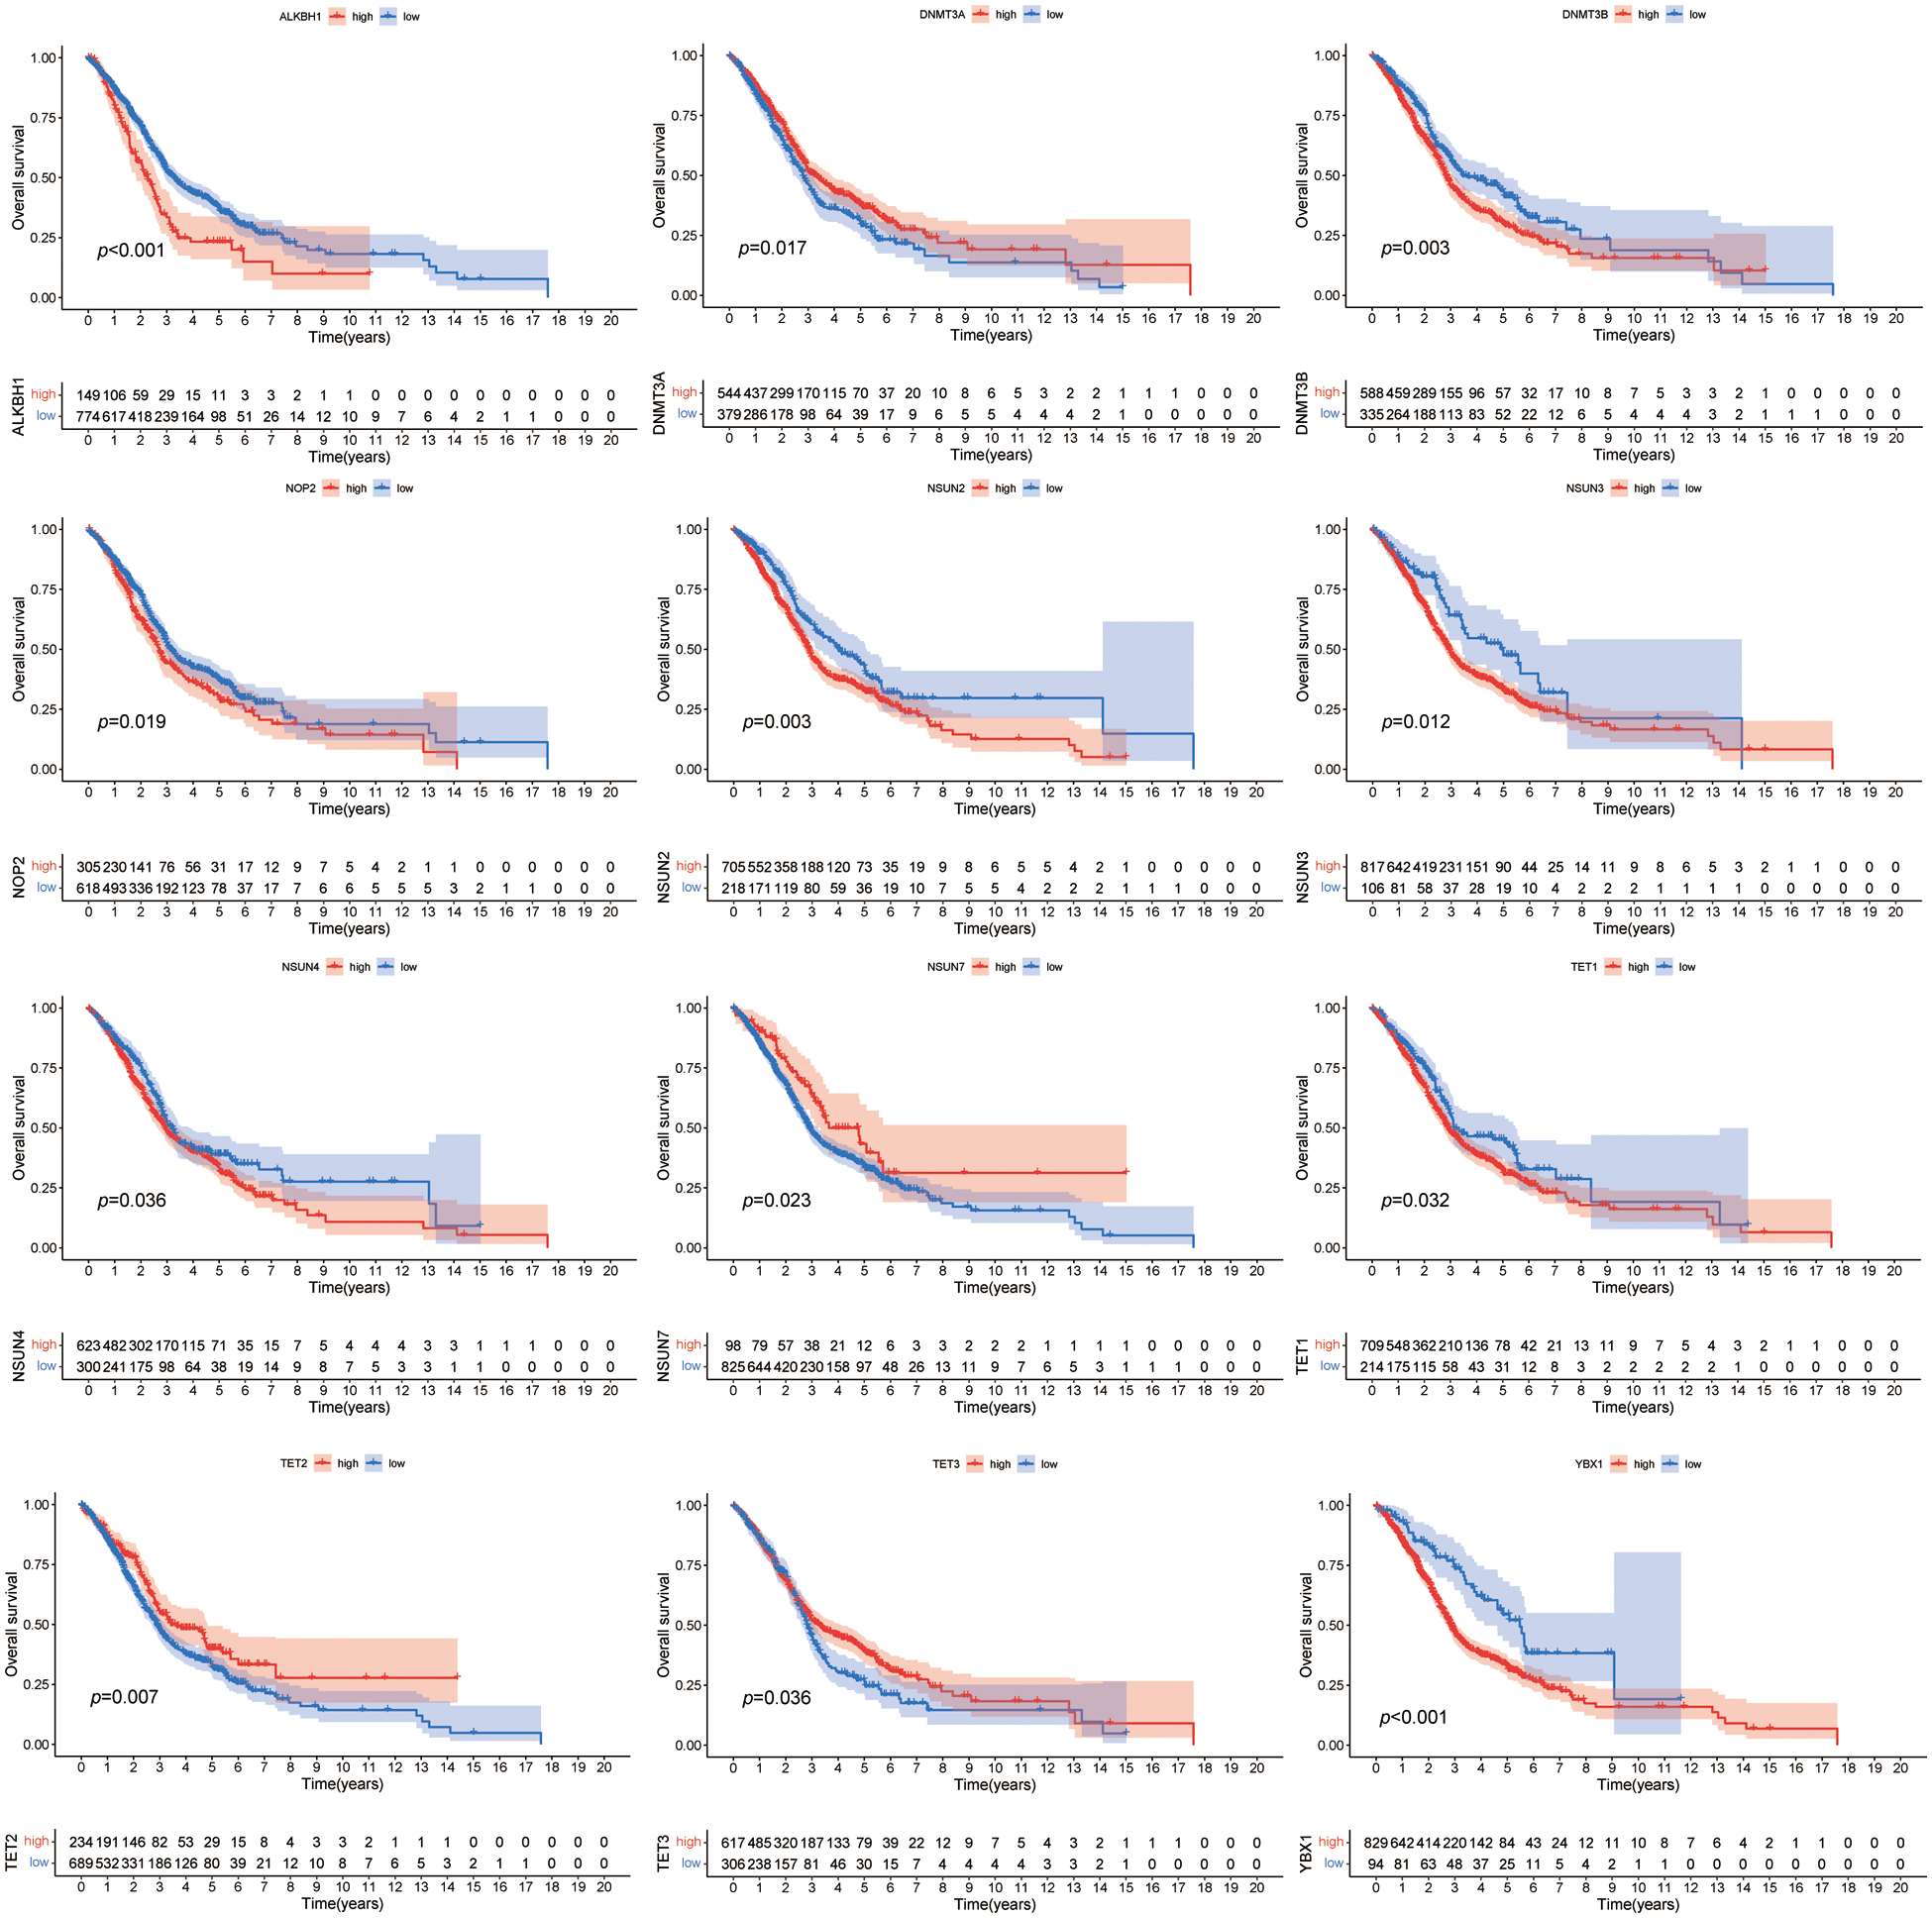
Figure 2: Kaplan–Meier survival curve of m5CMRs.
The interaction among 14 m5CMRs was investigated using correlation analysis. NSUN7-YBX1, NSUN2-NSUN7, NSUN5-TET1, NSUN5-TET2, and NSUN5-TET3 showed a significant negative correlation, whereas NSUN2-DNMT3B, NSUN2-YBX1, and NSUN3-TET3 showed a significant positive correlation (Fig. 3A).
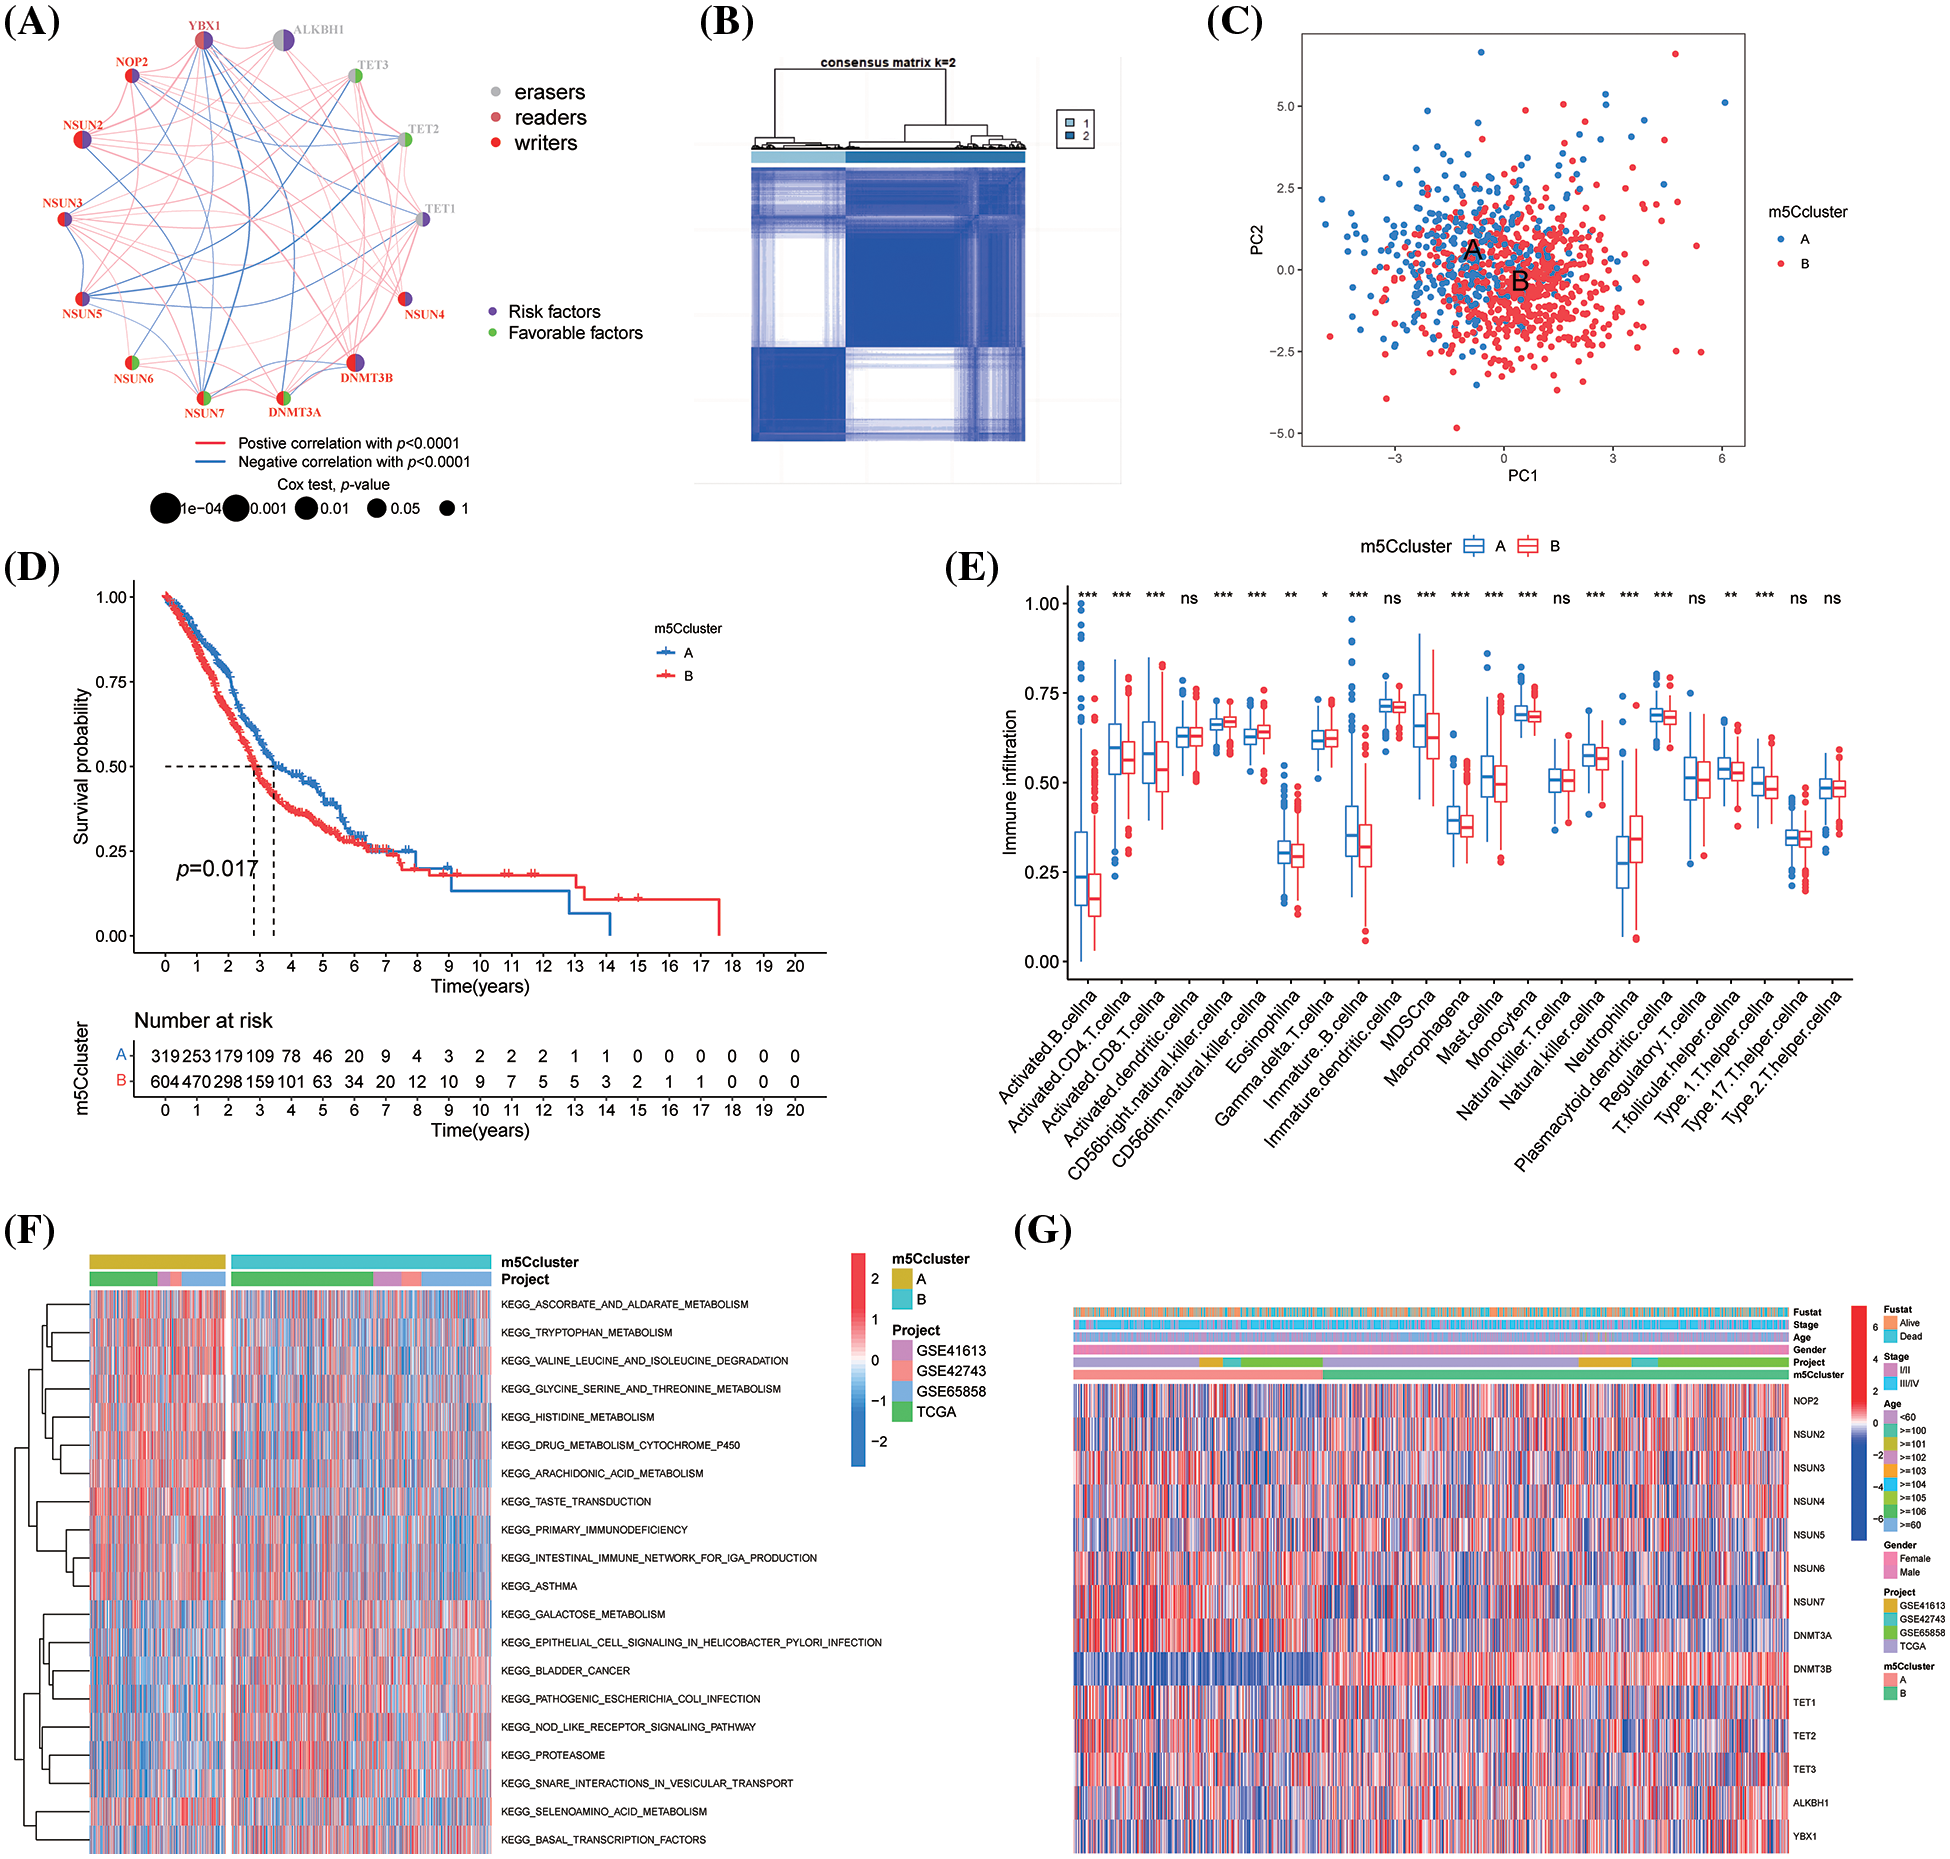
Figure 3: Construction of m5C methylation molecular subtype for HNSCC. (A) Correlation network; (B) Heatmap of subtypes; (C) PCA analysis; (D) KM survival curve of m5C methylation molecule subtypes; (E) ssGSEA function analysis of m5C methylation molecule subtypes; (F) GSVA analysis of m5C methylation molecule subtypes; and (G) Expression levels of m5C methylation regulators between the two subtypes. *p < 0.05, **p < 0.01, ***p < 0.001.
Construction of m5C methylation molecular subtype for HNSCC
In this study, we used the Combat package to remove the batch effect among four HNSCC transcription data. Then, 14 m5CMR expression profiles were extracted based on the corrected transcription data and then classified using the ConsensusClusterPlus package. As a result, 923 patients with HNSCC were divided into two clusters, namely, m5CclusterA and m5CclusterB (Fig. 3B), which are two distinct categories based on PCA analysis (Fig. 3C). The patients in m5CclusterA had a longer survival time, while the patients in m5CclusterB had a poor prognosis (Fig. 3D). Functional analysis revealed that m5CclusterA and m5CclusterB exhibit completely different immune infiltration patterns. Immune-responsive cells such as activated B cell, activated CD4 T cell, activated CD8 T cell, immature B cell, and NK cell infiltrated more in m5CclusterA, while neutrophil and gamma delta T cells infiltrated more in m5CclusterB (Fig. 3E). This finding indicates that m5CclusterA is an immune-activated microenvironment, while m5CclusterB may be an immunosuppressive microenvironment. In addition, the GSVA analysis of the Hallmarker gene sets for the two clusters revealed that they have completely different functions. Among them, m5CclusterB mainly enriched metabolic-related pathways, such as ascorbate and alarate, tryptophan, glycine, serine, threonine, and histidine metabolism. It also participated in the primary immunodeficiency pathway, further explaining its immunosuppressive properties (Fig. 3F). Furthermore, the differential expression of 14 m5CMRs between the two clusters was investigated. DNMT3B, NSUN2, NOP2, ALKBH1, and YBX1 were highly expressed in m5CclusterB, while NSUN6, NSUN7, and DNMT3A were highly expressed in m5CclusterA (Fig. 3G).
To construct a m5C scoring system, the differential analysis on m5CclusterA and m5CclusterB was carried out to identify the DEGs. Based on these DEGs, 1,000 unsupervised cluster analyses were conducted, and the patients with HNSCC were divided into two types of m5C methylation gene phenotype molecular typing, namely, geneCluster A and geneCluster B (Fig. 4A). Based on K–M survival analysis, the patients in geneCluster B had longer survival time, while patients in geneCluster A had a worse prognosis (Fig. 4B). In comparison with geneCluster B, NOP2, NSUN2, NSUN4, NSUN5, DNMT3B, ALKBH1, and YBX1 had higher expression levels in geneCluster A, whereas the opposite results were obtained for NSUN3, NSUN6, NSUN7, DNMT3A, TET1, and TET2 (Fig. 4C).
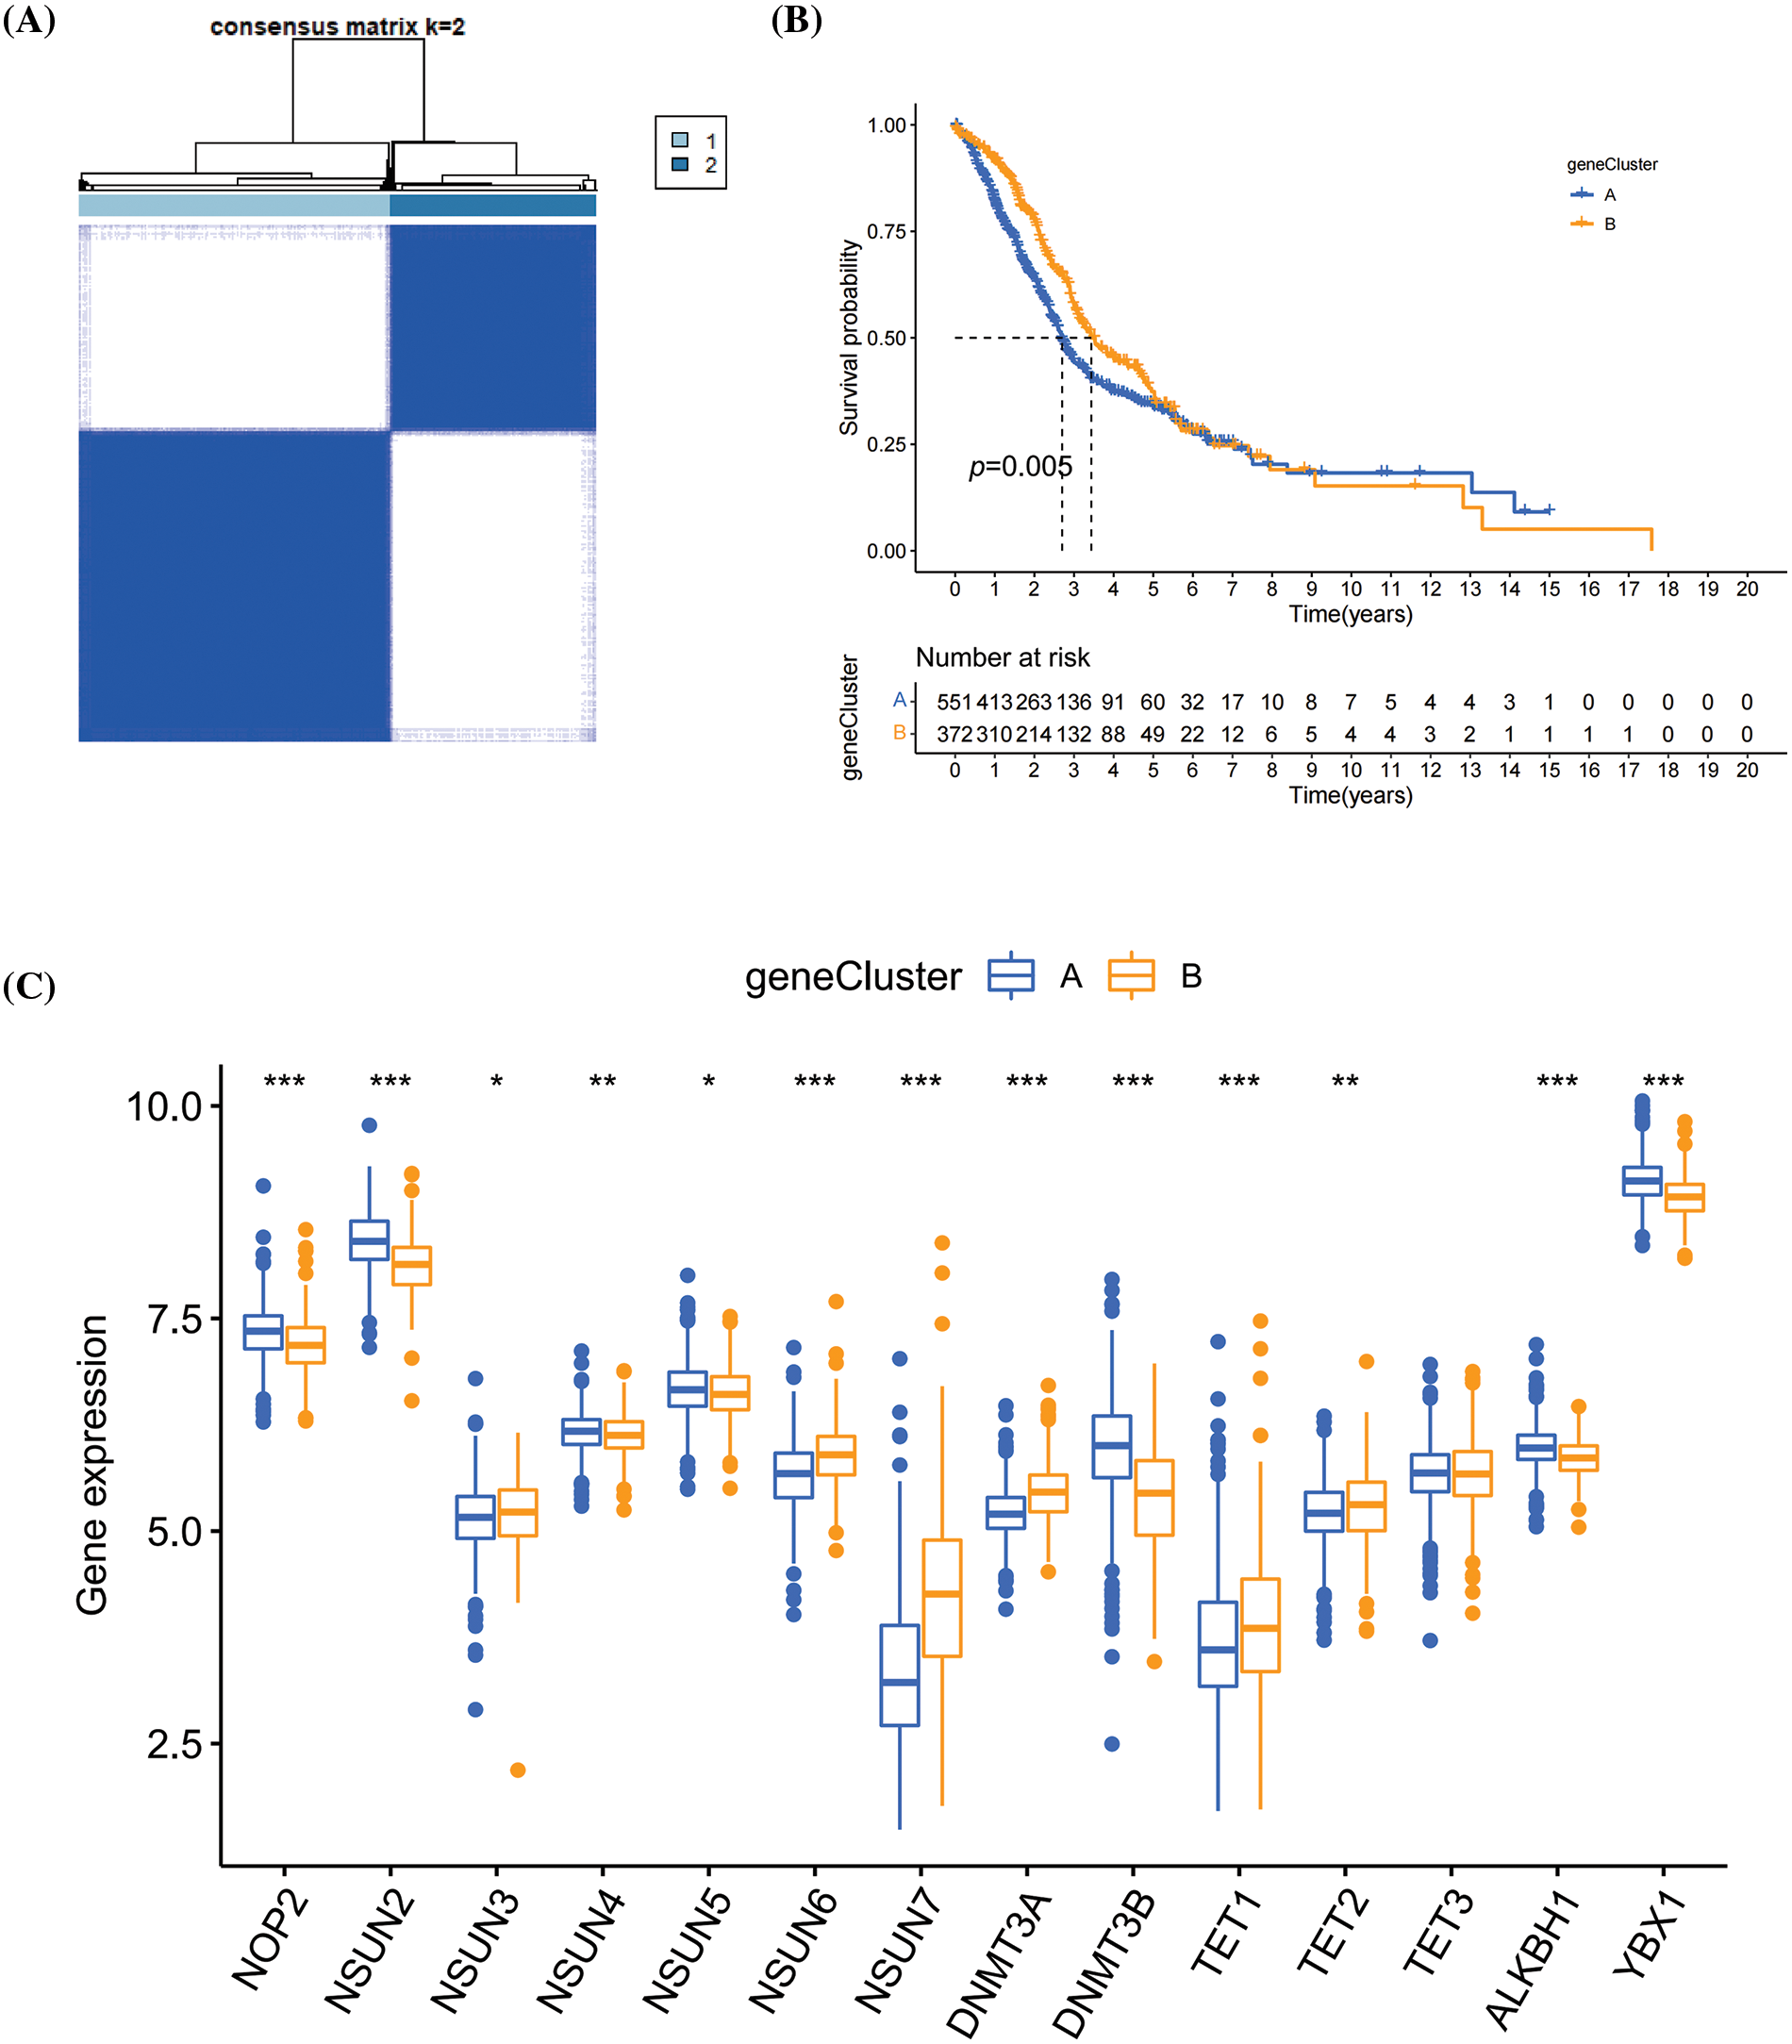
Figure 4: The m5C methylation phenotyping subtypes. (A) Heatmap of m5C methylation phenotyping subtypes; (B) K–M survival curve of m5C methylation phenotyping subtypes; (C) Expression levels of m5C methylation regulators between m5C methylation phenotyping subtypes. *p < 0.05, **p < 0.01, ***p < 0.001.
Then, geneCluster A and geneCluster B were subjected to gene expression differential analysis, and univariate COX analysis was conducted to identify prognostic genes. Based on these prognostic genes, the m5C signature—m5Cscore was developed using the PCA method (Fig. 5A). Patients with HNSCC were divided into the high- and low-m5Cscore group based on the optimal threshold (Fig. 5B). Patients in the low-m5Cscore group had a better prognosis than those in the high-m5Cscore group, indicating the potential of m5Cscore as a prognostic indicator for HNSCC and suggesting that m5C methylation affects the prognosis of HNSCC. The relationship between m5Cscore and immune infiltrating cells was investigated by using the ssGSEA method to calculate the immune infiltrating cell score in HNSCC. Then, the correlation between m5Cscore and immune infiltrating cell score was inverstigated. A negative correlation was observed between the m5Cscore and most immune infiltrating cells (Fig. 5C). The m5Cscore had a strong negative correlation with activated B cells, activated CD4 cells, activated CD8 cells, and immature B cells and a positive correlation with neutrophil (Fig. 5C). This finding indicates that m5C methylation may affect the immune microenvironment and lead to immune heterogeneity microenvironment affecting anti-tumor immunity in HNSCC, leading to poor prognosis (Fig. 5C). The distribution of m5Cscore in the m5Ccluster and geneCluster groups was compared, and significant differences were observed in the distribution of m5Cscore between the m5Ccluster and geneCluster groups, with consistent survival curves (Figs. 5D and 5E).
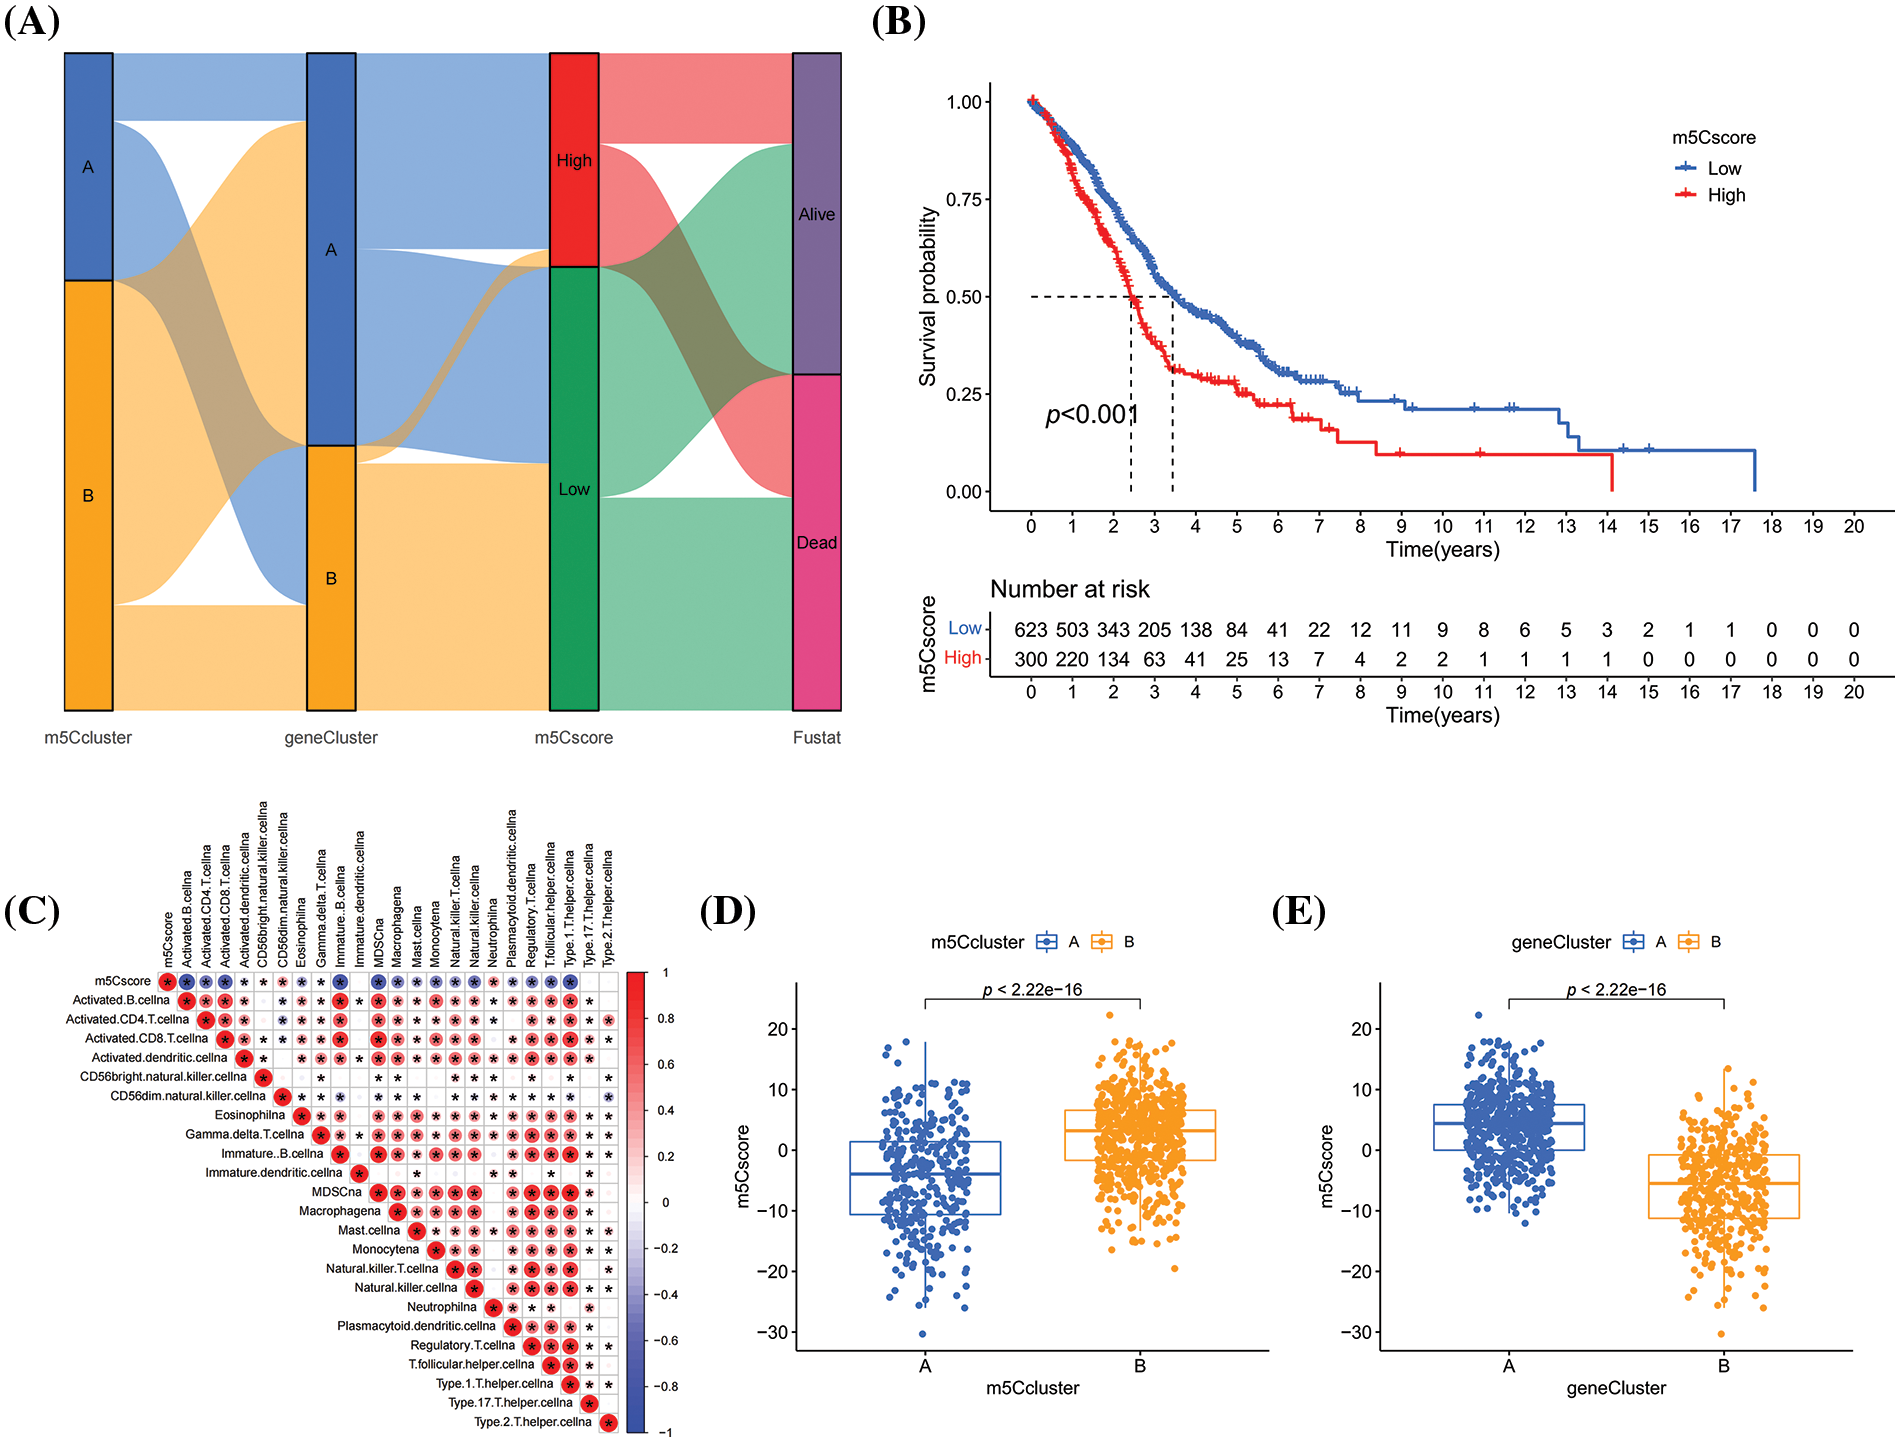
Figure 5: Construction of m5C methylation score. (A) Sankey plot; (B) K–M survival curve of m5Cscore; (C) Correlation analysis between m5Cscore and immune infiltration; (D) Distribution of m5Cscore in m5Ccluster; and (E) Distribution of m5Cscore in geneCluster.
Relationship between m5Cscore and TMB
Based on the comparison of differences in SNP between the high- and low-m5Cscore group, patients in the high-m5Cscore group having higher rates of missense and nonsense mutations (Figs. 6A and 6B). In this study, the relationship between m5Cscore and TMB was investigated. Based on the comparison of the distribution differences of TMB scores between the high- and low-m5C score group, the TMB scores of the high-m5Cscore group were significantly higher than those of the low-m5Cscore group, and the difference was statistically significant (p < 0.05, Fig. 6C). Furthermore, that a certain correlation between m5Cscore and TMB, in which R = 0.19 and p < 0.05 (Fig. 6D). Subsequently, patients with high TMB had a poor prognosis, which is consistent with previous literature reports (Fig. 6E). Next, the m5Cscore was combined with TMB for survival analysis, and the results show that the combination of m5Cscore and TMB analysis could distinguish two groups of patients, namely the high-m5Cscore, high-TMB group and the low-m5Cscore, low-TMB group, which have significantly different prognosis (Fig. 6F). This finding indicates that the combination of m5Cscore and TMB analysis can improve the effectiveness of predicting patient prognosis and effectively stratify patients with HNSCC.
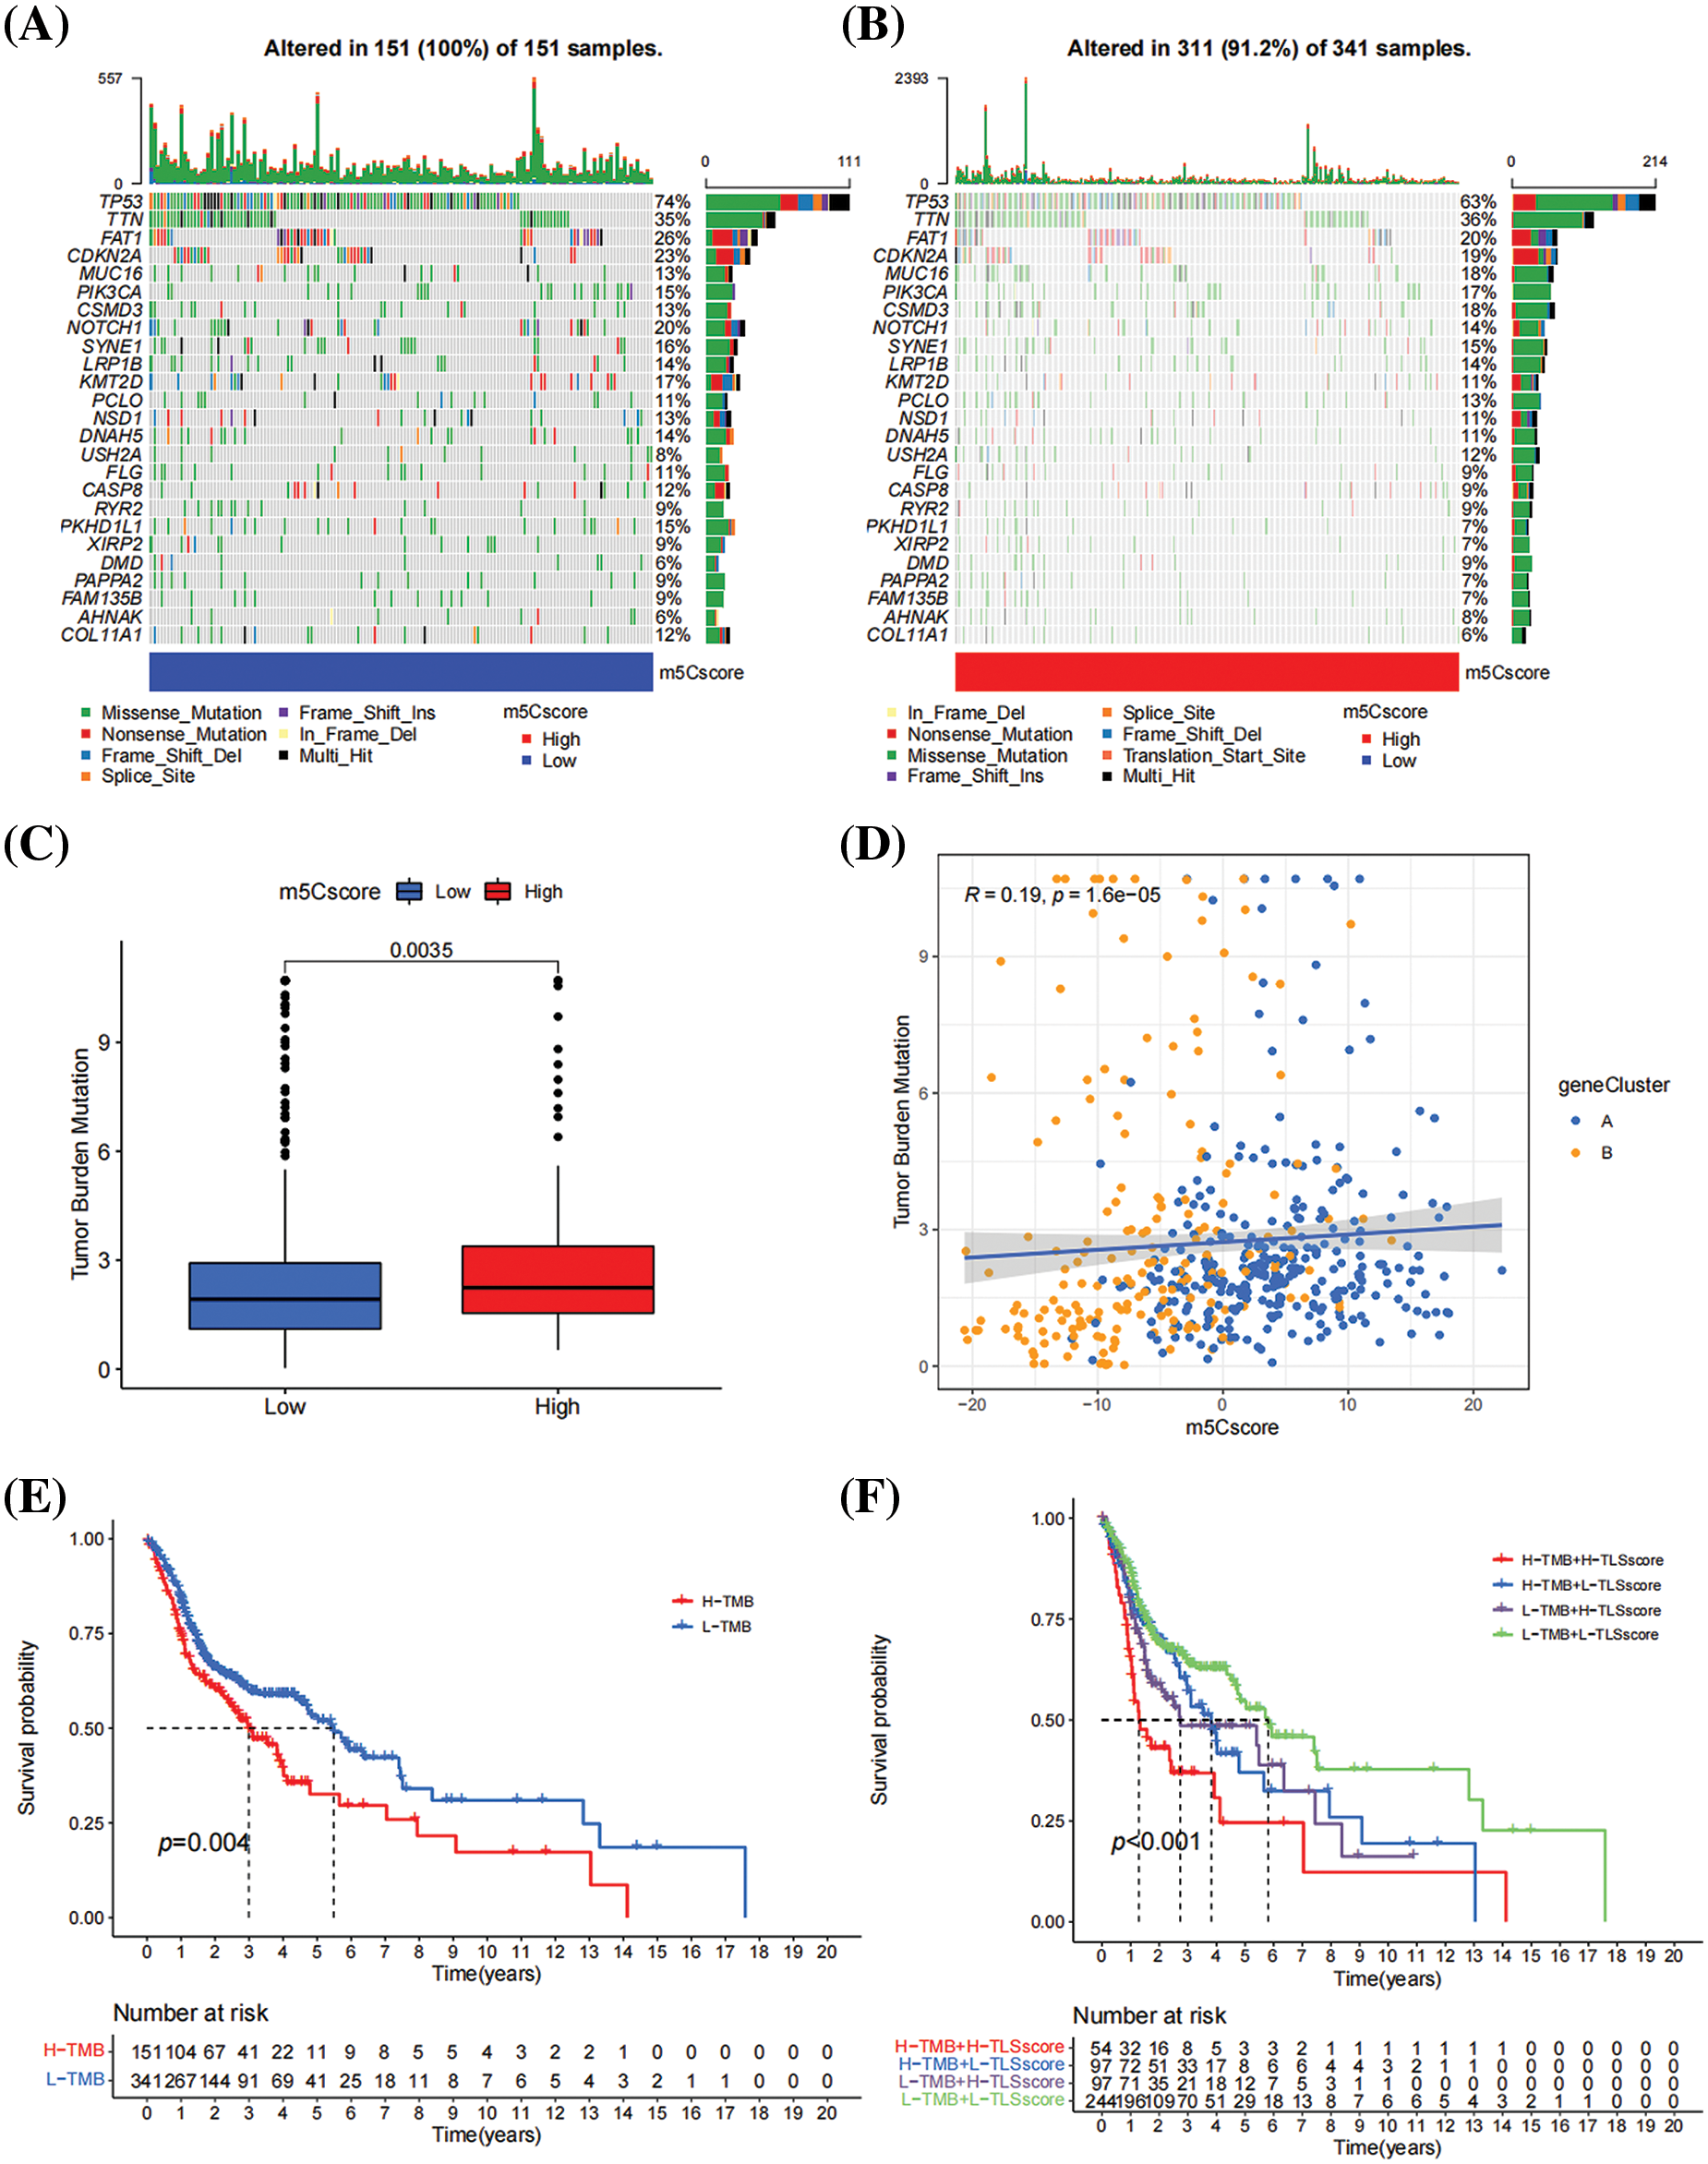
Figure 6: Relationship between m5Cscore and TMB. (A) SNP in high-m5Cscore group; (B) SNP in low-m5Cscore group; (C) Distribution of TMB in the high- and low-m5Cscore groups; (D) Correlation analysis between TMB and m5Cscore; (E) K–M survival curve of TMB; and (F) KM survival curve of m5Cscore combined with TMB.
Relationship between m5Cscore and immunotherapy response
The above immune infiltration analysis indicates a negative correlation between m5Cscore and multiple immune infiltration cells, indicating that m5C methylation may be involved in the anti-tumor immunity of HNSCC. Accordingly, the relationship between m5Cscore and immunotherapy response was explored. The IPS score data for patients with HNSCC were downloaded from the TCIA database, and the analysis results showed a significant difference in m5Cscore between CTLA4_Positive-PD1_ Positive and CTLA4_Negative-PD1_Negative groups (p < 0.05), whereas no significant difference was observed in the CTLA4_Positive-PD1_Negative and CTLA4_Negative-PD1_Positive groups (Figs. 7A–7D). This finding indicates that m5Cscore can reflect the efficacy of immunotherapy in specific populations and has potential for application (Figs. 7A–7D).
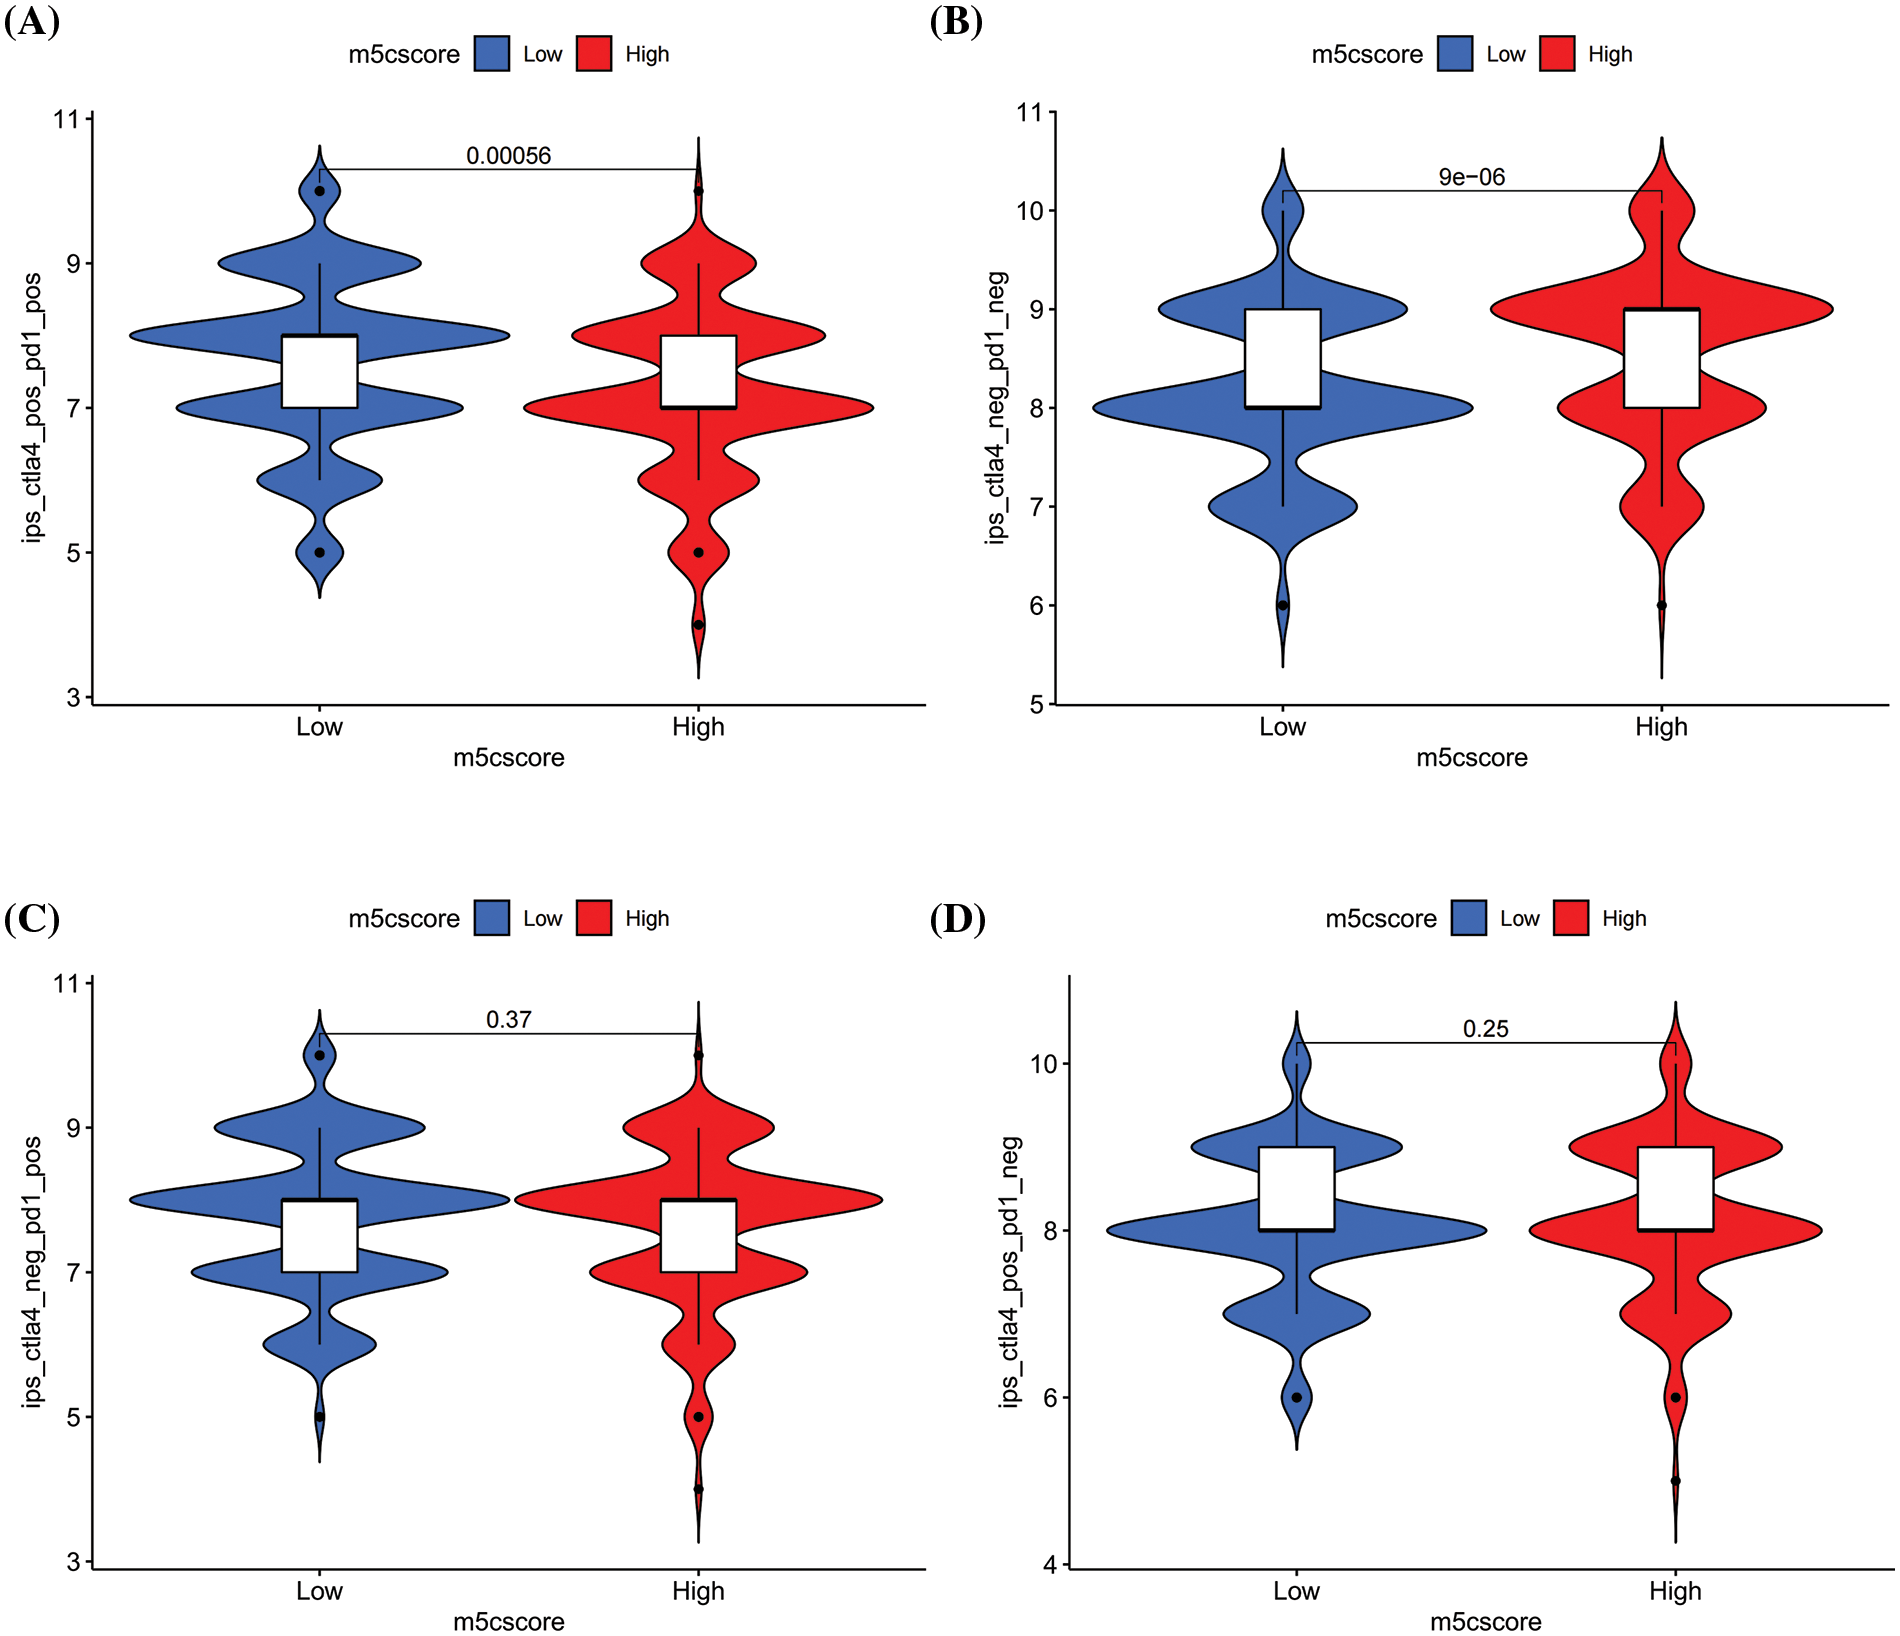
Figure 7: Relationship between m5Cscore and immunotherapy. (A) The differences of IPS between high and low m5Cscore groups in CTLA4_Positive-PD1_Positive group; (B) The differences of IPS between high and low m5Cscore groups in CTLA4_Negative-PD1_ Negative group; (C) The differences of IPS between high and low m5Cscore groups in CTLA4_Negative-PD1_Positive group; (D) The differences of IPS between high and low m5Cscore groups in CTLA4_Positive-PD1_Negative group.
Single-cell sequencing analysis for m5Cscore
In GSE195832, 17 cell subpopulations were obtained and annotated based on known cell surface markers, including epithelial cells, pericytes, endothelial cells, cancer associated fibroblasts, plasma cells, B cells, mast cells, macrophages, T cells, and DCs (Fig. 8). The results show that HNSCC is a heterogeneous tumor with significant differences in cell composition among each sample (Figs. 8A–8D). Then, the m5Cscore levels among different cell types were compared, and the results show that epithelial cells, macrophages, and DCs express high m5C score (Fig. 8E). Further comparison of the dynamic changes of m5Cscore before and after medication revealed that the expression of m5C score in epithelial cells was significantly higher after medication than before (Fig. 8F). However, no significant difference was observed in the m5Cscore expression between macrophages and DCs before and after treatment (Fig. 8G). This finding indicates that the level of m5C methylation in epithelial cells is related to immunotherapy, and m5C methylation may affect the efficacy of immunotherapy.
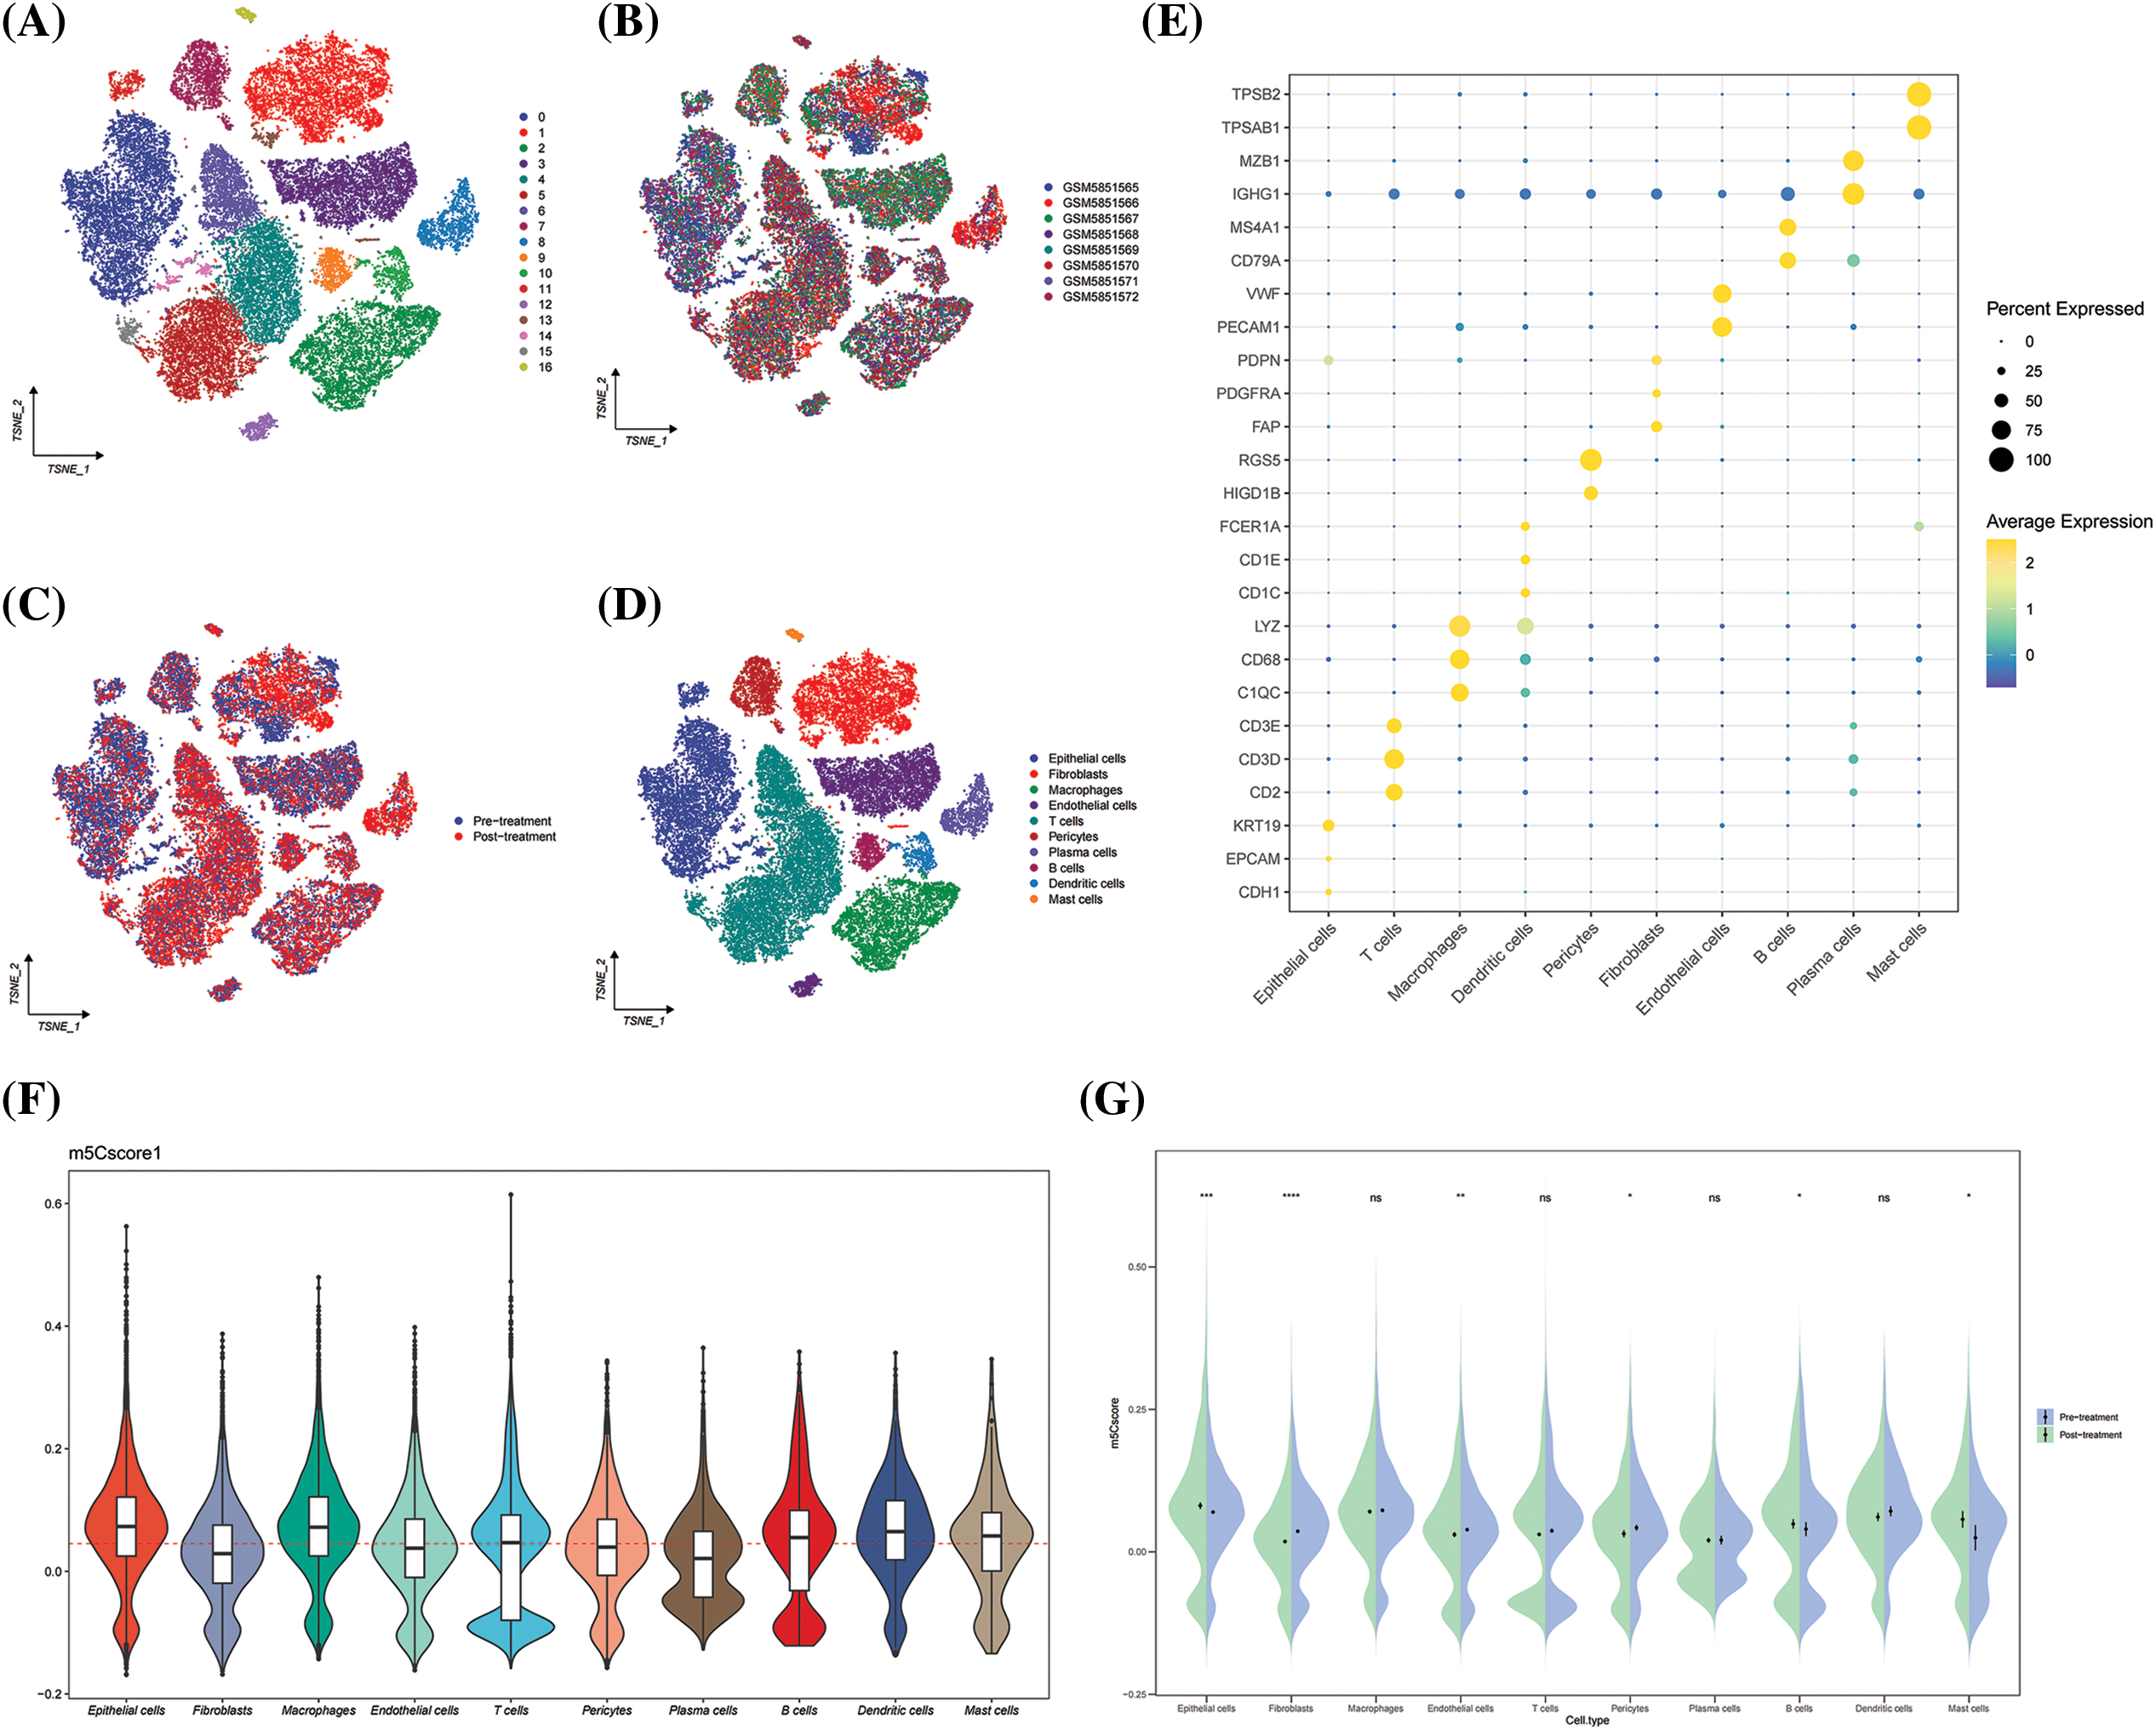
Figure 8: GSE195832. (A) Umap plot of Seruat number; (B) Umap plot of tumor samples; (C) Umap plot of treatment group; (D) Umap plot of all cell types; (E) Cell type annotation; (F) Distribution of m5Cscore in cell types; and (G) Dynamic changes of m5Cscore in cell types between pre- and post-treatment. *p < 0.05, **p < 0.01, ***p < 0.001.
The potential mechanism of m5C methylation in epithelial cells affecting anti-tumor immunity was investigated by classifying epithelial cells into three categories based on the expression level of m5Cscore in epithelial cells, namely, high, medium, and low m5C score. The Cellchat software was used to explore the differences in interactions between high and low-m5Cscore epithelial cells and other cells. Epithelial cells mainly interact with T cells and macrophages, and the interaction between high-m5Cscore epithelial cells and T cells is stronger than that between low-m5Cscore epithelial cells (Figs. 9A and 9B). Based on the comparison of the specific effects of high and low-m5Cscore epithelial cells on T cells, that the high-m5Cscore epithelial cells interact actively with T cells in the MIF-(CD74+CXCR2) pathway, but no interaction was observed between low-m5Cscore epithelial cells and T cells in this pathway (Fig. 9C). This finding suggests that high-m5Cscore epithelial cells may affect T cell function through the MIF-(CD74+CXCR2) pathway, thereby affecting anti-tumor immune response (Fig. 9C).
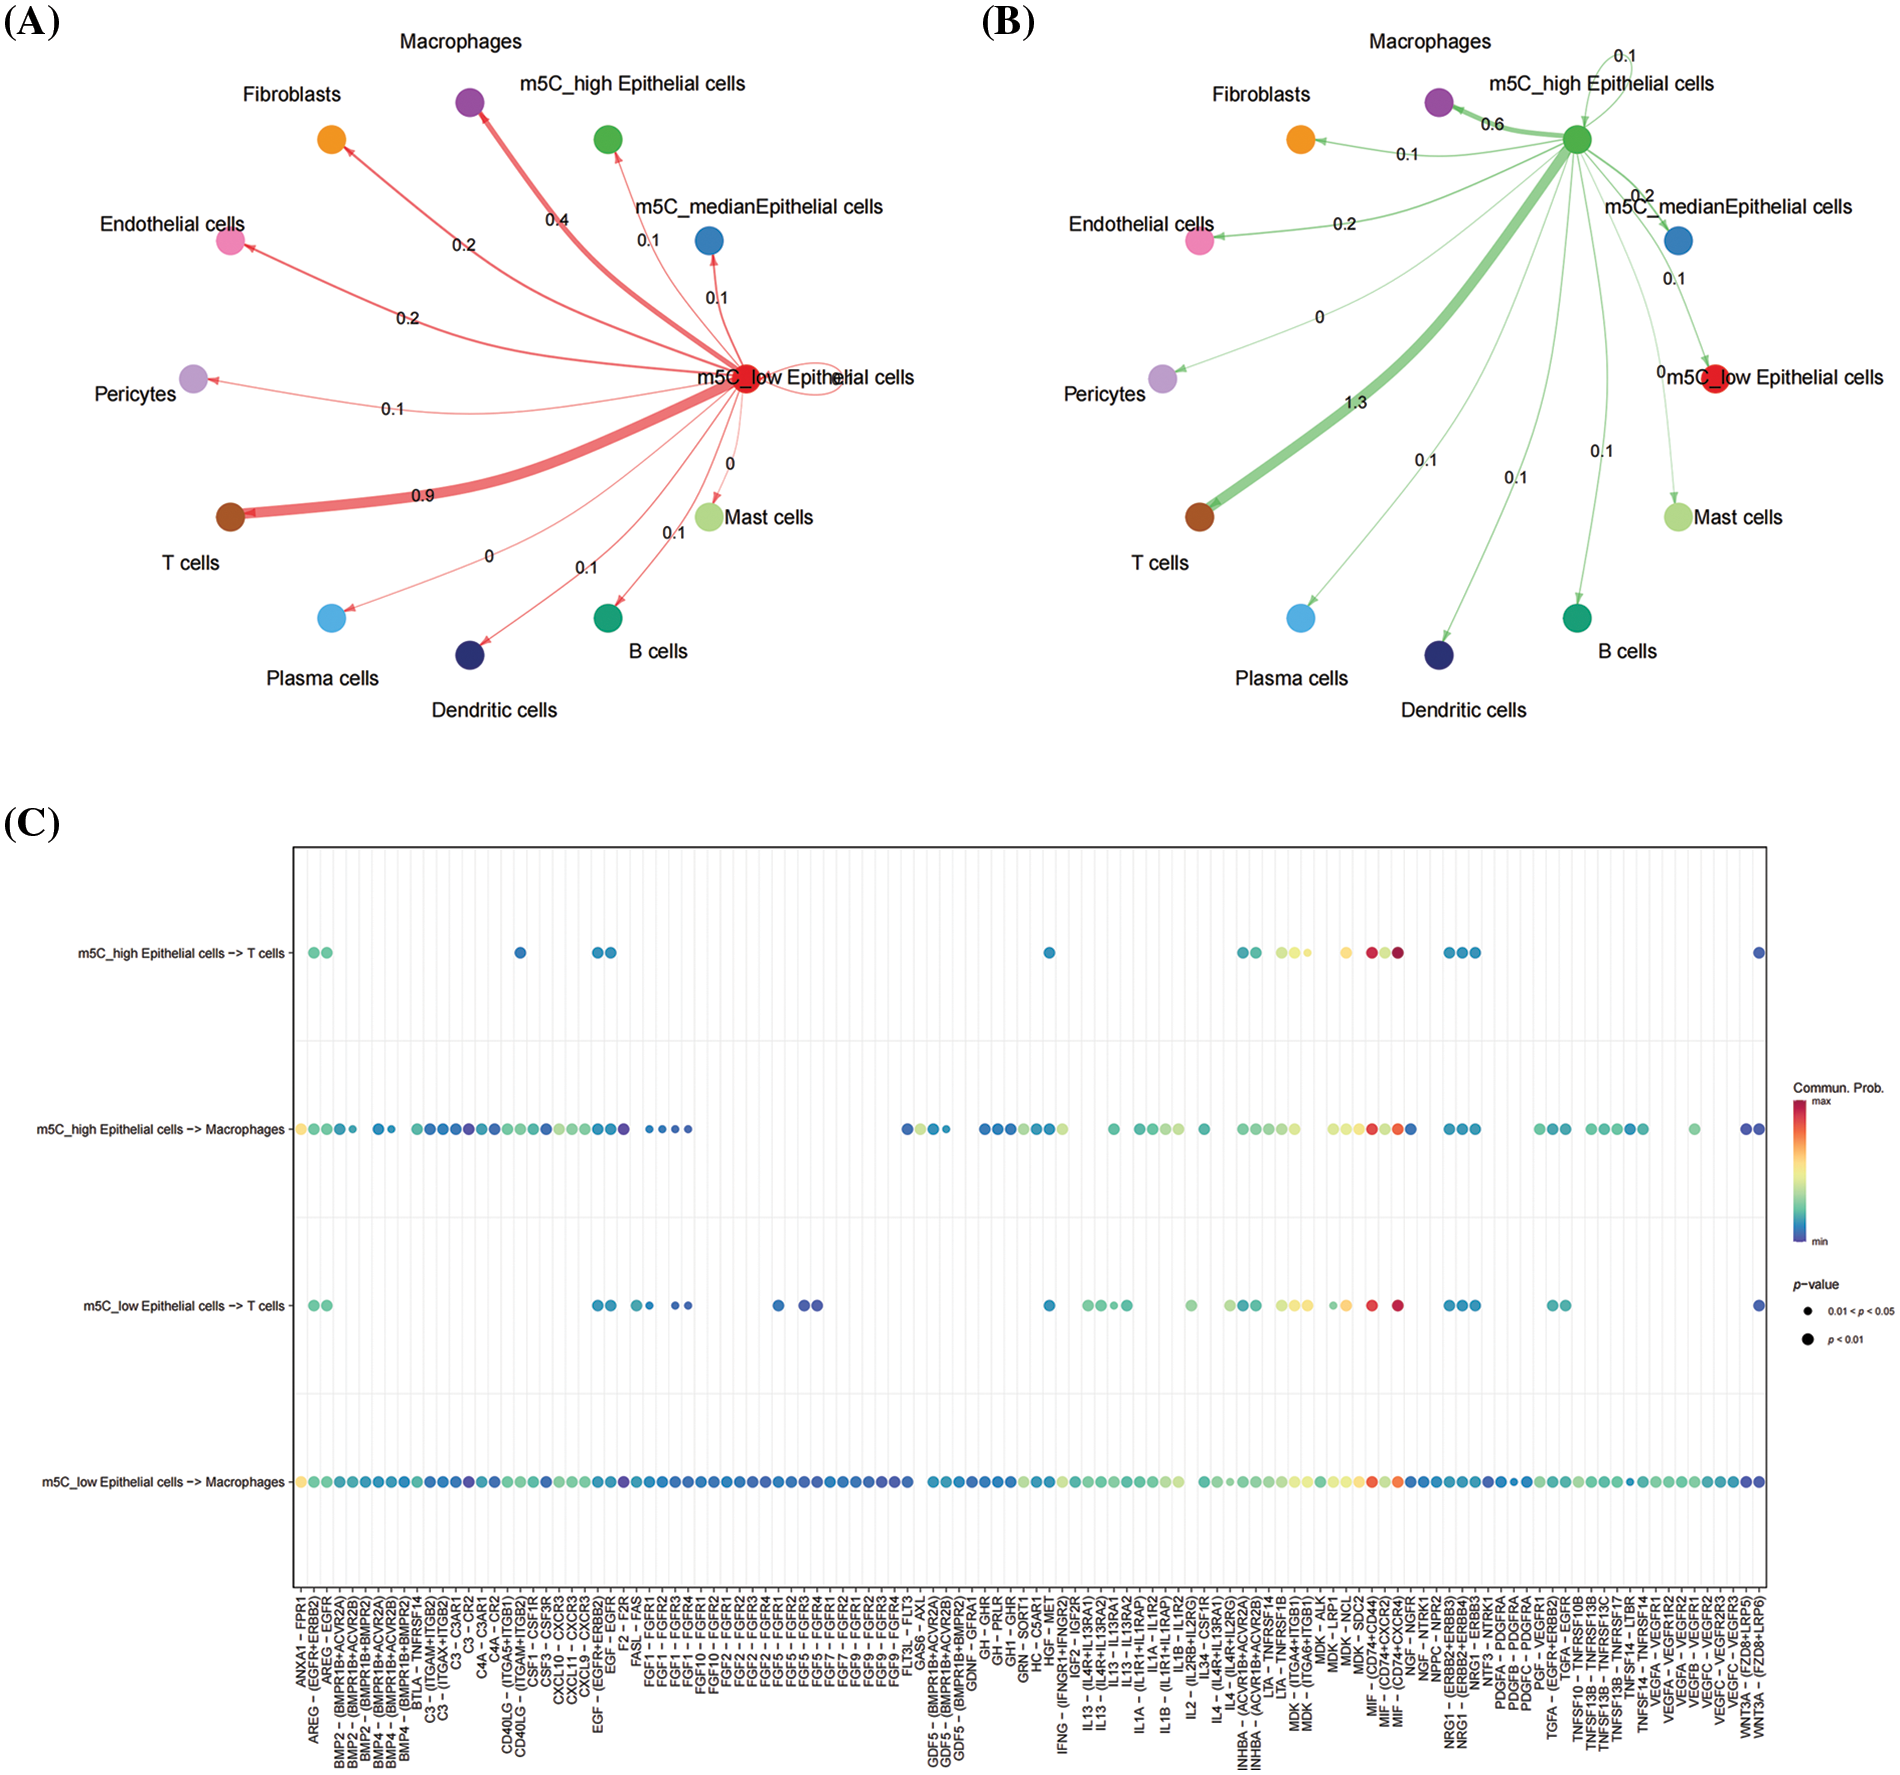
Figure 9: Cell–cell communication analysis. (A) Interaction between high-m5Cscore epithelial cells with the other cells; (B) Interaction between low-m5Cscore epithelial cells with the other cells; and (C) Interaction pathway among epithelial cells, T cells and macrophages.
The GSE123813 dataset was included as an independent external validation data to validate the clinical significance of m5Cscore in immunotherapy. The cells were divided into 19 subpopulations based on the annotation file provided by the author, and the m5C score for each cell was calculated (Figs. 10A–10G). The results show that epithelial cells, DCs, and macrophages were highly expressed in m5C score, and epithelial cells had the highest m5C score (Fig. 10G). In the comparison of the distribution of m5C score between immunotherapy efficacy groups, a difference was observed in the m5C score between the response group and the non-response group (Fig. 10H). Further comparison of the distribution of m5C scores before and after medication showed consistent results with the GSE195832 data (Fig. 10H). The expression of m5Cscore significantly increased after treatment, and the expression of m5Cscore in epithelial cells significantly increased after treatment (Fig. 10H). In addition, the distribution differences of m5C score were compared between different efficacy groups before and after medication, and the results show that the expression of m5C score in epithelial cells had a consistent trend, indicating high expression in the non-responsive group (Figs. 10I and 10J). Therefore, m5C methylation in epithelial cell may affect the efficacy of immunotherapy.
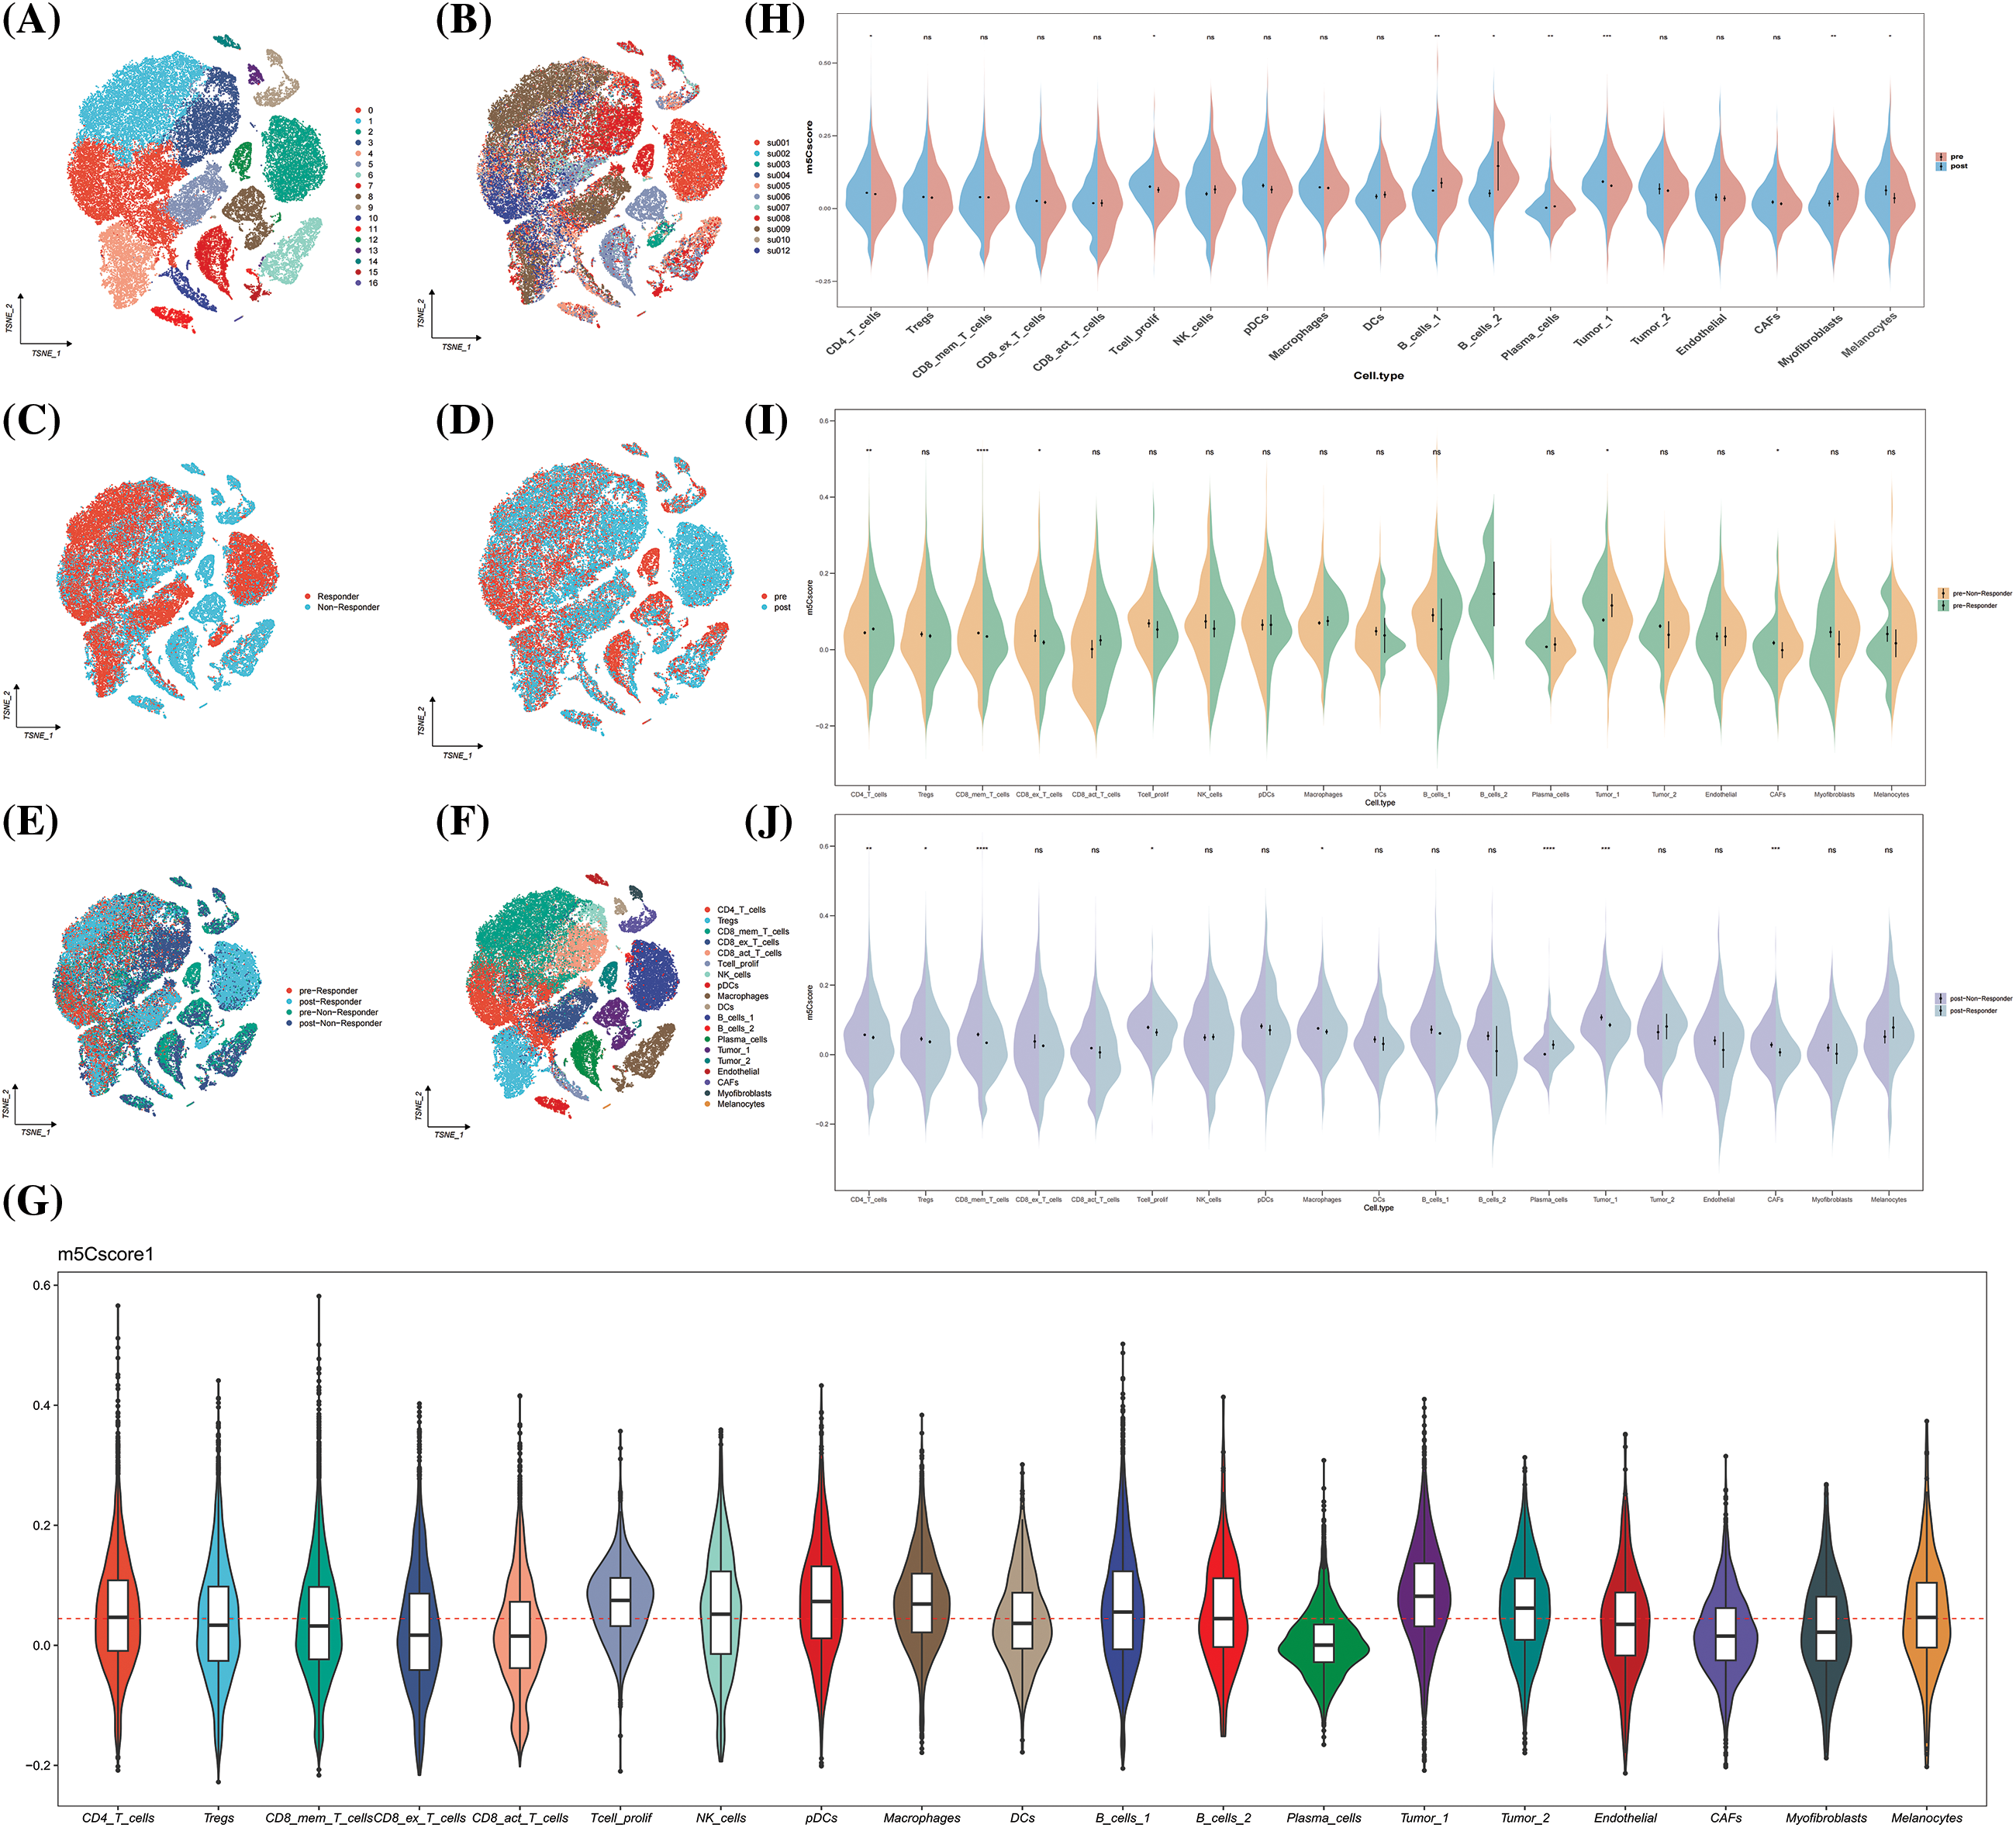
Figure 10: GSE123813. (A) The umap plot of Seruat number; (B) The umap plot of tumor samples; (C) The umap plot of treatment group; (D) The umap plot of groups combined treatment group and therapeutic effect group; (E) The umap plot of therapeutic effect groups; (F) The umap plot of cell types; (G) Distribution of m5Cscore; (H) Distribution of m5Cscore in each cell type between pre-treatment and post-treatment group; (I) Distribution of m5Cscore in each cell type between therapeutic effect groups of pre-treatment group; and (J) Distribution of m5Cscore in each cell type between therapeutic effect groups of post-treatment group. *p < 0.05, **p < 0.01, ***p < 0.001.
The potential role of m5CMRs was explored by comparing the expression differences and mutation frequencies of 14 m5CMRs in 32 solid tumors. The results show that m5CMRs are differentially expressed in most cancers and are highly expressed in tumor tissues (Fig. 11A). Further analysis of somatic mutations revealed single-nucleotide mutations in TET1, TET2, TET3, DNMT3A, DNMT3B, NSUN2, NOP2, NSUN5, NSUN6, NSUN7, and ALKBH1 (Fig. 11B). Among them, colon cancer, lung adenocarcinoma, lung squamous cell carcinoma, skin melanoma, gastric cancer, and endometrial cancer have high single-nucleotide mutation frequencies in TET1, TET2, TET3, NOP2, and NSUN2 (Fig. 11B). Finally, the correlation between somatic mutations and gene expression was investigated, and the results show that somatic mutations in NOP2, NSUN2, NSUN3, NSUN4, NSUN5, NSUN6, and ALKBH1 were related to their gene expression (Figs. 11C and 11D).
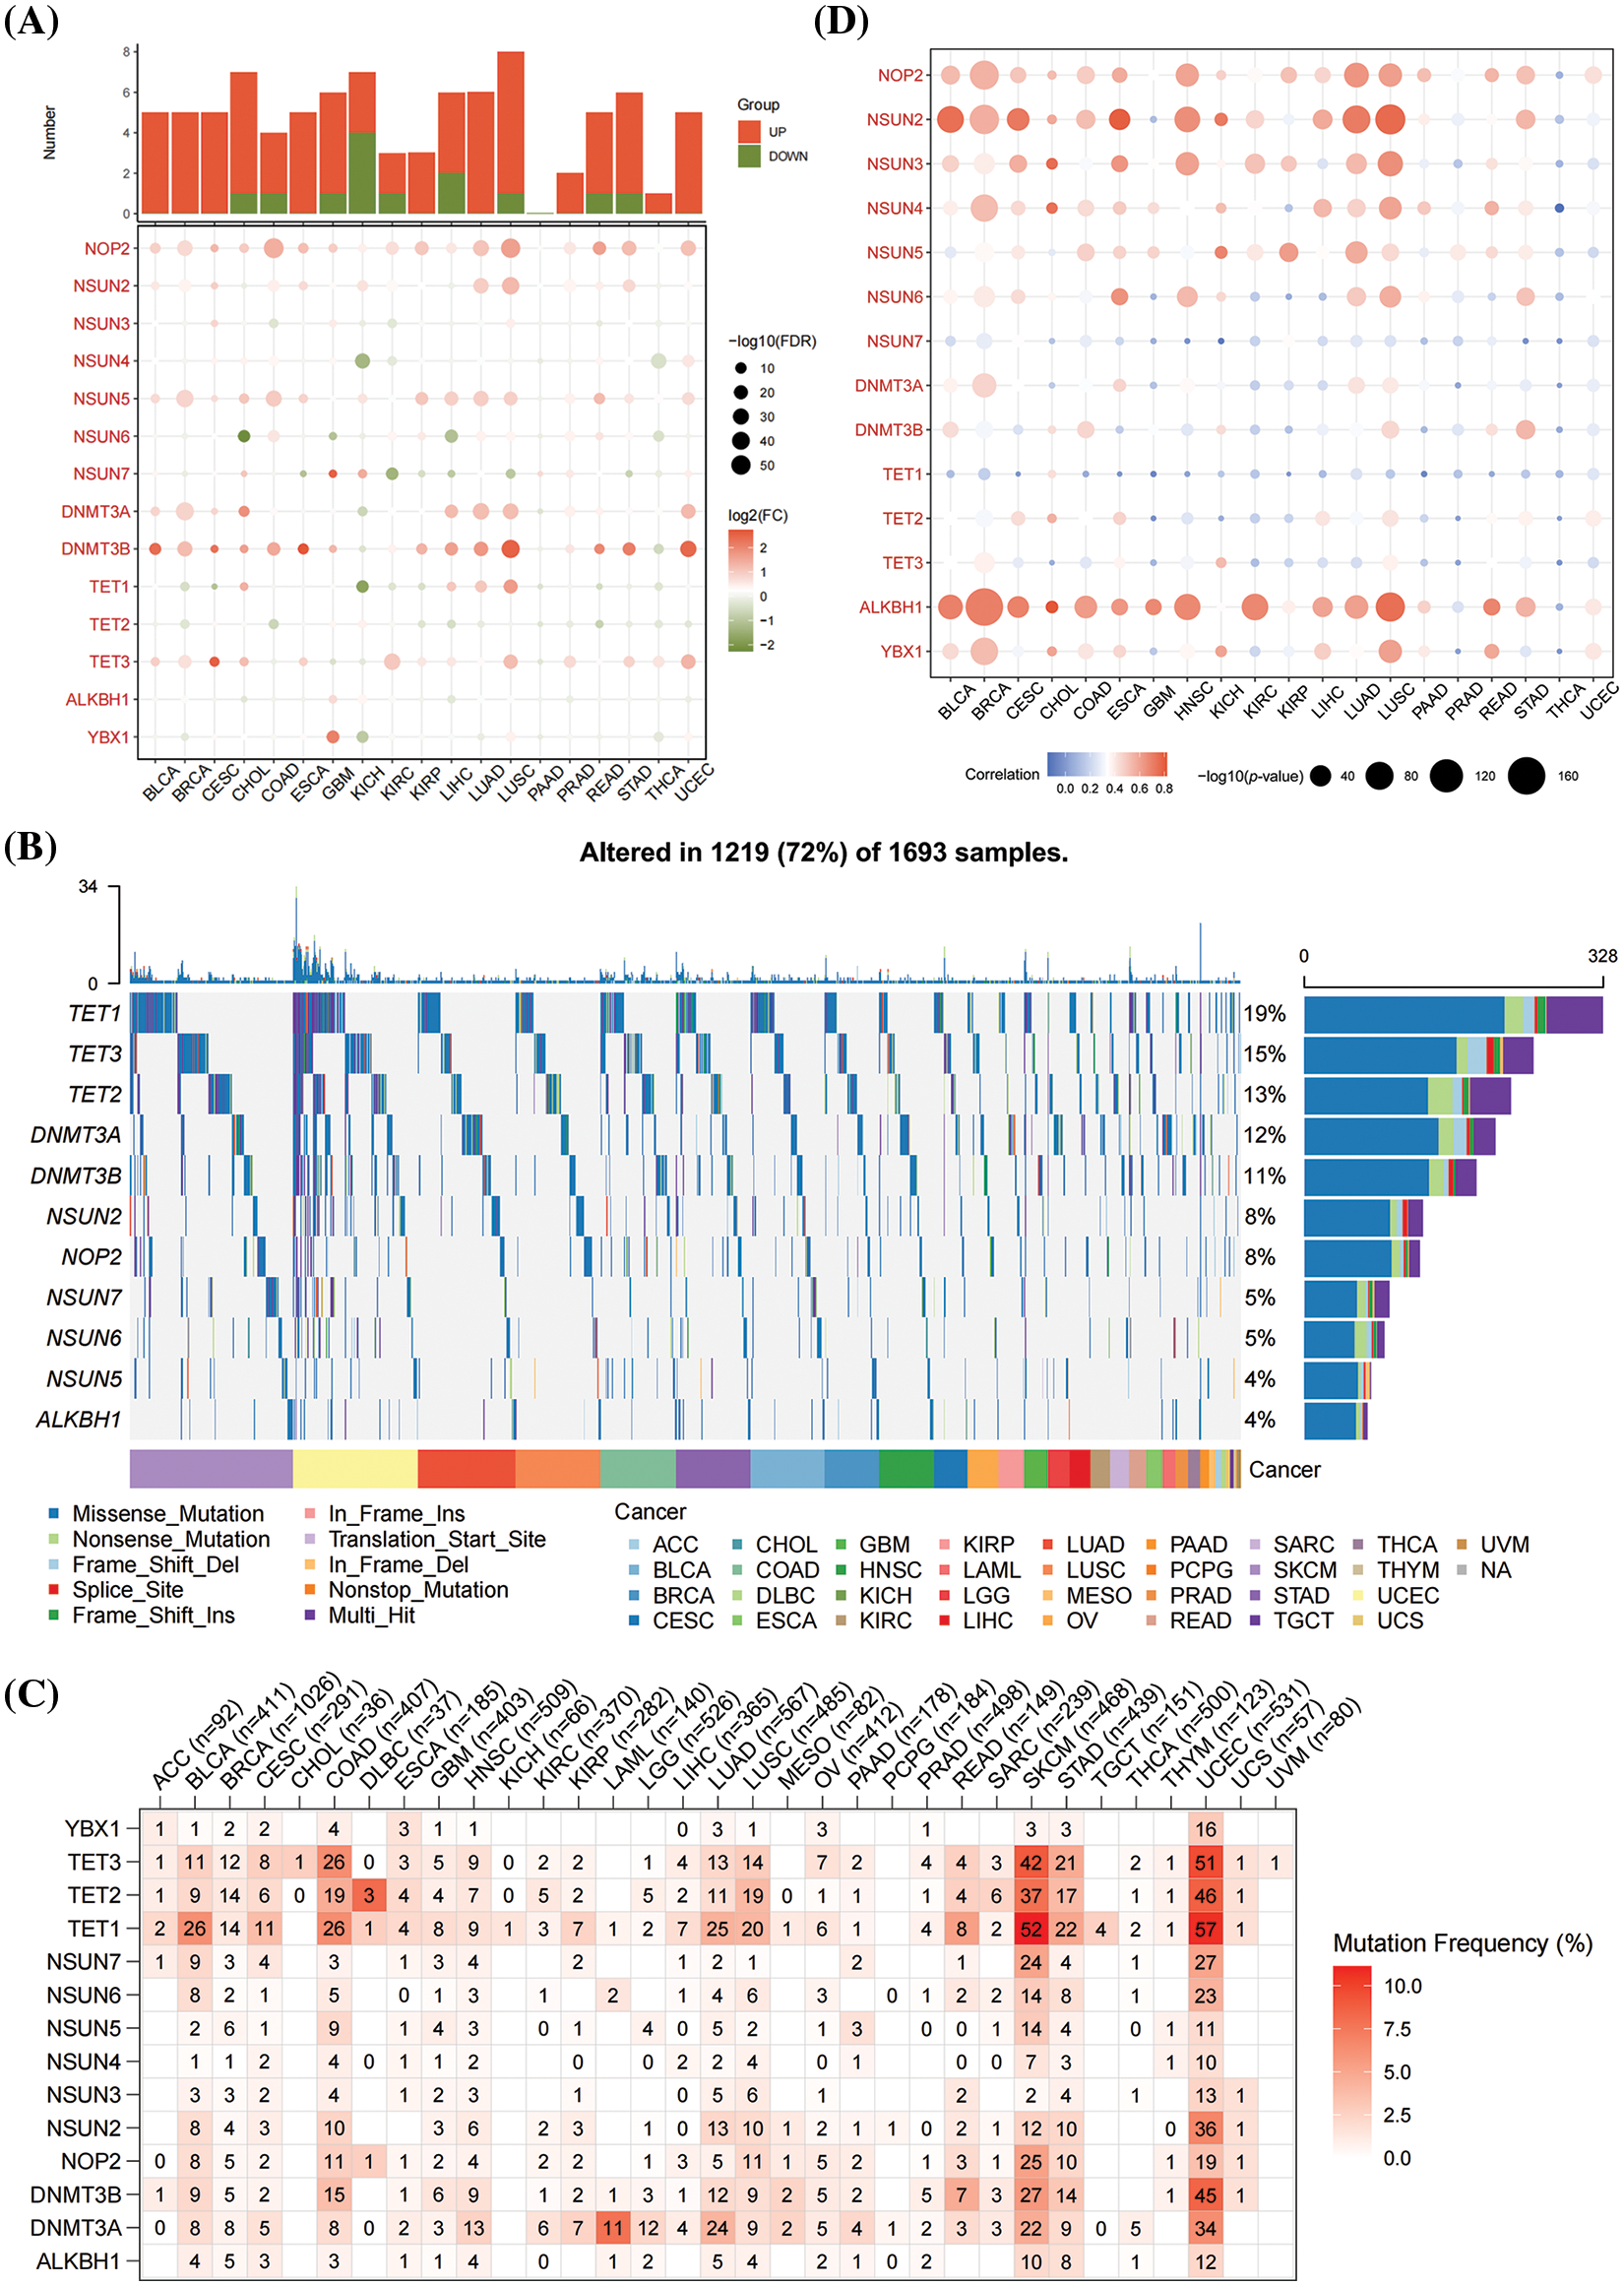
Figure 11: Pan-cancer analysis of m5CMRs. (A) Pan-cancer analysis of the expression levels of 14 m5CMRs. (B–C) Pan-cancer analysis of the somatic mutation of 14 m5CMRs. (D) Pan-cancer analysis of the correlation between somatic mutation and expression levels of m5C methylation regulators.
Clinical significance of m5CMRs
Univariate COX regression analysis on 14 m5CMRs was conducted, and the results show that NSUN2, DNMT3B, ALKBH1, and YBX1 were key prognostic genes for HNSCC (p < 0.05, Table 2). This finding indicates that these four genes may be the main regulatory factors for m5C methylation in HNSCC. The four key prognostic genes were validated by analyzing the expression levels and prognostic correlations of these four genes on the HPA database (Figs. 12A–12H). The correlation between four key prognostic genes at protein expression levels and prognosis was similar to RNA expression. The high expression of NSUN2, DNMT3B, ALKBH1, and YBX1 indicates poor prognosis (Figs. 12A, 12C, 12E, 12G). In addition, at the protein expression level, the expression of four genes in the tumor tissues was significantly higher than that in the normal tissues, which is consistent with the RNA expression results (Figs. 12B, 12D, 12F, 12H).
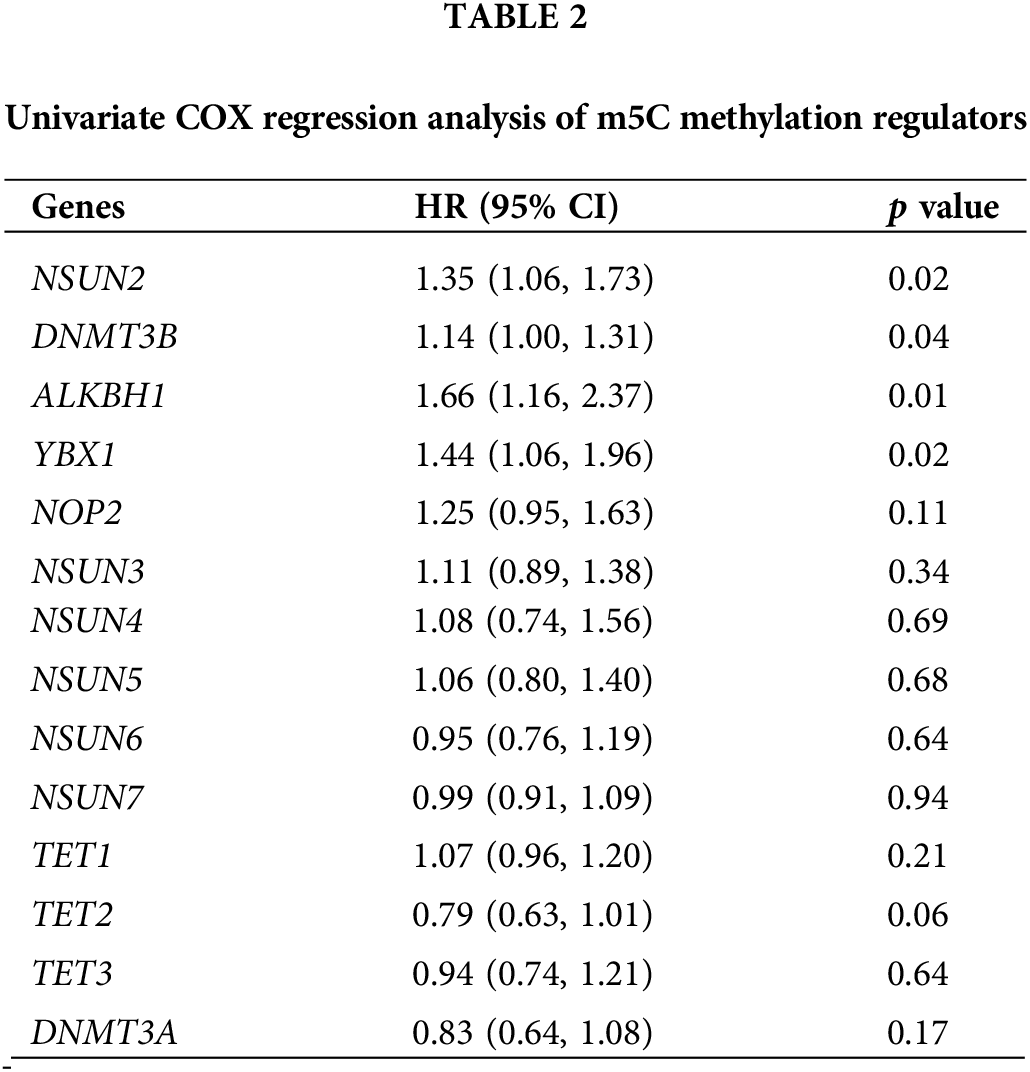
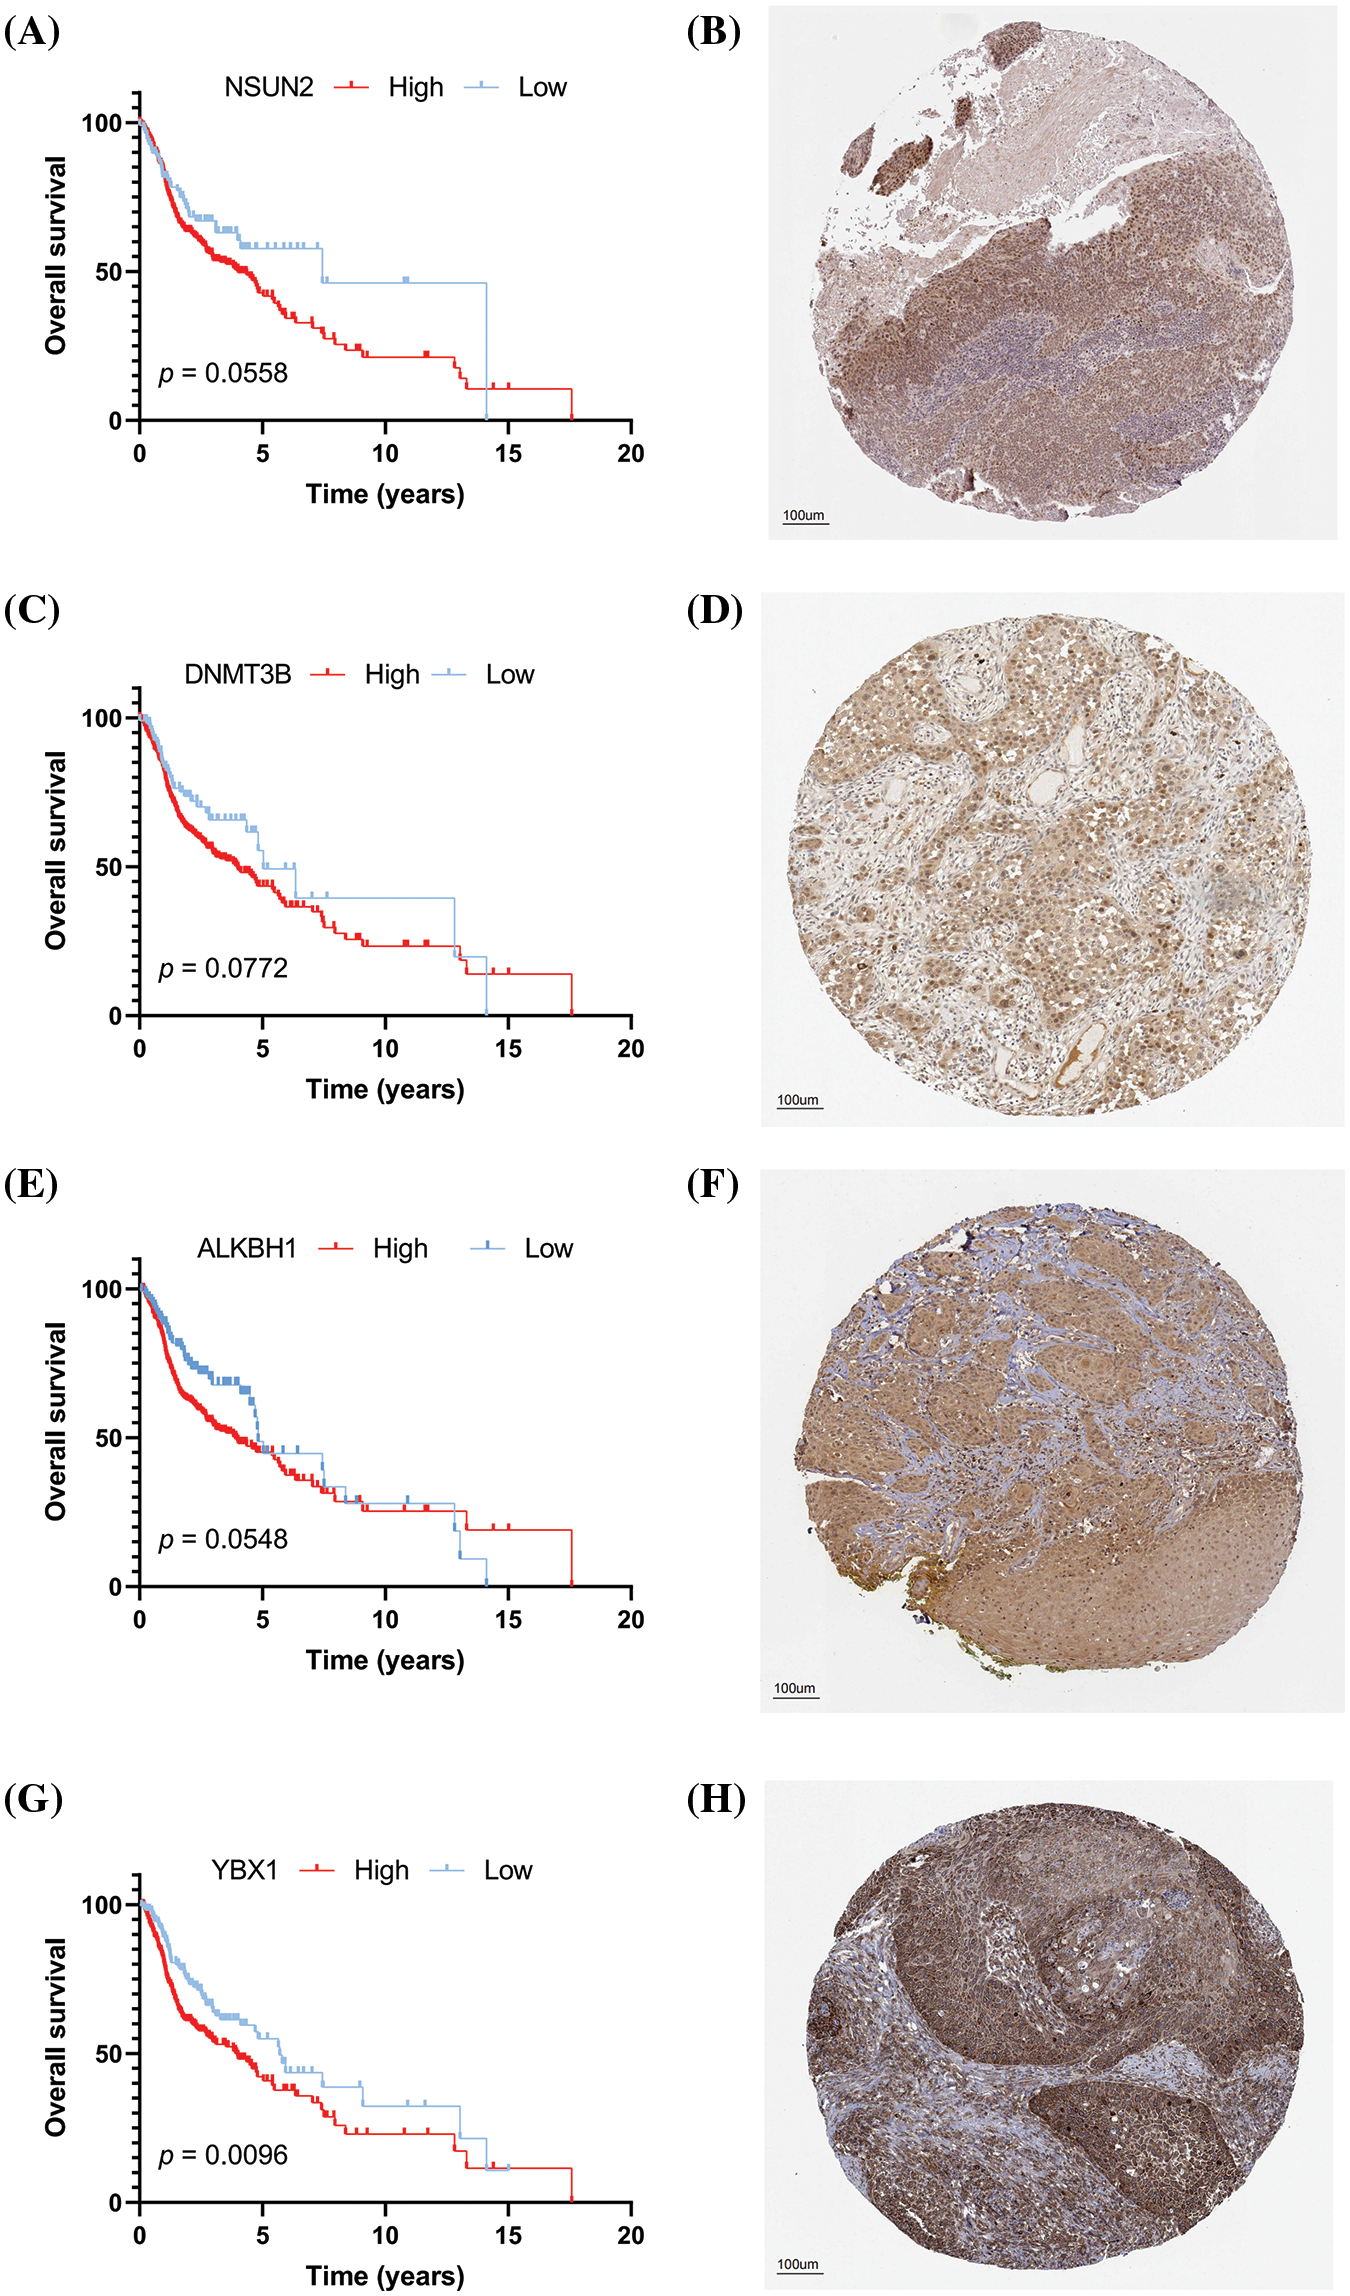
Figure 12: Clinical correlation analysis of hub prognostic m5C methylation regulators verified by HPA database (A) K–M survival curve of NSUN2; (B) Expression levels of NSUN2; (C) K–M survival curve of DNMT3B; (D) Expression levels of DNMT3B; (E) K–M survival curve of ALKBH1; (F) Expression levels of ALKBH1; (G) K–M survival curve of YBX1; and (H) Expression levels of YBX1.
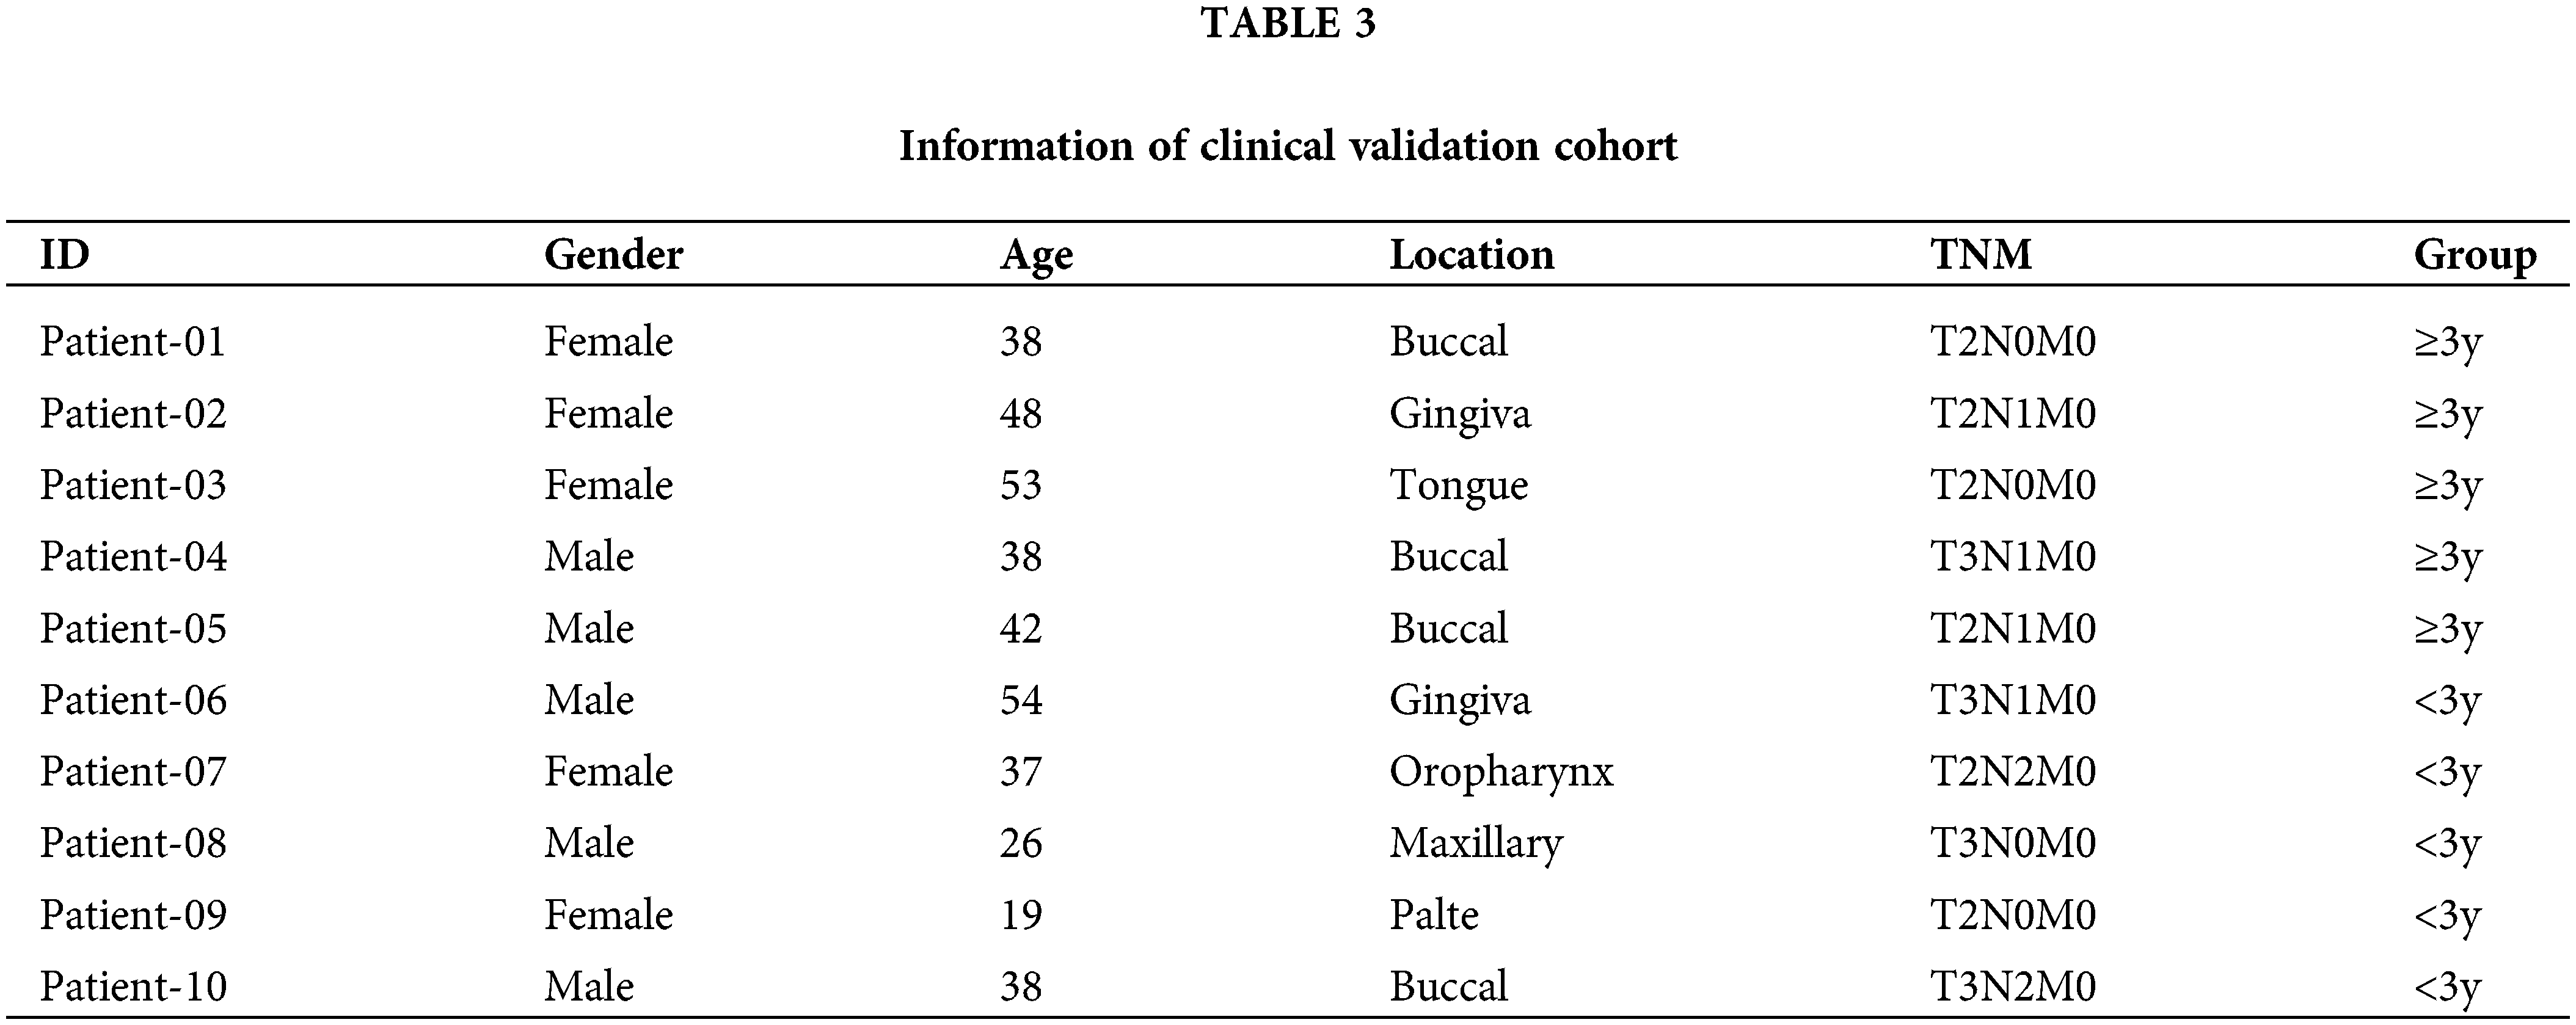
The clinical significance of key prognostic genes was verified by selecting 10 patients with clear follow-up data and performing IHC staining on their tissue sections to calculate the H-score (Figs. 13A–13L). The 10 patients included five males and five females, and their detailed information is shown in Table 3. Subsequently, the expression of four key prognostic genes, namely, NSUN2, DNMT3B, ALKBH1, and YBX1, was detected via IHC (Figs. 13A–13H). The immunohistochemical results are consistent with our previous analysis and database results. NSUN2, DNMT3B, ALKBH1, and YBX1 are significantly overexpressed in the group with survival time shorter than 3 years (<3y group), but they have low expression in the group with survival time longer than 3 years (≥3y group) (Figs. 13C, 13F, 13I, 13L). The difference between the two groups is statistically significant. This result suggests that NSUN2, DNMT3B, ALKBH1, and YBX1 are closely related to the prognosis of HNSCC, and are potential therapeutic targets.
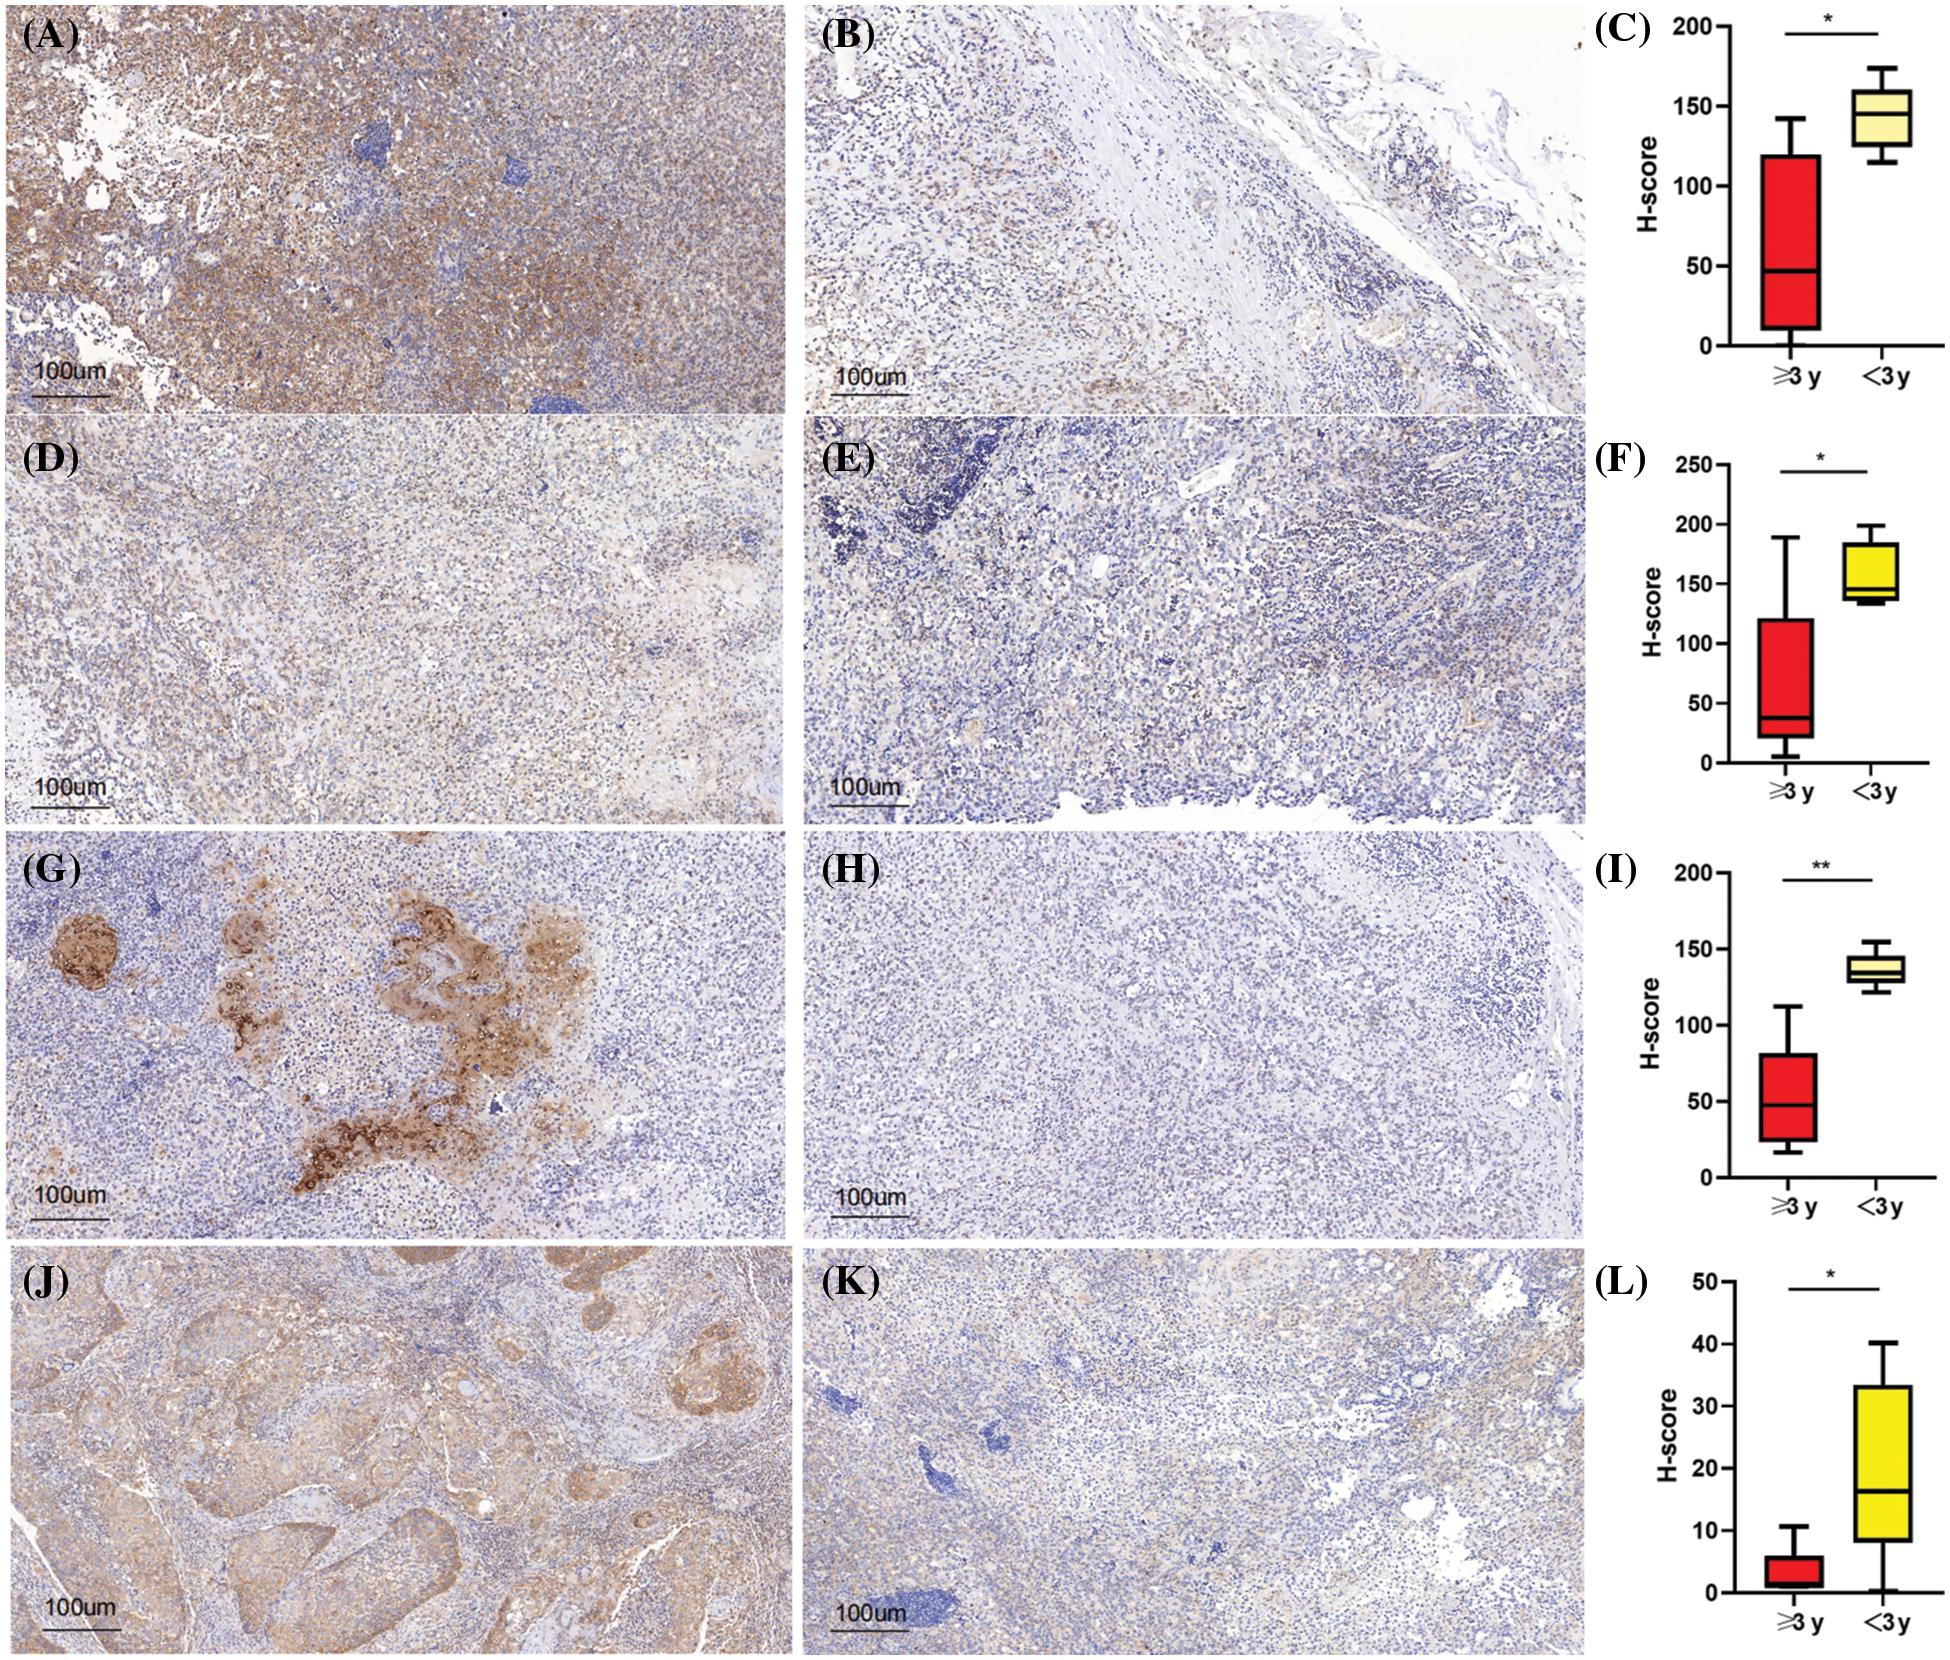
Figure 13: (A) High expression of ALKBH1; (B) Low expression of ALKBH1; (C) Distribution of H-score of ALKBH1; (D) High expression of NSUN2; (E) Low expression of NSUN2; (F) Distribution of H-score of NSUN2; (G) High expression of DNMT3B; (H) Low expression of DNMT3B; (I) Distribution of H-score of DNMT3B; (J) High expression of YBX1; (K) Low expression of YBX1; and (L) Distribution of the H-score of YBX1. *p < 0.05, **p < 0.01, ***p < 0.001.
Head and neck squamous cell carcinoma is a highly heterogeneous malignant tumor, and its carcinogenesis is a complex biological process that involves multiple molecules and mechanisms (Mroz et al., 2020; Parikh and Puram, 2022). In recent years, the advancement of gene-level sequencing technology has revealed that genetic information within the genome is not solely determined by the arrangement and combination of basic base sequences. It is also subject to epigenetic regulations at various levels, including DNA methylation and histone modification (Dimitrova et al., 2019; Liu and Pan, 2016). Numerous studies have highlighted the significant role of RNA m5C methylation in the development and treatment of various tumors, particularly in tumor suppression (Chen et al., 2019; Hu et al., 2021; Song et al., 2022). Therefore, focusing on m5CMRs could enhance the effectiveness of immunotherapy treatments. The inhibition of YBX1 can downregulate the expression of PD-L1 and activate T cells in a tumor microenvironment (Maurya et al., 2017). One study found that high expression level of m5C regulator in tumor cells increases the infiltration of M2-type macrophages and reduces the percent of M1-type macrophages (Jin et al., 2022). Another study revealed that elevated expression levels of m5C regulators correlated with decreased immune activity in TILs such as DCs, NK cells, and CD8 T cells in oral squamous cell carcinoma. However, most research tends to focus on individual TME cell types or single m5C regulators, and the collective effects of multiple m5C regulators on the overall characterizations of TME infiltration are not yet fully understood. Therefore, a deeper investigation of the expression of m5CMRs in HNSCC could illuminate the hidden molecular mechanisms, thereby uncovering potential biomarkers and therapeutic targets for HNSCC.
In this study, 14 m5C regulators were used as basis to discover two unique m5C methylation modification patterns. These patterns each exhibit significantly disparate characteristics in terms of TME cell infiltration. The m5Ccluster A is linked with an increased infiltration of B cells, Macrophages, CD4 T cells, and CD8 T cells, which corresponds to a hot tumor phenotype. Conversely, m5Ccluster B is associated with a heightened infiltration of neutrophils, indicating a cold tumor phenotype. These results are similar to some previously published (Jin et al., 2022; Maurya et al., 2017). This suggested that m5C methylation can affect the TME infiltration patterns in HNSCC. In line with the aforementioned results, the m5Ccluster B displayed a high metabolic status, including highly expressed pathways such as ascorbate, alarate, tryptophan, glycine, serine, threonine, and histidine metabolism. These pathways are typically associated with immunosuppressive properties. Considering the characteristics of TME cell infiltration in each m5Ccluster, it substantiates the dependability of our classification of immune phenotypes for varying m5C modification patterns. Hence, after thoroughly investigating the TME cell infiltration characteristics prompted by unique m5C modification patterns, the m5Ccluster A is expected to exhibit a favorable prognosis. Additionally, our research has confirmed that the differences in the mRNA transcriptome between distinct m5C modification patterns are significantly linked to m5C and immune-related biological pathways. These DEGs were identified as m5C-related signature genes. Echoing the clustering results of the m5C modification phenotypes, two genomic subtypes were discerned based on m5C signature genes. These subtypes exhibited a significant correlation with both favorable and poor prognosis, further underscoring the pivotal role of m5C modification in crafting various TME landscapes. A comprehensive analysis of m5C modification patterns will enhance our understanding of TME cell infiltration characteristics. Considering the individual heterogeneity of m5C modification, the m5C modification patterns of individual tumors need to be measured. For this purpose, a scoring system was established herein to assess the m5C modification patterns and m5Cscore of individual patients with head and neck squamous cell carcinoma. The m5C modification pattern characterized by cold tumors showed a higher m5Cscore, while the pattern characterized by hot tumors displayed a lower m5Cscore. In addition, in the GSE195832 and GSE123813 cohort with the determined immune phenotype, the m5Cscore was associated with the outcome of immunotherapy, indicating that m5C participates in immunotherapy. Interestingly, epithelial cells have higher level of m5Cscore than other cells. Moreover, compared with the epithelial cell with low m5Cscore, the epithelial cell with high m5Cscore had a close communication to T cells. Further cellchat analysis found that high-m5Cscore epithelial cells interact actively with T cells in the MIF-(CD74 + CXCR2) pathway. These results suggested that high-m5Cscore epithelial cells inhibited T cell function to affect the efficacy of immunotherapy.
The hub m5CMRs in HNSCC were screened by conducting univariate COX regression analysis of 14 m5CMRs, and NSUN2, DNMT3B, ALKBH1, and YBX1 were identified as critical prognostic genes for HNSCC. The expression of NSUN2, DNMT3B, ALKBH1, and YBX1 proteins is consistent with the RNA sequencing analysis results based on HPA data. These proteins were highly expressed in the tumor sites of head and neck squamous cell carcinoma and were associated with a poorer survival prognosis in patients. To confirm our findings, we utilized clinical tissue samples of head and neck squamous cell carcinoma collected for immunohistochemical staining. The results showed that NSUN2, DNMT3B, ALKBH1, and YBX1 were moderately to highly positive in tumor tissues, but they were weakly positive or not present in corresponding healthy tissues. NSUN2, a member of the NOP2/Sun domain family, is a key enzyme involved in catalyzing m5C in mRNA (Blanco et al., 2016; Yang et al., 2017). It plays a vital role in the methylation modification of mRNA, tRNA, and microRNA and is significantly linked to cancer development. NSUN2 expression is heightened in malignant tumors such as head and neck squamous cell carcinoma and esophageal squamous cell carcinoma (Li et al., 2018; Lu et al., 2018). Alshaker Heba and others revealed that NSUN2 mRNA and protein expression levels were elevated in breast cancer, but a low expression level was observed in normal breast epithelial cells and tissues (Alshaker et al., 2019). Reducing the NSUN2 gene lowered the growth and migration potential of breast cancer cells, while an increase in NSUN2 amplified these abilities (Alshaker et al., 2019). Wang et al. (2023) observed in their study of bladder urothelial carcinoma that ALYREF could identify the heavily methylated m5C site NSUN2, causing NSUN2 to rise in bladder urothelial carcinoma. Clinically, patients with an increase in the co-expression of the ALYREF/RABL6/TK1 axis have the worst overall survival rate (Wang et al., 2023). These findings highlight the m5C-dependent mutual regulation between the nuclear reader ALYREF and the m5C writer NSUN2, leading to the progression of bladder urothelial carcinoma by activating oncogenic RNA through promoting splicing and maintaining stability. DNMT3B (DNA methyltransferase 3B) is a DNA methyltransferase, which is a key enzyme in DNA methylation that can stimulate tumor cell proliferation, migration, and invasion by regulating the promoter of the regulator gene (Caputi et al., 2021; Chang et al., 2021). Research in bladder urothelial carcinoma showed that the DNMT3B-mediated methylation of the transfer inhibitory factor 1 (MTSS1) promoter can suppress its transcription at the epigenetic level (Li et al., 2016). The ALKB homolog 1 (ALKBH1) is a 2-oxo-neneneba glutaric acid (2-OG or α-KG) and iron (II) dependent dioxygenase, which exhibits six diverse enzyme activities (Ma et al., 2019; Tian et al., 2020). Its removal activity can catalyze the elimination of m6A (N6-methyladenosine), m5C, and m3C (3-methylcytidine) from DNA (Esteve-Puig et al., 2020). ALKBH1 is an enzyme of significant importance in cellular life processes, because it catalyzes the removal of m6A (N6-methyladenosine), m5C, and m3C (3-methylcytidine) from DNA. A deficiency in ALKBH1 can lead to serious developmental abnormalities and neurodevelopmental disorders in mammals. Recent studies have linked ALKBH1 to the initiation and progression of tumors (Esteve-Puig et al., 2020). It can lower DNA m6A methylation and stimulate the self-renewal and tumorigenicity of glioma (Esteve-Puig et al., 2020). However, it can suppress RNA m6A methylation, thus promoting lung cancer progression. YBX1 is a versatile protein that can bind to DNA and RNA. It possesses three domains, namely, the classical Cold shock response protein domain (CSD), the alanine/proline-rich N-terminal domain (A/P domain), and the lengthy C-terminal domain (CTD) featuring alternating positive and negative amino acids (Kuwano et al., 2019; Liang et al., 2019). YBX1 is implicated in various gene disorders related to cell proliferation and survival, drug resistance, and chromatin instability in cancer (Hong et al., 2022; Maier et al., 2019).
In conclusion, the m5Cscore can be utilized in a clinical environment to offer a thorough evaluation of m5C methylation modification patterns and their associated TME cell infiltration characteristics specific to each patient. This information can aid in pinpointing tumors’ immune phenotypes, offering invaluable insights to refine clinical practices for enhanced outcomes. Furthermore, m5Cscore could serve as an independent prognostic indicator for forecasting patients’ survival rates. The effectiveness of patients’ clinical response to antiPD-1/PD-L1 immunotherapy could also be predicted using the m5Cscore. Most importantly, this research has generated several innovative perspectives for cancer immunotherapy. Targeting m5C regulators or m5C phenotype-related genes to alter the m5C modification patterns and subsequently reverse the unfavorable TME cell infiltration characteristics, specifically transforming “cold tumors” into “hot tumors”. These outcomes are instrumental in advancing the development of new drug combination strategies or novel immunotherapeutic agents in the future. Our findings offer fresh insights for enhancing patients’ clinical response to immunotherapy, identifying distinct tumor immune phenotypes, and fostering personalized cancer immunotherapy in the future. Nevertheless, considering the small size of the clinical sample and lack of extended follow-up data, the sample size needs to be increased to further examine their correlation with clinical medical records parameters and the survival prognosis of patients with this condition. Future work will involve experiments in cell lines and animal models to delve into the biological functions and molecular mechanisms of NSUN2, DNMT3B, ALKBH1, and YBX1 in relation to head and neck squamous cell carcinoma cells.
The m5C methylation gene is linked to the prognosis of head and neck squamous cell carcinoma. Varying m5C methylation regulatory patterns are involved in head and neck squamous cell carcinoma, in which the groups with high m5C methylation demonstrated an immunosuppressive microenvironment. The m5C methylation score of epithelial cells in head and neck squamous cell carcinoma is higher than that in other cells, and the m5C methylation in these epithelial cells influences the tumor’s anti-tumor immune capability. NSUN2, DNMT3B, ALKBH1, and YBX1 are key prognostic genes for m5C methylation and may be primary regulatory genes for m5C methylation in head and neck squamous cell carcinoma, which is linked to a poor prognosis.
Acknowledgement: None.
Funding Statement: This work was supported by grants from the Guangdong Science and Technology Development Fund (Grant No. 2019A1515110662).
Author Contributions: Conceive and design the study: SDH, TJL, and YCY; data acquisition and analysis: SDH, TJL, and PSL; results interpretation: SDH, XL, JJW, and ZFC; write the original manuscript: SDH and TJL; review and revise the manuscript: SDH, RSZ, and ZJH.
Availability of Data and Materials: In this study, the publicly available datasets were used, and these data can be found using the following methods: the patients with HNSCC from TCGA dataset, https://www.cancer.gov/tcga; GSE41613, GSE42743, GSE65858, GSE195832 and GSE123813 datasets from GEO datasets, https://www.ncbi.nlm.nih.gov/geo/.
Ethics Approval: This research project has been approved by the Ethics Committee of hospital of stomatology Sun Yat-sen University (approval no. KQEC-2022-15-01). All participants have signed the informed consent form and are informed of relevant precautions. In addition, they have the right to withdraw and request the destruction of their data.
Conflicts of Interest: The authors declare that they have no conflicts of interest to report regarding the present study.
References
Alshaker H, Wang Q, Brewer D, Pchejetski D (2019). Transcriptome-wide effects of sphingosine kinases knockdown in metastatic prostate and breast cancer cells: Implications for therapeutic targeting. Frontiers in Pharmacology 10: 303. https://doi.org/10.3389/fphar.2019.00303 [Google Scholar] [PubMed] [CrossRef]
Amaral MN, Faísca P, Ferreira HA, Gaspar MM, Reis CP (2022). Current insights and progress in the clinical management of head and neck cancer. Cancers 14: 6079. https://doi.org/10.3390/cancers14246079 [Google Scholar] [PubMed] [CrossRef]
Balachander K, Priyadharsini JV, Roy A, Paramasivam A (2022). Emerging role of RNA m5C modification in cardiovascular diseases. Journal of Cardiovascular Translational Research 16: 598–605. https://doi.org/10.1007/s12265-022-10336-8 [Google Scholar] [PubMed] [CrossRef]
Blanco S, Bandiera R, Popis M, Hussain S, Lombard P et al. (2016). Stem cell function and stress response are controlled by protein synthesis. Nature 534: 335–340. https://doi.org/10.1038/nature18282 [Google Scholar] [PubMed] [CrossRef]
Caputi FF, Carboni L, Rullo L, Alessandrini I, Balzani E, Melotti RM, Romualdi P, Candeletti S, Fanelli A (2021). An exploratory pilot study of changes in global DNA methylation in patients undergoing major breast surgery under opioid-based general anesthesia. Frontiers in Pharmacology 12: 733577. https://doi.org/10.3389/fphar.2021.733577 [Google Scholar] [PubMed] [CrossRef]
Chang X, Ma J, Xue X, Wang G, Yan T, Su L, Han X, Zhou H, Hou L (2021). DNMT family induces down-regulation of NDRG1 via DNA methylation and clinicopathological significance in gastric cancer. PeerJ 9: e12146. https://doi.org/10.7717/peerj.12146 [Google Scholar] [PubMed] [CrossRef]
Charoentong P, Finotello F, Angelova M, Mayer C, Efremova M, Rieder D, Hackl H, Trajanoski Z (2017). Pan-cancer immunogenomic analyses reveal genotype-immunophenotype relationships and predictors of response to checkpoint blockade. Cell Reports 18: 248–262. https://doi.org/10.1016/j.celrep.2016.12.019 [Google Scholar] [PubMed] [CrossRef]
Chen X, Li A, Sun BF, Yang Y, Han YN et al. (2019). 5-methylcytosine promotes pathogenesis of bladder cancer through stabilizing mRNAs. Nature Cell Biology 21: 978–990. https://doi.org/10.1038/s41556-019-0361-y [Google Scholar] [PubMed] [CrossRef]
Dimitrova DG, Teysset L, Carre C (2019). RNA 2′-O-methylation (Nm) modification in human diseases. Genes 10: 117. https://doi.org/10.3390/genes10020117 [Google Scholar] [PubMed] [CrossRef]
Esteve-Puig R, Bueno-Costa A, Esteller M (2020). Esteller, writers, readers and erasers of RNA modifications in cancer. Cancer Letters 474: 127–137. https://doi.org/10.1016/j.canlet.2020.01.021 [Google Scholar] [PubMed] [CrossRef]
Gao L, Chen R, Sugimoto M, Mizuta M, Zhou L, Kishimoto Y, Huang X, Omori K (2021). The RNA methylation modification 5-methylcytosine impacts immunity characteristics, prognosis and progression of oral squamous cell carcinoma by bioinformatics analysis. Frontiers in Bioengineering and Biotechnology 9: 760724. https://doi.org/10.3389/fbioe.2021.760724 [Google Scholar] [PubMed] [CrossRef]
Hong X, Li Q, Li J, Chen K, He Q et al. (2022). CircIPO7 promotes nasopharyngeal carcinoma metastasis and cisplatin chemoresistance by facilitating YBX1 nuclear localization. Clinical Cancer Research 28: 4521–4535. https://doi.org/10.1158/1078-0432.CCR-22-0991 [Google Scholar] [PubMed] [CrossRef]
Hu Y, Chen C, Tong X, Chen S, Hu X et al. (2021). NSUN2 modified by SUMO-2/3 promotes gastric cancer progression and regulates mRNA m5C methylation. Cell Death & Disease 12: 842. https://doi.org/10.1038/s41419-021-04127-3 [Google Scholar] [PubMed] [CrossRef]
Jin S, Li J, Shen Y, Wu Y, Zhang Z, Ma H (2022). RNA 5-methylcytosine regulator NSUN3 promotes tumor progression through regulating immune infiltration in head and neck squamous cell carcinoma. Oral Diseases 12: 6841. https://doi.org/10.1111/odi.14357 [Google Scholar] [PubMed] [CrossRef]
Johnson DE, Barbara B, René LC, Vivian WYL, Julie EB, Jennifer RG (2020). Head and neck squamous cell carcinoma. Nature Reviews Disease Primers 6: 92. https://doi.org/10.1038/s41572-020-00224-3 [Google Scholar] [PubMed] [CrossRef]
Kuwano M, Shibata T, Watari K, Ono M (2019). Oncogenic Y-box binding protein-1 as an effective therapeutic target in drug-resistant cancer. Cancer Science 110: 1536–1543. https://doi.org/10.1111/cas.14006 [Google Scholar] [PubMed] [CrossRef]
Lechner M, Liu J, Masterson L, Fenton TR (2022). HPV-associated oropharyngeal cancer: Epidemiology, molecular biology and clinical management. Nature Reviews Clinical Oncology 19: 306–327. https://doi.org/10.1038/s41571-022-00603-7 [Google Scholar] [PubMed] [CrossRef]
Lee J, Kunaratnam V, Kim C, Pienkowski M, Hueniken K et al. (2023). Cigarette smoking cessation, duration of smoking abstinence, and head and neck squamous cell carcinoma prognosis. Cancer 129: 867–877. https://doi.org/10.1002/cncr.34620 [Google Scholar] [PubMed] [CrossRef]
Li Y, Li J, Luo M, Zhou C, Shi X, Yang W, Lu Z, Chen Z, Sun N, He J (2018). Novel long noncoding RNA NMR promotes tumor progression via NSUN2 and BPTF in esophageal squamous cell carcinoma. Cancer Letters 430: 57–66. https://doi.org/10.1016/j.canlet.2018.05.013 [Google Scholar] [PubMed] [CrossRef]
Li XD, Zhang JX, Jiang LJ, Wang FW, Liu LL et al. (2016). Overexpression of maelstrom promotes bladder urothelial carcinoma cell aggressiveness by epigenetically downregulating MTSS1 through DNMT3B. Oncogene 35: 6281–6292. https://doi.org/10.1038/onc.2016.165 [Google Scholar] [PubMed] [CrossRef]
Liang C, Ma Y, Yong L, Yang C, Wang P, Liu X, Zhu B, Zhou H, Liu X, Liu Z (2019). Y-box binding protein-1 promotes tumorigenesis and progression via the epidermal growth factor receptor/AKT pathway in spinal chordoma. Cancer Science 110: 166–179. https://doi.org/10.1111/cas.13875 [Google Scholar] [PubMed] [CrossRef]
Liang W, Yi H, Mao C, Meng Q, Wu X, Li S, Xue J (2022). Research progress of RNA methylation modification in colorectal cancer. Frontiers in Pharmacology 13: 903699. [Google Scholar] [PubMed]
Liu N, Pan T (2016). N6-methyladenosine-encoded epitranscriptomics. Nature Structural & Molecular Biology 23: 98–102. https://doi.org/10.1038/nsmb.3162 [Google Scholar] [PubMed] [CrossRef]
Lohavanichbutr P, Mendez E, Holsinger FC, Rue TC, Zhang Y et al. (2013). A 13-gene signature prognostic of HPV-negative OSCC: Discovery and external validation. Clinical Cancer Research 19: 1197–1203. https://doi.org/10.1158/1078-0432.CCR-12-2647 [Google Scholar] [PubMed] [CrossRef]
Lu L, Zhu G, Zeng H, Xu Q, Holzmann K (2018). High tRNA transferase NSUN2 gene expression is associated with poor prognosis in head and neck squamous carcinoma. Cancer Investigation 36: 246–253. https://doi.org/10.1080/07357907.2018.1466896 [Google Scholar] [PubMed] [CrossRef]
Ma CJ, Ding JH, Ye TT, Yuan BF, Feng YQ (2019). AlkB homologue 1 demethylates N(3)-methylcytidine in mRNA of mammals. ACS Chemical Biology 14: 1418–1425. https://doi.org/10.1021/acschembio.8b01001 [Google Scholar] [PubMed] [CrossRef]
Maier E, Attenberger F, Tiwari A, Lettau K, Rebholz S, Fehrenbacher B, Schaller M, Gani C, Toulany M (2019). Dual targeting of Y-box binding protein-1 and Akt inhibits proliferation and enhances the chemosensitivity of colorectal cancer cells. Cancers 11: 562. https://doi.org/10.3390/cancers11040562 [Google Scholar] [PubMed] [CrossRef]
Maurya PK, Mishra A, Yadav BS, Singh S, Kumar P, Chaudhary A, Srivastava S, Murugesan SN, Mani A (2017). Role of Y box protein-1 in cancer: As potential biomarker and novel therapeutic target. Journal of Cancer 8: 1900–1907. https://doi.org/10.7150/jca.17689 [Google Scholar] [PubMed] [CrossRef]
McGinnis CS, Murrow LM, Gartner ZJ (2019). DoubletFinder: Doublet detection in single-cell RNA sequencing data using artificial nearest neighbors. Cell Systems 8: 329–337. https://doi.org/10.1016/j.cels.2019.03.003 [Google Scholar] [PubMed] [CrossRef]
Mroz EA, Patel KB, Rocco JW (2020). Intratumor heterogeneity could inform the use and type of postoperative adjuvant therapy in patients with head and neck squamous cell carcinoma. Cancer 126: 1895–1904. https://doi.org/10.1002/cncr.32742 [Google Scholar] [PubMed] [CrossRef]
Nam IC, Park JO, Kim CS, Park SJ, Lee DH, Kim HB, Han K, Joo YH (2022). Association of smoking status, duration and amount with the risk of head and neck cancer subtypes: A national population-based study. American Journal of Cancer Research 12: 4815–4824. [Google Scholar] [PubMed]
Obradovic A, Graves D, Korrer M, Wang Y, Roy S et al. (2022). Immunostimulatory cancer-associated fibroblast subpopulations can predict immunotherapy response in head and neck cancer. Clinical Cancer Research 28: 2094–2109. https://doi.org/10.1158/1078-0432.CCR-21-3570 [Google Scholar] [PubMed] [CrossRef]
Pan J, Huang Z, Xu Y (2021). m5C RNA methylation regulators predict prognosis and regulate the immune microenvironment in lung squamous cell carcinoma. Frontiers in Oncology 11: 657466. https://doi.org/10.3389/fonc.2021.657466 [Google Scholar] [PubMed] [CrossRef]
Parikh AS, Puram SV (2022). RNA sequencing and expression heterogeneity in head and neck cancer. Cancer Cytopathology 130: 842–843. https://doi.org/10.1002/cncy.22622 [Google Scholar] [PubMed] [CrossRef]
Saloura V, Vougiouklakis T, Sievers C, Burkitt K, Nakamura Y, Hager G, Waes C (2018). The role of protein methyltransferases as potential novel therapeutic targets in squamous cell carcinoma of the head and neck. Oral Oncology 81: 100–108. https://doi.org/10.1016/j.oraloncology.2018.04.014 [Google Scholar] [PubMed] [CrossRef]
Solomon B, Young RJ, Rischin D (2018). Head and neck squamous cell carcinoma: Genomics and emerging biomarkers for immunomodulatory cancer treatments. Seminars in Cancer Biology 52: 228–240. https://doi.org/10.1016/j.semcancer.2018.01.008 [Google Scholar] [PubMed] [CrossRef]
Song H, Zhang J, Liu B, Xu J, Cai B, Yang H, Straube J, Yu X, Ma T (2022). Biological roles of RNA m(5)C modification and its implications in cancer immunotherapy. Biomarker Research 10: 15. https://doi.org/10.1186/s40364-022-00362-8 [Google Scholar] [PubMed] [CrossRef]
Sung H, Jacques F, Rebecca L, Mathieu L, Isabelle S, Ahmedin J, Freddie B (2021). Global cancer statistics 2020: GLOBOCAN estimates of incidence and mortality worldwide for 36 cancers in 185 countries. CA: A Cancer Journal for Clinicians 71: 209–249. https://doi.org/10.3322/caac.21660 [Google Scholar] [PubMed] [CrossRef]
Tian LF, Liu YP, Chen L, Tang Q, Wu W, Sun W, Chen Z, Yan XX (2020). Structural basis of nucleic acid recognition and 6mA demethylation by human ALKBH1. Cell Research 30: 272–275. https://doi.org/10.1038/s41422-019-0233-9 [Google Scholar] [PubMed] [CrossRef]
Uhlen M, Fagerberg L, Hallstrom BM, Lindskog C, Oksvold P et al. (2015). Proteomics. Tissue-based map of the human proteome. Science 347: 1260419. https://doi.org/10.1126/science.1260419 [Google Scholar] [PubMed] [CrossRef]
Wang N, Chen RX, Deng MH, Wei WS, Zhou ZH et al. (2023). m(5)C-dependent cross-regulation between nuclear reader ALYREF and writer NSUN2 promotes urothelial bladder cancer malignancy through facilitating RABL6/TK1 mRNAs splicing and stabilization. Cell Death & Disease 14: 139. https://doi.org/10.1038/s41419-023-05661-y [Google Scholar] [PubMed] [CrossRef]
Wang P, Wu M, Tu Z, Tao C, Hu Q, Li K, Zhu X, Huang K (2020). Identification of RNA: 5-methylcytosine methyltransferases-related signature for predicting prognosis in glioma. Frontiers in Oncology 10: 1119. https://doi.org/10.3389/fonc.2020.01119 [Google Scholar] [PubMed] [CrossRef]
Wichmann G, Rosolowski M, Krohn K, Kreuz M, Boehm A et al. (2015). The role of HPV RNA transcription, immune response-related gene expression and disruptive TP53 mutations in diagnostic and prognostic profiling of head and neck cancer. International Journal of Cancer 137: 2846–2857. https://doi.org/10.1002/ijc.29649 [Google Scholar] [PubMed] [CrossRef]
Xia CF, Dong XS, Li H, Cao MM, Sun DQ et al. (2022). Cancer statistics in China and United States, 2022: Profiles, trends, and determinants. Chinese Medical Journal 135: 584–590. https://doi.org/10.1097/CM9.0000000000002108 [Google Scholar] [PubMed] [CrossRef]
Yang TH, Xirasagar S, Cheng YF, Chen CS, Chang WP, Lin HC (2023). Trends in the incidence of head and neck cancer: A nationwide population-based study. Oral Oncology 140: 106391. https://doi.org/10.1016/j.oraloncology.2023.106391 [Google Scholar] [PubMed] [CrossRef]
Yang X, Yang Y, Sun BF, Chen YS, Xu JW et al. (2017). 5-methylcytosine promotes mRNA export—NSUN2 as the methyltransferase and ALYREF as an m(5)C reader. Cell Research 27: 606–625. https://doi.org/10.1038/cr.2017.55 [Google Scholar] [PubMed] [CrossRef]
Yost KE, Satpathy AT, Wells DK, Qi Y, Wang C et al. (2019). Clonal replacement of tumor-specific T cells following PD-1 blockade. Nature Medicine 25: 1251–1259. https://doi.org/10.1038/s41591-019-0522-3 [Google Scholar] [PubMed] [CrossRef]
Zhao Y, Chen D, Yin J, Xie J, Sun CY, Lu M (2022). Comprehensive analysis of tumor immune microenvironment characteristics for the prognostic prediction and immunotherapy of oral squamous cell carcinoma. Frontiers in Genetics 13: 788580. https://doi.org/10.3389/fgene.2022.788580 [Google Scholar] [PubMed] [CrossRef]
Cite This Article
 Copyright © 2023 The Author(s). Published by Tech Science Press.
This work is licensed under a Creative Commons Attribution 4.0 International License , which permits unrestricted use, distribution, and reproduction in any medium, provided the original work is properly cited.
 Downloads
 Citation Tools