
 Submit a Paper
 Propose a Special lssue
 Open Access
ARTICLE

A novel oxaliplatin-resistant gene signatures predicting survival of patients in colorectal cancer
1 Department of General Surgery, The Second Affiliated Hospital of Nanjing Medical University, Nanjing, China
2 Department of Oncology, The Second Affiliated Hospital of Nanjing Medical University, Nanjing, China
* Corresponding Author: JIANPING ZHANG. Email:
(This article belongs to the Special Issue: Frontiers in cancer: tumor microenvironment)
BIOCELL 2024, 48(2), 253-269. https://doi.org/10.32604/biocell.2023.028336
Received 15 December 2022; Accepted 01 June 2023; Issue published 23 February 2024
 View Full Text
 Download PDF
Abstract
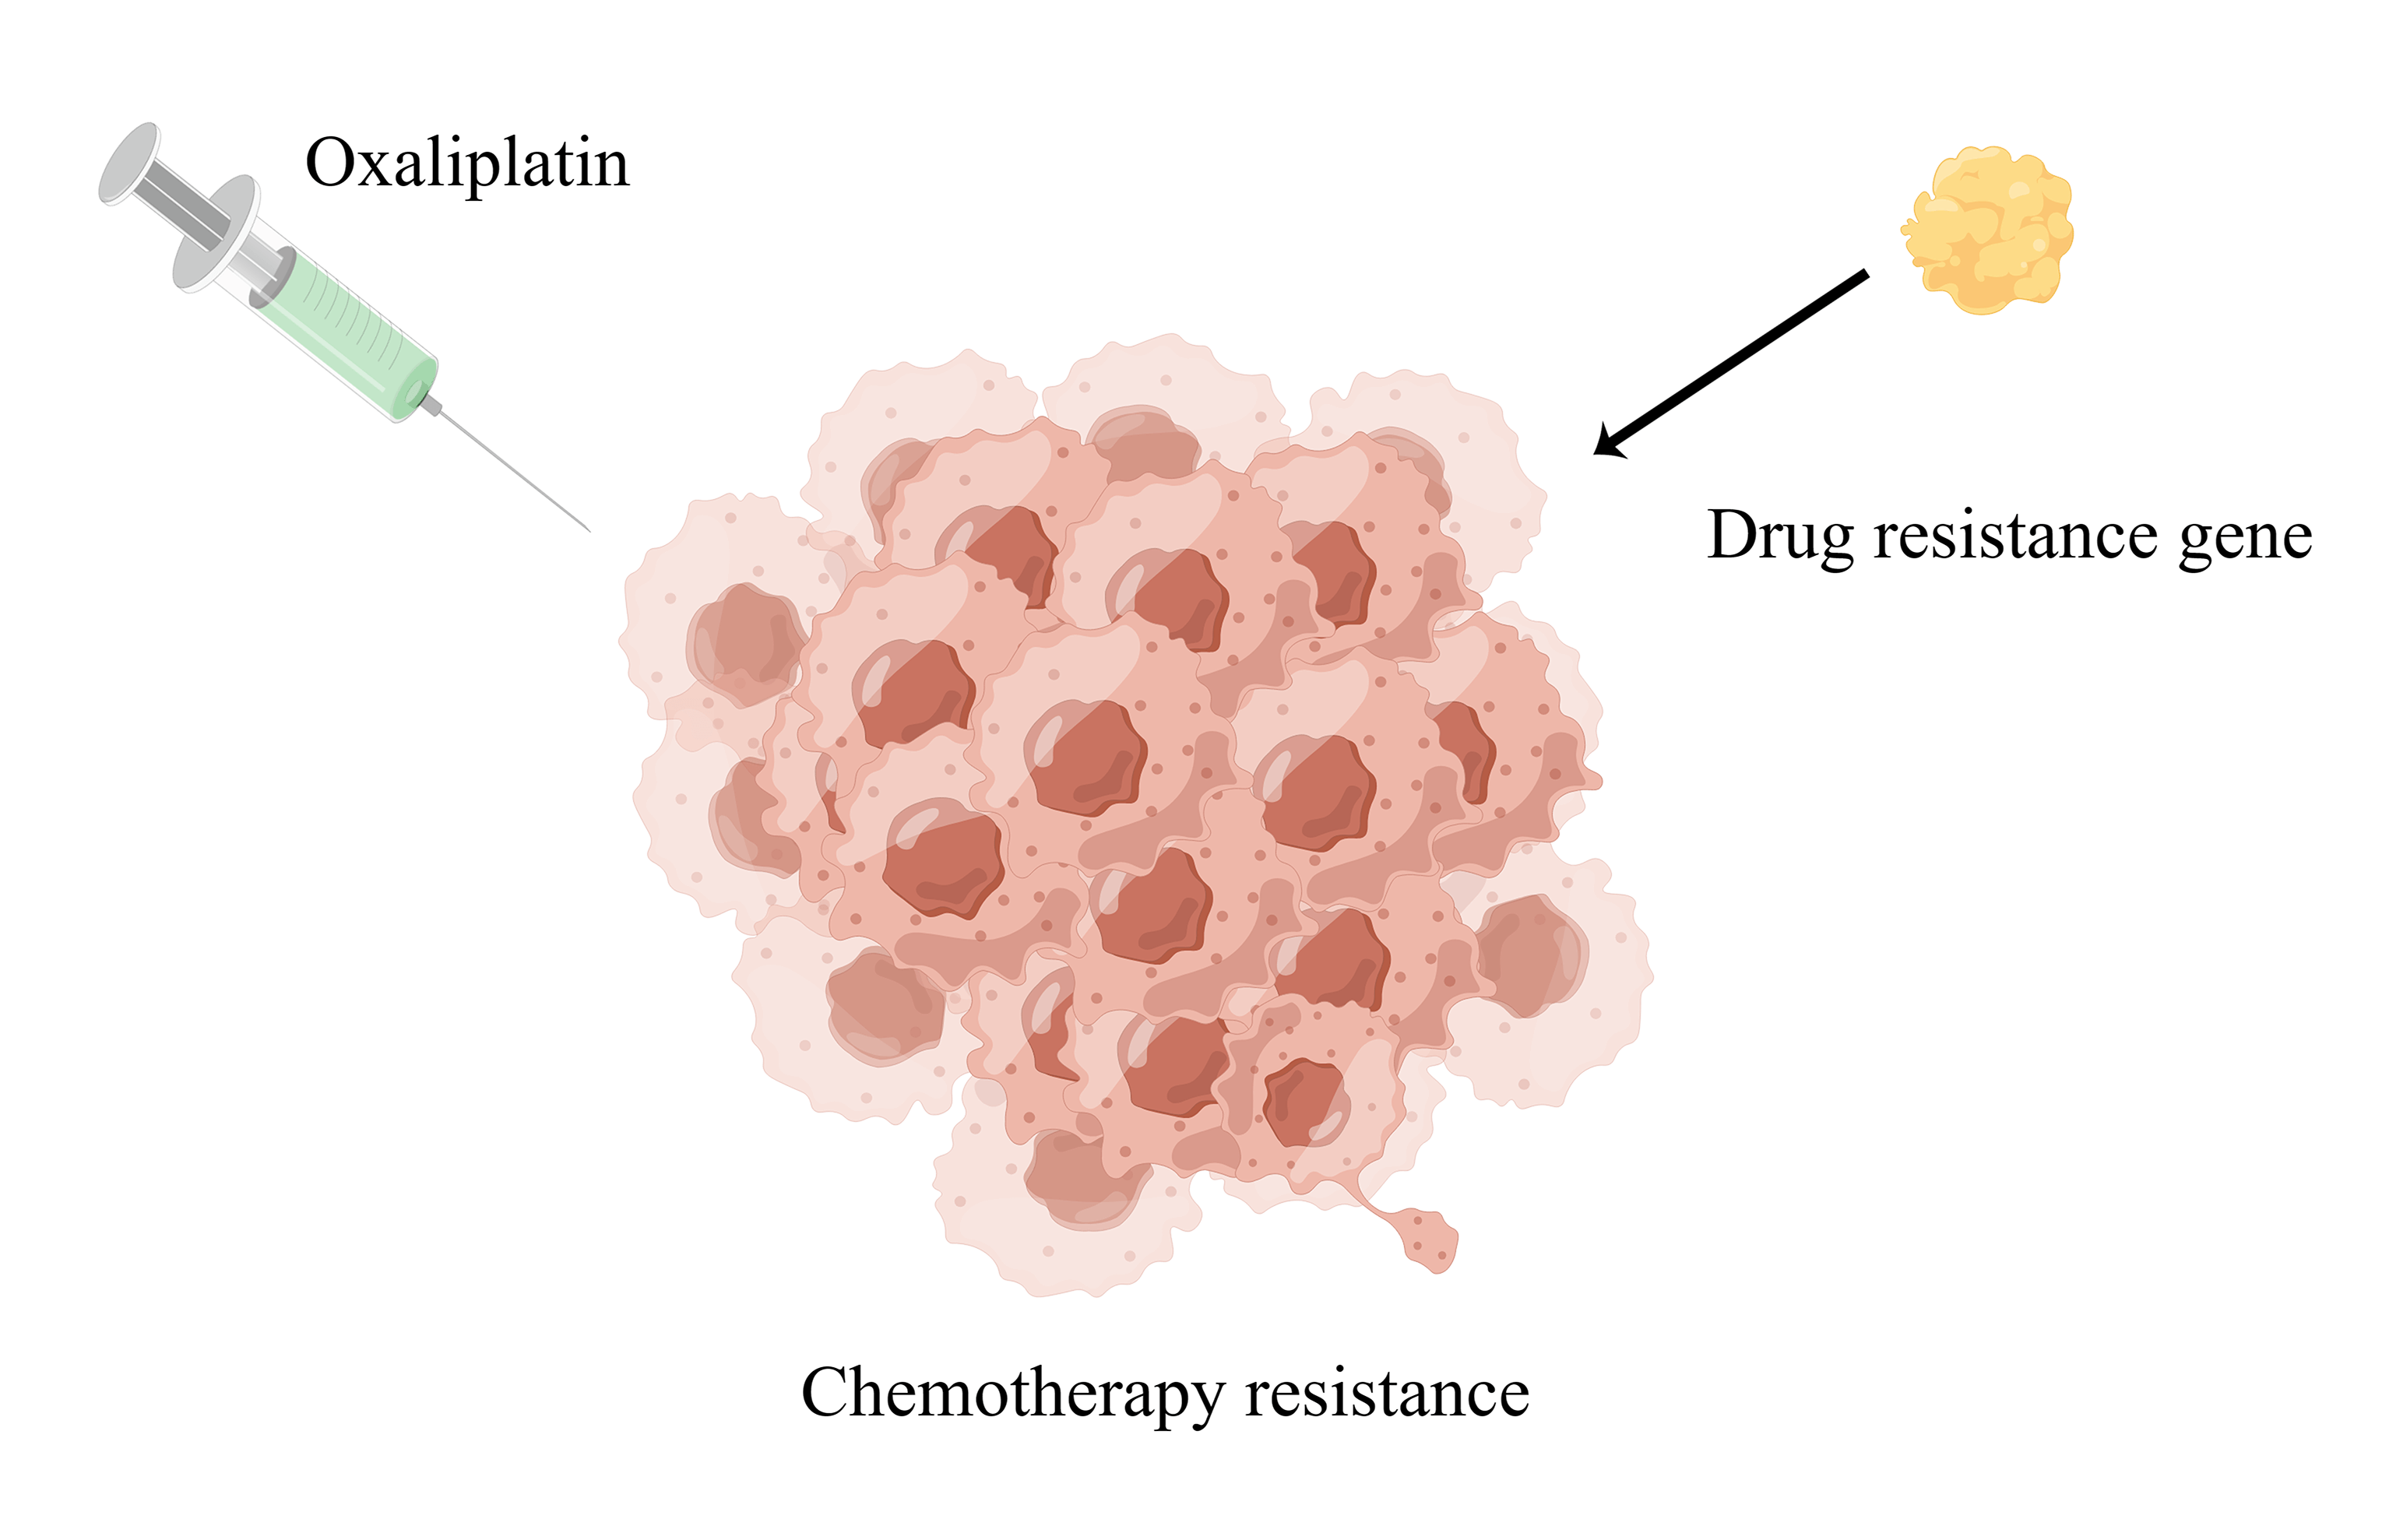
Objectives: Colorectal cancer (CRC) is a serious threat to human health worldwide. Oxaliplatin is a platinum analog and is widely used to treat CRC. However, resistance to oxaliplatin restricts its effectiveness and application while its target recognition and mechanism of action also remain unclear. Therefore, we aimed to develop an oxaliplatin-resistant prognostic model to clarify these aspects. Methods: We first obtained oxaliplatin-resistant and parental cell lines, and identified oxaliplatin-resistant genes using RNA sequencing (RNA-seq) and differential gene analysis. We then acquired relevant data from The Cancer Genome Atlas (TCGA) and Gene Expression Omnibus (GEO) databases. Cox regression and Least Absolute Shrinkage and Selection Operator (LASSO) regression were used to identify satisfactory resistance genes, and a prognostic model was established. Finally, small-molecule drugs targeting the high-risk (HR) and low-risk (LR) groups were predicted. Results: We identified 14 oxaliplatin-resistance genes in CRC. We built a model with these and used it to classify patients with CRC. Overall survival was better in the LR group than in the HR group (p < 0.001). Multivariate and univariate prognostic analyses revealed that this newly developed model had an independent prognostic value (p < 0.001). The risk score was found to be associated with the tumor microenvironment (TME) and 11 types of immune cells as per the CIBERSORT algorithm results. Finally, we screened 47 small-molecule drugs with half-maximal inhibitory concentration (IC50) values that were related to the risk scores. Conclusion: Our novel prognostic model for oxaliplatin resistance can be used to stratify the risk of CRC.Graphic Abstract
Keywords
Colorectal cancer (CRC) poses a significant threat to human health. For example, in the United States, 151,030 new CRC cases have been predicted in 2022. Among the different types of tumors, the incidence of CRC ranks third in males and fourth in females [1]. Further, in China, the ranking of CRC incidence is the second place [2]. The risk factors for CRC include smoking, body mass index (BMI), alcohol abuse, poor dietary habits, and genetics [3]. At present, total mesangial resection is the basic approach for CRC treatment with or without neoadjuvant or conventional chemoradiotherapy [4]. However, in China, the 5-year overall survival rate of CRC is still poor owing to the failure of postoperative chemo-radiotherapy and endoscopy [5]. Therefore, screening for effective and novel diagnostic and prognostic markers of CRC is urgently required.
Oxaliplatin is a platinum analog and is often used to treat various cancers, including gastroesophageal cancer (GC), ovarian cancer (OC), breast cancer (BC), and CRC [6]. Oxaliplatin targets the DNA of tumor cells, and the platinum atoms crosslink DNA to inhibit DNA replication and transcription [7]. However, oxaliplatin resistance in patients limits its therapeutic use [8]. Resistance mechanisms mainly include transportation, DNA damage, DNA repair, apoptosis, and epigenetic changes [9]. For example, a study showed that oxaliplatin combined with an lncRNA ELFN1-AS1 inhibitor and an EZH2 inhibitor (GSK126) reversed oxaliplatin resistance to some degree [10]. In addition, PAK6 promoted oxaliplatin resistance by enhancing homologous recombination followed by DNA double-strand break (DSB) repair in GC [11,12]. Glutathione (GSH) attenuated the therapeutic effects of oxaliplatin via chemical chelation in clear cell renal cell carcinoma (ccRCC). The inhibition of GSH production significantly increased the sensitivity of ccRCC cells to oxaliplatin [13]. Additionally, UPK1A-AS1 promoted oxaliplatin resistance by strengthening the bond between Ku70 and Ku80 to promote non-homologous end joining (NHEJ), and enhancing DSB repair in pancreatic ductal adenocarcinoma (PDAC) [14]. However, despite these findings, the mechanisms underlying oxaliplatin resistance have not been fully revealed.
A prognostic model refers to the use of mathematical models to predict the survival time of a patient. With prognostic models, we can use a set of parameters (expression of known genes) to predict whether a sample is at high or low risk. Multivariate linear regression, LASSO regression, and Cox regression models are often used to model prognosis [15]. For example, a new prognostic model of aging-related lncRNAs was constructed to predict survival and the associated immune landscape in patients with hepatocellular carcinoma (HCC) [16]. Further, an endoplasmic reticulum (ER) stress-related prognosis model has been reported for GC, which showed a good predictive ability and could promote the progress of clinical treatment of GC [17]. A m6A-related lncRNA prognostic model was a promising biomarker for predicting progression-free survival (PFS) in CRC [18]. However, the number of prognostic models associated with chemotherapy resistance is not significant.
In this study, we identified oxaliplatin-resistant genes using RNA-sequencing (RNA-seq) and differential gene analysis. We then established a prognostic model. We next divided the samples into training and test groups and verified the effectiveness of this model. Finally, we analyzed the relationship between the newly developed prognostic model with TME and drug sensitivity.
CRC patients with complete RNA-seq data, follow-up data, and clinicopathological data were utilized to build our prognosis model. Data of CRC patients (gene expression and clinicopathological characteristics) were obtained from TCGA (https://portal.gdc.cancer.gov/) and GEO (GSE40967 and GSE17536, https://www.ncbi.nlm.nih.gov/geo/) database websites.
All cases were followed up from June 06, 2016, to July 27, 2022. If the database showed the patient as dead, the status was recorded as dead, and if the database showed that the patient is still alive, the status was recorded as alive. The gene expression levels of all samples were obtained using RNA-seq, and samples lacking survival data and other clinic pathological characteristics were excluded.
HCT-116 cells were cultured in RIPM-1640 medium (Service Bio, Wuhan, China) supplemented with a specific percentage of fetal bovine serum (FBS), penicillin, and streptomycin. The cells were kept in an incubator for incubation. HCT-116 cells were identified by short tandem repeat DNA analysis and were confirmed to be mycoplasma-free. Finally, the cultured cells were placed in a cell incubator, according to the manufacturer’s instructions. When the cells reached 90% confluence, they were digested with trypsin and passaged. As the standard deviation of IC50 could not be obtained, we treated the parental HCT-116 cells to oxaliplatin to establish soundly resistant HCT-116 cells. To elaborate, HCT-116 cells were treated with an initial dose of 0.1 μg/mL of oxaliplatin before being cultured to 80% confluence for 6 weeks. The cells that survived the initial oxaliplatin treatments were then treated with 0.5 μg/mL of oxaliplatin for 6 weeks again and finally with 1ug/mL of oxaliplatin for the remaining 6 weeks. Finally, the oxaliplatin concentrations were increased to 2 μg/mL for 3 weeks, and these oxaliplatin resistant cells were named as HCT-116/L.
For the IC50 analysis assay, cells (2000 cells/well) were seeded into a 96-well plate. After 24 h, the cells were exposed to the indicated concentrations of oxaliplatin solution for 48 h. The cell viability was measured using Cell Counting Kit 8 (CCK-8) (Vazyme, Nanjing, China), and the absorbance was measured at an OD of 450 nm.
The total RNA from the samples was extracted, and we isolated the rRNA. We preformed mRNA enrichment which was reverse transcribed to synthesize cDNA. After repairing the double ends, an adaptor was added, and polymerase chain reaction (PCR) was used for amplification to construct the cDNA library.
Identification analysis of differentially expressed genes (DEGs)
Gene differential expression analysis between the two groups was performed by DESeq2 software in R to identify the DEGs. The genes/transcripts with p < 0.05 and fold change (FC) ≥ 2 were considered DEGs.
For GO analysis, all DEGs were mapped to GO terms in the GO database (http://www.geneontology.org/). The numbers of genes were calculated, and the significantly enriched GO terms in DEGs compared to the genome background were defined by hypergeometric test with p < 0.05 set as the threshold.
Kyoto encyclopedia of genes and genomes (KEGG) analysis
A hypergeometric test was applied to find out the pathways that showed significant enrichment in DEGs for the KEGG analysis. The pathways with p < 0.05 were defined as significantly enriched after multiple test corrections.
Disease ontology (DO) analysis
For DO analysis, we mapped the DEGs to each term in the DO database (http://disease-ontology.org/) and calculated the number of genes. We then obtained the list of genes with a certain DO function and the number of genes and relevant statistics. Hypergeometric tests were also used to identify DO entries that were significantly enriched in DEGs. After multiple test corrections, DO terms with p < 0.05 were defined as the DO terms which were significantly enriched in DEGs.
We mapped the DEGs to each term in the Reactome database (https://reactome.org/) and calculated the number of genes. We obtained the DEGs with a certain Reactome function and relevant gene number statistics. Hypergeometric tests are then utilized to identify Reactome entries that were significantly enriched in genes. After multiple test corrections, Reactome terms with p < 0.05 were defined as DO terms significantly enriched in DEGs.
Construction of a novel prognostic model
Univariate Cox regression was used to obtain resistance genes associated with prognosis using the “survival” package, and the standard was set at p < 0.05, The LASSO regression-based R package “glmnet” was then used to construct the prognostic model. We next plotted the prognostic network using the “igraph”, “psych”, “reshape2” and “RColorBrewer” packages, and the “Survival” package was used to draw the forest map. Finally, the samples were distributed into the HR and LR groups, and their differences in survival time were compared. The “Time-ROC” package in R was used for obtaining the receiver operating characteristic (ROC) curve, and the “Survival”, “pheatmap” and “SurvMiner” packages were used for risk curves, survival status, survival curves, and heat maps, respectively.
Predictive nomogram construction
We established a nomogram to predict the survival probability and analyze the accuracy and performance of the model using the “survival”, “regplot” and “rms” packages in R.
Gene set variation analysis (GSVA)
In our study, we applied GSVA, a GSE method that estimates variance in pathway activity across a sample population in an unsupervised manner. We used “GSEABase” and “GSVA” packages for the GSVA between the two groups while “limma” and “pheatmap” packages were used to draw the heat map.
Independent prognostic analysis of risk scores
We adopted univariate Cox regression analysis to evaluate the prognostic value of our model, including age, gender, TNM, and stage. We next conducted multivariate Cox regression analysis to evaluate whether the risk score could serve as an independent prognostic factor. The hazard ratios (HR) and 95% confidence intervals (CI) were calculated, with p < 0.05 considered statistically significant. The “survivalROC” package was applied for analyzing the ROC curve.
We analyzed the correlation between clinical characteristics and risk values. The “pheatmap” package was used to draw the heat map while “beeswarm” and “limma” packages in R were used to draw scatter plots reflecting relationships between risk values and clinicopathologic features (p < 0.05). “Survival” and “Survminer” packages were used to draw survival curves.
Validation of the prognostic model
We randomly divided the sample cohort into two groups, one group was the training group, and the other group was the test group. The reliability of the model was verified in both groups. The “Survival”, “SurvMiner” and “Time-ROC” packages in R were used for drawing ROC curves and survival curves while the “Survival” package was also utilized for risk curves, risk status, and heat maps.
We first used CIBERSORT software (http://cibersort.stanford.edu/) to estimate cell abundance based on gene expression using “reshape2” and “ggpubr” packages. We next used the ESTIMATE algorithm (https://bioinformatics.mdanderson.org/public-software/estimate/) to calculate the score (immune/matrix/estimated score) and tumor purity. Subsequently, we compared the expression of 47 commonly used immune checkpoint genes in HR and LR groups. The “reshape2”, “ggplot2”, “ggpubr”, “corrplot” packages were used to draw the relevant plots.
The IC50 values of common drugs were analyzed using the “pRRophetic” packages in R. We used the Wilcoxon signed rank test to assay IC50 between the HR and LR groups.
The R program (v4.2.3) was used for the bioinformatics analysis, and our computer system utilized Windows 10.
The “limma” package is based on an algorithm that enables differential analysis. The “ggplot2”, “ggExtra” and “ggpubr” package is a comprehensive and easy-to-understand tool used for drawing data graphs. The “ComplexHeatmap” and “pheatmap” packages were used to display heat maps. The “circlize” package is an R package specifically designed to draw circles. The “corrplot” package was used to analyze the correlation between the expressions of different genes. The “reshape2” package is an R package for data processing, which was used to implement the exchange of wide format data and long format data. The “igraph” package was utilized for network analysis and visualization.
For survival analysis, the “survival” package and “survminer” package were designed specifically to process survival data analysis and plot survival curves. Further, for principal component analysis (PCA), the “psych” package was used. In the meantime, the “RColorBrewer” package was utilized for network diagram color matching. For plotting the nomogram, we used the “regplot” and “rms” packages, which are frequently employed in research. We used a type of scatter plot is called beeswarm diagrams, which can visually depict both the general situation and the unique circumstances of each sample.
We employed the “caret” and “glmnet” packages in the construction of the prognostic model. A group of tools known as the “caret” package (Classification and Regression Training) expedite the process of developing prediction models. The most popular LASSO analysis package right now is the “glmnet” package, which is frequently used in gene screening research and was employed by us.
For gene enrichment analysis. Firstly, the “org.Hs.eg.db” package was mainly used for gene ID and symbol conversion. The “clusterProfiler” package, which is mainly used for functional enrichment and visualization of GO and KEGG analysis was then applied. The “enrichplot” package was employed to implement multiple visualization methods and interpret the enrichment results. The “enrichplot” was used for the functional enrichment plot. The GSVA function from the “GSVA” package was used to transform the gene expression matrix into the gene set fraction matrix for the GSVA analysis. We utilized the “getGmt” function that the “GSEABase” package provides to acquire the data from the pathways.
For the TME and immune cell infiltration analysis, the expression data from ESTIMATE (Estimation of Stromal and Immune cells in Malignant Tumours using Expression data) was used. The “estimate” package uses gene expression data to predict the number of mesenchymal cells and immune cells in malignant tumor tissue. The algorithm is based on enrichment analysis of gene sets in a single sample, generating three scores: stroma score (which records the presence of stroma in the tumor tissue), immune score (which represents the infiltration of immune cells in the tumor tissue) and estimated score (which deduces tumor purity). The CIBERSORT used to calculate the abundance of immune cells to understand the immune cell infiltration in the samples. The “pRRophetic” package that mainly predicts the phenotype in clinical samples from gene expression data was used for drug sensitivity analysis.
All bioinformatics analyses in this study were performed using R software (version 4.2.3), which was downloaded from the official website (https://www.r-project.org/). All data were expressed as the mean ± standard deviation (SD). The Student’s t-tests were also applied for comparing the experimental groups and control groups. Statistical significance was set at p < 0.05.
Identification of differentially expressed genes and construction of the prognostic model
We tested the IC50 of HCT-116 oxaliplatin-resistant strains (HCT-116/L) and HCT-116/B after inducing resistance to form the HCT-116/L cell line. The results showed that the IC50 of HCT-116/L was significantly higher than HCT-116/B, indicating that HCT-116/L was an oxaliplatin-resistant strain and could be used for further analysis (Fig. 1A). We then performed RNA-seq based on the HCT-116/L and HCT-116/B cell lines, A total of 1508 differentially expressed genes (DEGs) were identified (p < 0.05), and the DEGs have been presented by the volcano map (Fig. 1B) and heat map (Fig. 1C). The 449 genes that were upregulated in the HCT-116/L cell line were defined as oxaliplatin-resistant genes and were further analyzed. Gene enrichment analyses were performed using the GO, KEGG, DO, Reactome, and GSEA analyses to explore the associated biological mechanisms. The GO analysis revealed that the oxaliplatin-resistant genes were mainly enriched in the regulation of multicellular organismal process, system development, and anatomical structure morphogenesis (BP), plasma membrane, cell periphery, and plasma membrane portions (CC), peptide antigen binding, calcium ion binding, and growth factor binding (Fig. 1D). The KEGG analysis revealed that resistance genes were mainly enriched in inflammatory bowel disease (IBD), graft-vs.-host disease and Type I diabetes mellitus (Fig. 1E). The DO analysis demonstrated that resistance genes were mainly enriched in Vascular disease, Cardiovascular system disease and Artery disease (Fig. 1F). Reactome analysis demonstrated that the oxaliplatin-resistant genes were mainly enriched in cytokine signaling, interferon-γ (IFN-γ), and IFN-γ-regulated pathways in the immune system (Fig. 1G). The GSEA analysis demonstrated that oxaliplatin-resistant genes were mainly enriched in autoimmune thyroid disease, allograft rejection, asthma (GO), antigen binding, cotranslational protein targeting to membrane, MHC protein complex (KEGG), urticarial, glomerulosclerosis, Rett syndrome (DO), pre-pro-defensins cleavage to remove the signal peptide, beta-defensins secretion, and beta-defensins binding to microbial membranes causing disruption (Reactome) (Fig. 1H). To summarize, we screened the upregulated genes in oxaliplatin resistance and revealed their biological functions.
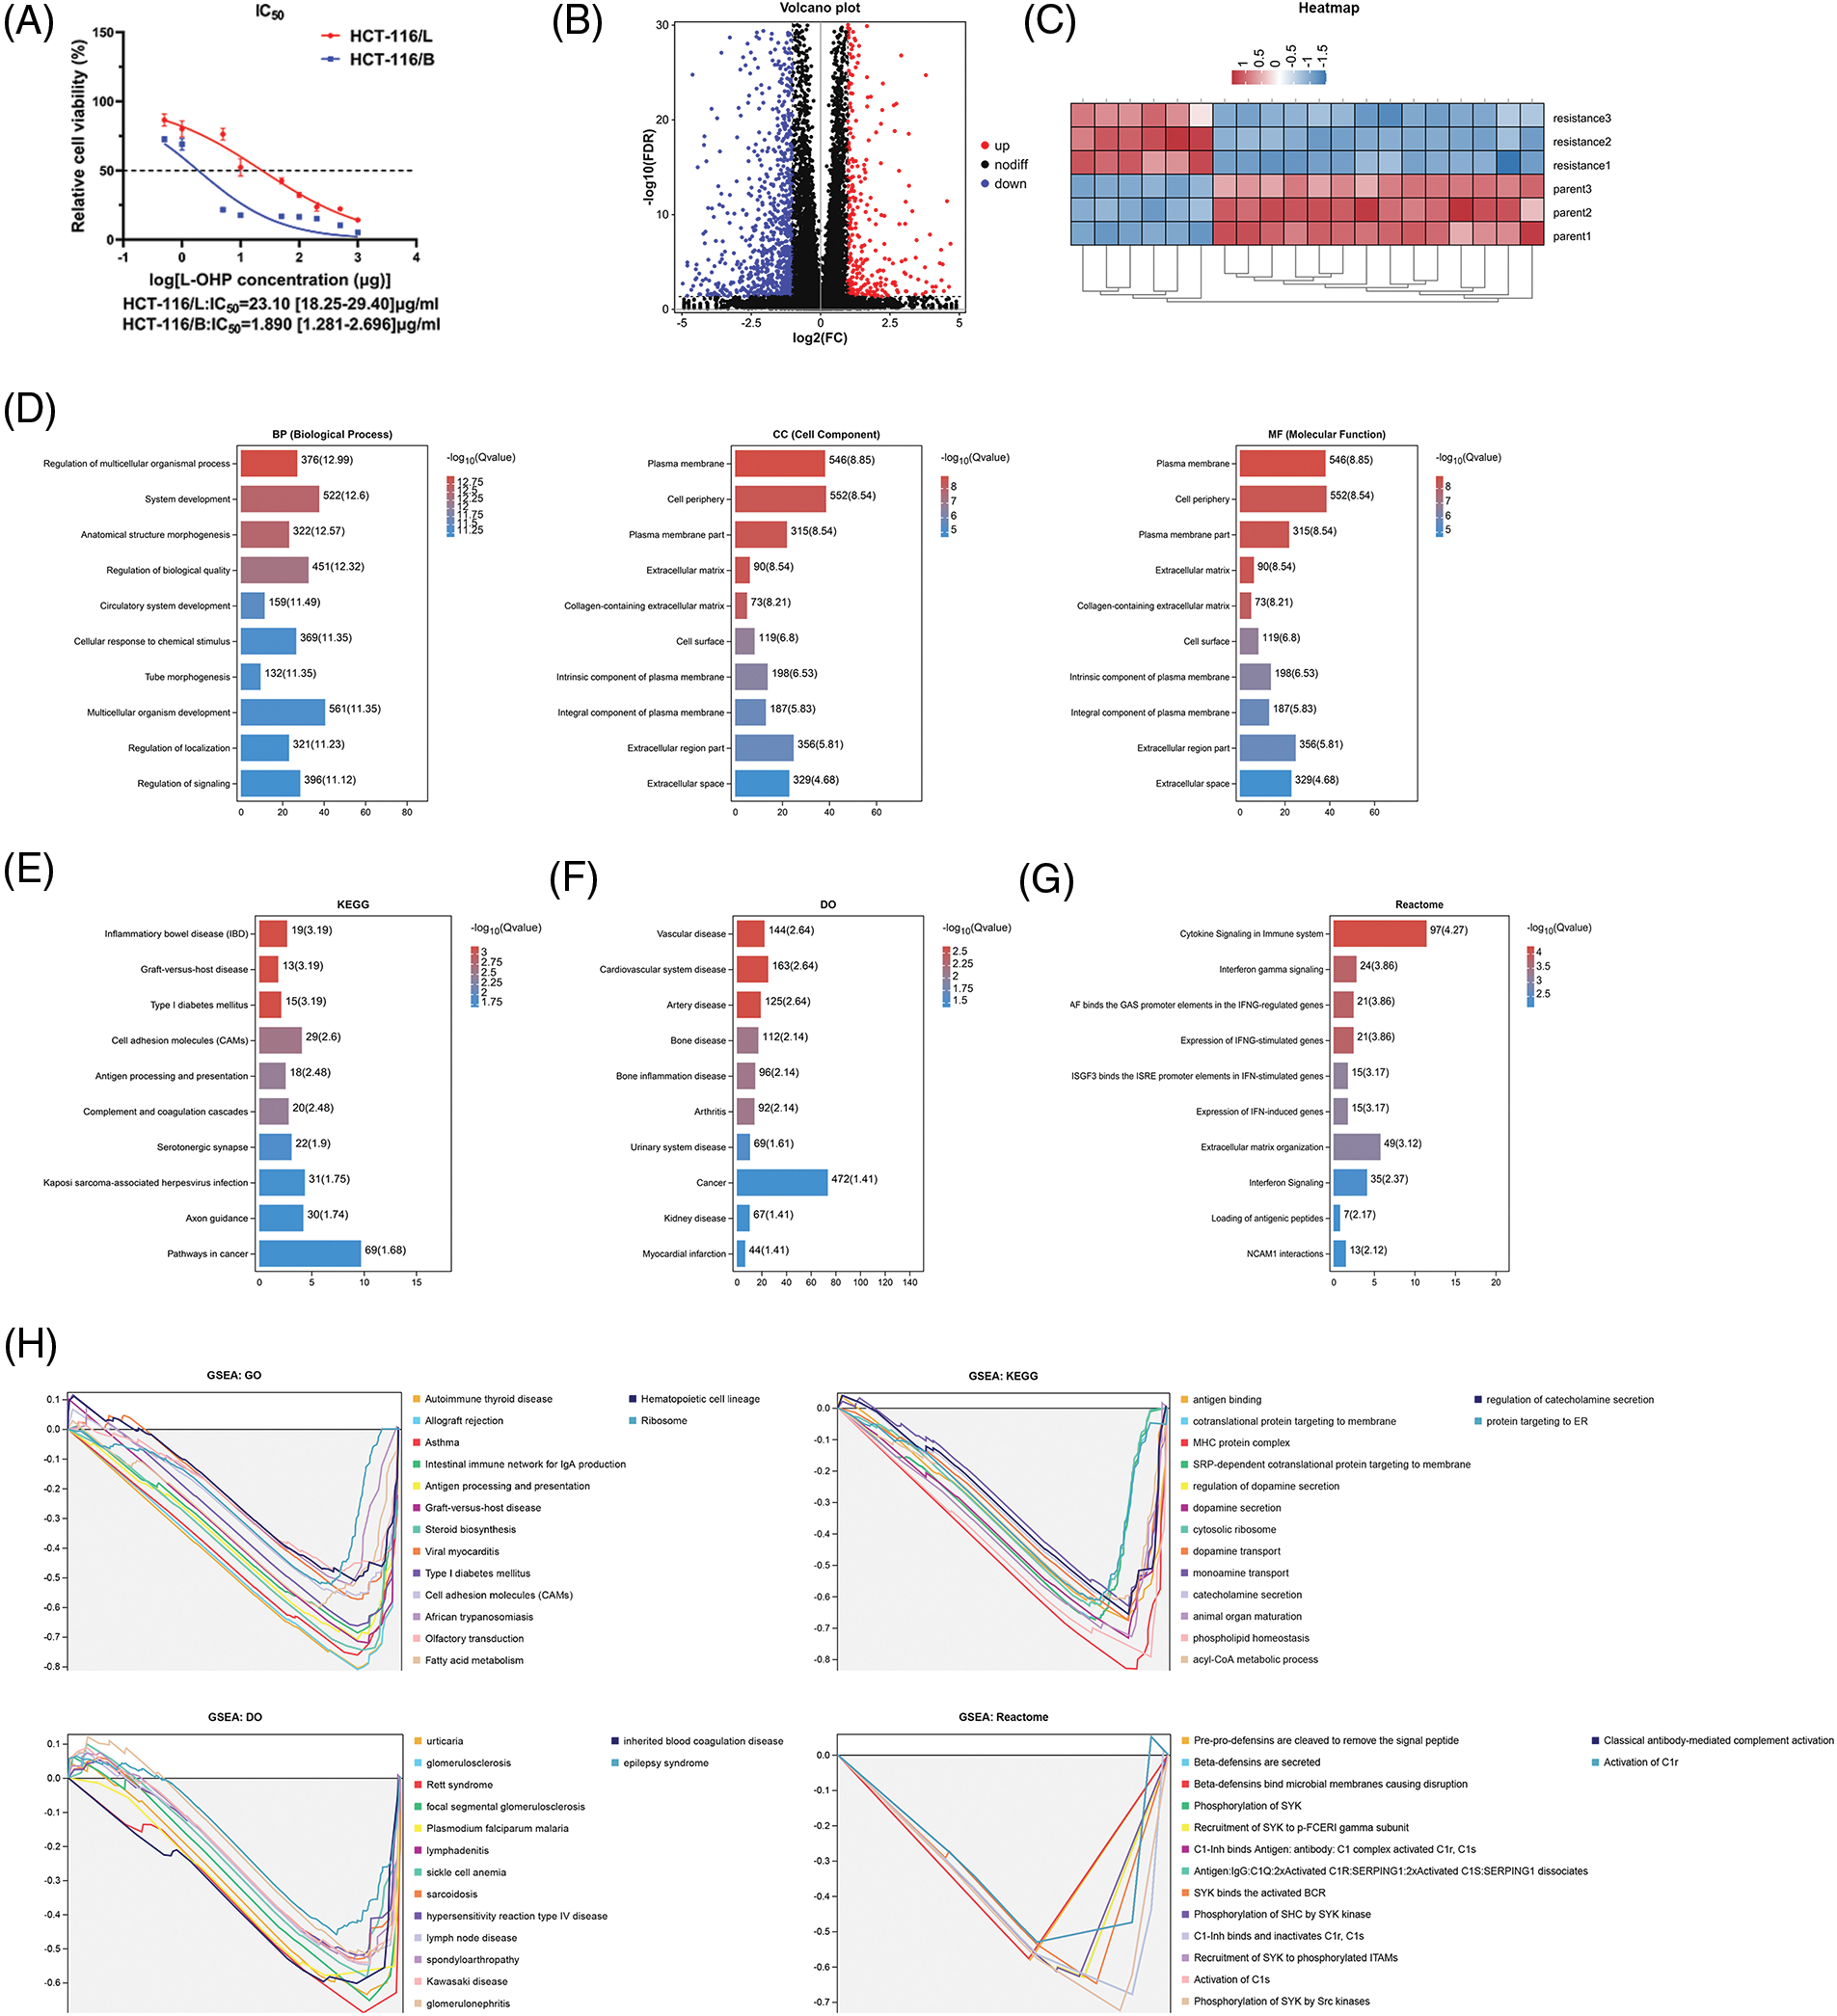
Figure 1: Identification of differentially expressed genes (DEGs) between resistant and parental cells. (A) IC50 values of cell lines (B) Volcano plot (C) Heat map (D) GO results (E) KEGG analysis (F) DO analysis (G) Reactome analysis and (H) GSEA of DEGs. Key: IC50, half maximal inhibitory concentration; GO, gene ontology; KEGG, kyoto encyclopedia of genes and genomes; DO, disease ontology; GSEA, gene set enrichment analysis; DEGs, differentially expressed genes.
As outlined earlier, we obtained complete clinicopathological characteristics and survival information of 1047 CRC patient samples from TCGA and GEO databases. The detailed clinicopathological characteristics are shown in Table 1, and the flowchart of sample details in the study is shown in Suppl. Fig. S1. Firstly, univariate Cox regression analysis was used to identify survival-associated oxaliplatin-resistant genes (p < 0.05). A total of 92 genes were identified and a prognostic network diagram was generated (Fig. 2A). We further analyzed these genes using LASSO Cox regression, followed by multivariate Cox regression, and obtained 14 genes with a forest map generated for visualization (Fig. 2B). A survival curve was constructed and the following risk value formula was generated:
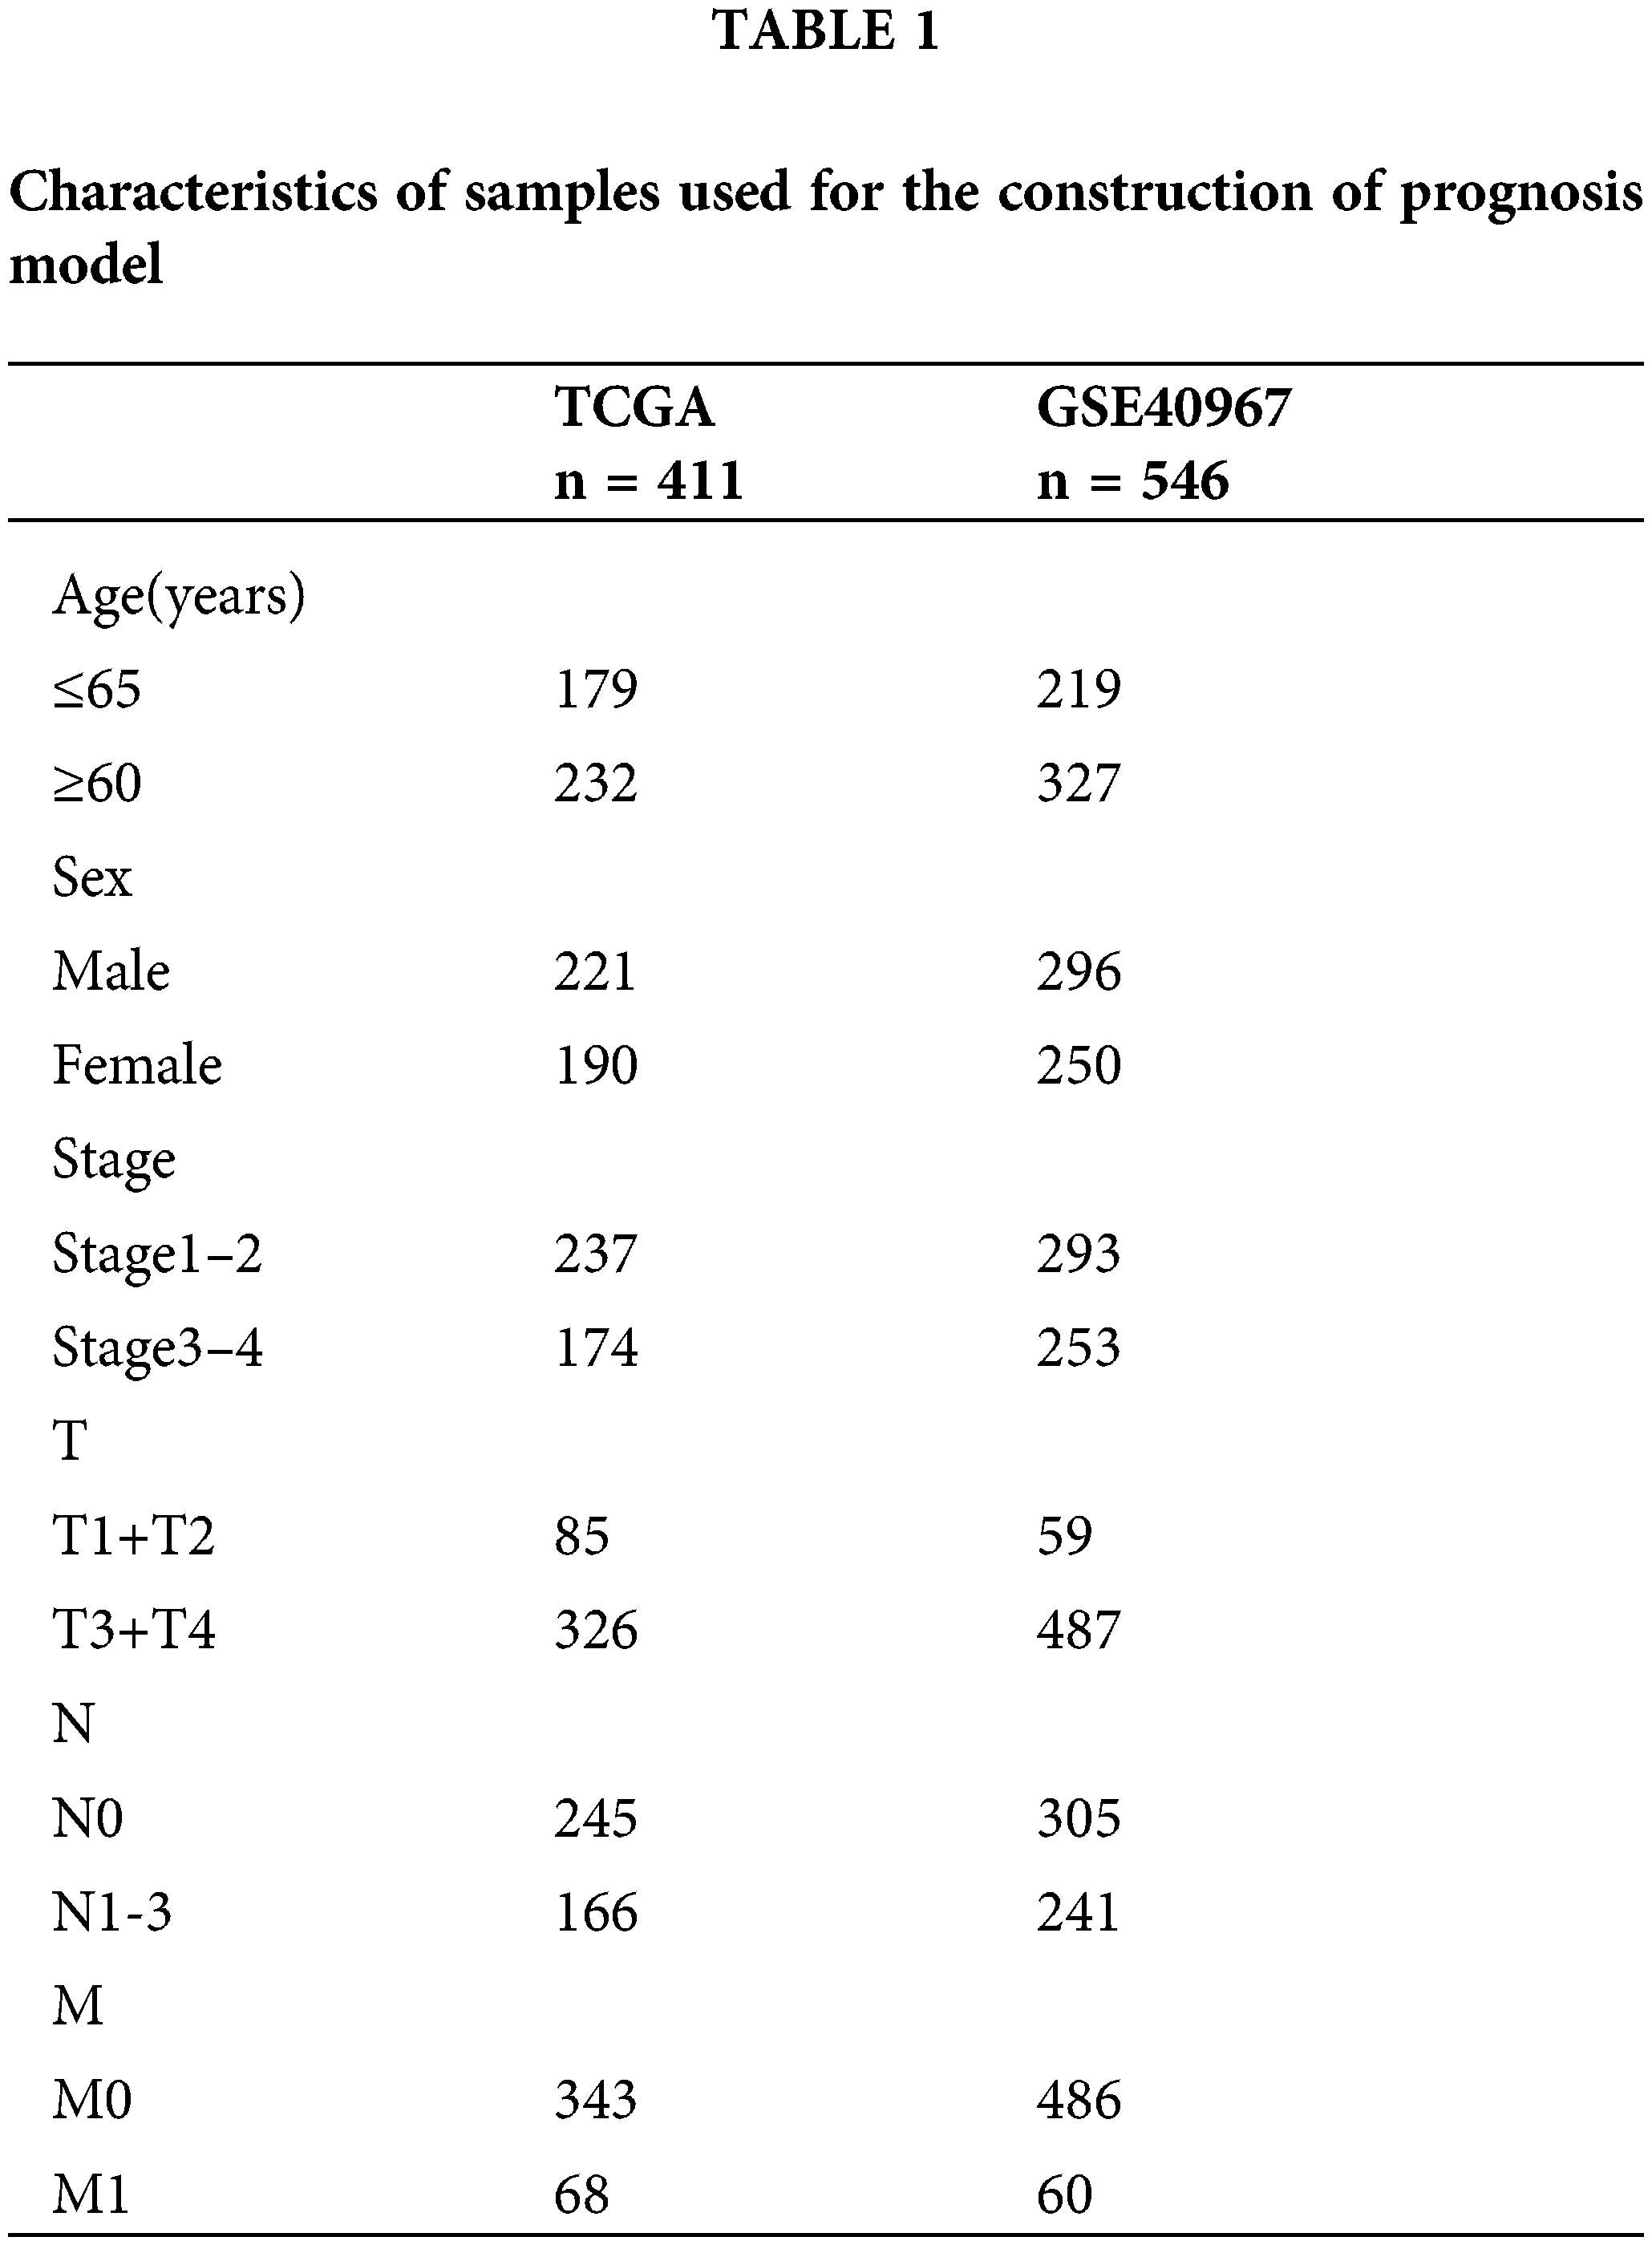
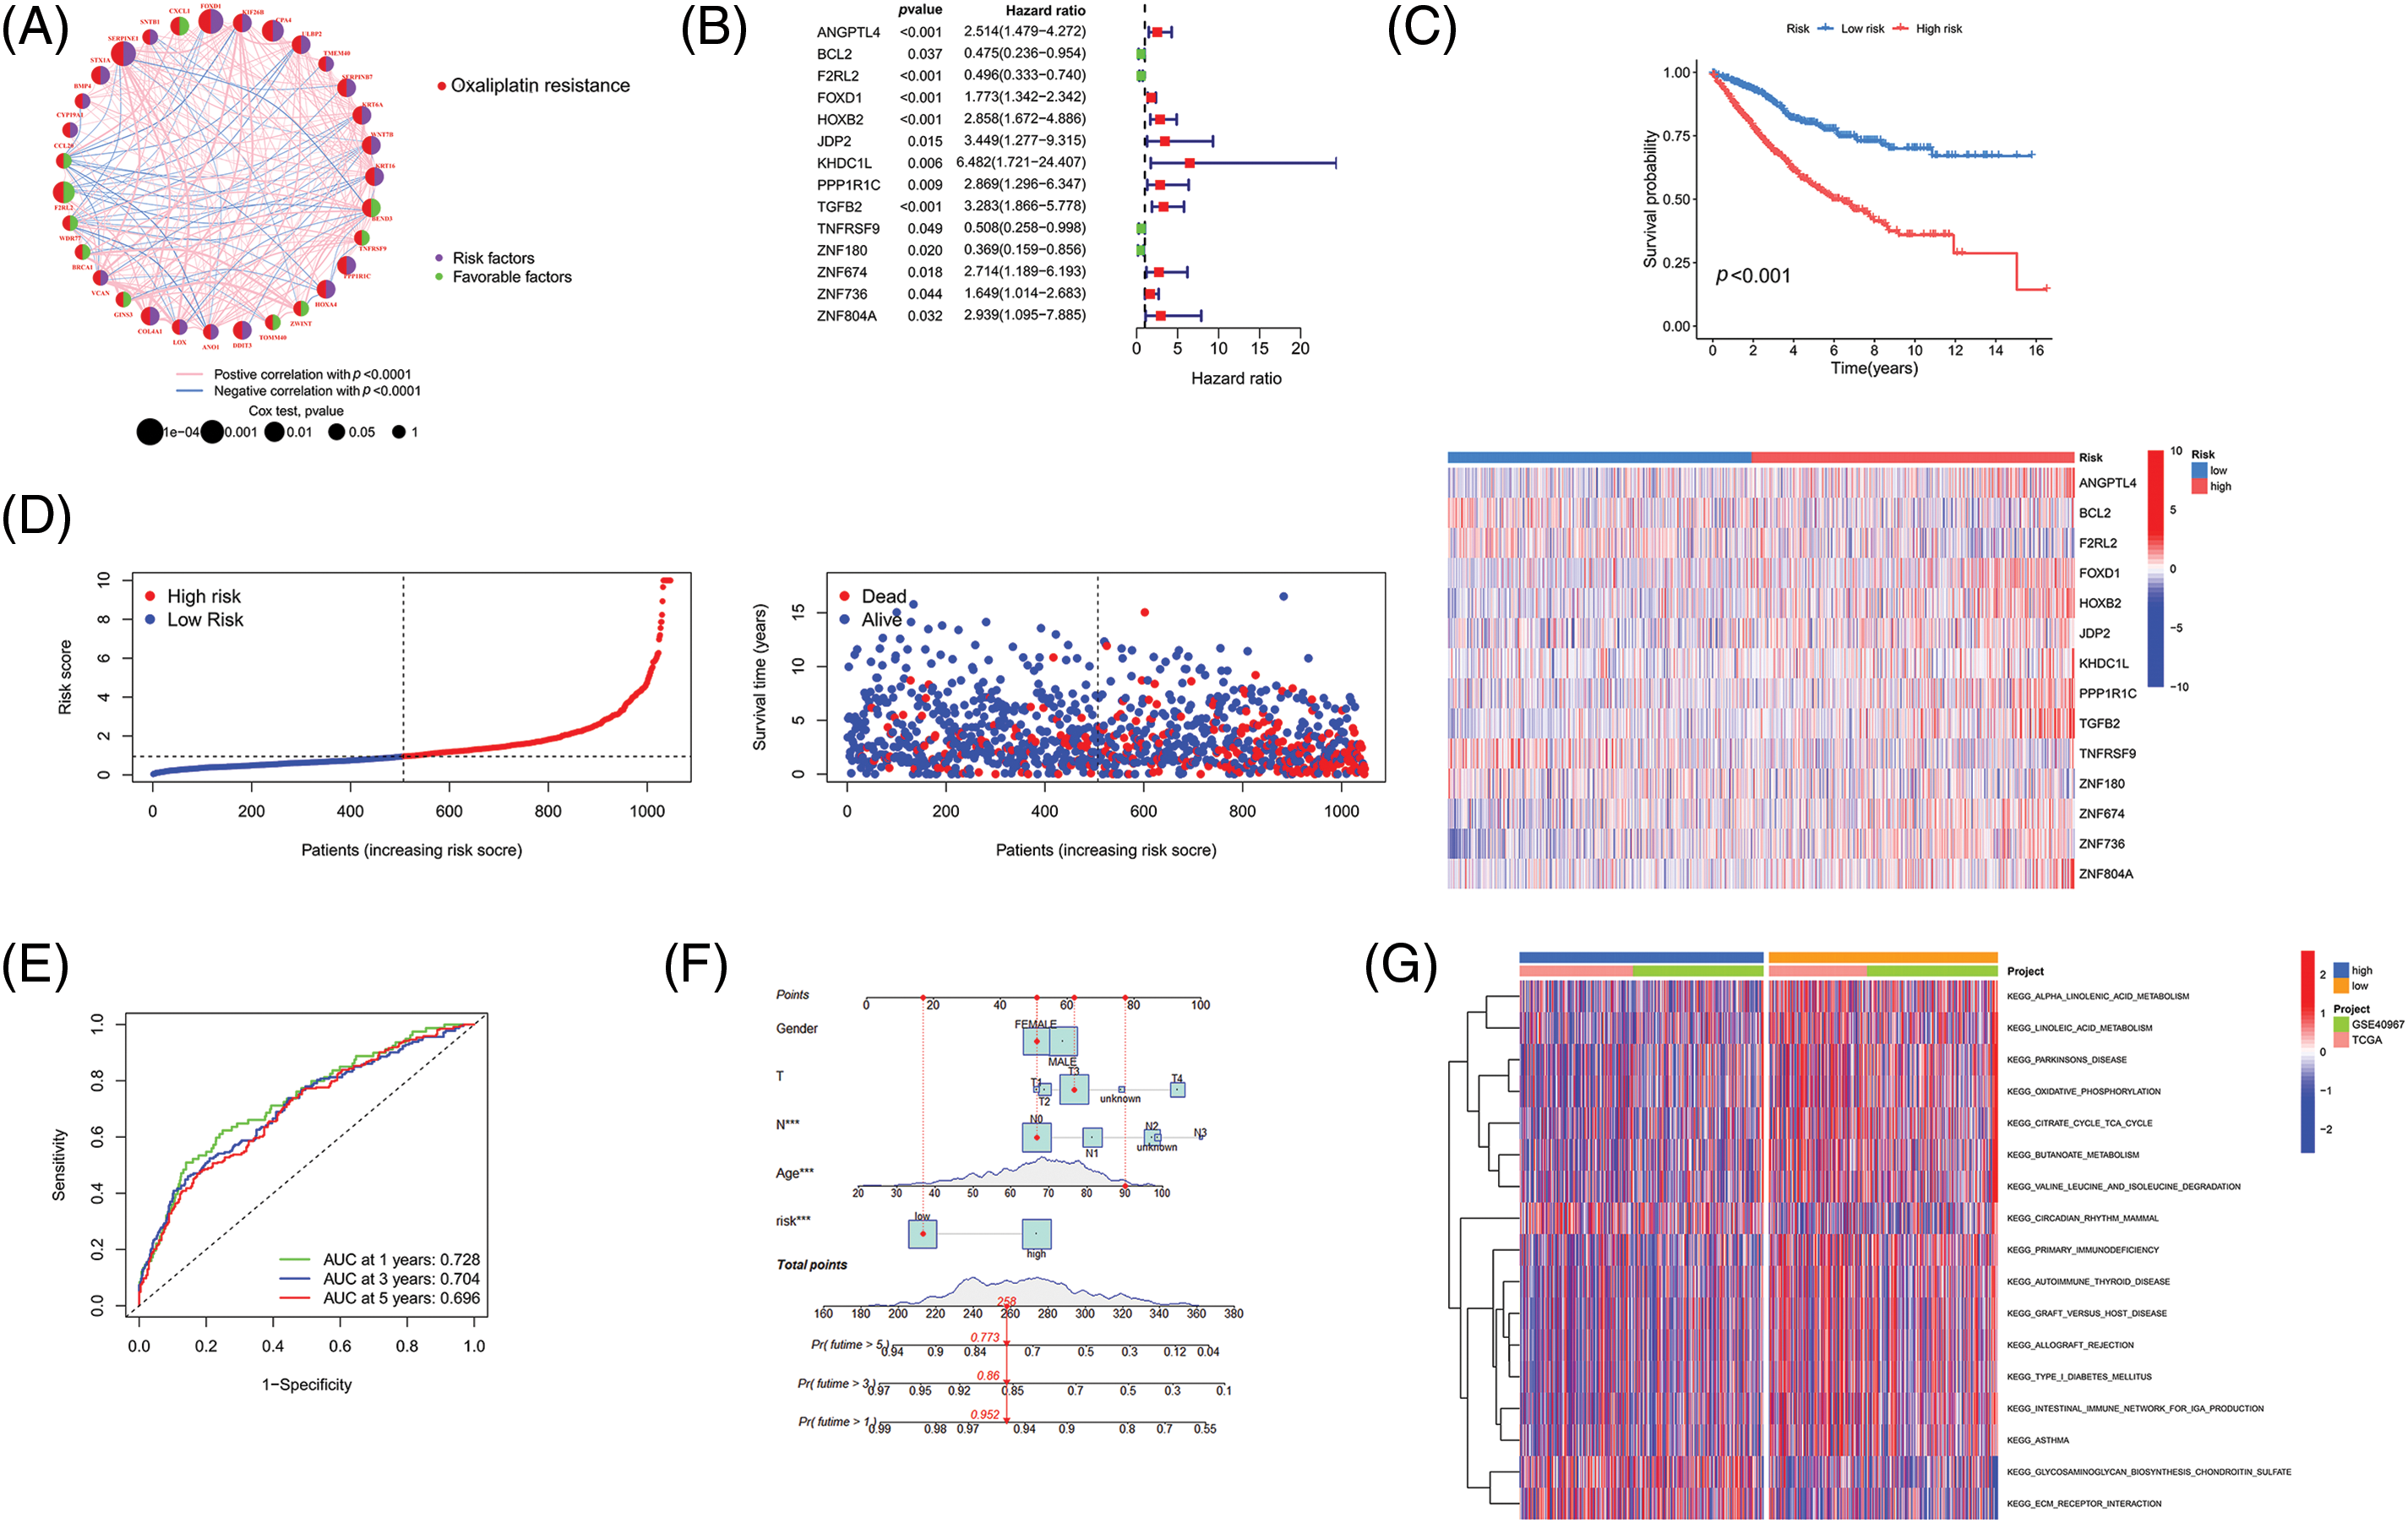
Figure 2: Establishment of a novel prognostic model. (A) The network diagram of genes associated with prognosis. (B) Forest map of genes included in the prognostic model. (C) Survival analysis of the HR and LR groups. (D) Risk curve, patient status, and heat map of the cohort. (E) ROC curve and (F) Nomogram of the prognostic model. (G) GSVA analysis of the HR and LR groups. Key: HR, high-risk; LR, low-risk; ROC, receiver operating characteristic curve; GSVA, gene set variation analysis.
Risk value = 0.9696 × ANGPTL4 + (−1.1565) × BCL2 + (−0.9444) × F2RL2 + 0.6788 × FOXD1 + 1.0288 × HOXB2 + 1.3760 × JDP2 + 1.6166 × KHDC1L + 0.9057 × PPP1R1C + 1.4167 × TGFB2 + (−2.1412) × TNFRSF9 + (−1.7246) × ZNF180 + 1.7605 × ZNF674 + 1.991 × ZNF736 + 2.2636 × ZNF804A.
We divided the 1047 samples into HR and LR groups based on the risk values, The HR group had higher mortality and shorter survival time than the LR group (Fig. 2C). Based on the risk curve and risk-status map, as shown in Fig. 2D our model suggests that it can distinguish the HR group and LR groups, and the heat map demonstrates the expression of 14 genes in each sample. ROC curve analysis indicated that the area under the curve (AUC) values were 0.728, 0.704, and 0.696 for survival rates for the different years analyzed (Fig. 2E). Calibration curves were drawn to evaluate the precision of the prognostic model.
The calibration curve is described as a scatter plot of the actual incidence and the predicted incidence that compares the predicted survival rate to the actual incidence rate. The results showed that our nomogram could predict the survival of patients at 1 year (95.2%), 3 years (86%), and 5 years (77.3%) with high accuracy (Fig. 2F). Finally, we used GSVA analysis to identify differentially enriched pathways between the HR and LR groups. It was demonstrated that the main differences here included α-linolenic acid metabolism, linolenic acid metabolism, and Parkinson’s disease (Fig. 2G). Our findings indicated the successful construction of a prognostic model for CRC containing 14 survival-associated genes.
Independent prognostic value of the prognostic model
As previously mentioned, LASSO regression was used to build the prognostic model to reduce model over-fitting. As a result, we explored the trajectory of the independent variable (Fig. 3A), and then we illustrated the analysis of the CI under each lambda using 10-fold cross-validation (Fig. 3B). We next investigated 14 genes in CRC patients and found that their expression was strongly correlated with the survival time (Fig. 3C). By comparing the expression levels of these genes, we found that F2RL2, FOXD1, PPP1R1C, TGFB2, TNFRSF9, ZNF674, and ZNF736 were upregulated in CRC, whereas BCL2, HOXB2, JDP2, and ZNF804A were downregulated. Moreover, ZNF180, ANGPTL4, and KDHC1L levels showed no significant differences (Figs. 4A–4D). We then applied univariate and multivariate Cox regression analyses to examine whether this prognostic model can directly affect the prognosis. The univariate Cox regression analysis was used to investigate the association between risk scores and clinical features including, sex, age, and stage. The univariate Cox regression forest map showed that age (HR = 1.029), risk score (HR = 1.153), T (HR = 2.047), N (HR 1.629), M (HR = 5.164), and stage (HR= 2.209) were significantly correlated with the survival (Fig. 5A). Similarly, multivariate Cox regression forest maps showed that age (HR = 1.038), risk score (HR = 1.123), T (HR = 1.646), N (HR = 1.364), and M (HR = 4.459) could be used as independent prognostic factors (Fig. 5B). Subsequently, we generated a multi-index ROC curve associated with risk values and clinicopathological characteristics. The AUC value was found to be 0.723, which was higher than any other clinicopathological characteristics, indicating that the prognosis of CRC patients was more accurately predicted according to the risk value (Fig. 5C). To elucidate the relationship among clinicopathological characteristics, including age, sex, T, N, M, and stage, we in all samples (Fig. 5D). We also performed a correlation analysis based on risk values and clinicopathological characteristics (Fig. 5E). Combining the results previously obtained from Fig. 5D, we found that risk values were associated with T, N, M, and stage, but not with age or sex (p < 0.05). Finally, we divided all samples into subgroups based on age, sex, stage, and TNM stage, followed by survival rate comparisons between the two groups. It was found that in any of these subgroups, the survival time was shorter in the HR group than the LR group (Fig. 5F). Taken together, our data verified the precision of the prognostic model for predicting the survival in CRC.
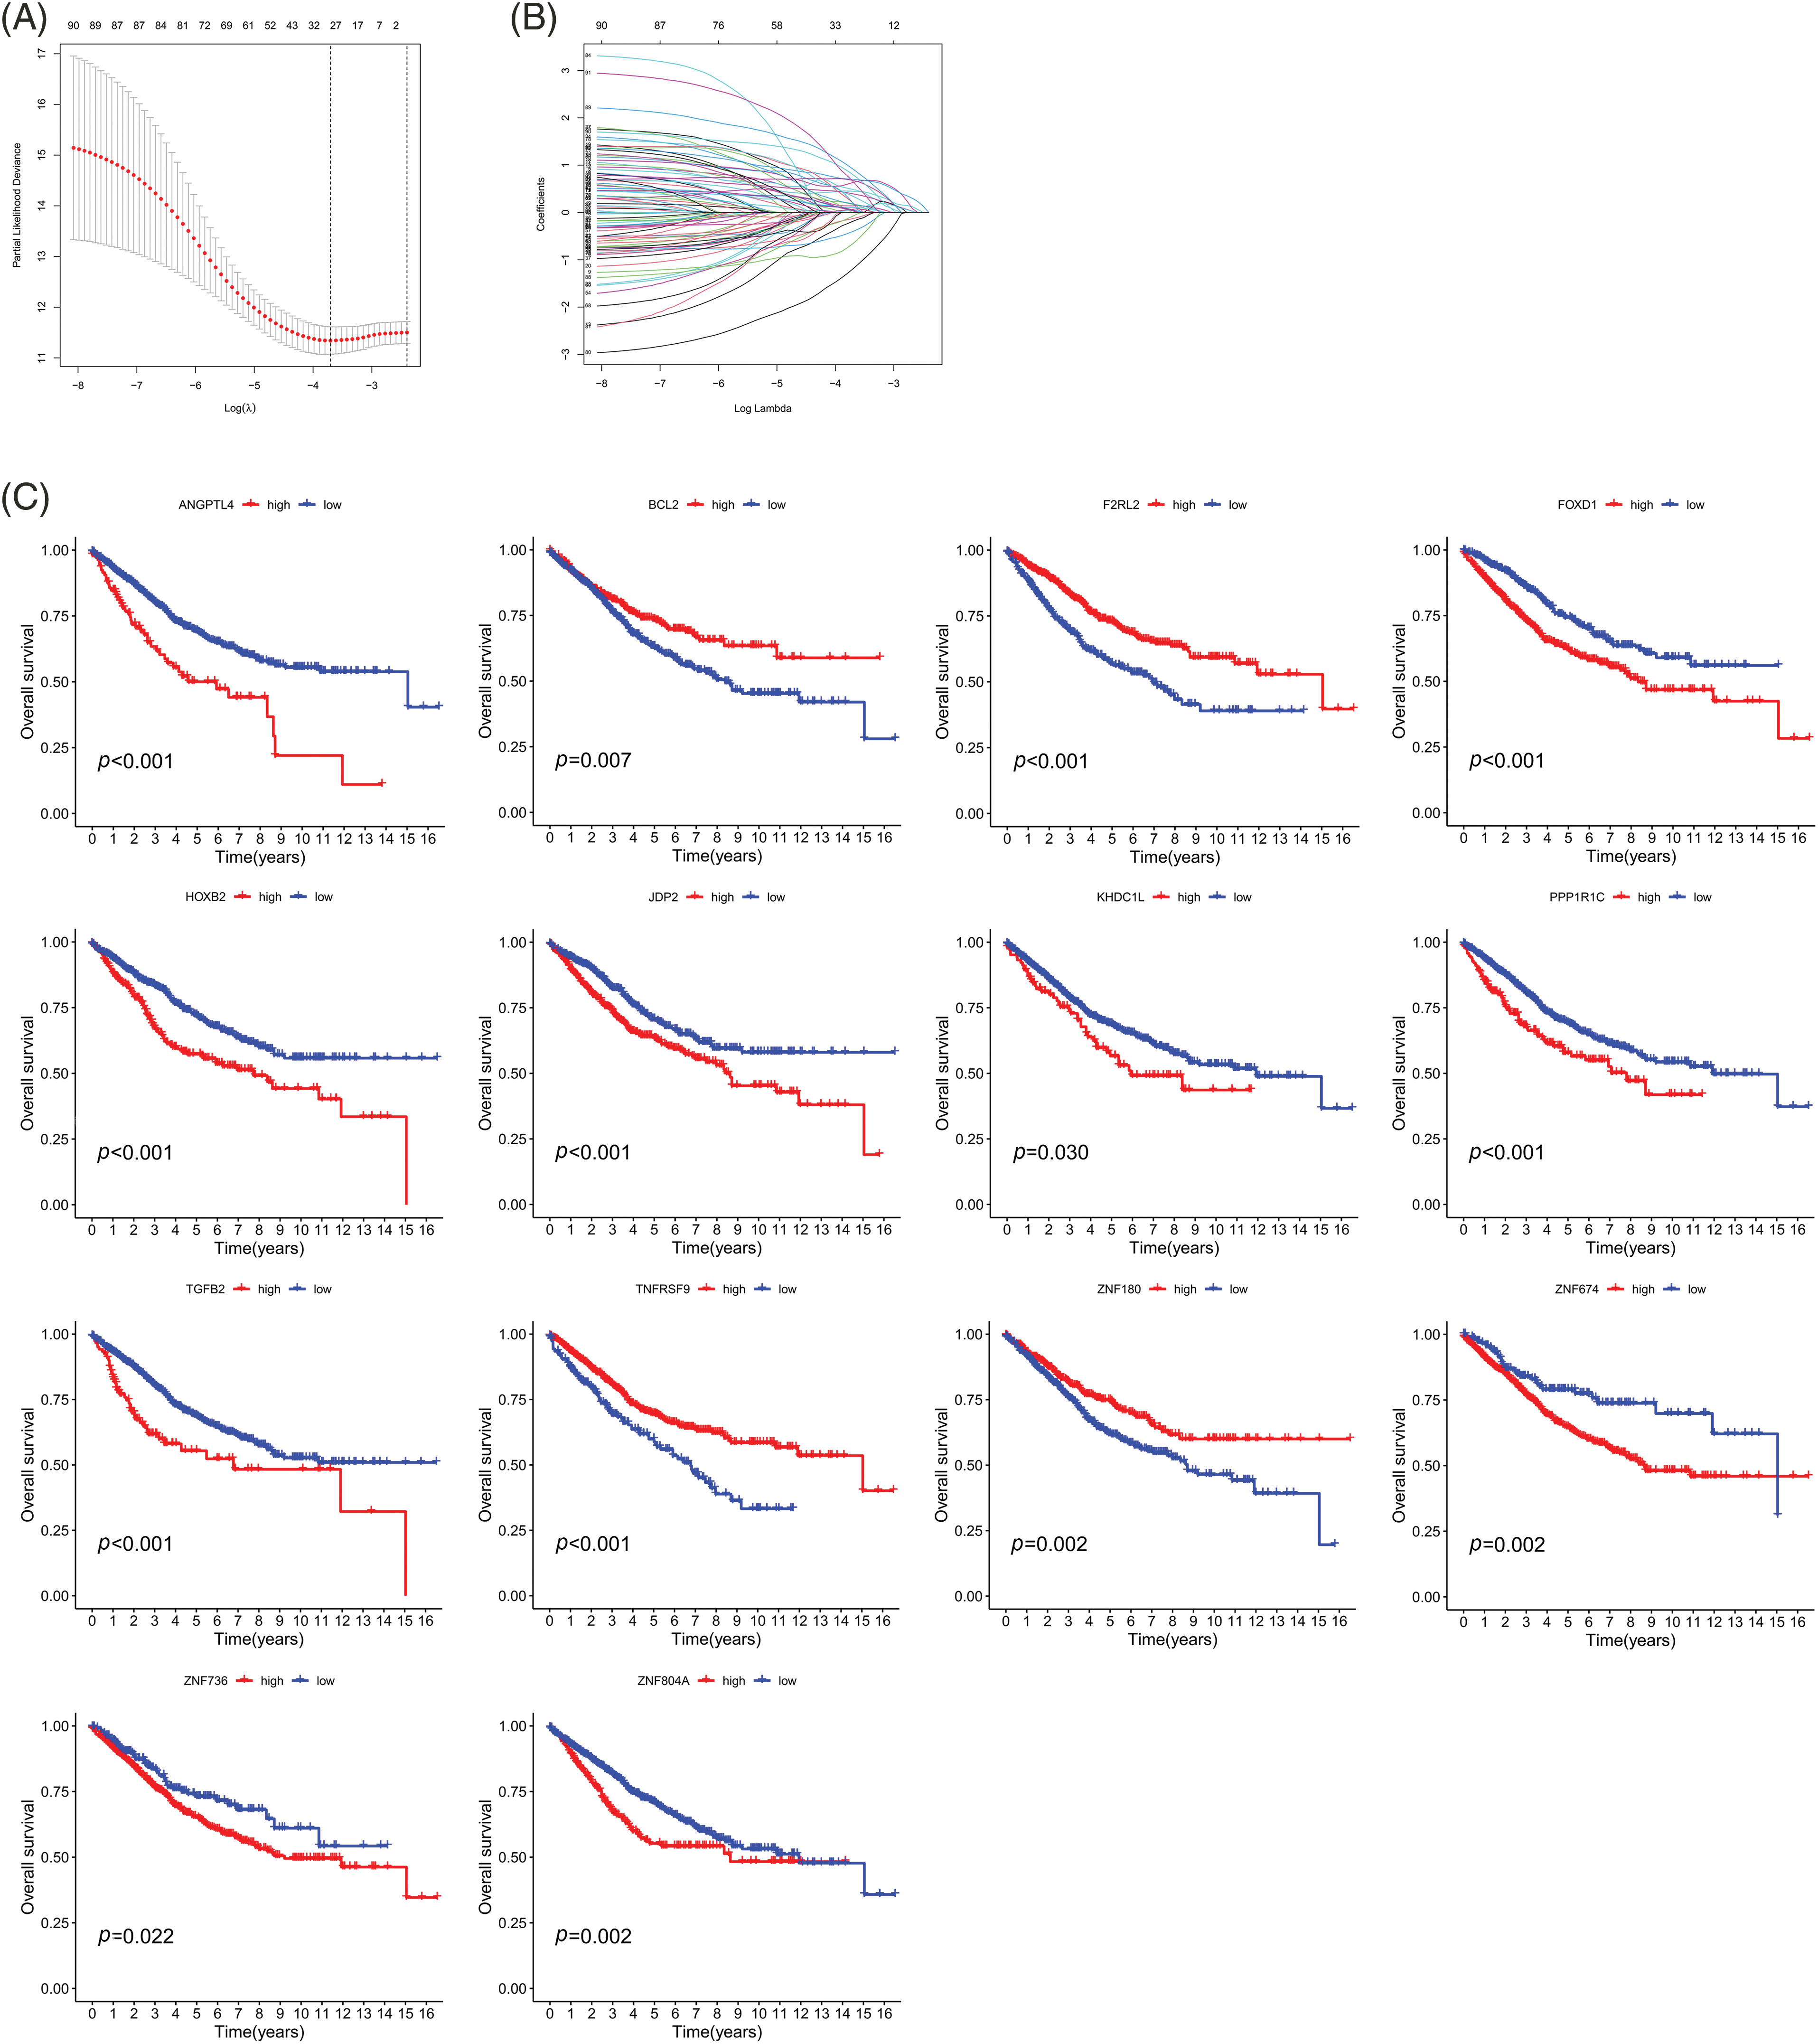
Figure 3: Survival analysis of the 14 genes associated with prognosis. (A) CIs with various lambda values. (B) Individual gene analysis. The coefficient of an independent gene is represented by the vertical axis, while the log value of the gene lambda is represented by the horizontal axis. (C) Survival curves of 14 genes. Key: CI, confidence interval; LASSO, least absolute shrinkage and selection operator; HR, high-risk; LR, low-risk.
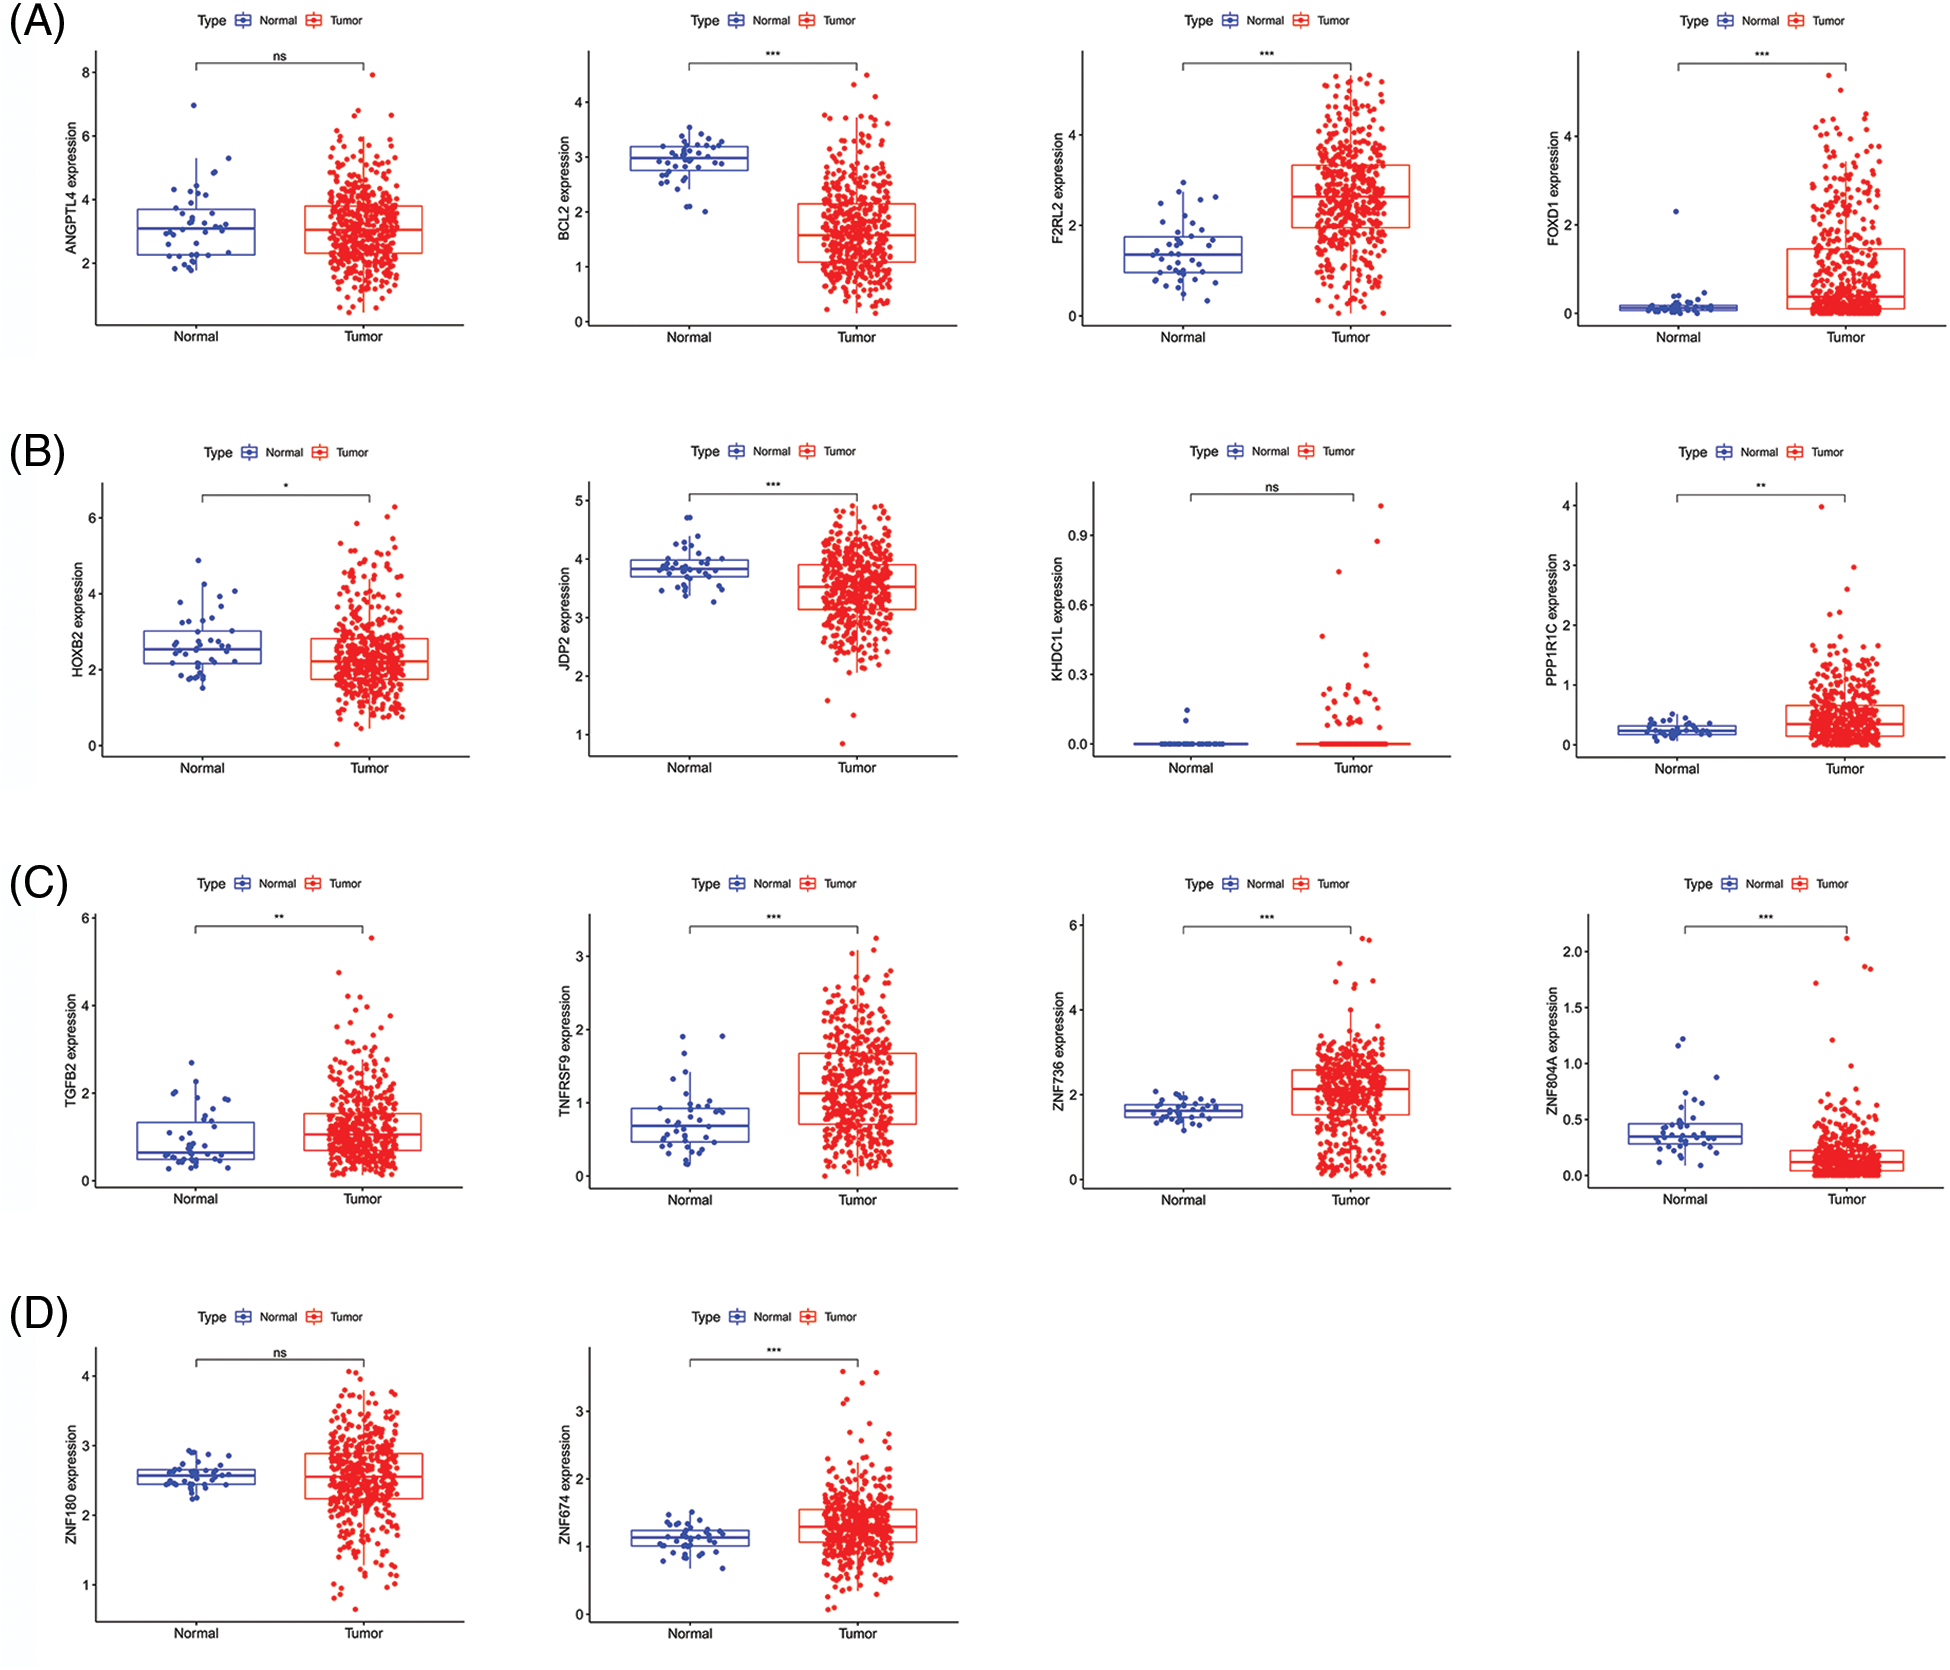
Figure 4: Gene expression in CRC and para-cancerous tissues. (A–D) Comparison of gene expression between CRC tissues and para-cancerous tissues. Key: CRC, colorectal cancer.
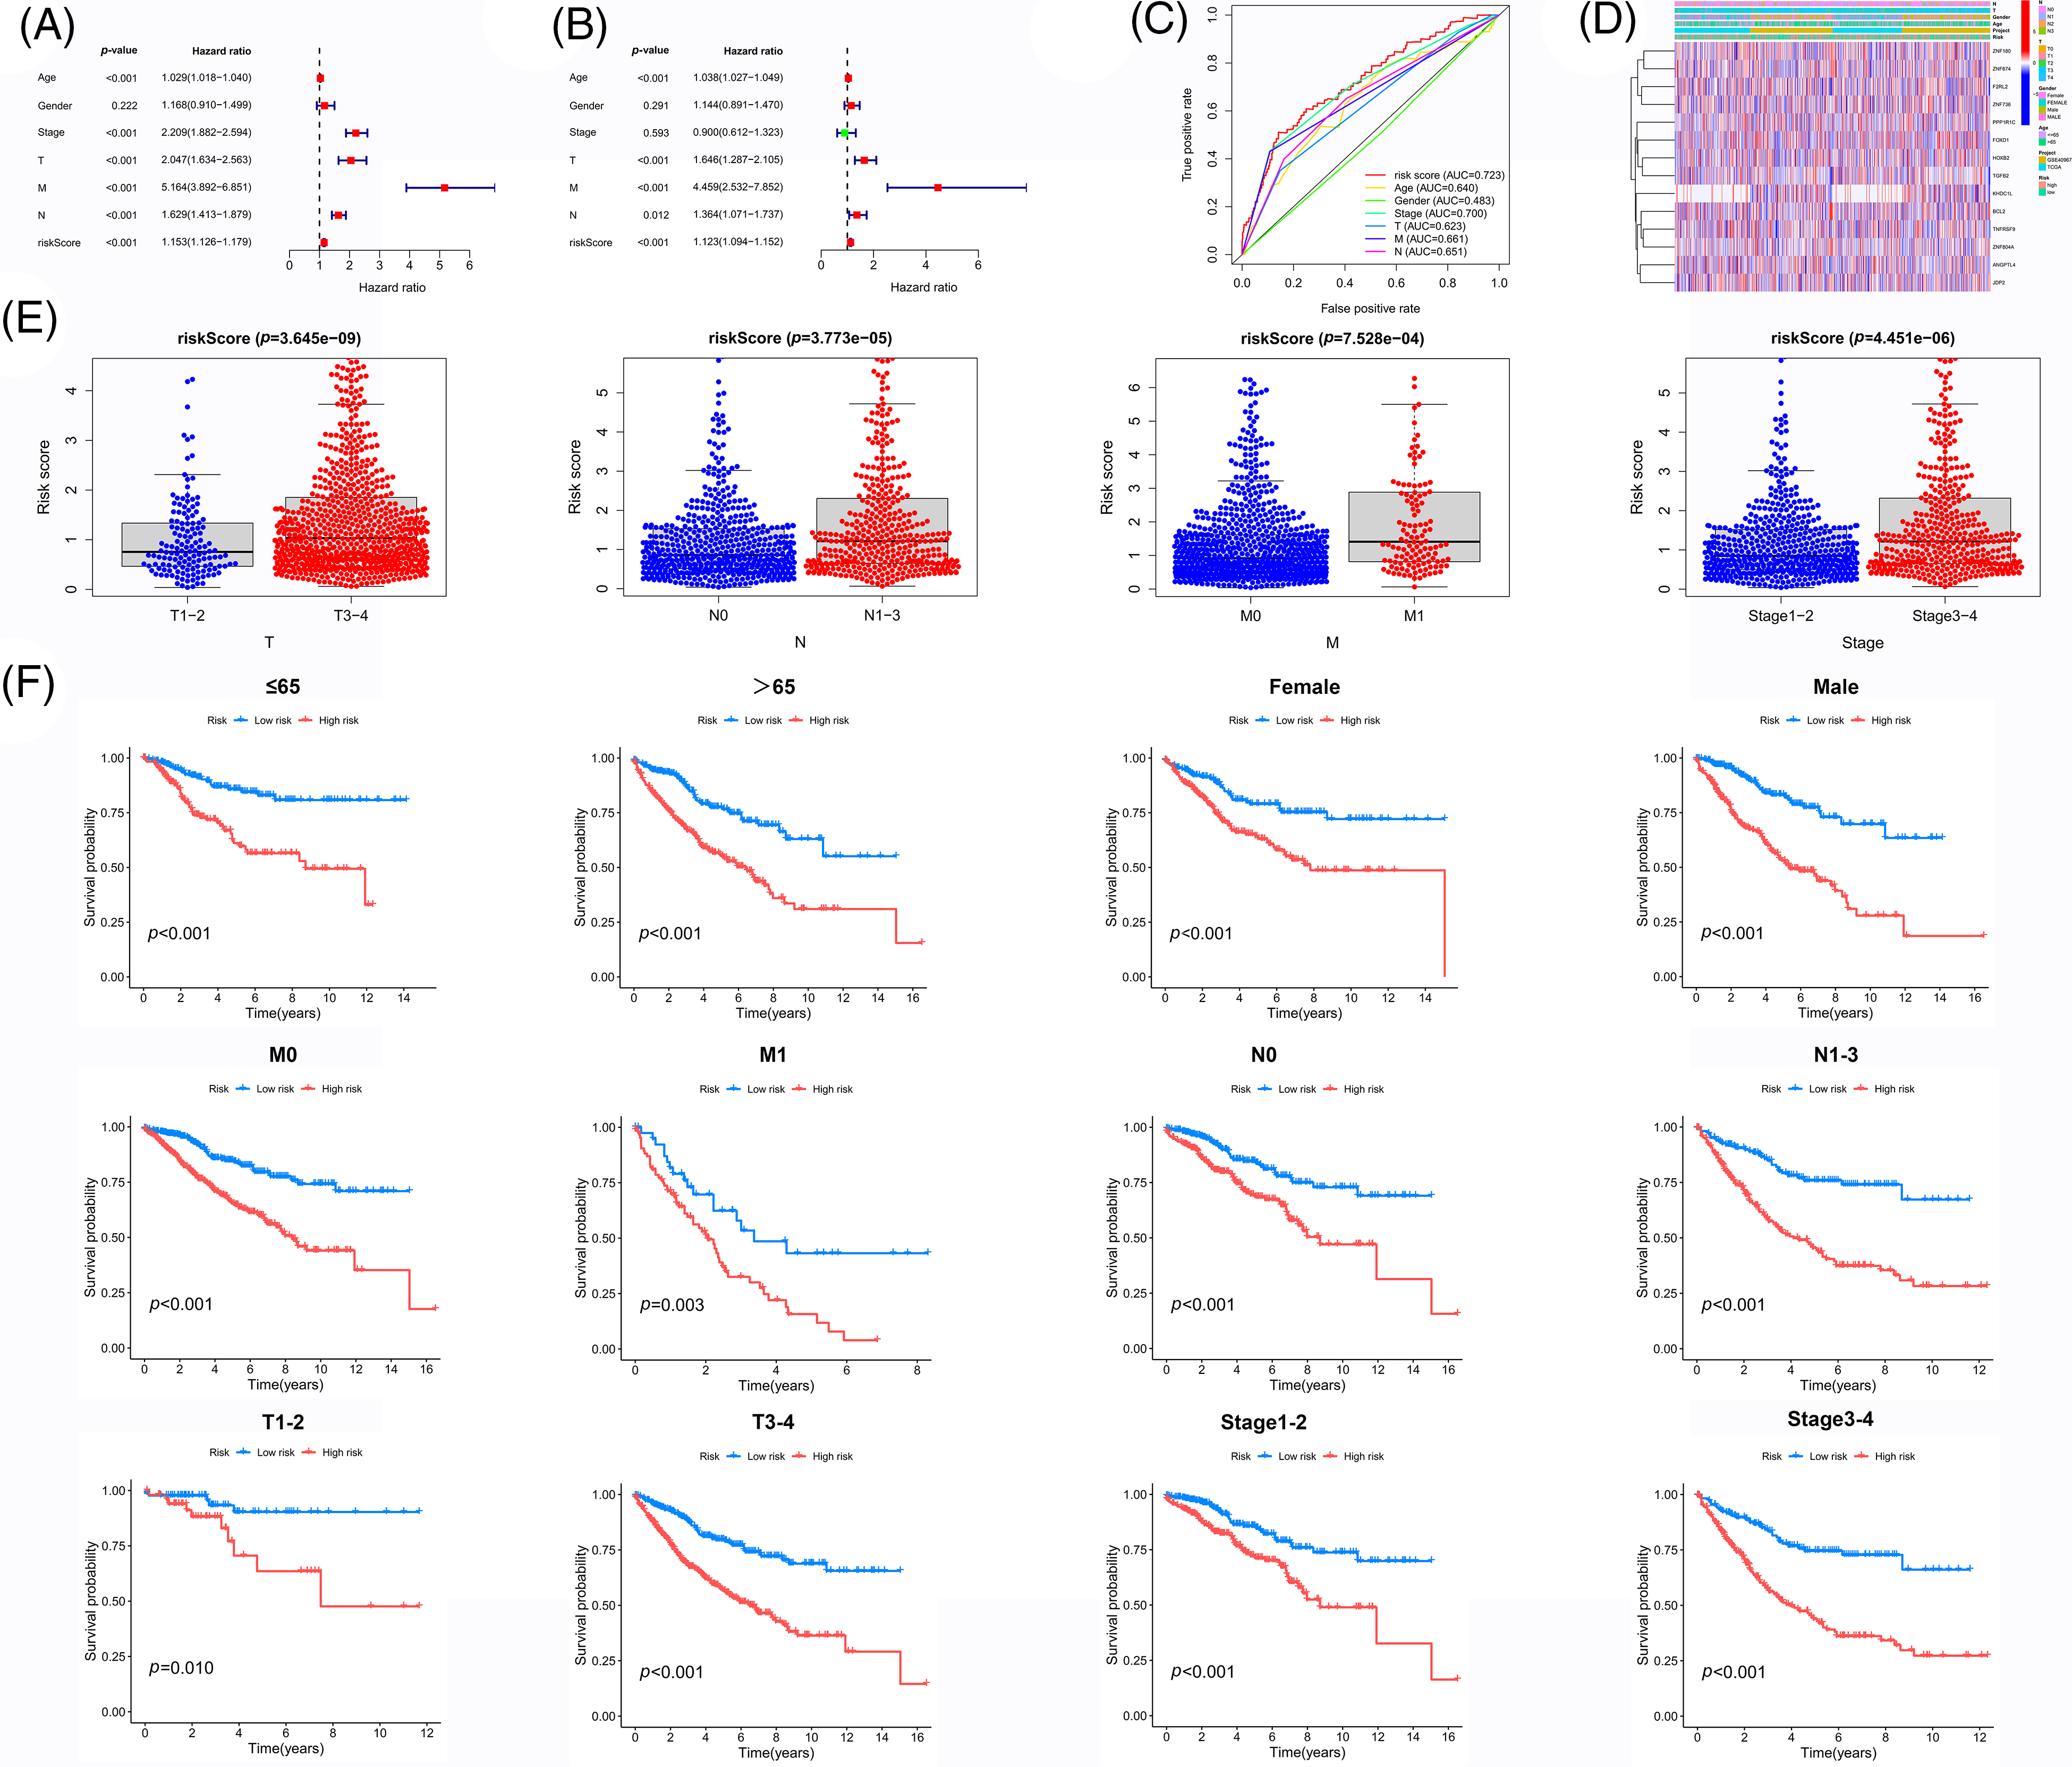
Figure 5: Independent prognostic value of the prognostic model. (A) Univariate analysis and (B) Multivariate and independent prognostic analysis of our novel prognosis model (C) ROC curve associated with multiple indexes (D) Heat map of gene expression, risk values, and clinicopathological features (E) Risk scores of samples among different pathological features (F) Survival analysis of the HR group and LR group for each pathological feature. Key: ROC, receiver operating characteristic curve; HR, high-risk; LR, low-risk.
Validation of the accuracy of our prognostic model
We randomly divided the CRC sample cohort into two groups as mentioned earlier. The risk curve, patient status, and heat map are shown in Figs. 6A–6C, respectively. In the training cohort, the AUC values of the survival rates over the different years analyzed were 0.725, 0.745, and 0.743, respectively, whereas these values were 0.733, 0.663, and 0.648, respectively in the test cohort (Fig. 6D). The survival curve indicated that the HR group had a shorter survival time regardless of the cohort (training cohort or test cohort) (Fig. 6E). Overall, these data demonstrate the precision of the prognostic model. We chose the GSE17536 database for our study for further verification of the model (Figs. 7A–7C). In this cohort, the AUC values of the survival rates were 0.762, 0.711, and 0.669 for 1-year, 3-year, and 5-year periods, respectively and the survival curve was the same as obtained before (Figs. 7D and 7E).
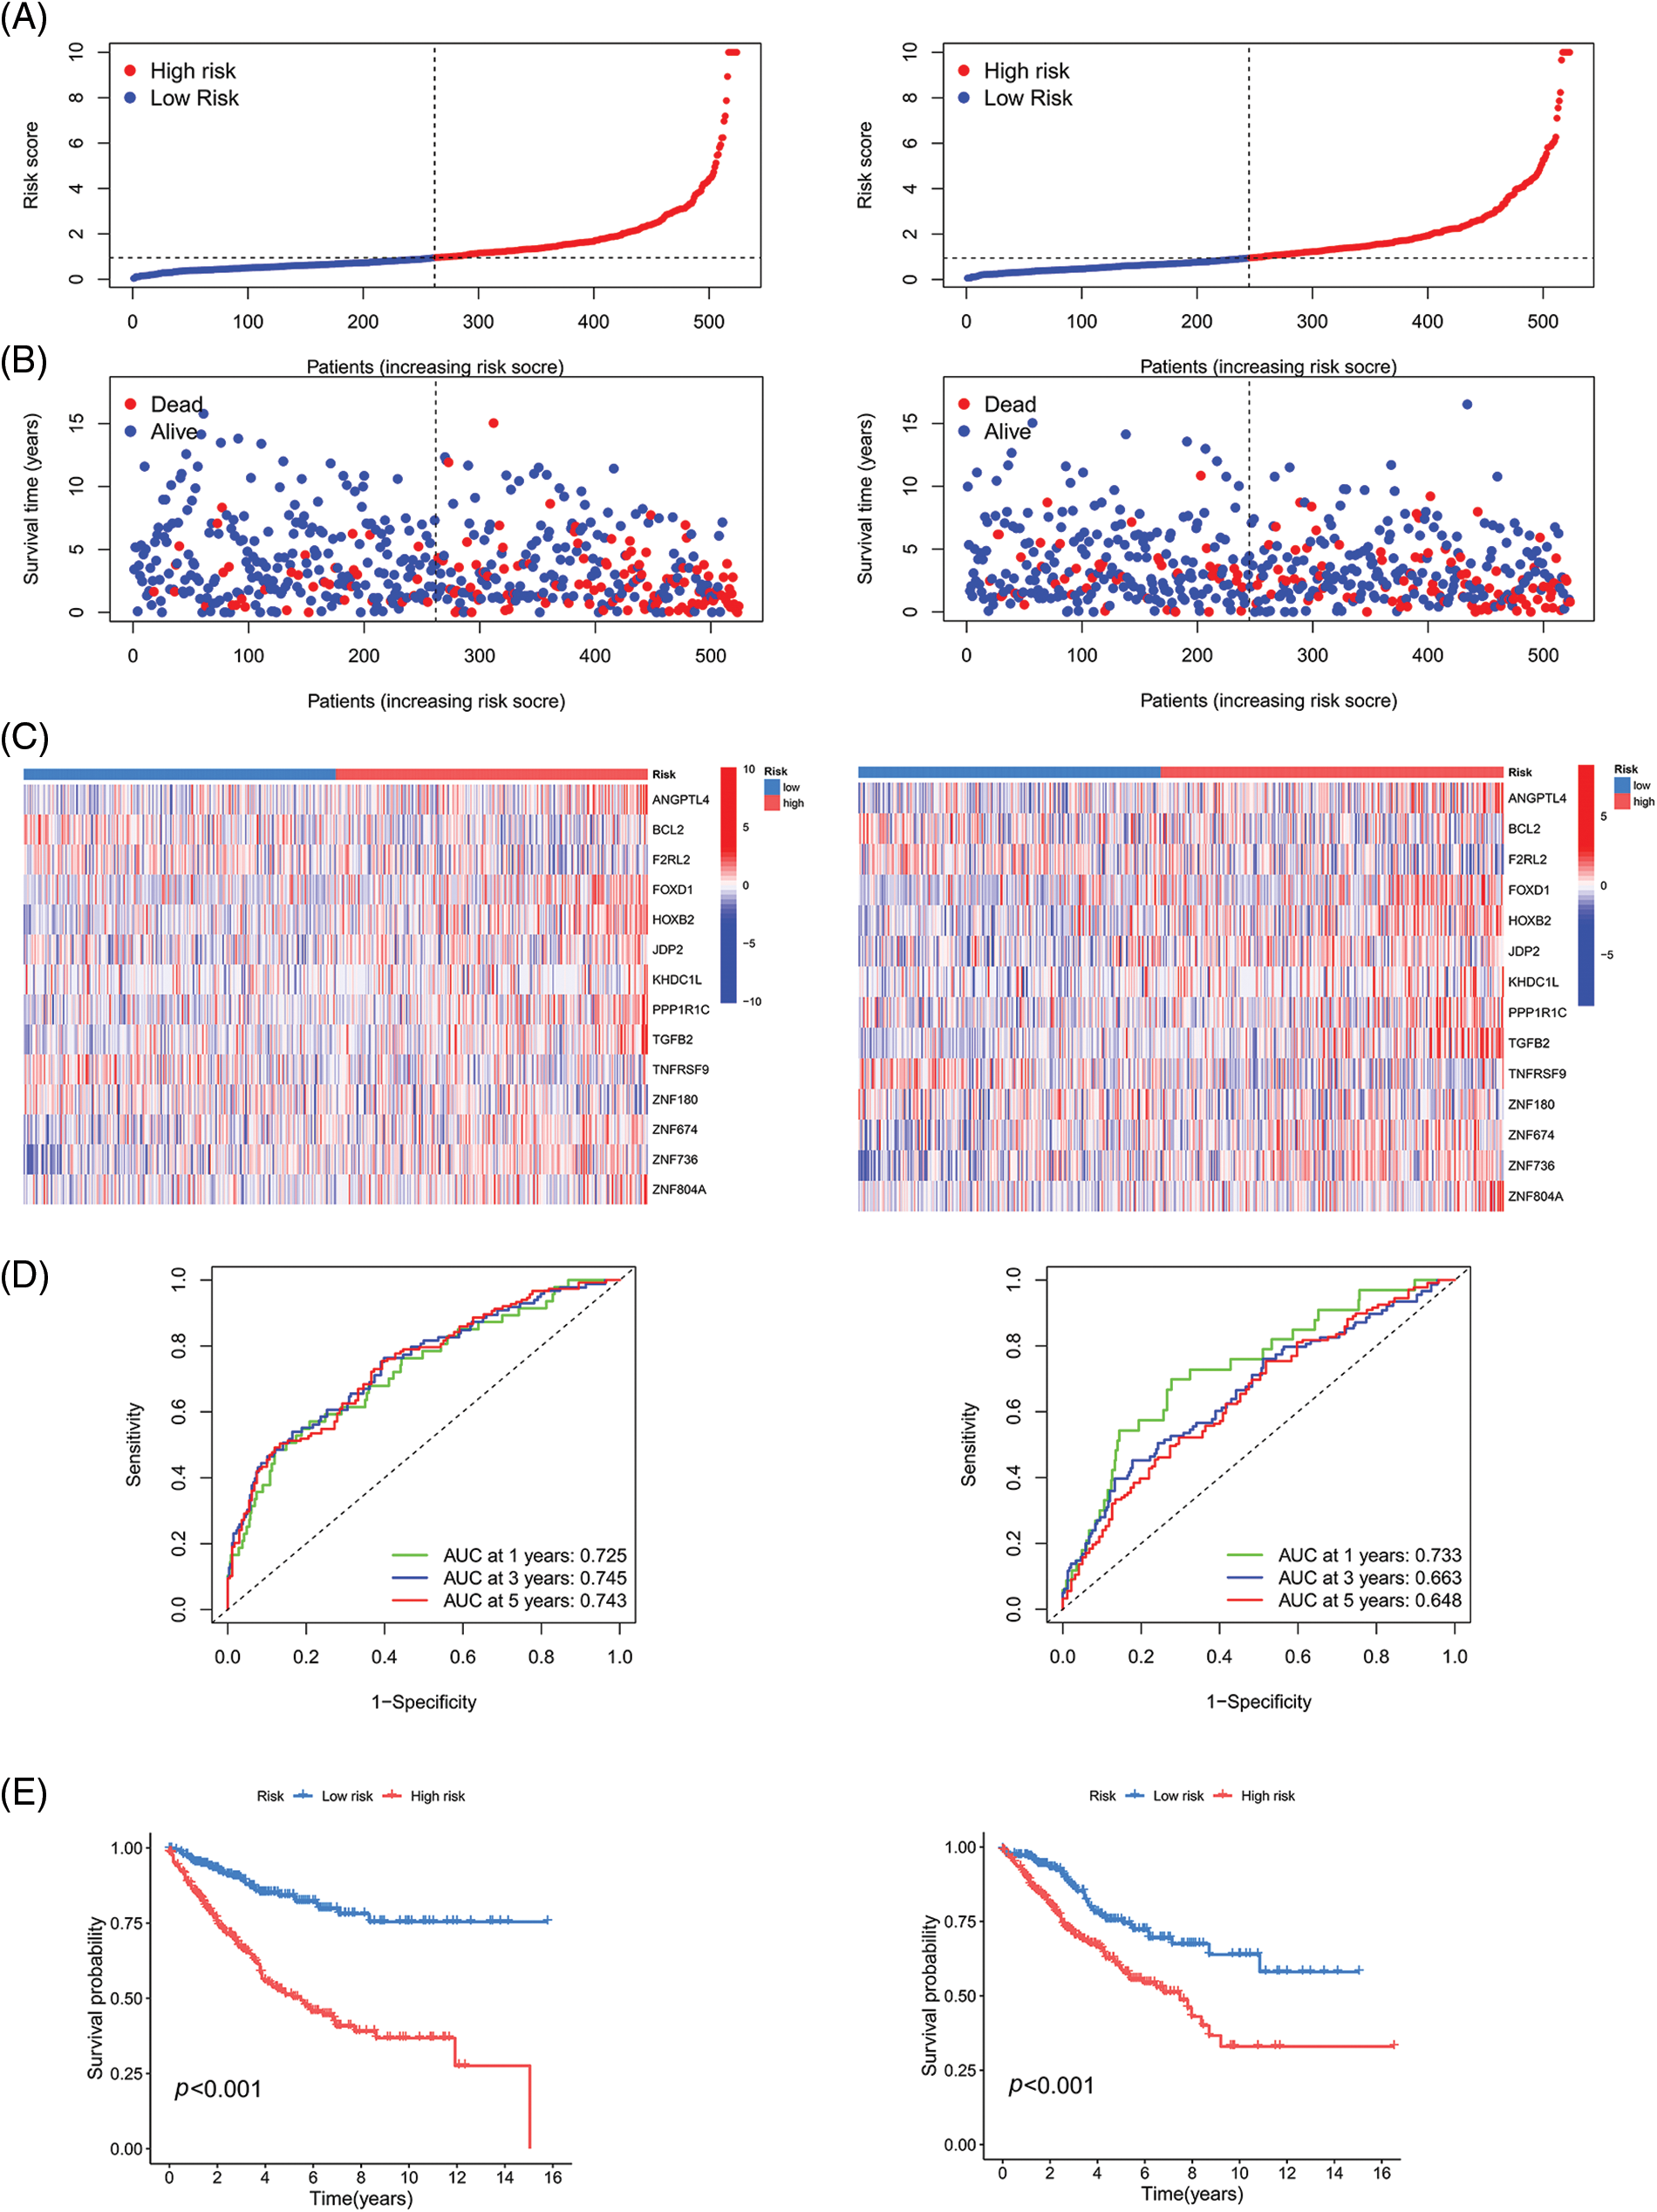
Figure 6: Validation of the prognostic model on TCGA and GSE40967 datasets. (A) Risk curve (B) Patient status (C) Heat map (D) ROC curve, and (E) Survival curve of the training group and testing group. Key: TCGA, The Cancer Genome Atlas; ROC, receiver operating characteristic curve.
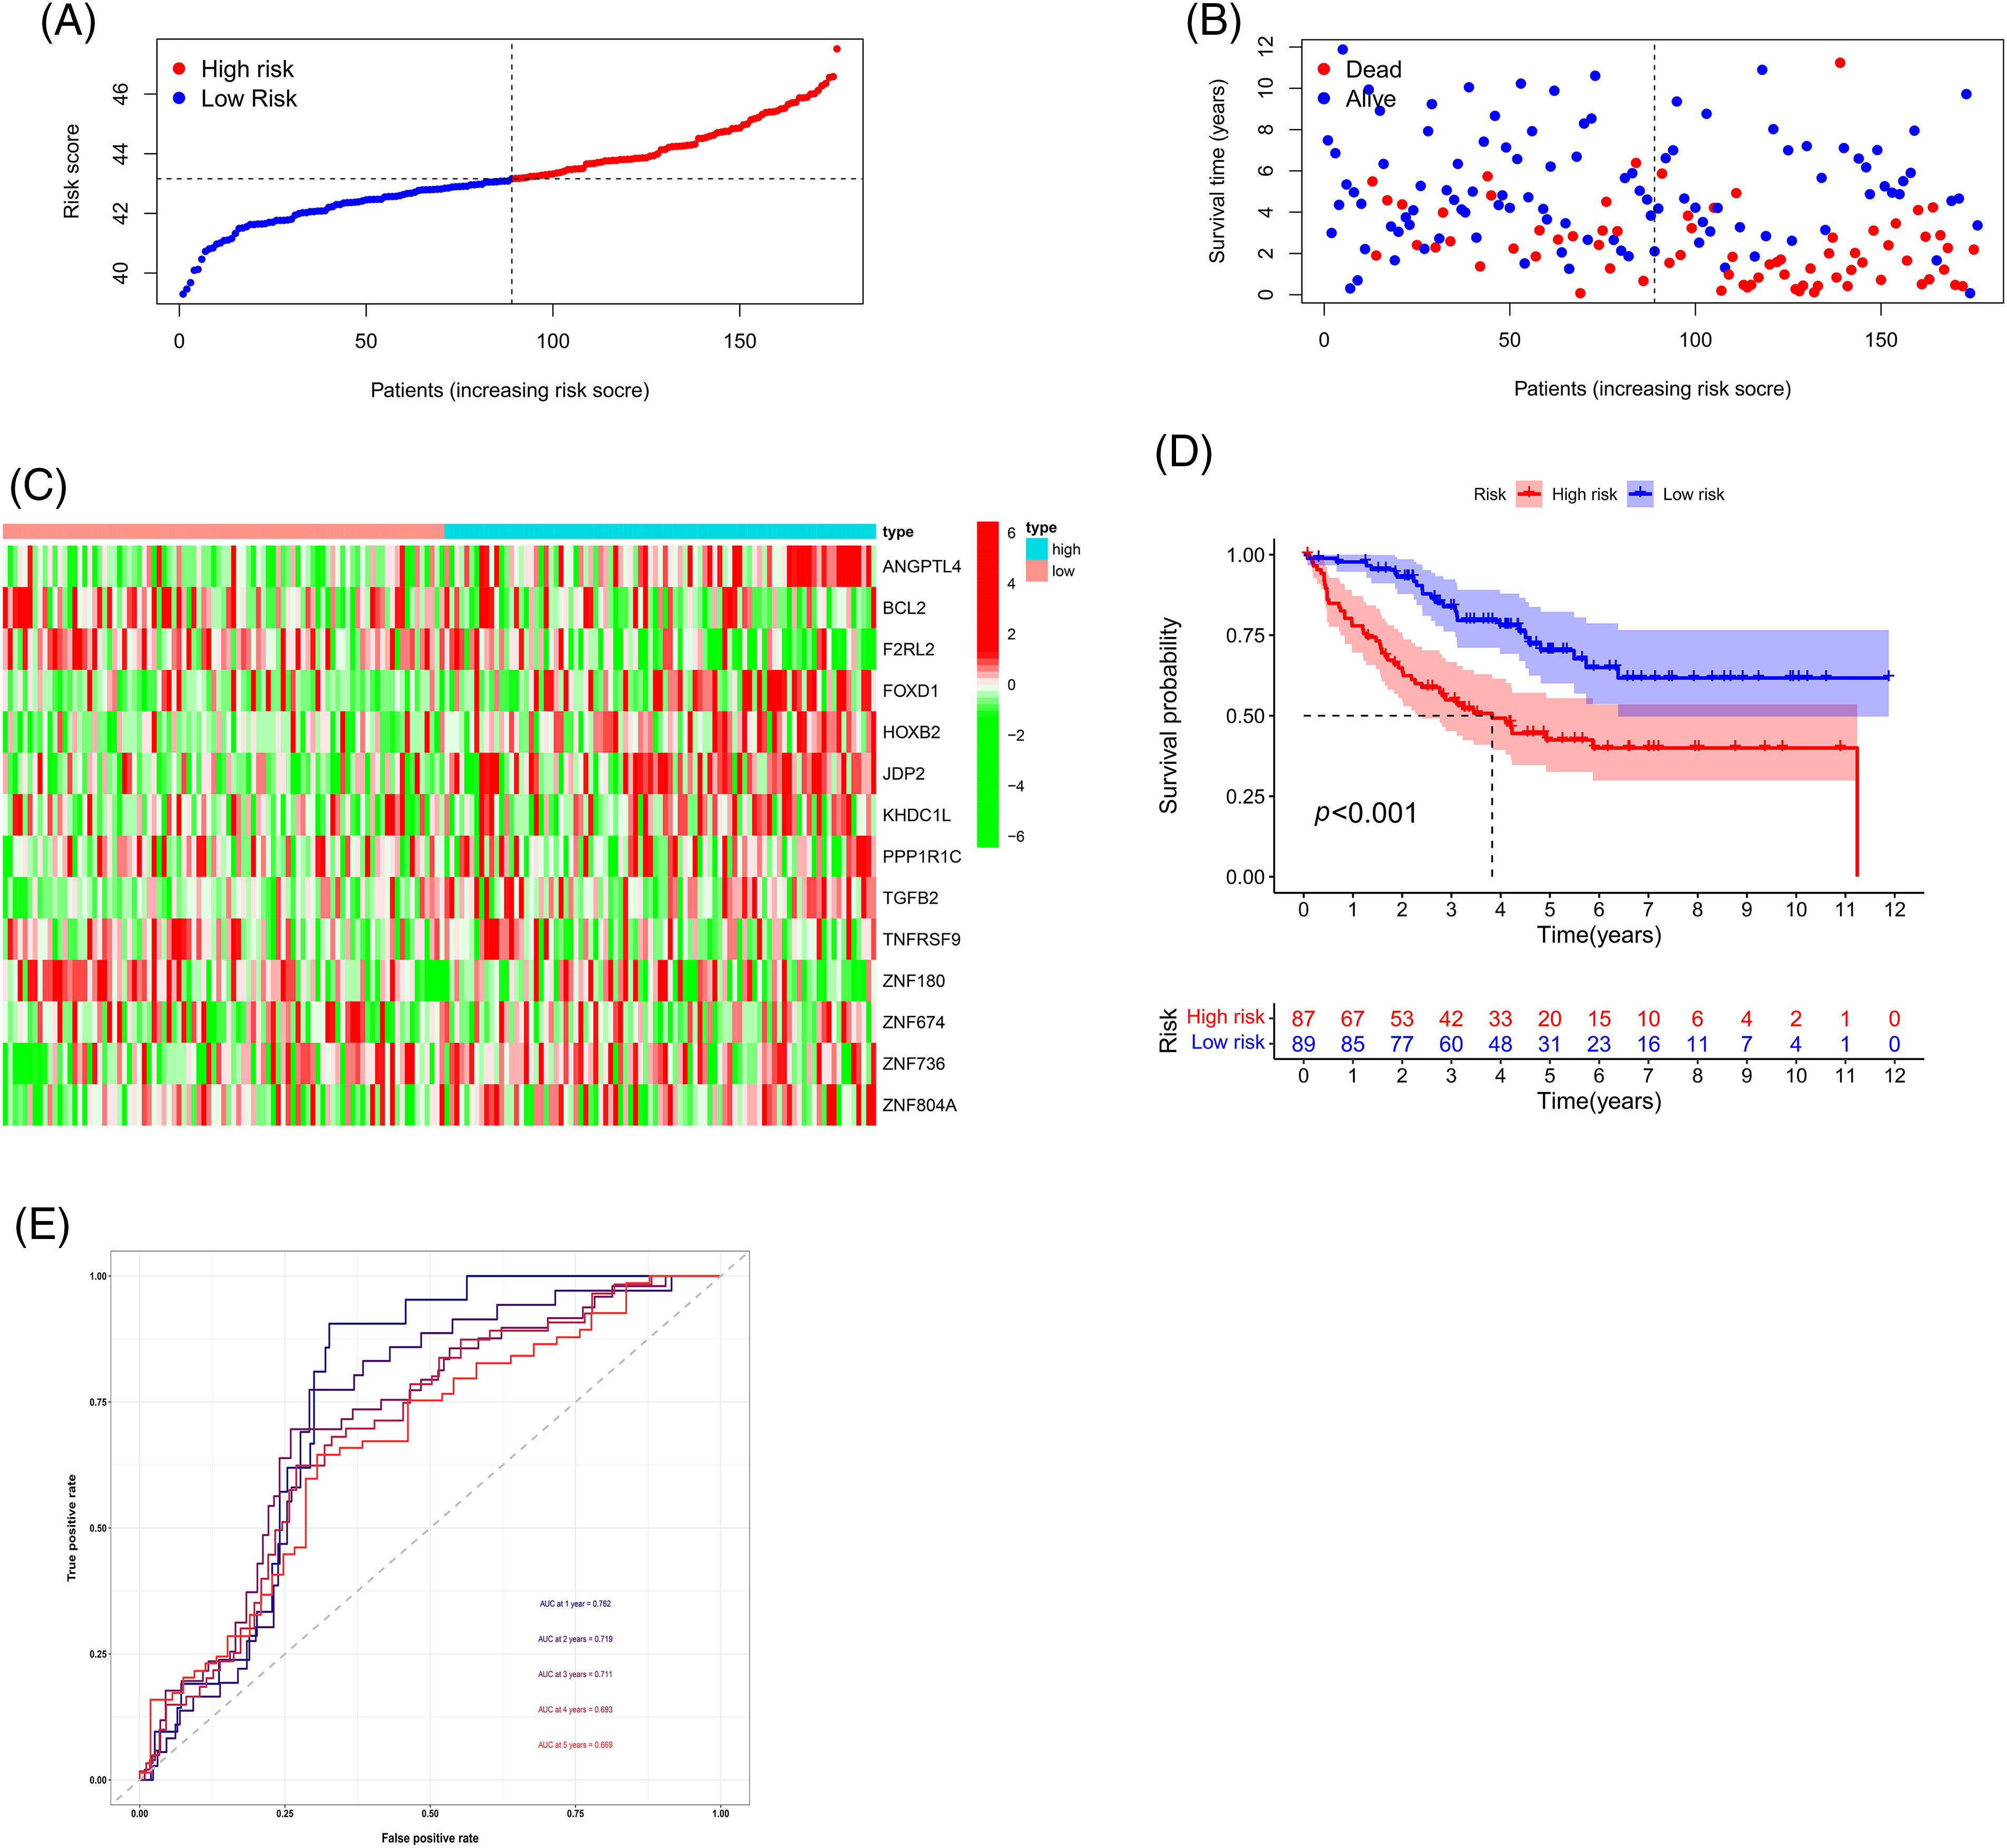
Figure 7: Validation of the prognostic model using the GSE17536 dataset. (A) Risk curve, (B) Patient status, (C) Heat map, (D) Survival curve, and (E) ROC curve of the training group and testing group. Key: ROC, receiver operating characteristic curve.
Comparison of the risk value with the tumor microenvironment and immune cell infiltration
The two main cell types in the TME are stromal cells and immune cells. The ESTIMATE package from R can use expression data to predict stromal cell and immune cell scores and estimate the abundance of these two cell types. The more the abundance of stromal cells or immune cells, the higher stromal scores or immune scores, the lower the purity of the tumor, and vice versa. We first utilized the ESTIMATE package to analyze the TME, which demonstrated that the HR group had lower immune scores, but higher stromal scores. Our hypothesis indicated that the risk value is inversely proportional to the proportion of immune cells and the proportion of stromal cells (Fig. 8A). In addition, we looked at the correlation between risk scores and the level of expression of genes that can act as an immune checkpoint. According to correlation analysis, a total of 45 immune checkpoints was proportional to the risk score (Fig. 8B). We next looked at the correlation between risk scores and the percentage of different immune cells, where p < 0.05 and |R| > 0.1 was set as a standard. The results indicated that the risk scores were positively correlated with neutrophils and M0 macrophages but were inversely proportional to activated memory CD4+ T Cells, CD8+ T Cells, follicular helper T Cells and regulatory T Cells (Tregs) (Figs. 8C and 8D). To summarize, these findings indicated that our novel prognostic model has significance in understanding immune cell infiltration in patients with CRC.
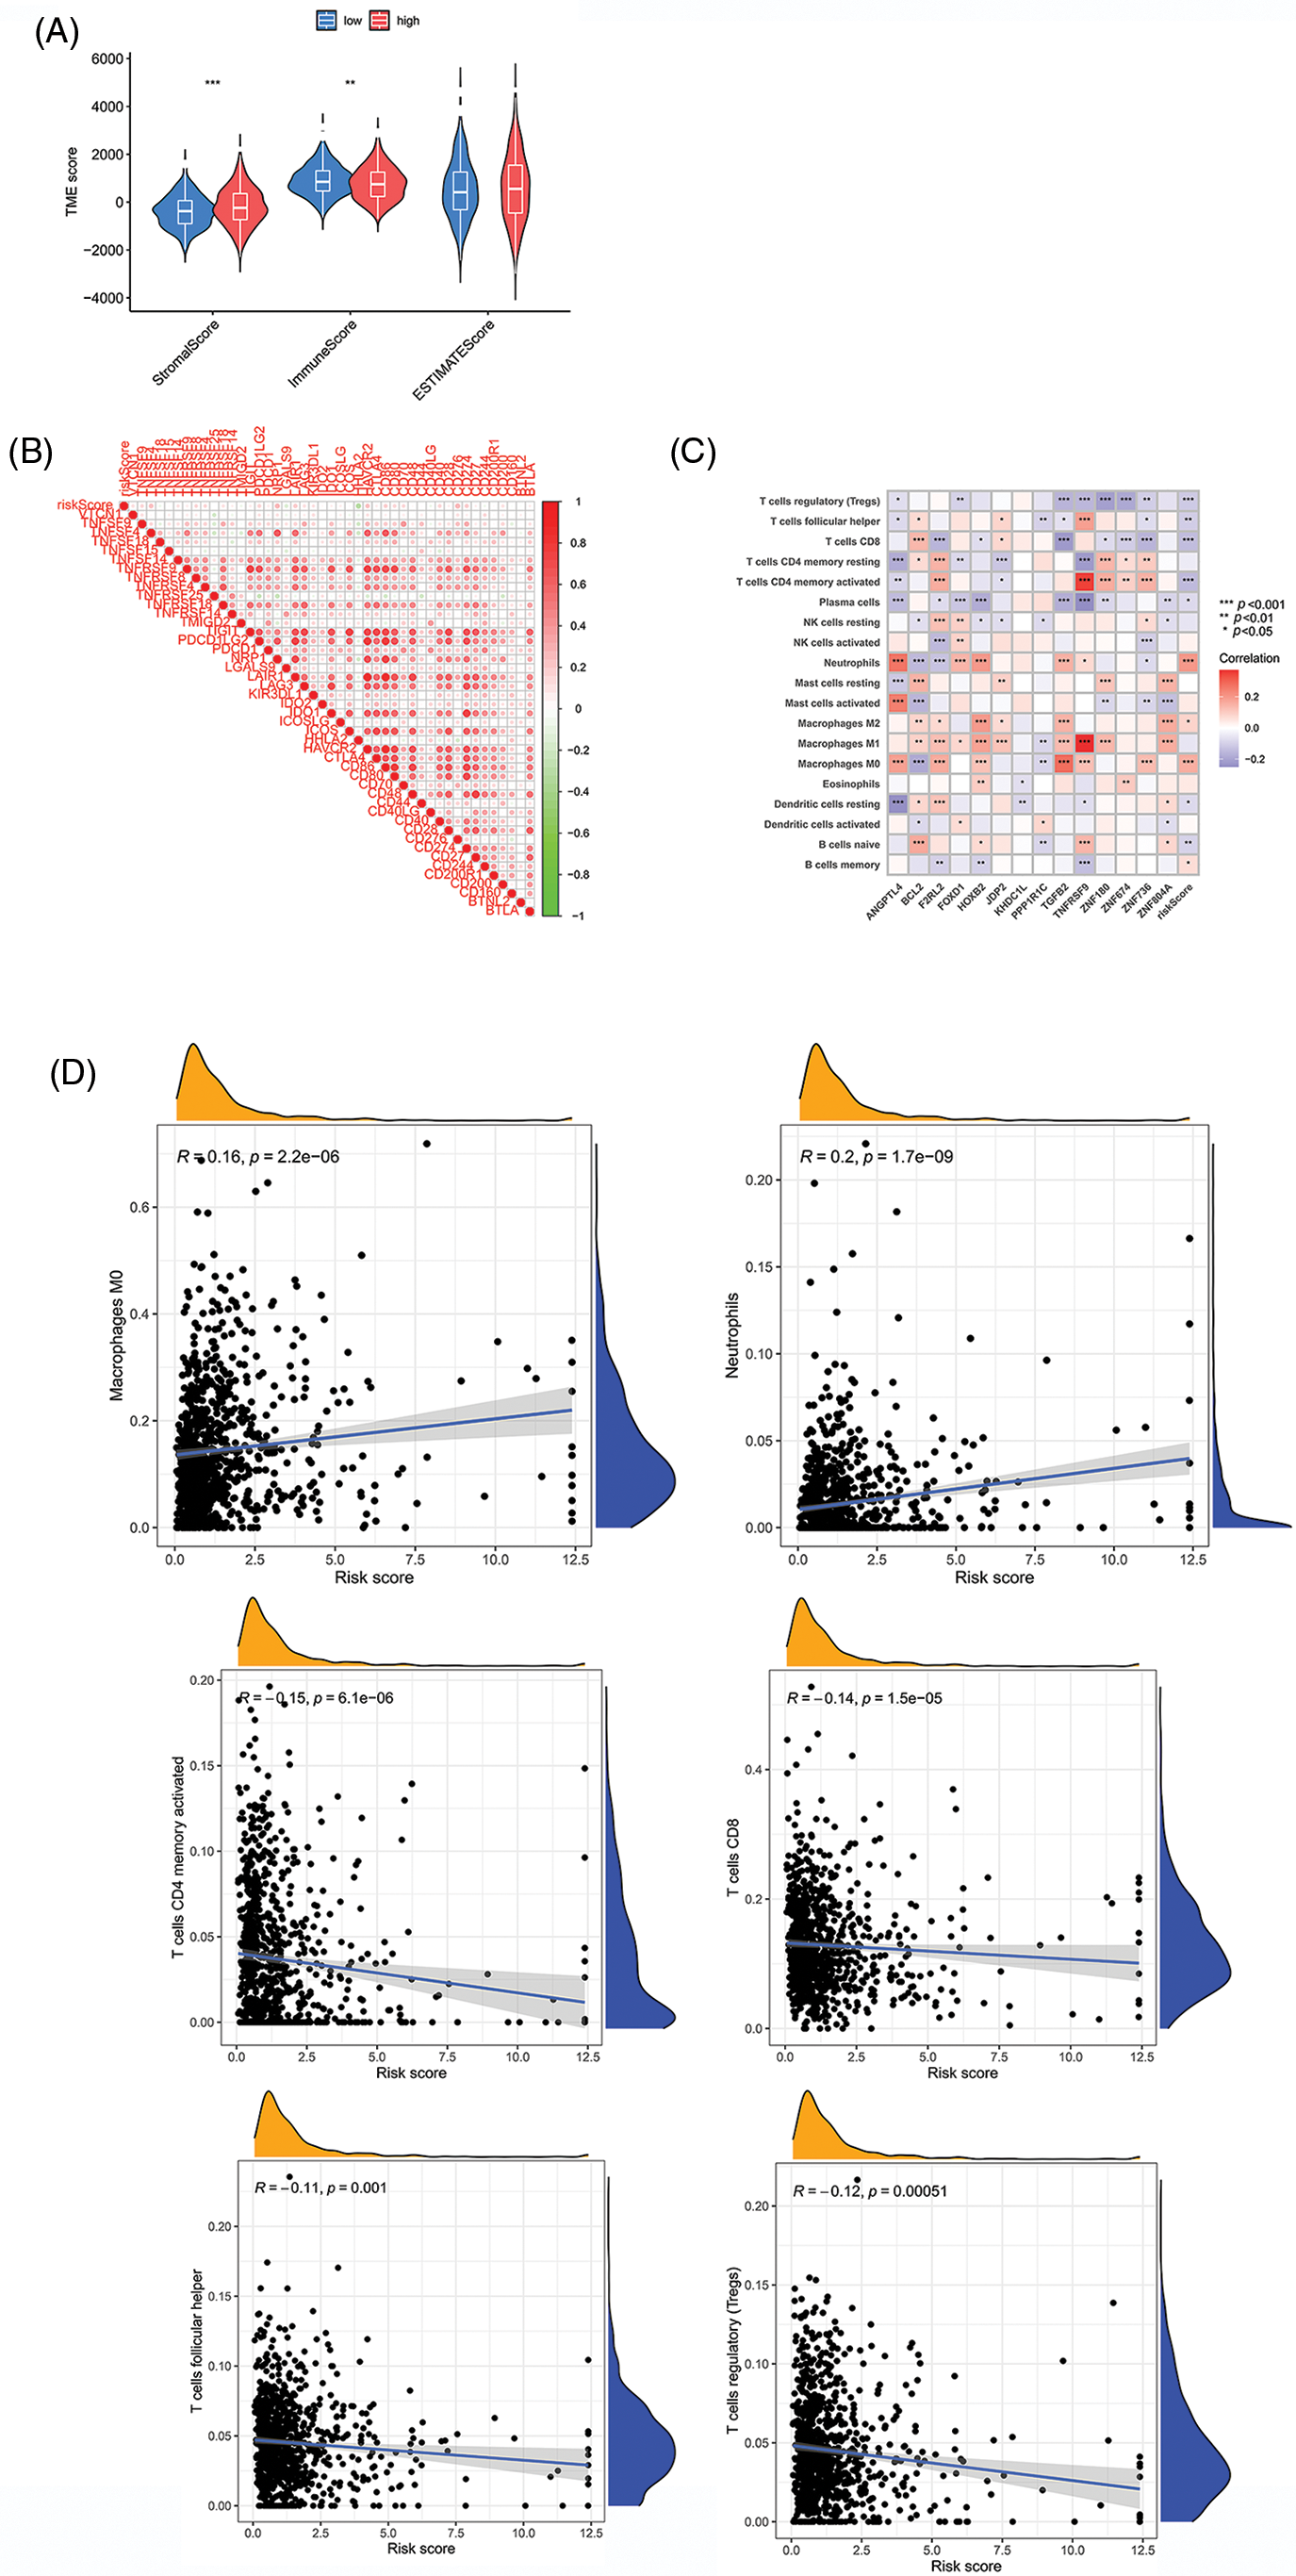
Figure 8: Comparison of risk value with the TME and immune infiltration. (A) Stromal score, immune score, and ESTIMATE scores between two groups. (B) Relationships between risk scores and immune checkpoint genes. (C and D) Correlation indexes between risk scores and proportions of immune cells. Key: TME, tumor microenvironment; ESTIMATE, estimation of stromal and immune cells in malignant tumours using expression data; HR, high-risk; LR, low-risk. *p value < 0.05. **p value < 0.01. ***p value < 0.005.
Relationship between the prognostic model and small molecule targeting agents
Evaluation of the IC50 values of several common small-molecule targeting agents demonstrated that the risk scores correlated with the IC50 values of the 47 agents, indicating that the prognostic model has the potential to mediate drug sensitivity. Additionally, we identified nine small-molecule targeting agents with significantly downregulated IC50 values in the HR group (Fig. 9A) and LR (Fig. 9B) group. These results suggest a potential direction for targeted therapy in CRC patients with different risk factors.
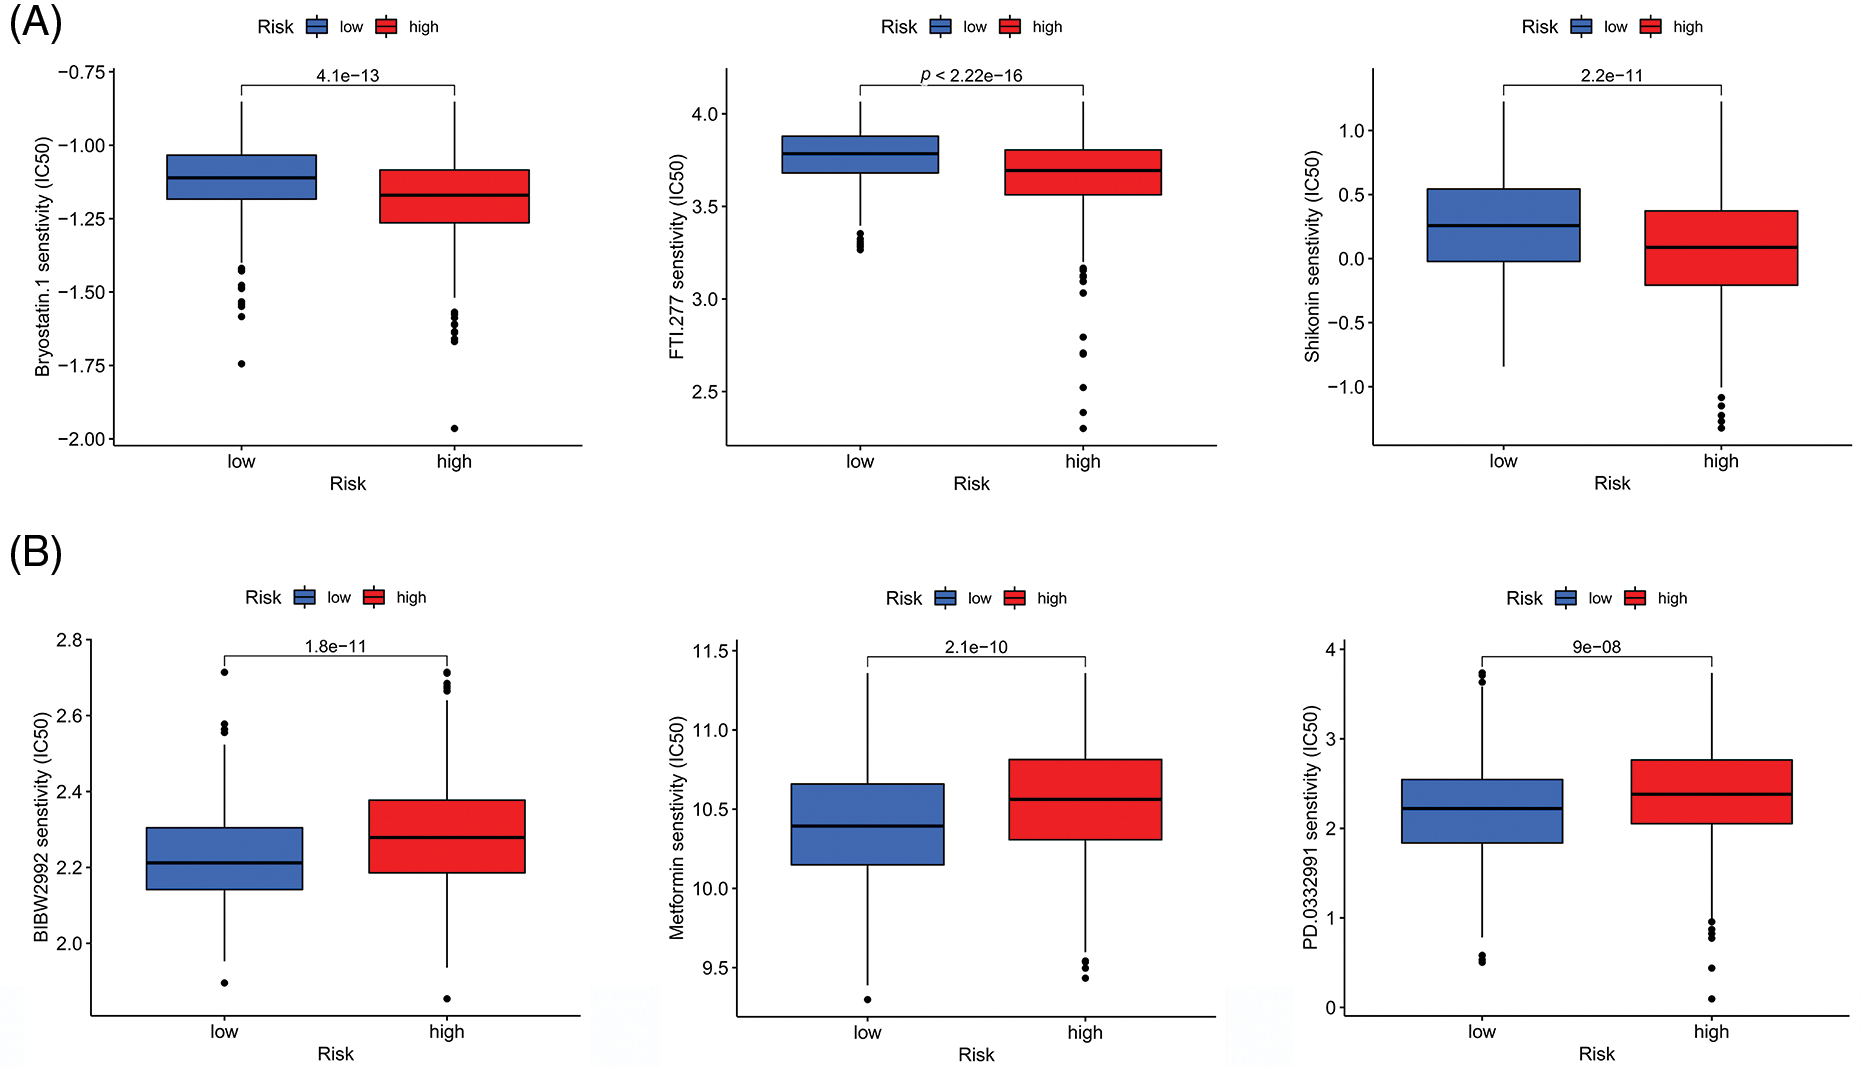
Figure 9: Correlations between the risk score and drug susceptibility. (A) Three drugs that had the lowest p value for sensitivity among the small molecule drugs in the HR group. (B) Three drugs that had the lowest p value for sensitivity among the small molecule drugs in the LR group. Key: HR, high-risk; LR, low-risk.
To date, surgery remains the main approach for the treatment of CRC while radio chemotherapy, targeted therapy, and immunotherapy also contribute to prolonging the survival of patients with advanced CRC [19]. While laparoscopic total mesoscopic excision and complete mesoscopic excision have been recommended as the first options for CRC patients, advanced CRC patients still require radiotherapy and chemotherapy to prevent recurrence and metastasis after surgery [20]. 5-fluorouracil/leucovorin combined with oxaliplatin (FOLFOX) and irinotecan (FOLFIRI) are current therapeutic regimens for advanced CRC [21].
Platinum-based drugs have been the mainstay of CRC treatment since the emergence of cisplatin in the 1970s [22]. Oxaliplatin is a platinum analog and is the most widely used chemotherapeutic drug for the treatment of CRC [23]. Interestingly, a comparison of remission rates and overall survival in patients who were randomly distributed into two groups that received IRI combined with LV and 5-FU or oxaliplatin combined with LV and 5-FU revealed equal effects between the groups in a multicenter study [24]. In another study, patients with metastatic CRC documented good tolerance to the combination of TAS-102 and oxaliplatin, followed by the inhibition of tumor growth [25]. Notwithstanding these results, drug resistance significantly limits the clinical application of oxaliplatin. Studies show that U2AF homology motif kinase 1 (UHMK1) promoted chemoresistance in CRC by regulating the interleukin-6 (IL-6)/signal transducer and activator of transcription 3 (STAT3) axis [26], while HSF1 promoted oxaliplatin resistance via the miR-135β-5p/MUL1/ULK1 axis [27]. Despite these findings, studies on oxaliplatin resistance are insufficient till date, and the association of oxaliplatin-resistant genes with CRC prognosis needs to be further investigated.
Prognostic models are commonly used to assess the risk of a particular health outcome to guide clinical treatment [28]. Advancements in sequencing technology and bioinformatics have promoted the development of epigenetic prognostic models [29]. For example, a novel tumor mutation burden (TMB)-related risk model (TMB-risk) was established, which predicted the survival time of ovarian cancer (OC) patients, evaluated the immune cell infiltration and has good clinical application prospects [30]. Another study revealed the functions of chemokines and chemokine receptors (CCRs) in GC and constructed a prognostic model to guide the personalized treatment of GC patients [31].
In this work, we first performed RNA-seq analysis and differential gene expression analysis to identify upregulated genes in HCT-116/L cells, which were considered oxaliplatin-resistant genes. A total of 14 oxaliplatin-resistant genes were identified: angiopoietin-like 4 (ANGPTL4), B-cell CLL/lymphoma 2 (BCL2), coagulation factor II (thrombin) receptor-like 2 (F2RL2), forkhead box D1 (FOXD1), homeobox B2 (HOXB2), Jun dimerization protein 2 (JDP2), KH homology domain containing 1-like(KHDC1L), protein phosphatase 1, regulatory (inhibitor) subunit 1C (PPP1R1C), transforming growth factor, beta 2 (TGFB2), tumor necrosis factor receptor superfamily, member 9 (TNFRSF9), zinc finger protein 180 (ZNF180), zinc finger protein 674 (ZNF674), zinc finger protein 736 (ZNF736), and zinc finger protein 736 (ZNF804A), and we built a prognosis model to divide patients into HR and LR groups. Previous studies have shown that these genes have both tumorigenic and antitumor effects. For example, ANGPTL4 regulated glucose transporter (GLUT) expression via the phosphoinositide 3-kinase (PI3K)/protein kinase B (AKT) axis to promote glucose metabolism in CRC [32]. As a well-known anti-apoptotic gene, BCL2 plays an important role in CRC. For example, WHSC1 histone methyltransferase inhibits apoptosis of CRC cells by targeting BCL2 [32]. Further, miR-140-3p exerted tumor-suppressive effects by targeting BCL9 and BCL2 [33]. Moreover, FOXD1 plays a crucial role in CRC because it promotes the occurrence and progression of CRC via extracellular signal-regulated protein kinases 1 and 2 (ERK1/2), and maybe a potential clinical target [34]. Similarly, CXCL5 induced tumor angiogenesis in CRC by enhancing FOXD1 via the Protein Kinase B, PKB(AKT)/NF-κB circuit [35]. TGFΒ2 participated in immune cell recruitment in CRC, and its expression was proportional to patient prognosis, indicating its therapeutic value [36]. Another study demonstrated that the lncRNA miR503HG downregulated TGFB2 to inhibit cell migration and invasion [37].
In terms of chemotherapy resistance, lncRNA DLGAP1-AS1 promoted CRC progression and 5-FU resistance via the miR-149-5p/TGFB2/SMAD2 circuit [38]. Similarly, TGFB2 promote the recurrence of CRC, indicating that it has the potential to identify recurrence and chemotherapy resistance, which helps guide targeted clinical therapy [37]. BCL2 is known to promote the expression of interleukin-6 (IL-6) under hypoxia, which is downstream of miR-338-5p, indicating that miR-338-5p could influence the development of drug resistance through BCL2 [39]. Additionally, miR-139-5p inhibited tumor metastasis in CRC and promoted chemotherapy resistance by targeting BCL2 [40]. However, the role of ZNF180 in chemoresistance has not yet been reported and warrants further study.
There are a few published prognostic models related to drug resistance genes. For example, researchers identified six genes that could predict sensitivity to oxaliplatin and guide clinical treatment in prostate adenocarcinoma (PRAD) [41]. A previous report established a model for CRC that included four oxaliplatin-resistant genes, which helped to identify colon cancer cases with poor prognosis [40]. Nothwithstanding these findings, these previous studies had the following shortcomings: (1) rectal cancer patients were not included; and (2) the relationships between the prognostic model with the TME and drug sensitivity were not explored. Thus, these previous models have little significance in terms of guiding optimal treatment. Therefore, in our study, we divided the cohort into training and test groups and verified our prognostic model in both the groups to ensure its accuracy. Finally, we analyzed the relationship between the risk score, the TME, and drug sensitivity.
The TME includes cells and extracellular components[42], and the continuous interactions between tumors and the TME play a critical role in tumorigenesis [43] Alterations in TME components are known to result in aberrant signal transduction [44].
The ECM and several cytokines are important components of the TME. They can affect the proliferation, metastasis, and treatment response of tumors. The ECM was suggested to have the potential to be considered a novel therapeutic target in CRC [45]. For example, the expression of tissue inhibitor of matrix metalloproteinase-1 (TIMP1) in the ECM was increased and was negatively correlated with survival in CRC liver metastases, indicating that TIMP1 is a potential diagnostic and therapeutic target [46]. In another study, miR-215-5p inhibited CRC cell metastasis by regulating ECM-receptor interactions, suggesting that miR-215-5p may be useful for treatment [47]. Another study reported that CD55 was overexpressed in the ECM and may serve as a useful target for immunotherapy [48].
Cells in the TME include cancer-associated fibroblasts (CAFs) also known as tumor-associated fibroblasts (TAFs), tumor-associated macrophages (TAMs), and tumor-associated T cells. According to a report, CAFs regulated PTPN2 and promoted CRC metastasis via the JAK/STAT axis [49]. Similarly, exosomal miR-146a-5p and miR-155-5p could enter CAFs and activate them via the JAK2-STAT3/NF-κB pathway to promote CRC metastasis [50]. TAFs are important components of the TME. For example, high-mobility gene group A2 (HMGA2) directly bound to the CCL2 promoter, which stimulated its transcription, and induced CCL2 secretion to ultimately promote macrophage recruitment and CRC progression [51]. Further, the TCF4/CCL2/CCR2 signaling pathway was found to promote CRC liver metastasis via TAM recruitment and M2 polarization [52]. T cells also play a vital role in tumor immune killing. A previous study demonstrated that inhibition of proprotein convertase subtilisin/kexin type 9 (PCSK9) improved antitumor effects by increasing CD8+ T cell infiltration in programmed death-ligand 1 (PD-1) therapy [53]. In addition, Long noncoding RNA KCNQ1 opposite strand/antisense transcript 1 (lncRNA KCNQ1OT1) was found to be a potential immunotherapeutic target that enhances CD8+ T-cell responses in CRC [54,55].
The TME is also tightly connected to the effect of oxaliplatin [56]. For example, infiltrating TAMs were much more common in oxaliplatin-resistant patients than in other patients. Moreover, the 6-methyladenosine (m6A) transmethylase METTL3 was upregulated in tumors, and TAMs have been shown to contribute to oxaliplatin resistance via the METTL3-regulated m6A modification in tumors [57]. LncRNA CCAL was also overexpressed in the TME, and was translocated from CAFs to tumor cells through exosomes. This resulted in the inhibition of cell apoptosis, conferred chemical resistance, and activation of the β-catenin pathway [58]. Additionally, acidosis reduced vitamin D receptor (VDR) expression by lowering the expression of peroxisome proliferator-activated receptor delta (PPARD), and inhibited oxaliplatin resistance [59].
There are however several limitations to our study. First, the sample size was small, and we will include patients from our hospital in the future to expand the sample size to improve the model and increase its accuracy. Second, the network database lacked the disease-free survival time data and third, additional experimental verification was required.
To summarize, we developed a novel prognostic model for oxaliplatin resistance, which can be utilized to stratify CRC risk and guide therapy. A previous study reported a model that included four oxaliplatin-resistant genes, which helped to identify colon cancer cases with poor prognosis. In contrast, the advantages of our model are that our cohort includes both colon cancer and rectal cancer samples. Further, the relationship between the risk score and the TME and drug sensitivity was also analyzed, which has significance for guiding clinical treatment. A limitation however is that the sample size was insufficient, which has inspired us to include data from patients in our hospital for detailed study. We hope that with further research our model will be able to predict both CRC patient outcomes and responses to chemotherapy.
Acknowledgement: We would like to thank Guangzhou Gene Denovo Biotechnology Co., Ltd. for their assistance with the sequencing and bioinformatics analysis. We also thank the Laboratory of Secondary Clinical College of Nanjing Medical University for providing equipment support and technical guidance.
Funding Statement: This study was financed by the National Natural Science Foundation (81874058 to Jianping Zhang).
Author Contributions: The authors confirm their contribution to the paper as follows: JZ initiated the study. QG designed the technological roadmap, performed most of the experiments, and wrote the manuscript. CL, JZ, and XG downloaded and analyzed RNA-seq data and clinicopathological characteristics from TCGA and GEO databases. ZT performed TME, immune cell infiltration, and drug sensitivity online analyses. All authors reviewed the results and approved the final version of the manuscript.
Availability of Data and Materials: The datasets generated during and/or analyzed during the current study are available from the corresponding author on reasonable request.
Ethics Approval: Not applicable.
Conflicts of Interest: The authors declare that they have no conflicts of interest to report regarding the present study.
References
1. Miller KD, Nogueira L, Devasia T, Mariotto AB, Yabroff KR, Jemal A, et al. Cancer treatment and survivorship statistics. 2022 CA: Cancer J Clin. 2022;72:409–36. [Google Scholar] [PubMed]
2. Cao W, Chen HD, Yu YW, Li N, Chen WQ. Changing profiles of cancer burden worldwide and in China: a secondary analysis of the global cancer statistics 2020. Chin Med J. 2021;134(7):783–91. [Google Scholar] [PubMed]
3. Cai S, Li Y, Ding Y, Chen K, Jin M. Alcohol drinking and the risk of colorectal cancer death: a meta-analysis. Eur J Cancer Prev. 2014;23(6):532–9. [Google Scholar] [PubMed]
4. Audisio RA, Papamichael D. Treatment of colorectal cancer in older patients. Nat Rev Gastroenterol Hepatol. 2012;9(12):716–25. [Google Scholar] [PubMed]
5. Siriwardena AK, Mason JM, Mullamitha S, Hancock HC, Jegatheeswaran S. Management of colorectal cancer presenting with synchronous liver metastases. Nat Rev Clin Oncol. 2014;11(8):446–59. [Google Scholar] [PubMed]
6. Graham MA, Lockwood GF, Greenslade D, Brienza S, Bayssas M, Gamelin E. Clinical pharmacokinetics of oxaliplatin: a critical review. Clin Cancer Res. 2000;6:1205–18. [Google Scholar] [PubMed]
7. Bogliolo S, Cassani C, Gardella B, Musacchi V, Babilonti L, Venturini PL, et al. Oxaliplatin for the treatment of ovarian cancer. Expert Opin Investig Drugs. 2015;24(9):1275–86. [Google Scholar] [PubMed]
8. Stordal B, Pavlakis N, Davey R. Oxaliplatin for the treatment of cisplatin-resistant cancer: a systematic review. Cancer Treat Rev. 2007;33(4):347–57. [Google Scholar] [PubMed]
9. Martinez-Balibrea E, Martínez-Cardús A, Ginés A, Ruiz de Porras V, Moutinho C, Layos L, et al. Tumor-related molecular mechanisms of oxaliplatin resistance. Mol Cancer Ther. 2015;14(8):1767–76. [Google Scholar] [PubMed]
10. Li Y, Gan Y, Liu J, Li J, Zhou Z, Tian R, et al. Downregulation of MEIS1 mediated by ELFN1-AS1/EZH2/DNMT3a axis promotes tumorigenesis and oxaliplatin resistance in colorectal cancer. Signal Transduct Target Ther. 2022;7(1):1–13. [Google Scholar]
11. Huang W, Han Z, Sun Z, Feng H, Zhao L, Yuan Q, et al. PAK6 promotes homologous-recombination to enhance chemoresistance to oxaliplatin through ATR/CHK1 signaling in gastric cancer. Cell Death Dis. 2022a;13(7):658. [Google Scholar] [PubMed]
12. Huang K, Zhang X, Hao Y, Feng R, Wang H, Shu Z, et al. Hypoxia tumor microenvironment activates GLI2 through HIF-1α and TGF-β2 to promote chemotherapy resistance of colorectal cancer. Comput Math Methods Med. 2022b;2022(2):2032895. [Google Scholar] [PubMed]
13. Xu Q, Liu Y, Sun W, Song T, Jiang X, Zeng K, et al. Blockade LAT1 mediates methionine metabolism to overcome oxaliplatin resistance under hypoxia in renal cell carcinoma. Cancers. 2022;14(10):2551. [Google Scholar] [PubMed]
14. Zhang X, Zheng S, Hu C, Li G, Lin H, Xia R, et al. Cancer- associated fibroblast-induced lncRNA UPK1A-AS1 confers platinum resistance in pancreatic cancer via efficient double-strand break repair. Oncogene. 2022b;41(16):2372–89. [Google Scholar] [PubMed]
15. Qi X, Chen X, Zhao Y, Chen J, Niu B, Shen B. Prognostic roles of ceRNA network-based signatures in gastrointestinal cancers. Front Oncol. 2022;12:1–12. [Google Scholar]
16. Sun R, Wang X, Chen J, Teng D, Chan S, Tu X, et al. Development and validation of a novel cellular senescence-related prognostic signature for predicting the survival and immune landscape in hepatocellular carcinoma. Front Genet. 2022;13:949110. [Google Scholar] [PubMed]
17. Gong M, Wang J, Gao W, Liu Q, Chen J, Wang G, et al. Establishment of an endoplasmic reticulum stress-related signature predicting outcomes of gastric adenocarcinoma patients. Front Genet. 2022;13:944105. [Google Scholar] [PubMed]
18. Zhang Y, Li L, Chu F, Xiao X, Zhang L, Li K, et al. Identification and validation of an m6A-related LncRNA signature to predict progression-free survival in colorectal cancer. Pathol Oncol Res. 2022a;28:1–13. [Google Scholar]
19. Zhang Y, Chen Z, Li J. The current status of treatment for colorectal cancer in China: a systematic review. Medicine. 2017;96(40):e8242. [Google Scholar] [PubMed]
20. Pedrazzani C, Moro M, Ghezzi G, Ruzzenente A, Delaini GG, Guglielmi A. What should we intend for minimally invasive treatment of colorectal cancer? Surg Oncol. 2014;23(3):147–54. [Google Scholar] [PubMed]
21. Gustavsson B, Carlsson G, Machover D, Petrelli N, Roth A, Schmoll HJ, et al. A review of the evolution of systemic chemotherapy in the management of colorectal cancer. Clin Colorectal Cancer. 2015;14(1):1–10. [Google Scholar] [PubMed]
22. Alassadi S, Pisani MJ, Wheate NJ. A chemical perspective on the clinical use of platinum-based anticancer drugs. Dalton Trans. 2022;51(29):10835–46. [Google Scholar] [PubMed]
23. Bano N, Najam R, Qazi F, Mateen A. Clinical features of oxaliplatin induced hypersensitivity reactions and therapeutic approaches. Asian Pac J Cancer Prev. 2016;17(4):1637–41. [Google Scholar] [PubMed]
24. Kalofonos HP, Aravantinos G, Kosmidis P, Papakostas P, Economopoulos T, Dimopoulos M, et al. Irinotecan or oxaliplatin combined with leucovorin and 5-fluorouracil as first-line treatment in advanced colorectal cancer: a multicenter, randomized, phase II study. Ann Oncol. 2005;16(6):869–77. [Google Scholar] [PubMed]
25. Cecchini M, Kortmansky JS, Cui C, Wei W, Thumar JR, Uboha NV, et al. A phase 1b expansion study of TAS-102 with oxaliplatin for refractory metastatic colorectal cancer. Cancer. 2021;127(9):1417–24. [Google Scholar] [PubMed]
26. Gao X, Bao W, Bai J, Fan K, Li L, Li Y. UHMK1 aids colorectal cancer cell proliferation and chemoresistance through augmenting IL-6/STAT3 signaling. Cell Death Dis. 2022;13(5):424. [Google Scholar] [PubMed]
27. Wang H, Wang X, Zhang H, Deng T, Liu R, Liu Y, et al. The HSF1/miR-135b-5p axis induces protective autophagy to promote oxaliplatin resistance through the MUL1/ULK1 pathway in colorectal cancer. Oncogene. 2021;40:4695–708. [Google Scholar] [PubMed]
28. Damen JAA, Moons KGM, van Smeden M, Hooft L. How to conduct a systematic review and meta-analysis of prognostic model studies. Clin Microbiol Infect. 2020;29(4):434–40. [Google Scholar]
29. Liang X, Wang Z, Dai Z, Zhang H, Cheng Q, Liu Z. Promoting prognostic model application: a review based on gliomas. J Oncol. 2021;2021:7840007. [Google Scholar] [PubMed]
30. Wang H, Liu J, Yang J, Wang Z, Zhang Z, Peng J, et al. A novel tumor mutational burden-based risk model predicts prognosis and correlates with immune in filtration in ovarian cancer. Front Immunol. 2022b;13:943389. [Google Scholar] [PubMed]
31. He C, He L, Lu Q, Xiao J, Dong W. The functions and prognostic values of chemokine and chemokine receptors in gastric cancer. Am J Cancer Res. 2022;12:3034–50. [Google Scholar] [PubMed]
32. Mizuno S, Seishima R, Yamasaki J, Hattori K, Ogiri M, Matsui S, et al. Angiopoietin-like 4 promotes glucose metabolism by regulating glucose transporter expression in colorectal cancer. J Cancer Res Clin. 2022;148(6):1351–61. [Google Scholar]
33. Liu D, Chen C, Cui M, Zhang H. miR-140-3p inhibits colorectal cancer progression and its liver metastasis by targeting BCL9 and BCL2. Cancer Med. 2021;10(10):3358–72. [Google Scholar] [PubMed]
34. Pan F, Li M, Chen W. FOXD1 predicts prognosis of colorectal cancer patients and promotes colorectal cancer progression via the ERK 1/2 pathway. Am J Transl Res. 2018;10:1522–30. [Google Scholar] [PubMed]
35. Chen C, Xu ZQ, Zong YP, Ou BC, Shen XH, Feng H, et al. CXCL5 induces tumor angiogenesis via enhancing the expression of FOXD1 mediated by the AKT/NF-κB pathway in colorectal cancer. Cell Death Dis. 2019;10(3):178. [Google Scholar] [PubMed]
36. Tu Y, Han J, Dong Q, Chai R, Li N, Lu Q, et al. TGF-β2 is a prognostic biomarker correlated with immune cell infiltration in colorectal cancer: A STROBE- compliant article. Med. 2020;99:e23024. [Google Scholar]
37. Chuo D, Liu F, Chen Y, Yin M. LncRNA MIR503HG is downregulated in Han Chinese with colorectal cancer and inhibits cell migration and invasion mediated by TGF-β2. Gene. 2019;713(5):143960. [Google Scholar] [PubMed]
38. Qu L, Chen Y, Zhang F, He L. The lncRNA DLGAP1-AS1/ miR-149-5p/TGFB2 axis contributes to colorectal cancer progression and 5-FU resistance by regulating smad2 pathway. Mol Ther Oncolytics. 2021;20:607–24. [Google Scholar] [PubMed]
39. Xu K, Zhan Y, Yuan Z, Qiu Y, Wang H, Fan G, et al. Hypoxia induces drug resistance in colorectal cancer through the HIF-1α/miR-338-5p/IL-6 feedback loop. Mol Ther. 2019;27(10):1810–24. [Google Scholar] [PubMed]
40. Li Q, Liang X, Wang Y, Meng X, Xu Y, Cai S, et al. MiR-139-5p inhibits the epithelial-mesenchymal transition and enhances the chemotherapeutic sensitivity of colorectal cancer cells by downregulating BCL2. Sci Rep. 2016b;6:1–10. [Google Scholar]
41. Puyo S, Houédé N, Kauffmann A, Richaud P, Robert J, Pourquier P. Gene expression signature predicting high-grade prostate cancer responses to oxaliplatin. Mol Pharmacol. 2012;82(6):1205–16. [Google Scholar] [PubMed]
42. Wu T, Dai Y. Tumor microenvironment and therapeutic response. Cancer Lett. 2017;387:61–8. [Google Scholar] [PubMed]
43. Xiao Y, Yu D. Tumor microenvironment as a therapeutic target in cancer. Pharmacol Ther. 2021;221(2019):107753. [Google Scholar] [PubMed]
44. Huang J, Zhang L, Wan D, Zhou L, Zheng S, Lin S, et al. Extracellular matrix and its therapeutic potential for cancer treatment. Signal Transduct Target Ther. 2021;6(1):153. [Google Scholar] [PubMed]
45. Karlsson S, Nyström H. The extracellular matrix in colorectal cancer and its metastatic settling-Alterations and biological implications. Crit Rev Oncol Hematol. 2022;175(7):103712. [Google Scholar] [PubMed]
46. Rao VS, Gu Q, Tzschentke S, Lin K, Ganig N, Thepkaysone ML, et al. Extravesicular TIMP-1 is a non-invasive independent prognostic marker and potential therapeutic target in colorectal liver metastases. Oncogene. 2022;41(12):1809–20. [Google Scholar] [PubMed]
47. Machackova T, Vychytilova-Faltejskova P, Souckova K, Trachtova K, Brchnelova D, Svoboda M, et al. MiR-215-5p reduces liver metastasis in an experimental model of colorectal cancer through regulation of ECM-receptor interactions and focal adhesion. Cancers. 2020;12(12):1–21. [Google Scholar]
48. Li L, Spendlove I, Morgan J, Durrant LG. CD55 is over- expressed in the tumour environment. Br J Cancer. 2001;84:80–6. [Google Scholar] [PubMed]
49. Zhao W, Hao L, Jia L, Wang J, Wang B, Huang Y, et al. TAFs contributes the function of PTPN2 in colorectal carcinogenesis through activating JAK/STAT signaling pathway. Am J Cancer Res. 2021;11:3085–97. [Google Scholar] [PubMed]
50. Wang D, Wang X, Song Y, Si M, Sun Y, Liu X, et al. Exosomal miR-146a-5p and miR-155-5p promote CXCL12/CXCR7-induced metastasis of colorectal cancer by crosstalk with cancer-associated fibroblasts. Cell Death Dis. 2022c;13:1–15. [Google Scholar]
51. Wang X, Wang J, Zhao J, Wang H, Chen J, Wu J. HMGA2 facilitates colorectal cancer progression via STAT3-mediated tumor-associated macrophage recruitment. Theranostics. 2022d;12(2):963–75. [Google Scholar] [PubMed]
52. Tu W, Gong J, Zhou Z, Tian D, Wang Z. TCF4 enhances hepatic metastasis of colorectal cancer by regulating tumor- associated macrophage via CCL2/CCR2 signaling. Cell Death Dis. 2021;12(10):882. [Google Scholar] [PubMed]
53. Wang R, Liu H, He P, An D, Guo X, Zhang X, et al. Inhibition of PCSK9 enhances the antitumor effect of PD-1 inhibitor in colorectal cancer by promoting the in filtration of CD8+ T cells and the exclusion of Treg cells. Front Immunol. 2022a;13:947756. [Google Scholar] [PubMed]
54. Lin ZB, Long P, Zhao Z, Zhang YR, Chu XD, Zhao XX, et al. Long noncoding RNA KCNQ1OT1 is a prognostic biomarker and mediates CD8+ T cell exhaustion by regulating CD155 expression in colorectal cancer. Int J Biol Sci. 2021a;17:1757–68. [Google Scholar] [PubMed]
55. Lin Q, Luo L, Wang H. A new oxaliplatin resistance-related gene signature with strong predicting ability in colon cancer identified by comprehensive profiling. Front Oncol. 2021b;11:1–15. [Google Scholar]
56. Li M, Li M, Yin T, Shi H, Wen Y, Zhang B, et al. Targeting of cancer-associated fibroblasts enhances the efficacy of cancer chemotherapy by regulating the tumor microenvironment. Mol Med Rep. 2016a;13(3):2476–84. [Google Scholar] [PubMed]
57. Lan H, Liu Y, Liu J, Wang X, Guan Z, Du J, et al. Tumor- associated macrophages promote oxaliplatin resistance via METTL3-mediated m6A of TRAF5 and necroptosis in colorectal cancer. Mol Pharm. 2021;18(3):1026–37. [Google Scholar] [PubMed]
58. Deng X, Ruan H, Zhang X, Xu X, Zhu Y, Peng H, et al. Long noncoding RNA CCAL transferred from fibroblasts by exosomes promotes chemoresistance of colorectal cancer cells. Int J Cancer. 2020;146(6):1700–16. [Google Scholar] [PubMed]
59. Hu PS, Li T, Lin JF, Qiu MZ, Wang DS, Liu ZX, et al. VDR-SOX2 signaling promotes colorectal cancer stemness and malignancy in an acidic microenvironment. Signal Transduct Target Ther. 2020;5(1):183. [Google Scholar] [PubMed]
Supplementary Materials
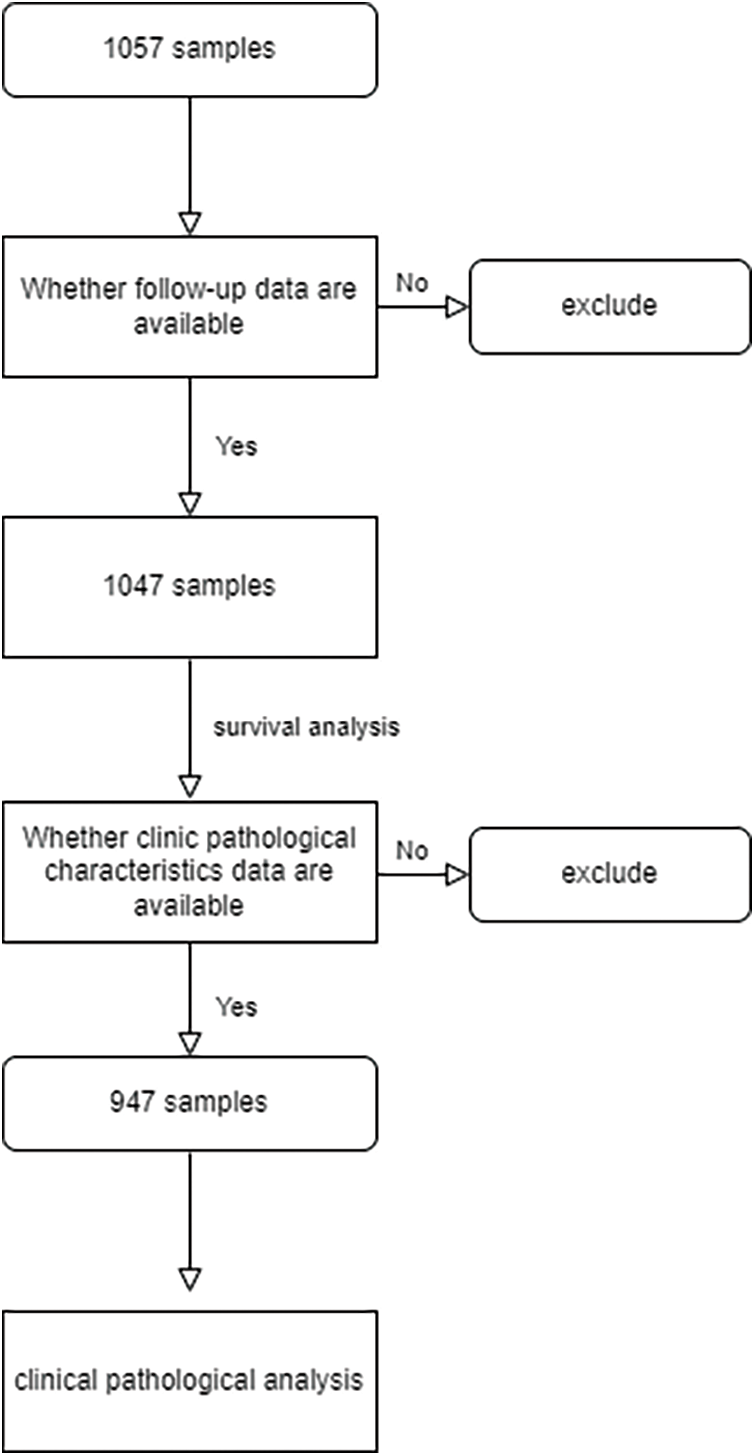
Figure S1: Flowchart of samples
Cite This Article
 Copyright © 2024 The Author(s). Published by Tech Science Press.
This work is licensed under a Creative Commons Attribution 4.0 International License , which permits unrestricted use, distribution, and reproduction in any medium, provided the original work is properly cited.
 Downloads
 Citation Tools