
 Submit a Paper
 Propose a Special lssue
 Open Access
ARTICLE

Analysis of large datasets for identifying molecular targets in intestinal polyps and metabolic disorders
Department of Gastroenterology, The First Affiliated Hospital of Chongqing Medical and Pharmaceutical College, Chongqing, China
* Corresponding Authors: PENG SHI. Email: ; JIE YAO. Email:
(This article belongs to the Special Issue: Advances in Biomarker Research: Unveiling the Pathways to Precision Medicine)
BIOCELL 2024, 48(3), 415-429. https://doi.org/10.32604/biocell.2024.046178
Received 21 September 2023; Accepted 08 January 2024; Issue published 15 March 2024
 View Full Text
 Download PDF
Abstract
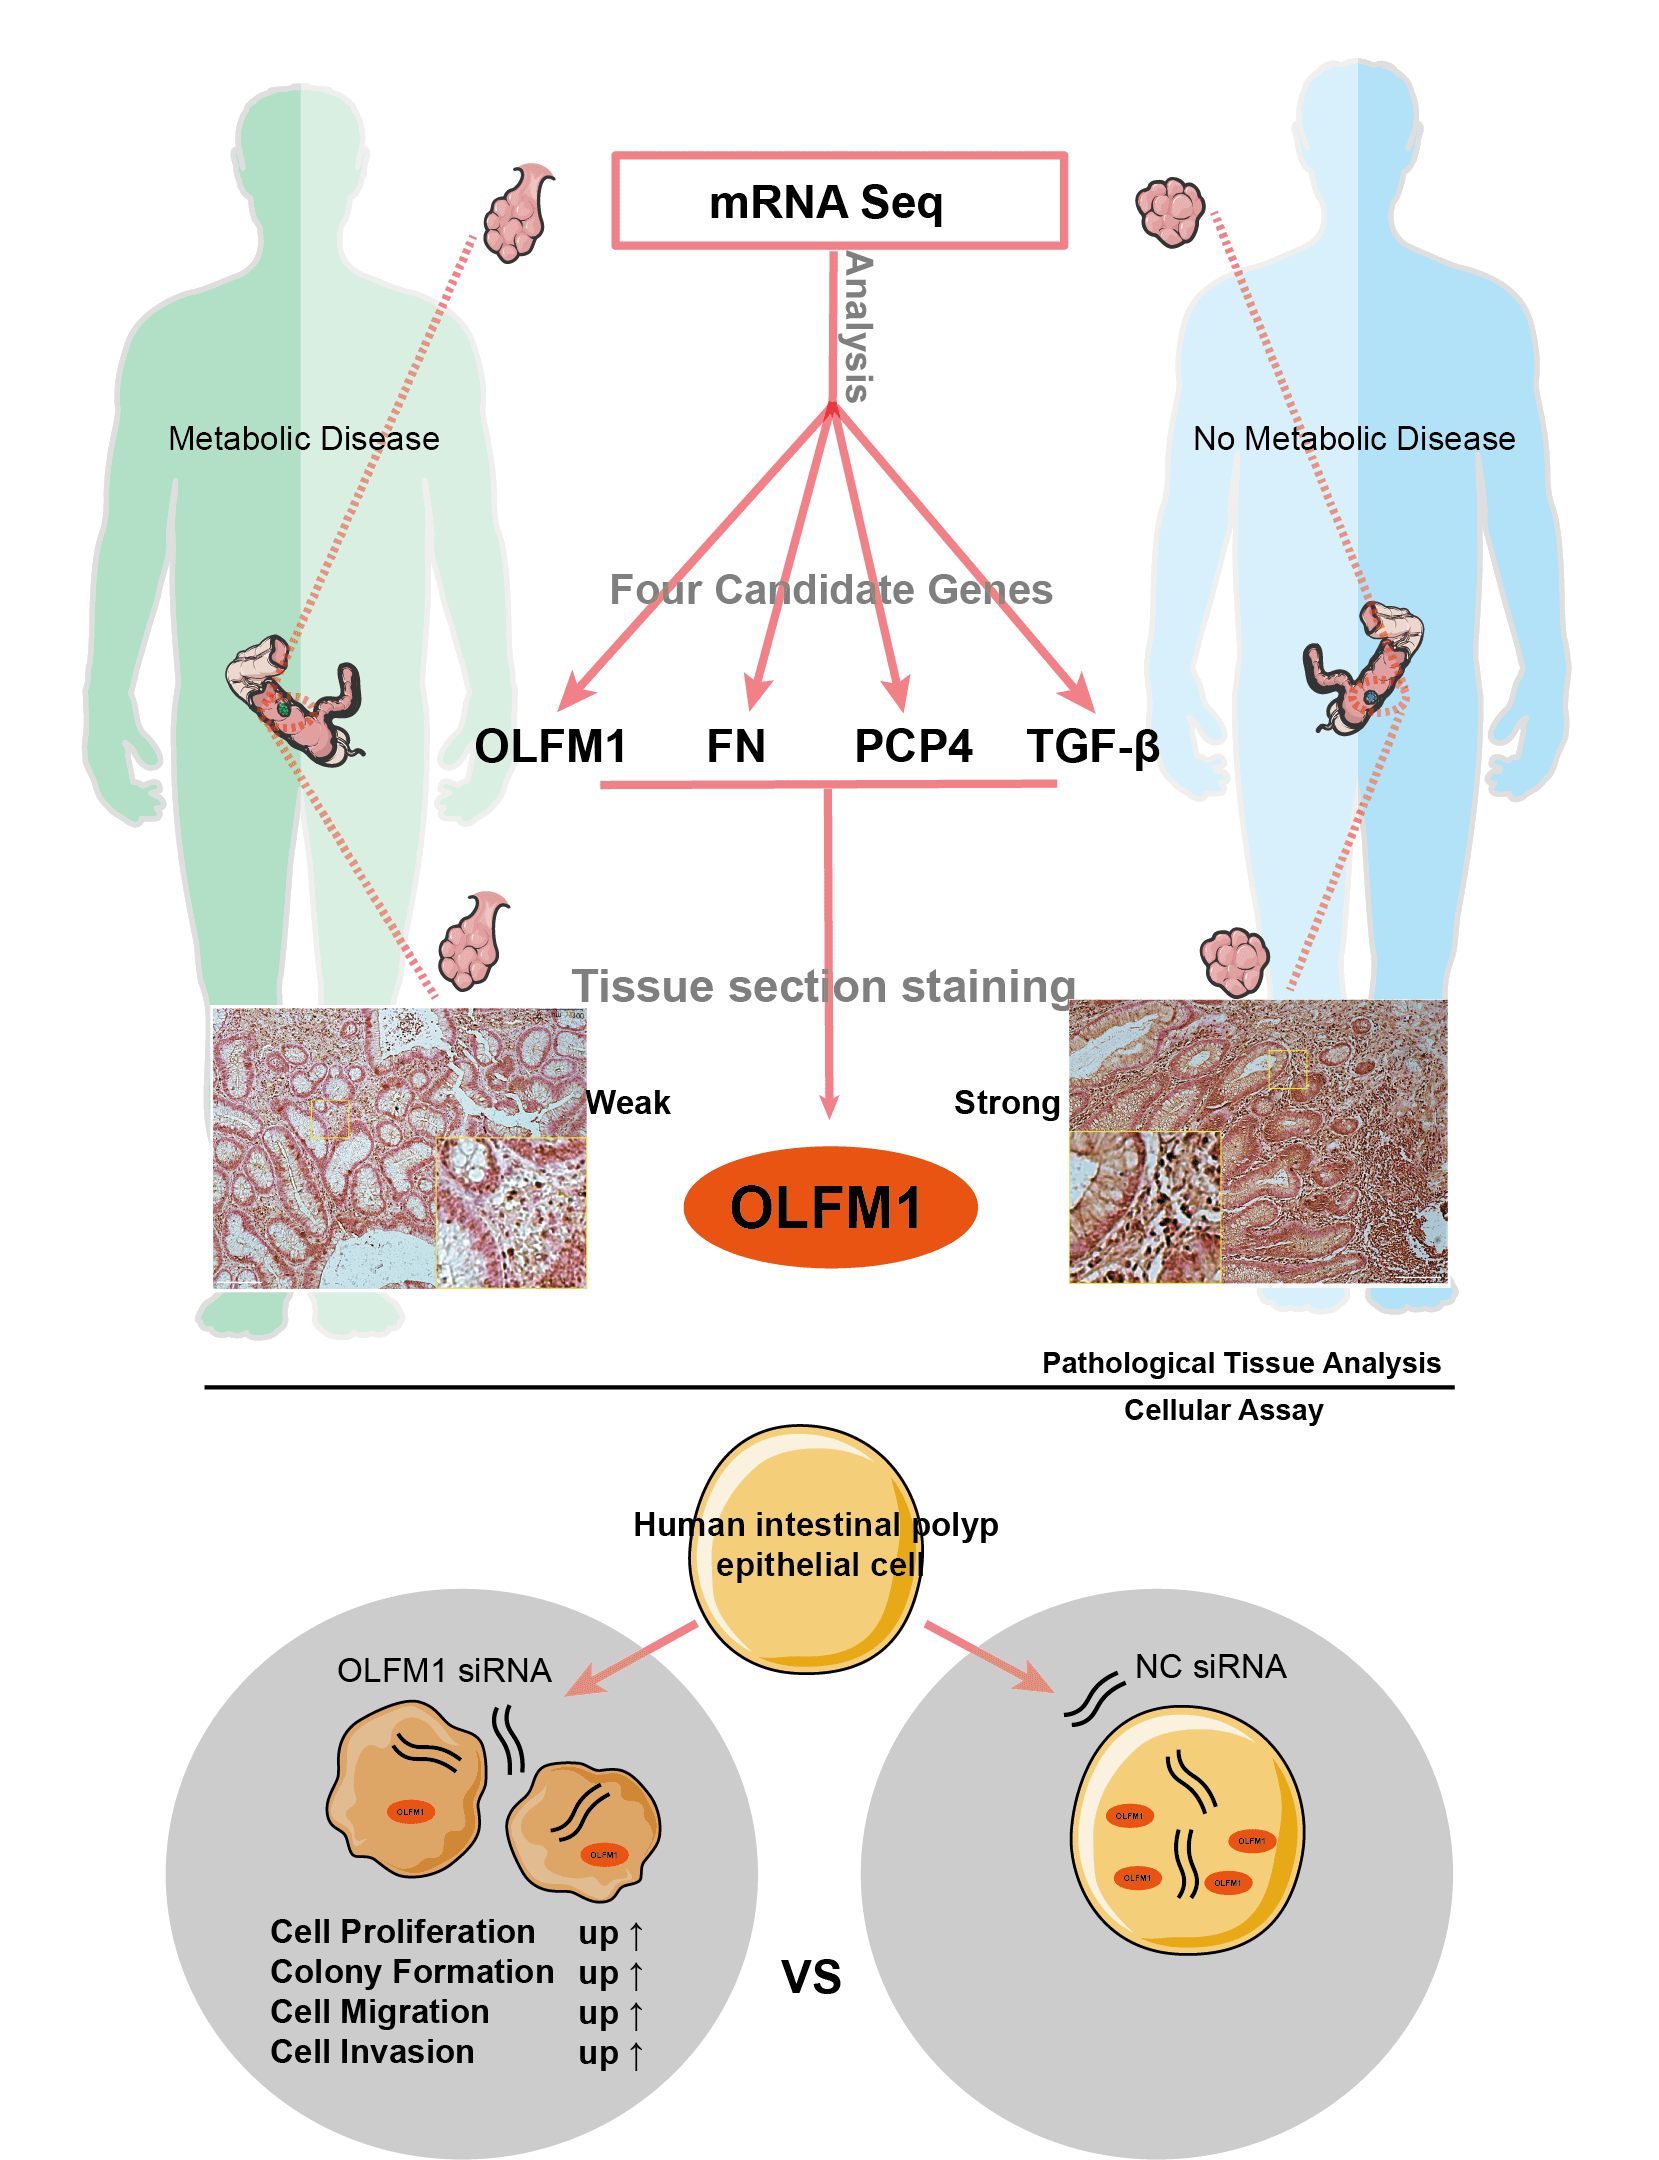
Background: The interrelation between intestinal polyps, metabolic syndrome (MetS), and colorectal cancer (CRC) is a critical area of study. This research focuses on pinpointing potential molecular targets to understand the link between intestinal polyp formation, metabolic irregularities, and CRC progression. Methods: We examined clinical samples from patients with intestinal polyps coexisting with MetS and compared them with samples from patients with standard intestinal polyps. Transcriptome sequencing and public database analysis were employed to identify significant pathways and genes. These targets were then validated through immunohistochemistry (IHC). Following the RNA interference of key target expression, a series of experiments, including the cell counting kit-8 assay, colony formation, wound healing, and Transwell assays, were conducted. Results: Comparative analysis revealed 75 up-regulated and 61 down-regulated differentially expressed genes (DEGs) in the MetS polyp group vs. the control. Kyoto encyclopedia of genes and genomes (KEGG) pathway enrichment suggested these DEGs were primarily associated with cell cycle and mitosis. Integration with comparative toxicogenomics database (CTD) and the cancer genome atlas (TCGA) databases highlighted 44 key CRC-related genes. Protein interaction networks indicated connections of purkinje cell protein 4 (PCP4), olfactomedin 1 (OLFM1), fibronectin 1 (FN1), and transforming growth factor beta 3 (TGF-β3) with the mitogen-activated protein kinase (MAPK) pathway. Tumor correlation studies suggested higher risk associations with FN1, PCP4, and TGF-β3, while OLFM1 was identified as a lower risk gene. Immunohistochemical analysis revealed a decrease in OLFM1 in MetS-associated intestinal polyps. Upon interference with OLFM1 in polyp epithelial cells, there was a significant enhancement in cell proliferation, colony formation, and cell migration and invasion capabilities. Conclusion: Our study highlights a significant decrease in OLFM1 expression in MetS-associated intestinal polyps. And, this reduction in OLFM1 is associated with enhanced cell proliferation, colony formation, and increased cell migration and invasion capabilities. These findings underscore the reduced OLFM1 expression in MetS-associated intestinal polyps may play a crucial role in promoting tumorigenic processes in colorectal pathology. Further research on OLFM1 may provide valuable insights into understanding and targeting MetS-associated intestinal polyps.Graphic Abstract
Keywords
Abbreviations
| MetS | metabolic syndrome |
| CRC | colorectal cancer |
| IHC | immunohistochemistry |
| DEGs | differentially expressed genes |
| T2DM | type 2 diabetes mellitus |
| BMI | Body Mass Index |
| CIN | chromosome instability |
| IR | Insulin resistance |
| COAD | colon adenocarcinoma |
| EVs | extracellular vesicles |
| PCP4 | purkinje cell protein 4 |
| OLFM1 | olfactomedin 1 |
| FN1 | fibronectin 1 |
| TGF-β3 | transforming growth factor beta 3 |
| CTD | comparative toxicogenomics database |
| TCGA | the cancer genome atlas |
The traditional route through which colorectal cancer (CRC) develops from intestinal polyps is known as the adenoma-carcinoma sequence [1]. However, it is now recognized that hyperplastic polyps, once deemed benign, can also evolve into CRC via the serrated pathway [2]. This serrated pathway accounts for about 15% to 30% of all CRC cases [3,4]. The occurrence of interval CRC, which ranges from 0.5 to 1 case per 1000 patient-years, is influenced by factors such as the intricate nature of colorectal anatomy and variations in the quality of colonoscopy techniques [5–7]. Despite advancements in detection and treatment, early-stage colon cancer continues to present a clinical risk for recurrence [8]. CRC remains a major global health concern as the third most frequently diagnosed cancer, characterized by a high mortality rate and a 5-year survival rate ranging between 50% and 65% [9].
Recent research has increasingly highlighted a significant association between metabolic diseases and the emergence of intestinal polyps [10–12]. For example, in Israel, a study found that patients with metabolic syndrome (MetS) had a notably higher likelihood of developing advanced polyps, with an odds ratio of 10.64 compared to those without MetS. This suggests MetS as a potential risk factor for the development of advanced intestinal polyps [11]. Additionally, the presence of high triglyceride and low-density lipoprotein levels in hyperlipidemia patients has been linked to a 50% likelihood of polyp occurrence [12]. Moreover, MetS, particularly type 2 diabetes mellitus (T2DM), has been identified as closely related to an increased risk of cancer. Data from the Czech Republic showed that individuals with T2DM or cardiovascular risks had a higher prevalence of advanced adenomas compared to the general population [13]. A comprehensive meta-analysis encompassing 150 studies and involving over 32 million individuals reinforced this connection, demonstrating a robust epidemiological link between T2DM and CRC [14]. Interestingly, this relationship appears to be bidirectional, with CRC patients also showing an increased risk of developing T2DM [15,16]. Obesity and high body fat are also recognized as significant risk factors for CRC [17,18], although the underlying mechanisms remain somewhat unclear. Recognizing these correlations, researchers in both Asian [19] and European [20] contexts have improved the precision of CRC screening by incorporating factors like MetS and Body Mass Index (BMI) into their screening criteria. These developments underscore the intricate interplay between metabolic disorders and the risk of CRC.
While much of the research on the relationship between CRC and MetS has focused on incidence rates and epidemiological links, in-depth exploration of the underlying mechanisms [21–23], especially beyond type 2 diabetes mellitus (T2DM), remains limited. Notably, studies have shown that obesity’s association with CRC is more pronounced in men [24,25]. In the context of T2DM, several factors have been identified as contributing to CRC development. Chronic hyperglycemia [26], a hallmark of T2DM, can meet the increased glucose demands of tumors, potentially leading to chemotherapy resistance and activating the hexosamine metabolic pathway [27–31]. This pathway influences various cellular processes such as cell cycle regulation, chromatin dynamics, and gene expression through O-GlcNAcylation [32], thereby facilitating CRC progression. Moreover, hyperglycemia can increase reactive oxygen species (ROS) in mitochondria, leading to oxidative stress [31], which causes DNA damage [33] and can stimulate cellular proliferation, growth, and apoptosis [34]. ROS also activates NF-κB, promoting the expression of proinflammatory cytokines [35]. Inflammation plays a critical role in CRC development, particularly through the activation of the Wnt signaling pathway, commonly observed in CRC cases with chromosome instability (CIN) [36]. Insulin resistance (IR), another component of T2DM, is significantly linked to CRC. IR leads to hyperinsulinemia, which is believed to be a primary driver of CRC [37,38], given insulin’s role in regulating the Wnt/β-catenin signaling pathway [39,40]. The insulin-like growth factor is also implicated in this process, further emphasizing the complex interplay between T2DM and CRC [37,41].
In summary, the interconnections between MetS, intestinal polyps, and CRC are intricately linked. The complexity of both CRC and MetS arises from their interactions across various signaling pathways. However, the elucidation of many molecular mechanisms remains challenging, primarily due to the prolonged development period of CRC and the complexities associated with collecting clinical data. In our study, we focused on collecting and analyzing intestinal polyps from patients with metabolic abnormalities. Through data mining and clinical sample validation, we aimed to identify potential molecular targets that could explain the link between the abnormal metabolism associated with intestinal polyps and the onset of colorectal cancer. This approach provides valuable insights and a foundation for further research in understanding and potentially mitigating the risks associated with MetS and CRC.
Nineteen individuals (including 9 females, 47.37%) were included in this study, with a mean age of 59 years and a median age of 56 years (range 45–81 years). Ten patients had metabolic disease and 9 did not (Table 1). Intestinal polyps were obtained from both groups, with the metabolic syndrome (MetS) group comprising polyps from patients with MetS, and the ordinary (Ord) group comprising polyps from patients without MetS.
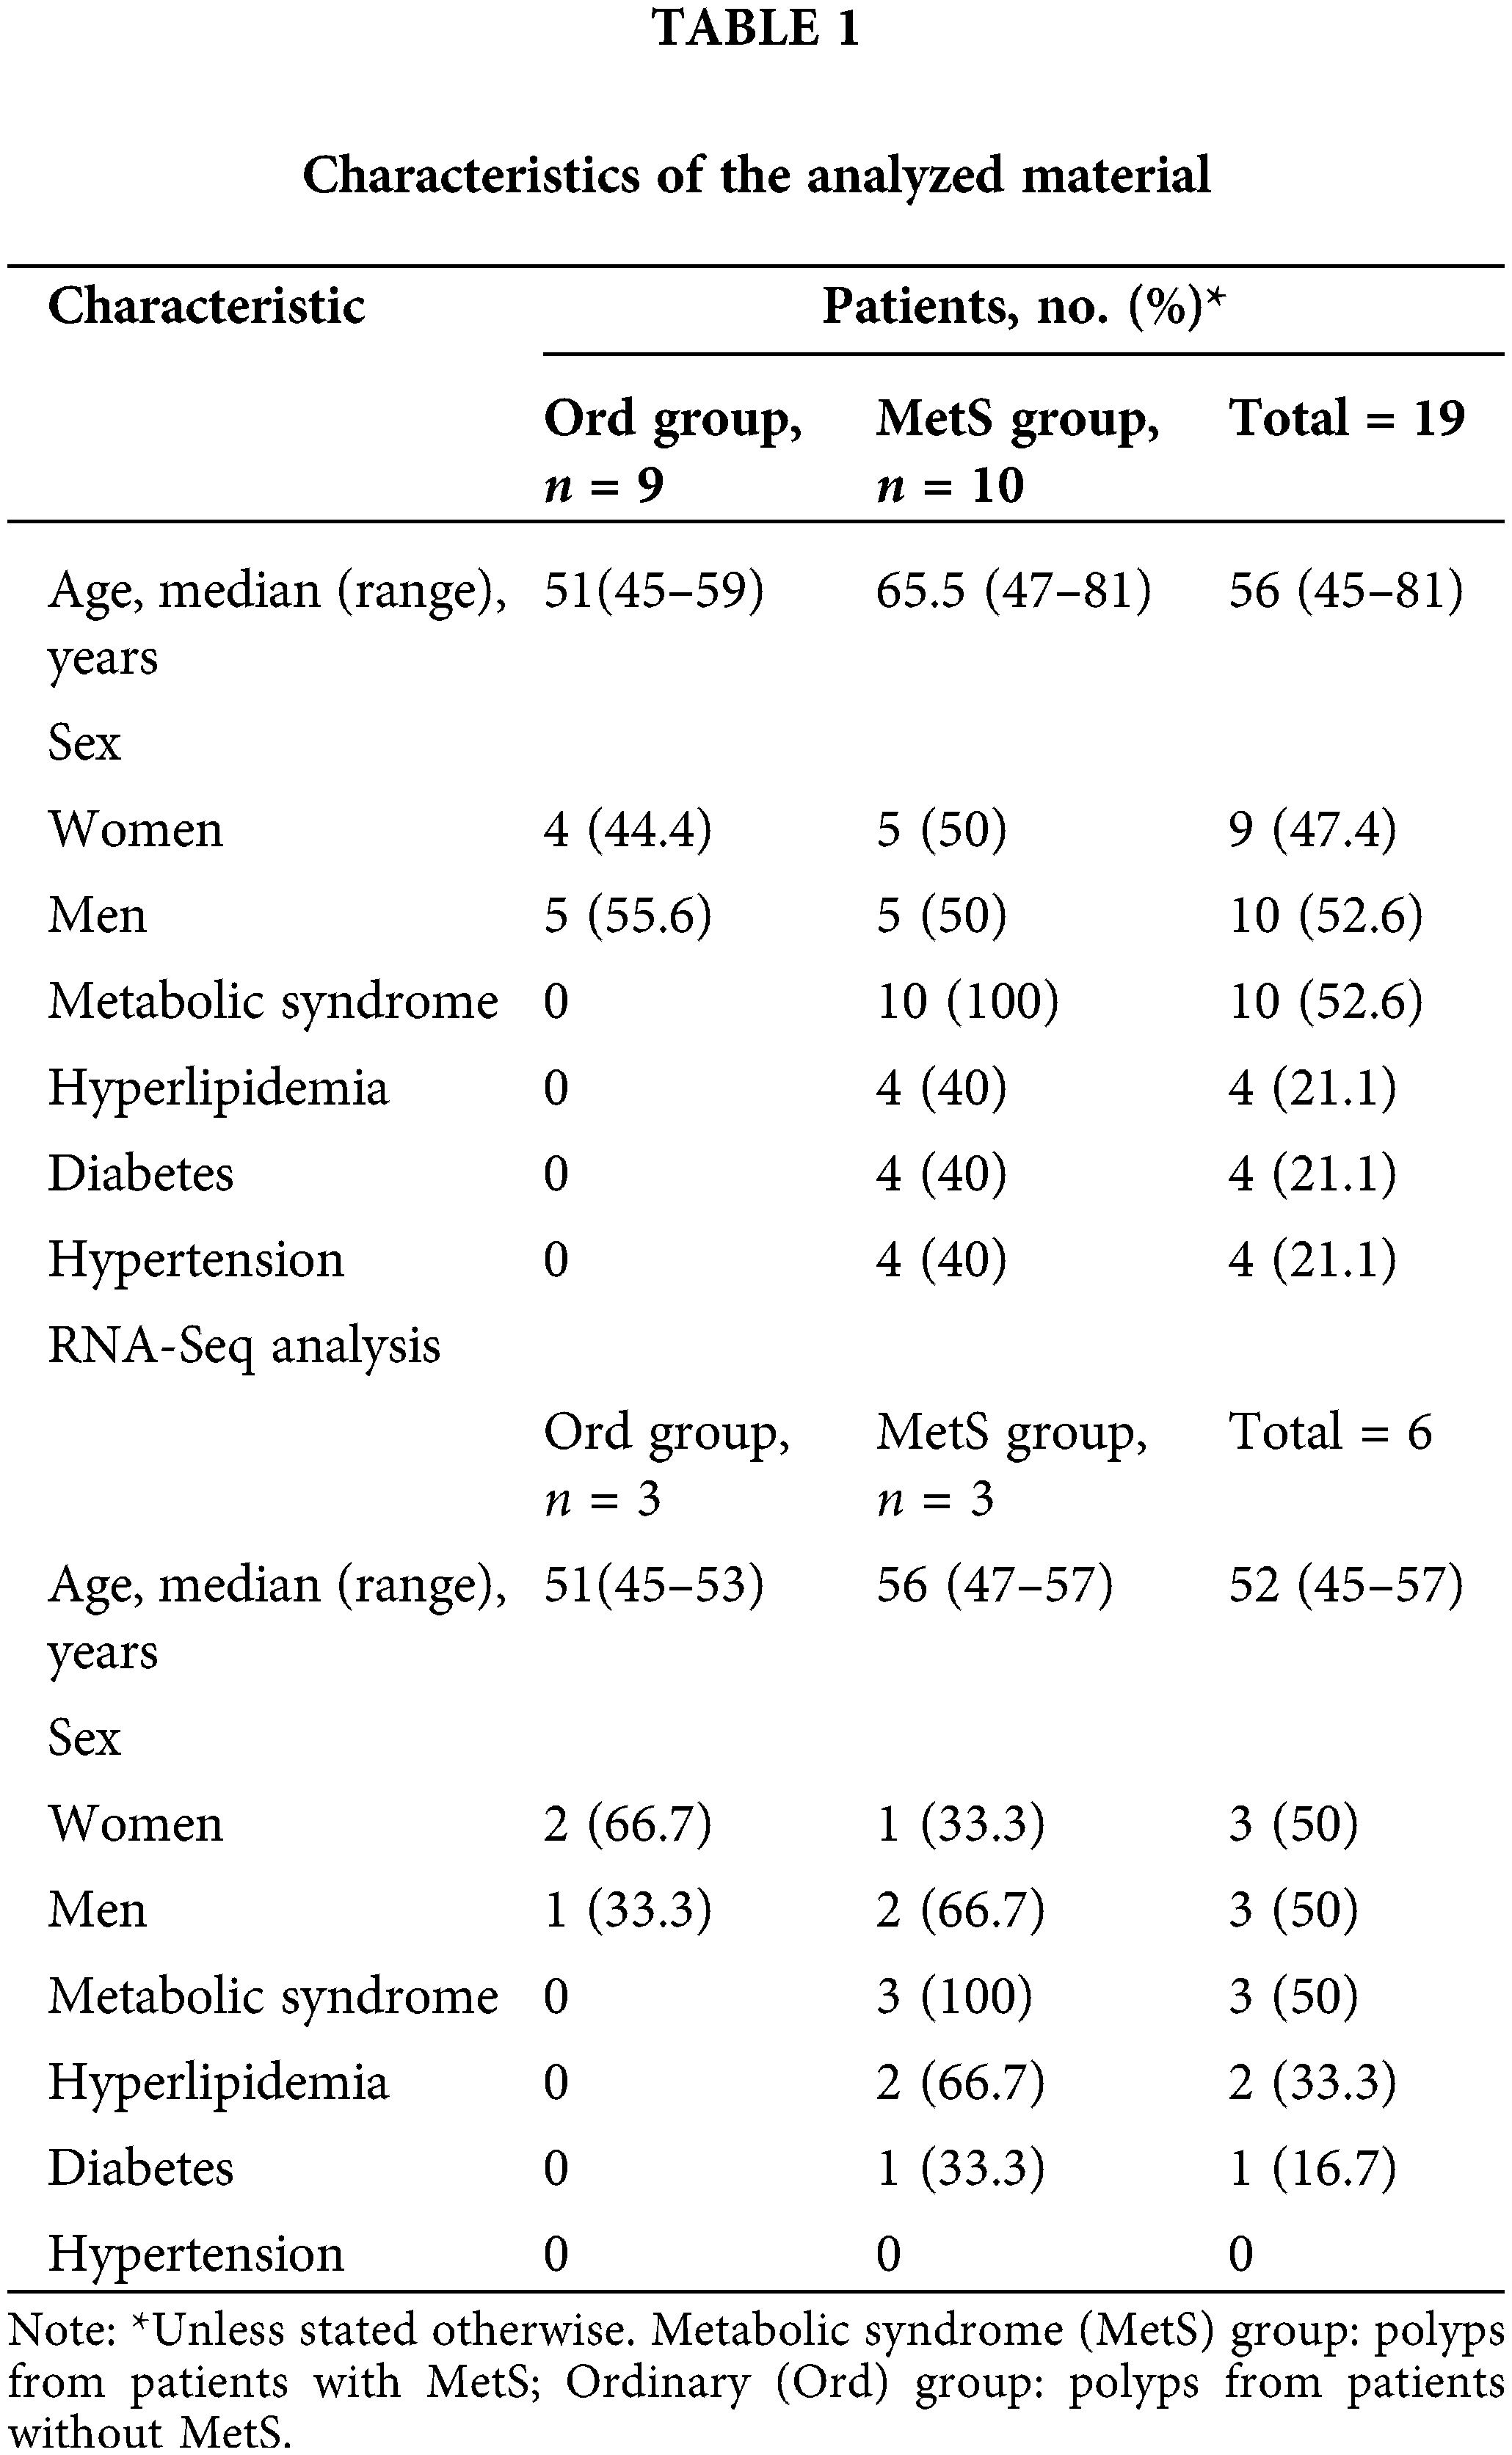
Inclusion criteria comprised individuals scheduled for colon polyp removal surgery from the year 2021 to 2022, with confirmation of the presence or absence of metabolic syndrome based on blood tests and medical history. Additionally, participants were required to express their willingness to engage in the research. Exclusion criteria consisted of individuals aged 90 or older, those who had used antibiotics or probiotics in the past month, individuals with other gastrointestinal diseases, patients undergoing metabolic-affecting medication, individuals with a combination of colon polyps and colorectal cancer, and those incapable of signing an informed consent form.
Intestinal polyp samples (Table 1) were frozen in liquid nitrogen and submitted to Geneplus Technology Corporation (Shenzhen, China) for total RNA isolation, mRNA purification, library preparation, and sequencing.
Differential gene expression analysis by RNA-seq
RNA-Seq results were analyzed using R programming language and software (version 3.5.1). mRNAs with log2-fold change (|log2-FC| > 1.2, p < 0.01) were considered differentially expressed mRNAs, which identified differentially expressed genes (DEGs). The DEG sets were named “Ord vs. MetS”.
Protein-protein interaction network analysis
Protein-protein interaction (PPI) networks contain information on the biological processes and molecular functions of cells. We used STRING Version 9.1 (http://www.string-db.org).
We performed Kyoto Encyclopedia of Genes and Genomes (KEGG) (https://www.genome.jp/kegg/tool/map_pathway1.html) pathway enrichment analysis, and the larger and higher bubbles represented highly significantly enriched pathway terms. Enriched gene+ontology (GO) terms were classified according to biological process, molecular function, and cellular component to describe gene attributes. The online mapping tool Bioinformatics (http://www.bioinformatics.com.cn) was used to generate a histogram of the top ten items. Venn diagrams and bubble graphs of the top fifteen items were generated using the free online analysis tool OmicShare (http://www.omicshare.com/tools).
GSCA: gene set cancer analysis
The URL for Gene Set Cancer Analysis (GSCA) is “http://bioinfo.life.hust.edu.cn/GSCA/#/”. First, trend analysis was performed using the Mann-Kendall Trend Test, where the p value of the Mann-Kendall test for trend analysis depends on the number of subjects. The number of stages (n = 4) was too small to obtain a significant p value (<0.05). A p value of 0.09 indicates that gene expression is continuously reduced or increased from stage I to stage IV. Therefore, the p value of the trend test is for reference only. Second, mRNA expression and clinical survival data were used to divide tumor samples into high and low expression groups using sample barcode and median mRNA values. Then, the survival time and status were fitted within the two groups using the R package survival. Cox proportional-hazards model and Logrank tests were performed for every gene in every cancer. Moreover, samples were stratified into high and low expression groups based on the median gene expression. The disparity in pathway activity scores (PAS) between these groups was determined using the Student’s t-test. The p-value underwent FDR adjustment, and significance was attributed to FDR ≤ 0.05. The potential effects of gene mRNA on pathway activity were determined as follows: if samples in the higher gene expression group had significantly higher pathway activity (FDR <= 0.05), we considered that the gene may have a potential activating effect on pathway activity; otherwise, the gene may be considered to have a potential inhibitory effect on pathway activity.
Seven dehydrated intestinal polyp tissues (3 from the Ord group and 4 from the MetS group) were embedded in paraffin and sectioned at 4 μm. Intestinal polyp tissue sections were incubated for 20 min at 60°C, deparaffinized in xylene, and rehydrated by ethanol. For antigen retrieval, the sections were pretreated by microwaving for 15 min in 10 mM citrate buffer (Citric acid antigen repair solution, Cat No. P0081, Beyotime) and cooled to room temperature. Endogenous peroxidase activity was quenched by adding a few drops of H2O2 onto the sections (Rabbit reinforced polymer detection reagent kit, Cat No. PV-9001, ZSGB), and the sections were incubated with a blocking solution (5% normal goat serum, Cat No. C0005, Bioss) for 1h at room temperature. Primary antibodies were incubated overnight at 4°C (primary antibodies, Cat No. DF9286 (PCP4), Cat No. AF0261 (TGFB), Cat No. DF6064 (OLFMI), Cat No. AF5335 (Fibronectin), Affinity). The next day, an appropriate amount of goat anti-rabbit IgG polymer labeled with enhanced enzyme was dripped (Rabbit reinforced polymer detection reagent kit, Cat No. PV-9001, ZSGB) and incubated at 37°C for 30 min. DAB color development (DAB color reagent kit, Cat No. ZLI-9018, ZSGB), nuclear solid red staining (0.1%) (nuclear solid red staining, Cat No. G1320, Solarbio), dehydration, transparency, coverslip sections, and mounting were performed. Images were acquired using a microscope (Leica DM3000 LED).
Human intestinal polyp epithelial cell (HIPEC) (Cat No. IM-H398, IMMOCELL, China) are derived from colorectal polyp tissues and immortalized through lentiviral transduction with the SV40 gene. HIPEC was maintained in RPMI 1640 medium (Cat No. PM150145, Procell, China) supplemented with 10% fetal bovine serum (Cat No. 164210, Procell, China) and 1% streptomycin/penicillin (Cat No. C0222, Beyotime, China) and the cells were cultured at 37°C in a humidified incubator containing 5% CO2.
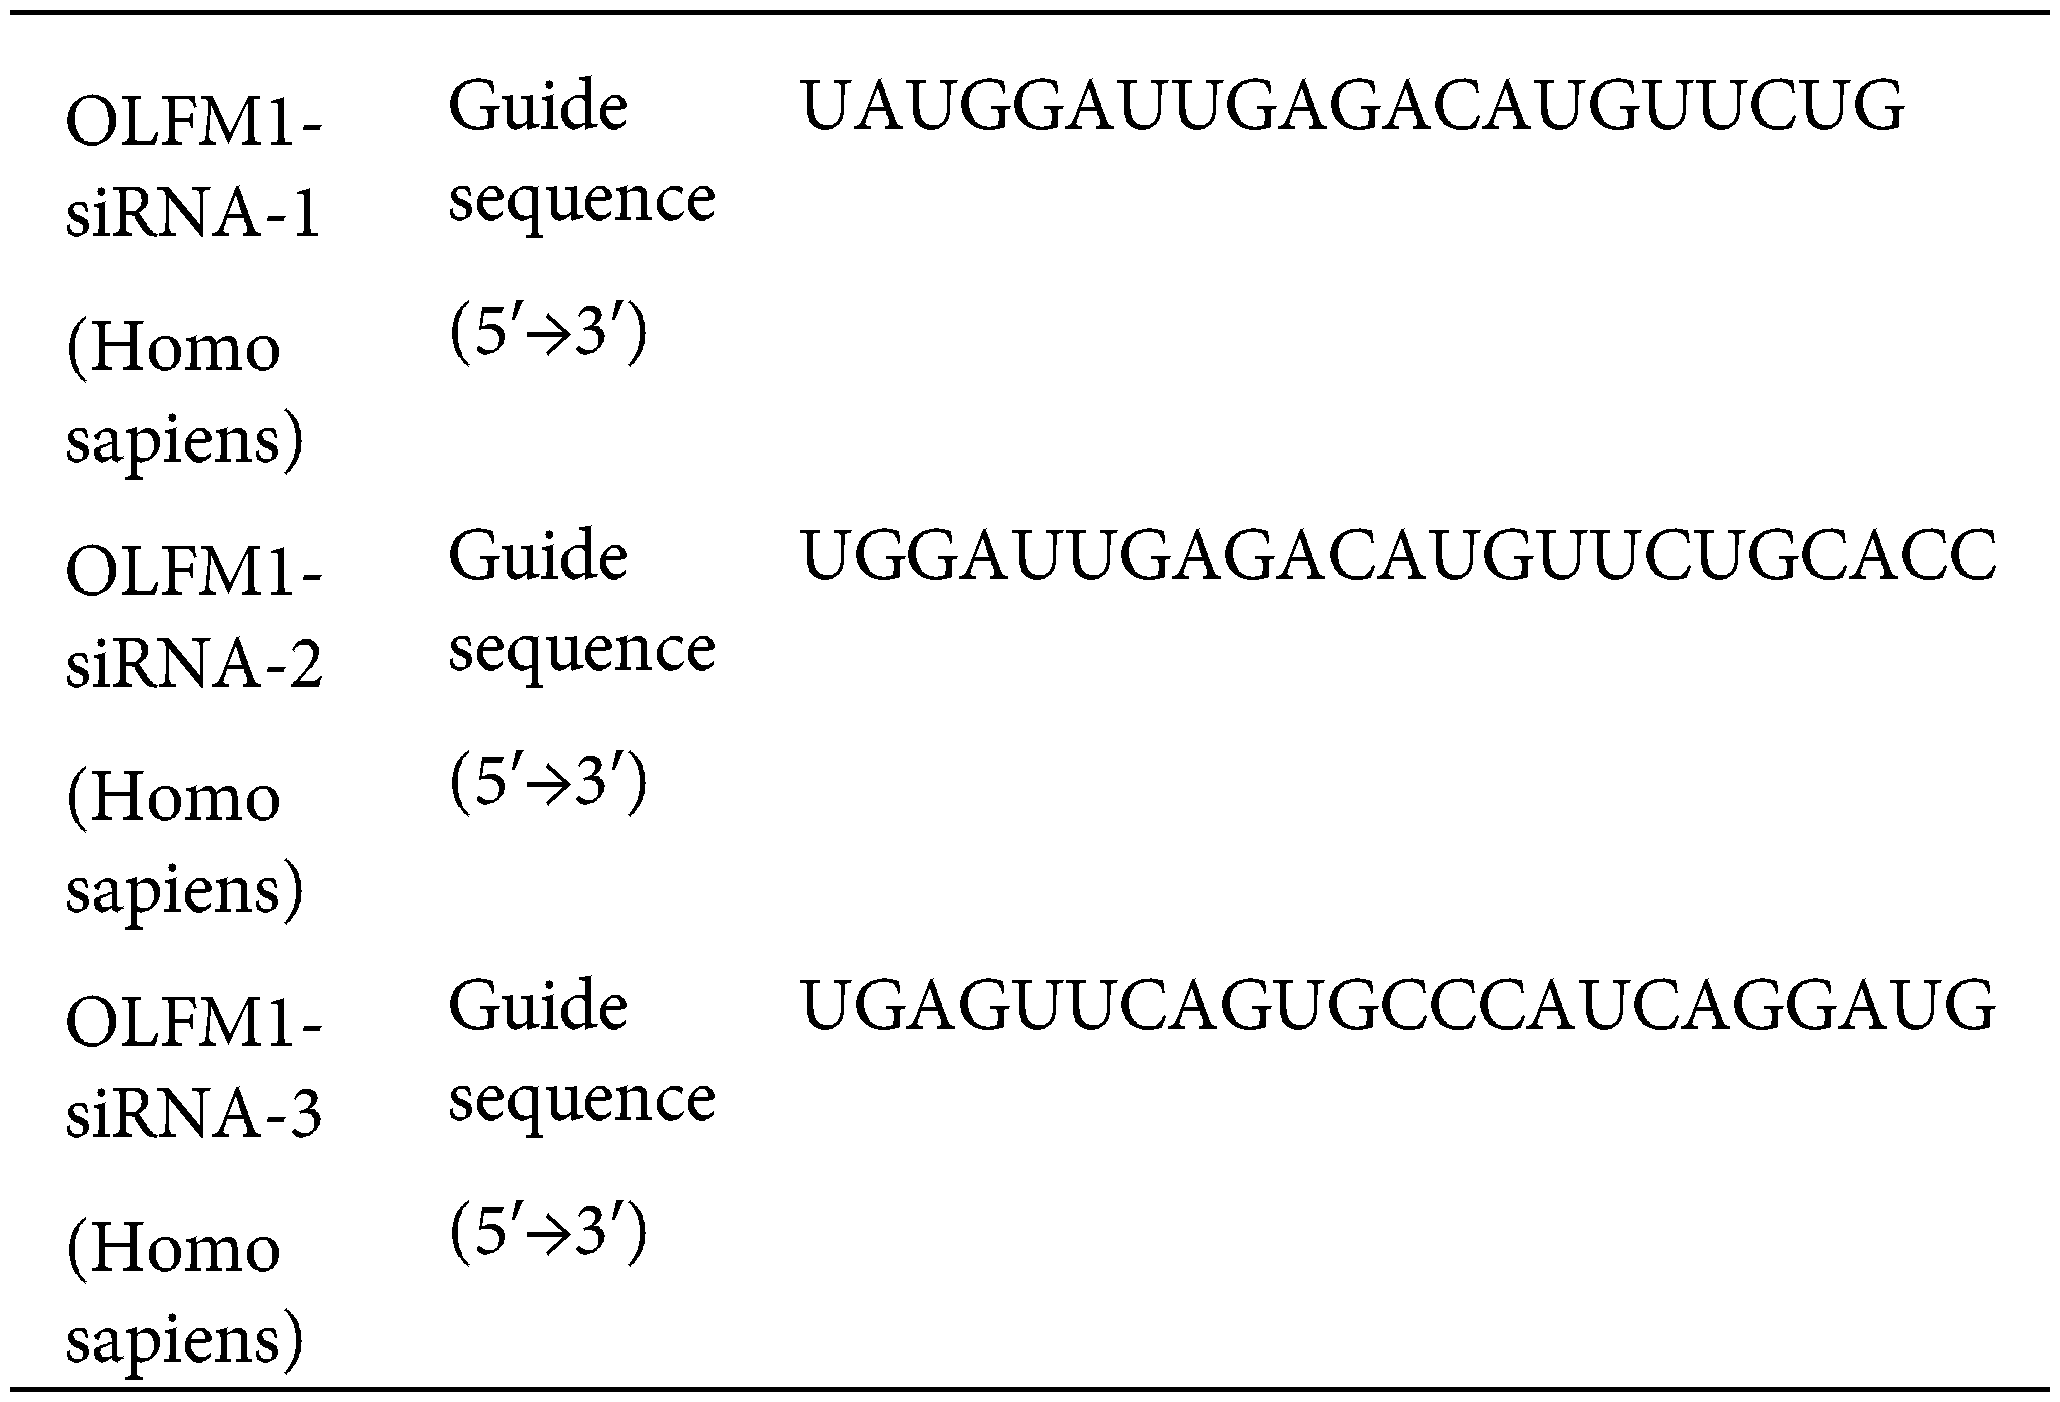
OLFM1 small interfering RNA (siRNA) was obtained from Ribobio (Guangzhou, China). We transfected Si-OLFM1 using Lip 2000 reagent (Cat No. 11668019, Thermo Fisher Scientific, USA). Three synthesized siRNA sequences were tested using Western Blot experiments to assess their interference with OLFM1 synthesis, aiming to identify the most effective siRNA sequence.
The experimental procedures were conducted as described in reference [42]. The equipment and materials used in this experiment includes: β-actin (1:1000, Cat No. Ab8226, ABclonal, China), OLFM1 (1:1000, Cat No. DF6064, Affinity, China), RIPA Lysis Buffer (Cat No. P0013C, Beyotime, China), PMSF (Cat No. ST505, Beyotime, China), High Speed Freezing Centrifuge (Model 5424R, Eppendorf, Germany).
Reverse transcription quantitative polymerase chain reaction (RT-qPCR)
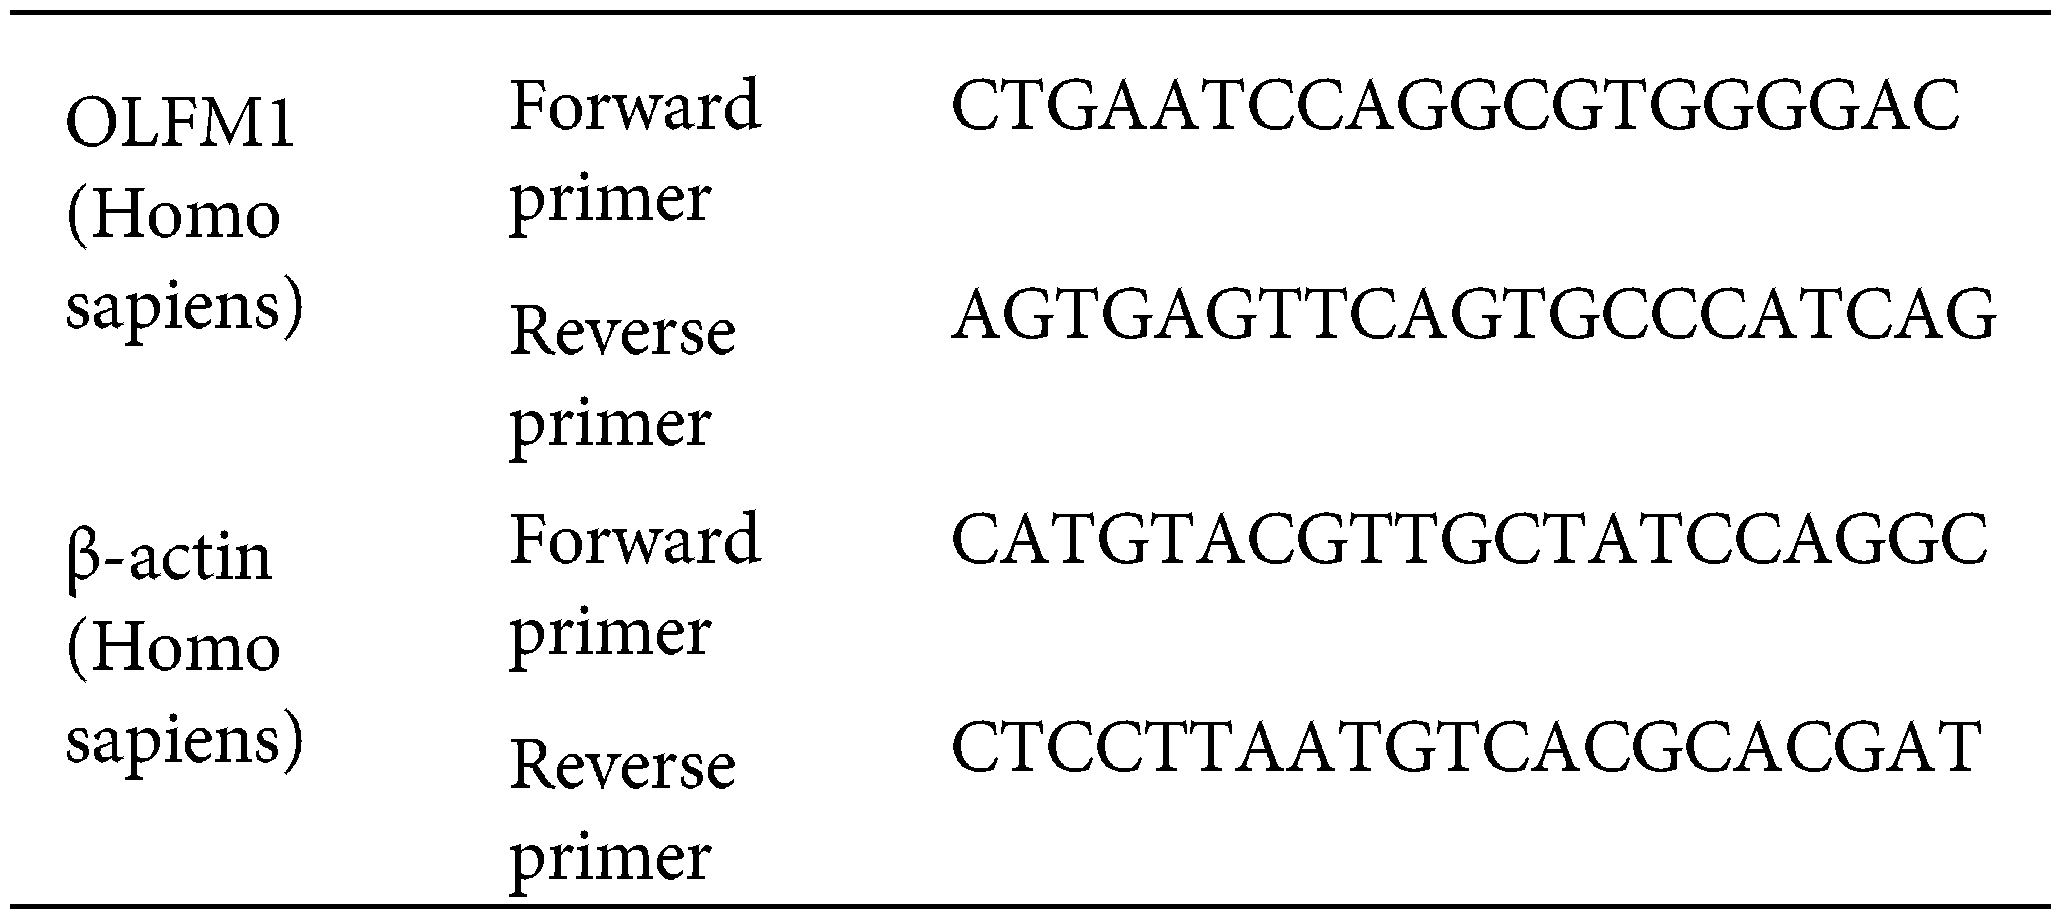
The cells of each group were collected in enzyme-free EP tubes, and the cells were cleaved by adding TRizol (Cat No. R0016, Beyotime, China). The total RNA of cells was extracted according to the procedure of total RNA extraction, and then reverse transcription was performed with the reverse transcription kit (Cat No. R047A, Takara, Japan) according to the instructions. The SYBR Green Realtime PCR Master Mix kit (Cat No. QPK-212, TOYOBO, Japan) was used for real-time fluorescence quantification. The primer sequences are as follows:
Cell counting kit-8 (CCK-8) assay
HIPECs in the logarithmic growth phase were seeded in 96-well plates with 2000 cells per well and cultured for 24 h before transfection. At 24, 48 and 72 h, CCK8 (Cat No. C0039, Beyotime, China) was used to detect the cell viability. In enzyme standard instrument (Model SYNERGY | H1, Bio Tek, America) 450 nm wavelength measuring OD value.
HIPEC in the logarithmic growth phase were harvested and 800 cells were seeded in 6-well plates and transfected with siRNA 24 h later. Cultures were incubated at 37°C and 5% CO2 until colonies formed. After fixation with 4% paraformaldehyde (Cat No. P0099, Beyotime, China) for 15 min, the staining solution was stained with crystal violet solution (Cat No. C0121, Beyotime, China) for 15 min, the staining solution was slowly washed off with running water and dried in air. 6-well plates were photographed (Model DMi8, Leica, Germany).
Using a marker, horizontal lines were drawn on the back of the 6-well plate, crossing at least 5 lines per hole, each evenly and parallel. Human intestinal polyp epithelial cells were seeded into 6-well plates and cultured at 37°C and 5% CO2 until the cells reached approximately 80% to 90% confluence. The cell surface was scraped with the end of a 200 μl pipette to create a scratch. After the streeting was completed, the cells were washed 2–3 times with sterile PBS (Cat No. C0221A, Beyotime, China) to remove the streeted cells and transfected with siRNA. Photographs (Model DMi8, Leica, Germany) of wound healing were taken at 0 and 48 h.
1 × 10⁵ cells were seeded and cultured in the upper chamber of a Transwell plate (Cat No. 3422, Corning, USA), and 600 to 700 μl of medium was added to the lower chamber. After 24 h, siRNA transfection was performed. The cells were incubated for 24 h at 37°C in 5% CO2. The medium was removed, fixed with 4% paraformaldehyde for 10 to 20 min, washed twice with PBS, and stained with 0.1% crystal violet solution in the dark for 10 to 25 min. The cells were rinsed twice with PBS. Photographs (Model DMi8, Leica, Germany) were taken with a microscope.
The IHC images were quantified using ImageJ Pro Plus 6.0, and comparisons were made using GraphPad Prism 8.0.1. All data were expressed as mean ± SD, and nonparametric tests were used to determine the statistical significance of differences between groups.
Analysis was performed on the general transcriptome of intestinal polyps from patients with metabolic diseases and those without metabolic diseases.
The transcriptome of intestinal polyps in patients with metabolic diseases and common patients was analyzed by RNA sequencing. The volcano plot showed 1047 differentially expressed genes (DEGs) (Fig. 1a). Heat map and DEG statistics revealed 61 up-regulated genes and 75 down-regulated genes (Figs. 1b and 1c). KEGG pathway enrichment analysis showed that the DEGs were significantly involved in the cell cycle pathway, oocyte meiosis, human T cell leukemia virus 1 infection, and the cellular senescence pathway (Fig. 1d).
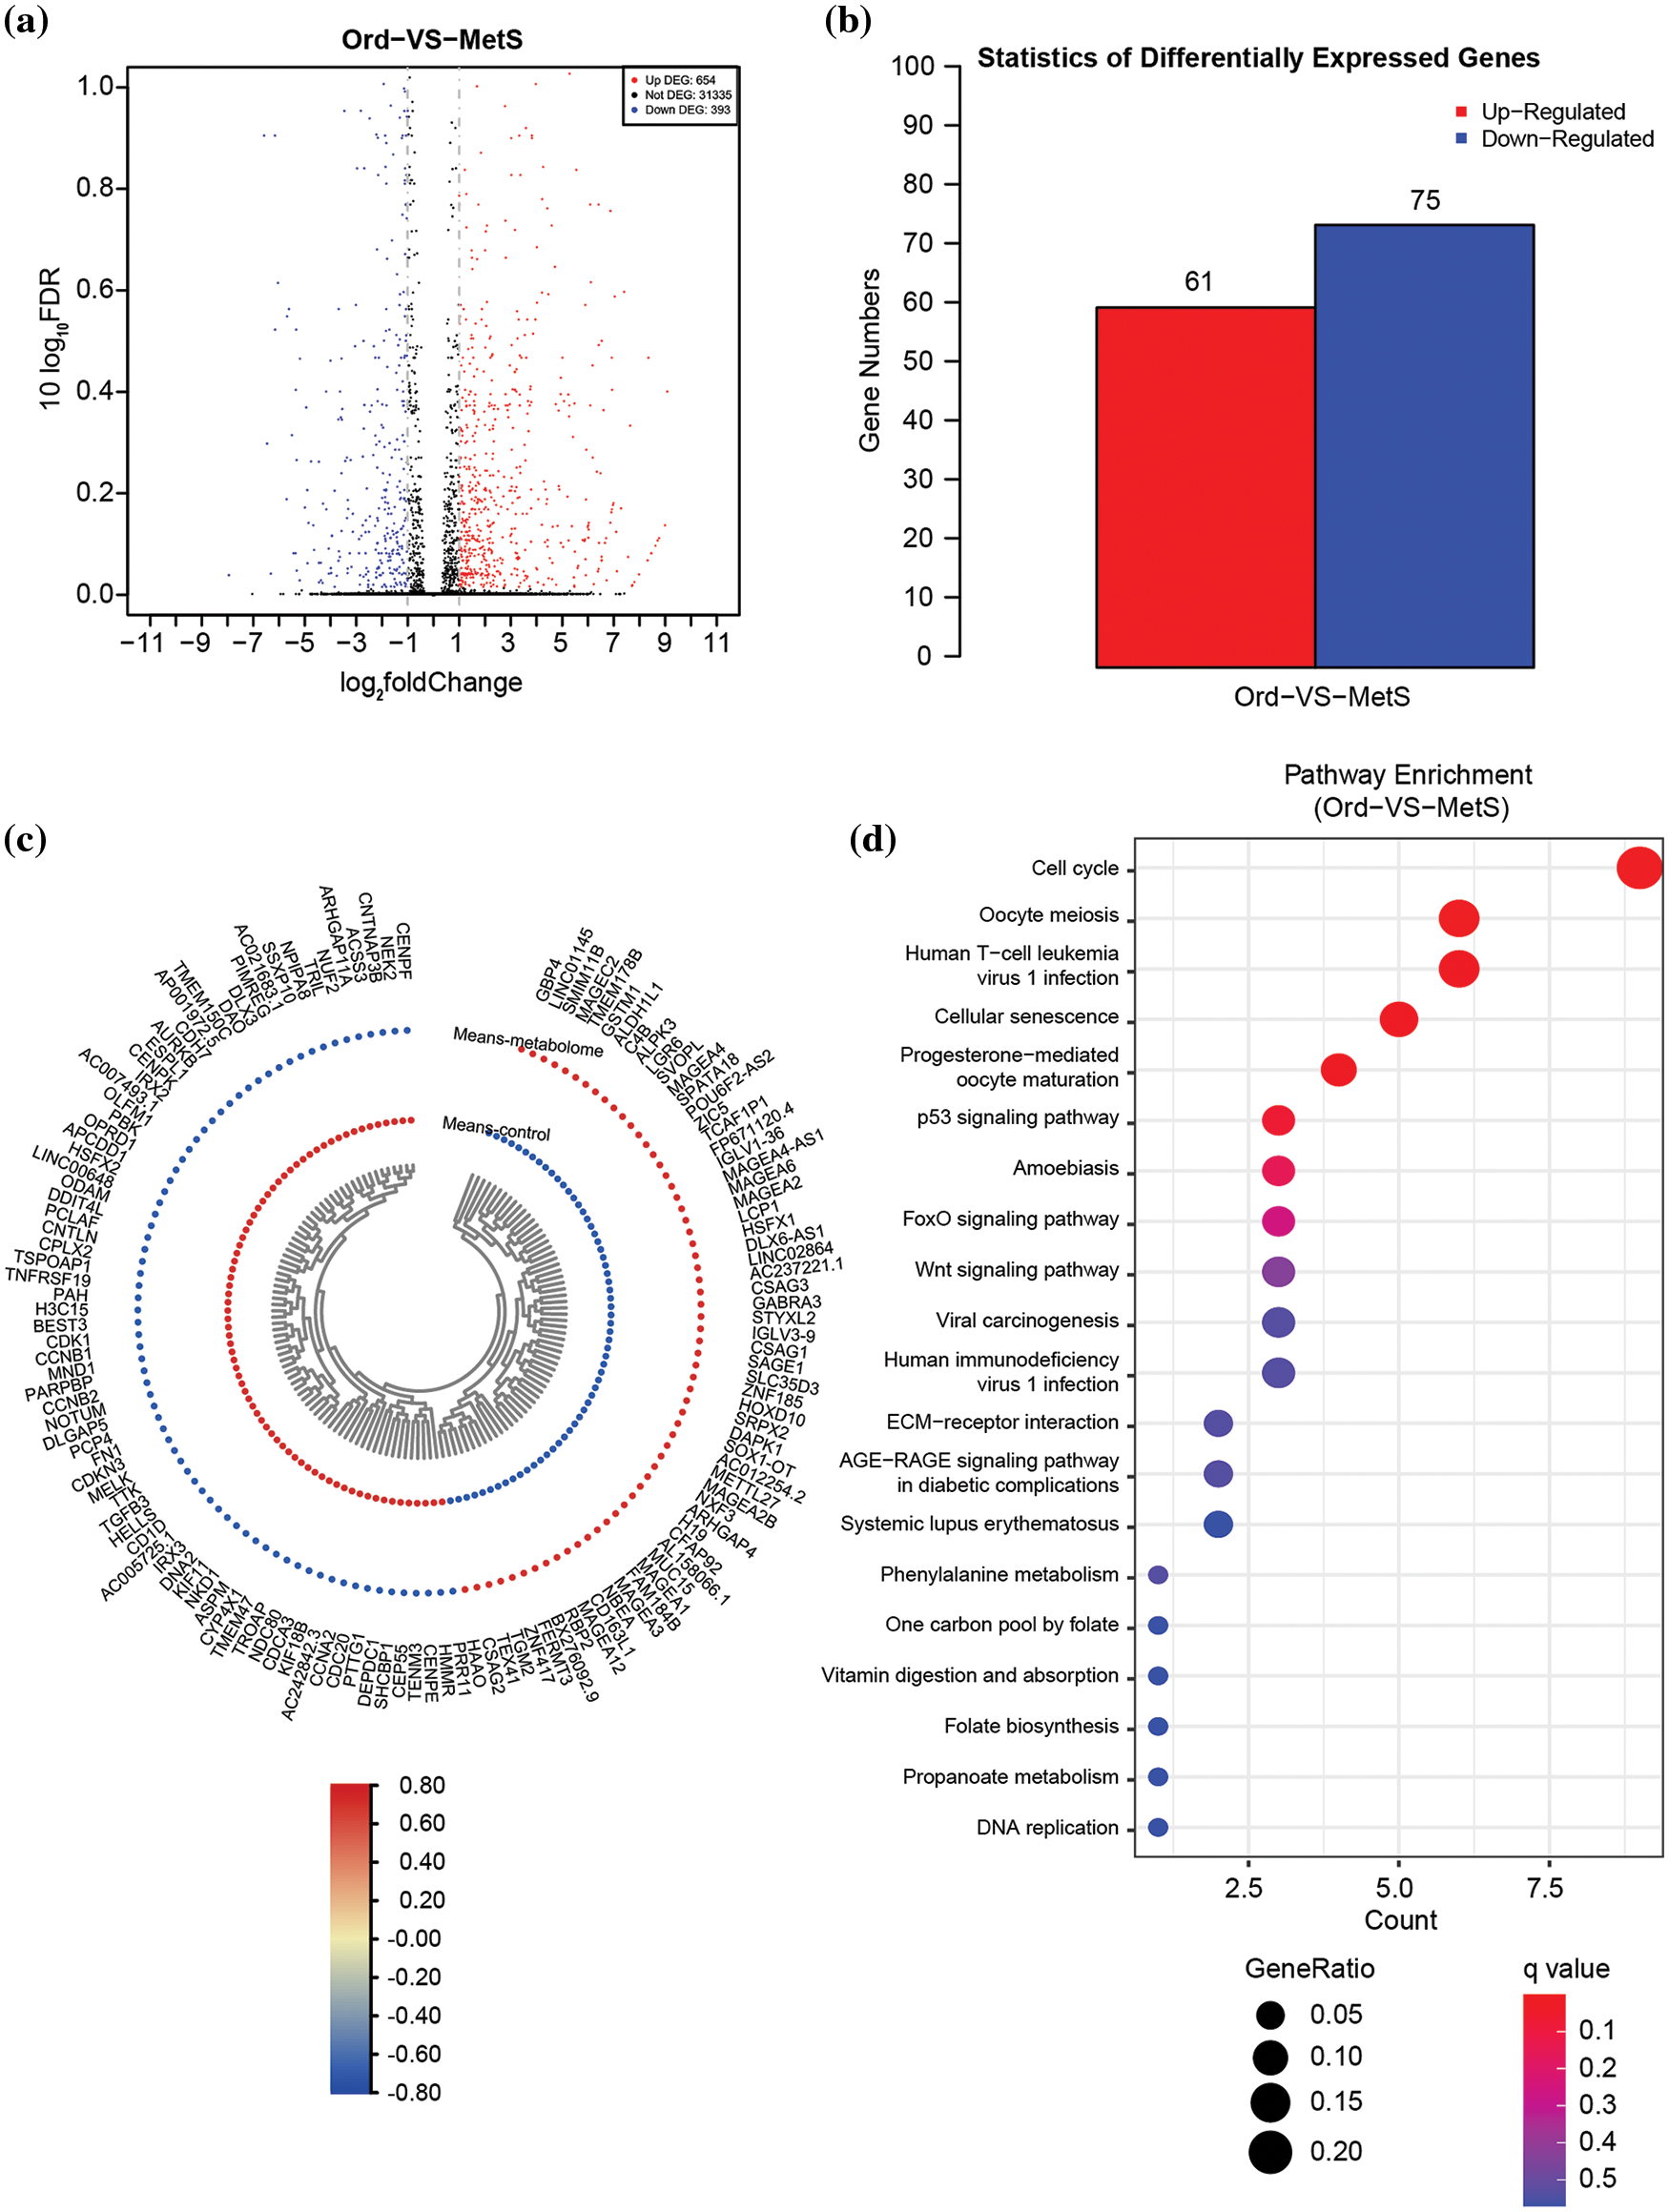
Figure 1: Overall transcriptome analysis between intestinal polyps in patients with metabolic diseases and intestinal polyps in non-MetS patients. (a) Volcano plots of all differentially expressed genes (DEGs) in the control vs. MetS groups. (b) Statistics of all DEGs. (c) Heat map of all DEGs. (d) KEGG pathway enrichment of all DEGs. ord, ordinary group. MetS, metabolic syndrome group.
Identification of key hub DEGs by integrating RNA-seq, TCGA, and CTD databases
Forty-four DEGs related to colon adenocarcinoma (COAD) (http://gepia2.cancer-pku.cn/#index) and intestinal polyp diseases (http://ctdbase.org/) were further screened by Venn diagram analysis of public databases (Fig. 2a), providing targets for exploring the role of metabolic diseases in the progression of intestinal polyps into colorectal cancer. GO analysis indicated that these genes are significantly involved in mitotic nuclear division spindle, histone kinase activity, and cyclin-dependent protein serine/threonine kinase regulator activity (Fig. 2b). The KEGG pathway also enriched in cell cycle and oocyte meiosis pathways (Fig. 2c), which is the same as the general transcriptome analysis. Moreover, molecular functional prediction showed that purkinje cell protein 4 (PCP4), assembly factor for spindle microtubules (ASPM), and death associated protein kinase 1 (DAPK1) were involved in calmodulin binding, cyclin B1 (CCNB1), cyclin A2 (CCNA2), and cyclin B2 (CCNB2) were involved in the activity of the serine/threonine kinase regulator, cyclin-dependent protein, cell division cycle 20 (CDC20), fibronectin 1 (FN1), and centromere protein F (CENPF) involved in protein C-terminus binding (Fig. 2d). We further compared the change trend of hub DEGs (|FC| ≥ 1.5) in RNA-Seq and Gene Expression Profiling Interactive Analysis (GEPIA)-COAD database and found that PCP4, FN1, transforming growth factor beta 3 (TGF-β3) and olfactomedin 1 (OLFM1) were down-regulated in both intestinal polyps in patients with metabolic diseases and patients with COAD patients (Fig. 2e). The interaction network of hub DEGs showed that these four genes also interacted with the AGE-RAGE pathway (Fig. 2f).
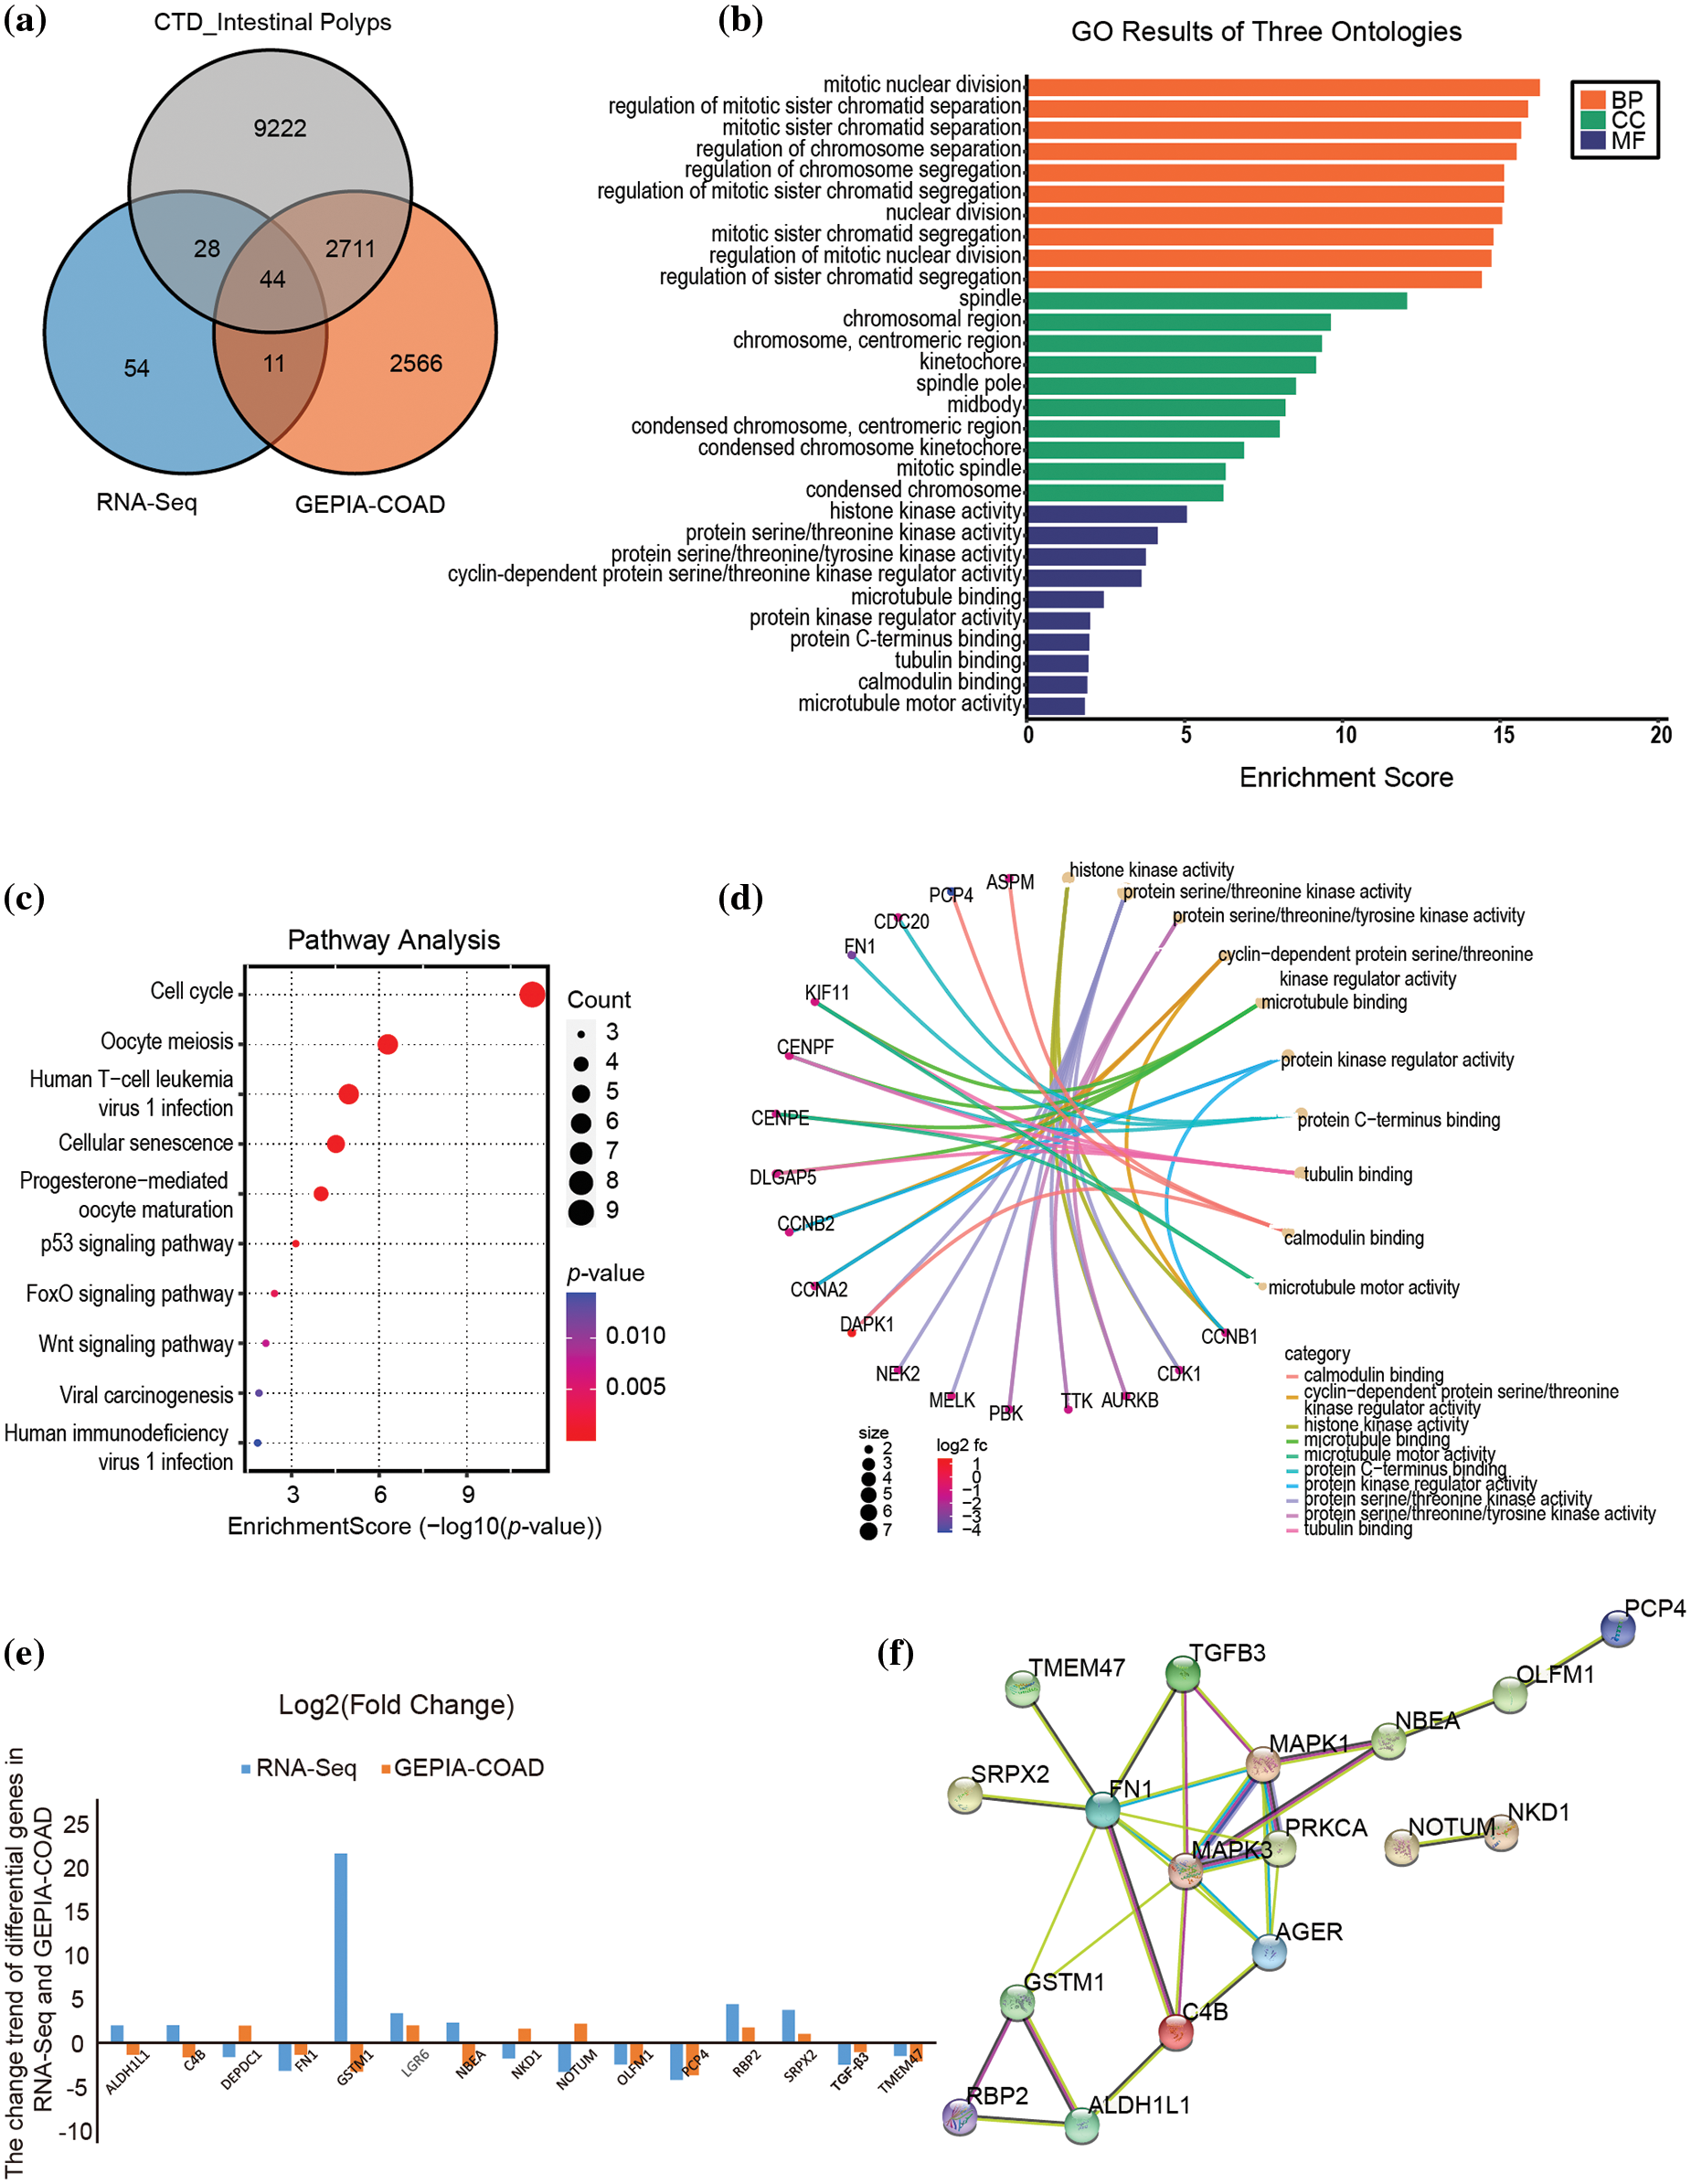
Figure 2: Screening key hub DEGs via WGCNA analysis integrating RNA-seq, TCGA, and CTD databases. (a) Venn diagram of RNA-seq, TCGA, and CTD databases. (b) GO results of biological process (BP), Cellular component (CC), and molecular function (MF). (c) KEGG pathway enrichment of hub DEGs. (d) Molecular functional prediction of hub DEGs. (e) The fold change of hub DEGs in RNA-seq and GEPIA-COAD database. (f) The PPI interaction network of significant hub DEGs (|FC| ≥ 1.5). Metabolic syndrome (MetS) group: polyps from patients with MetS; Ordinary (Ord) group: polyps from patients without MetS.
Analysis of the tumor relationship of four candidate genes in the TCGA database
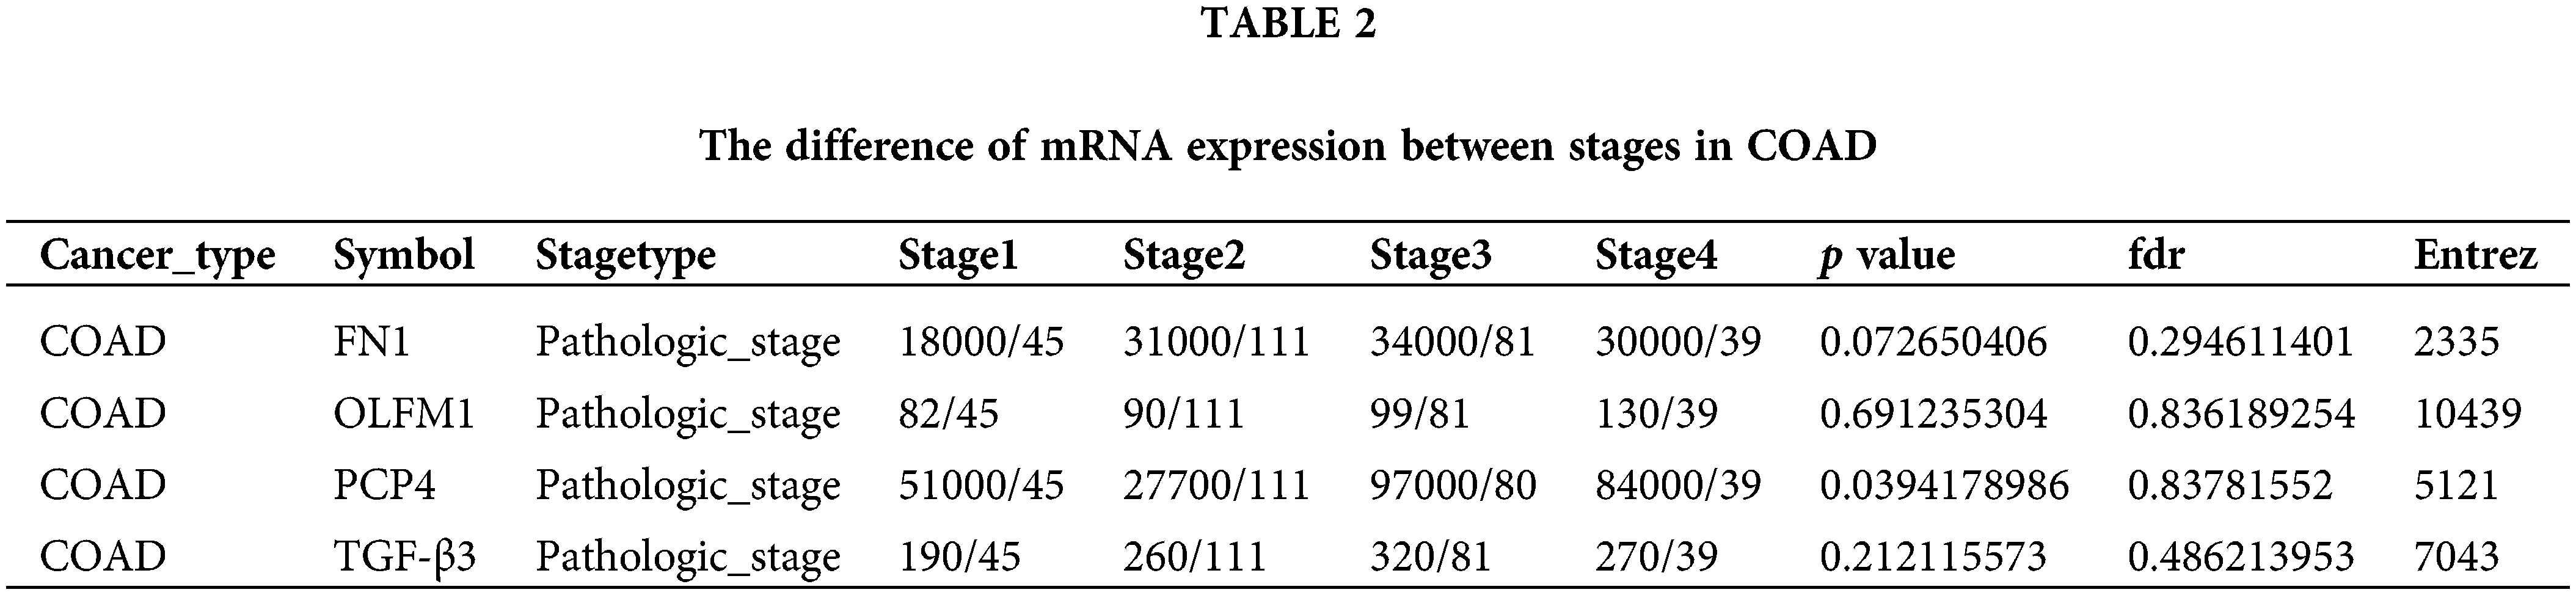
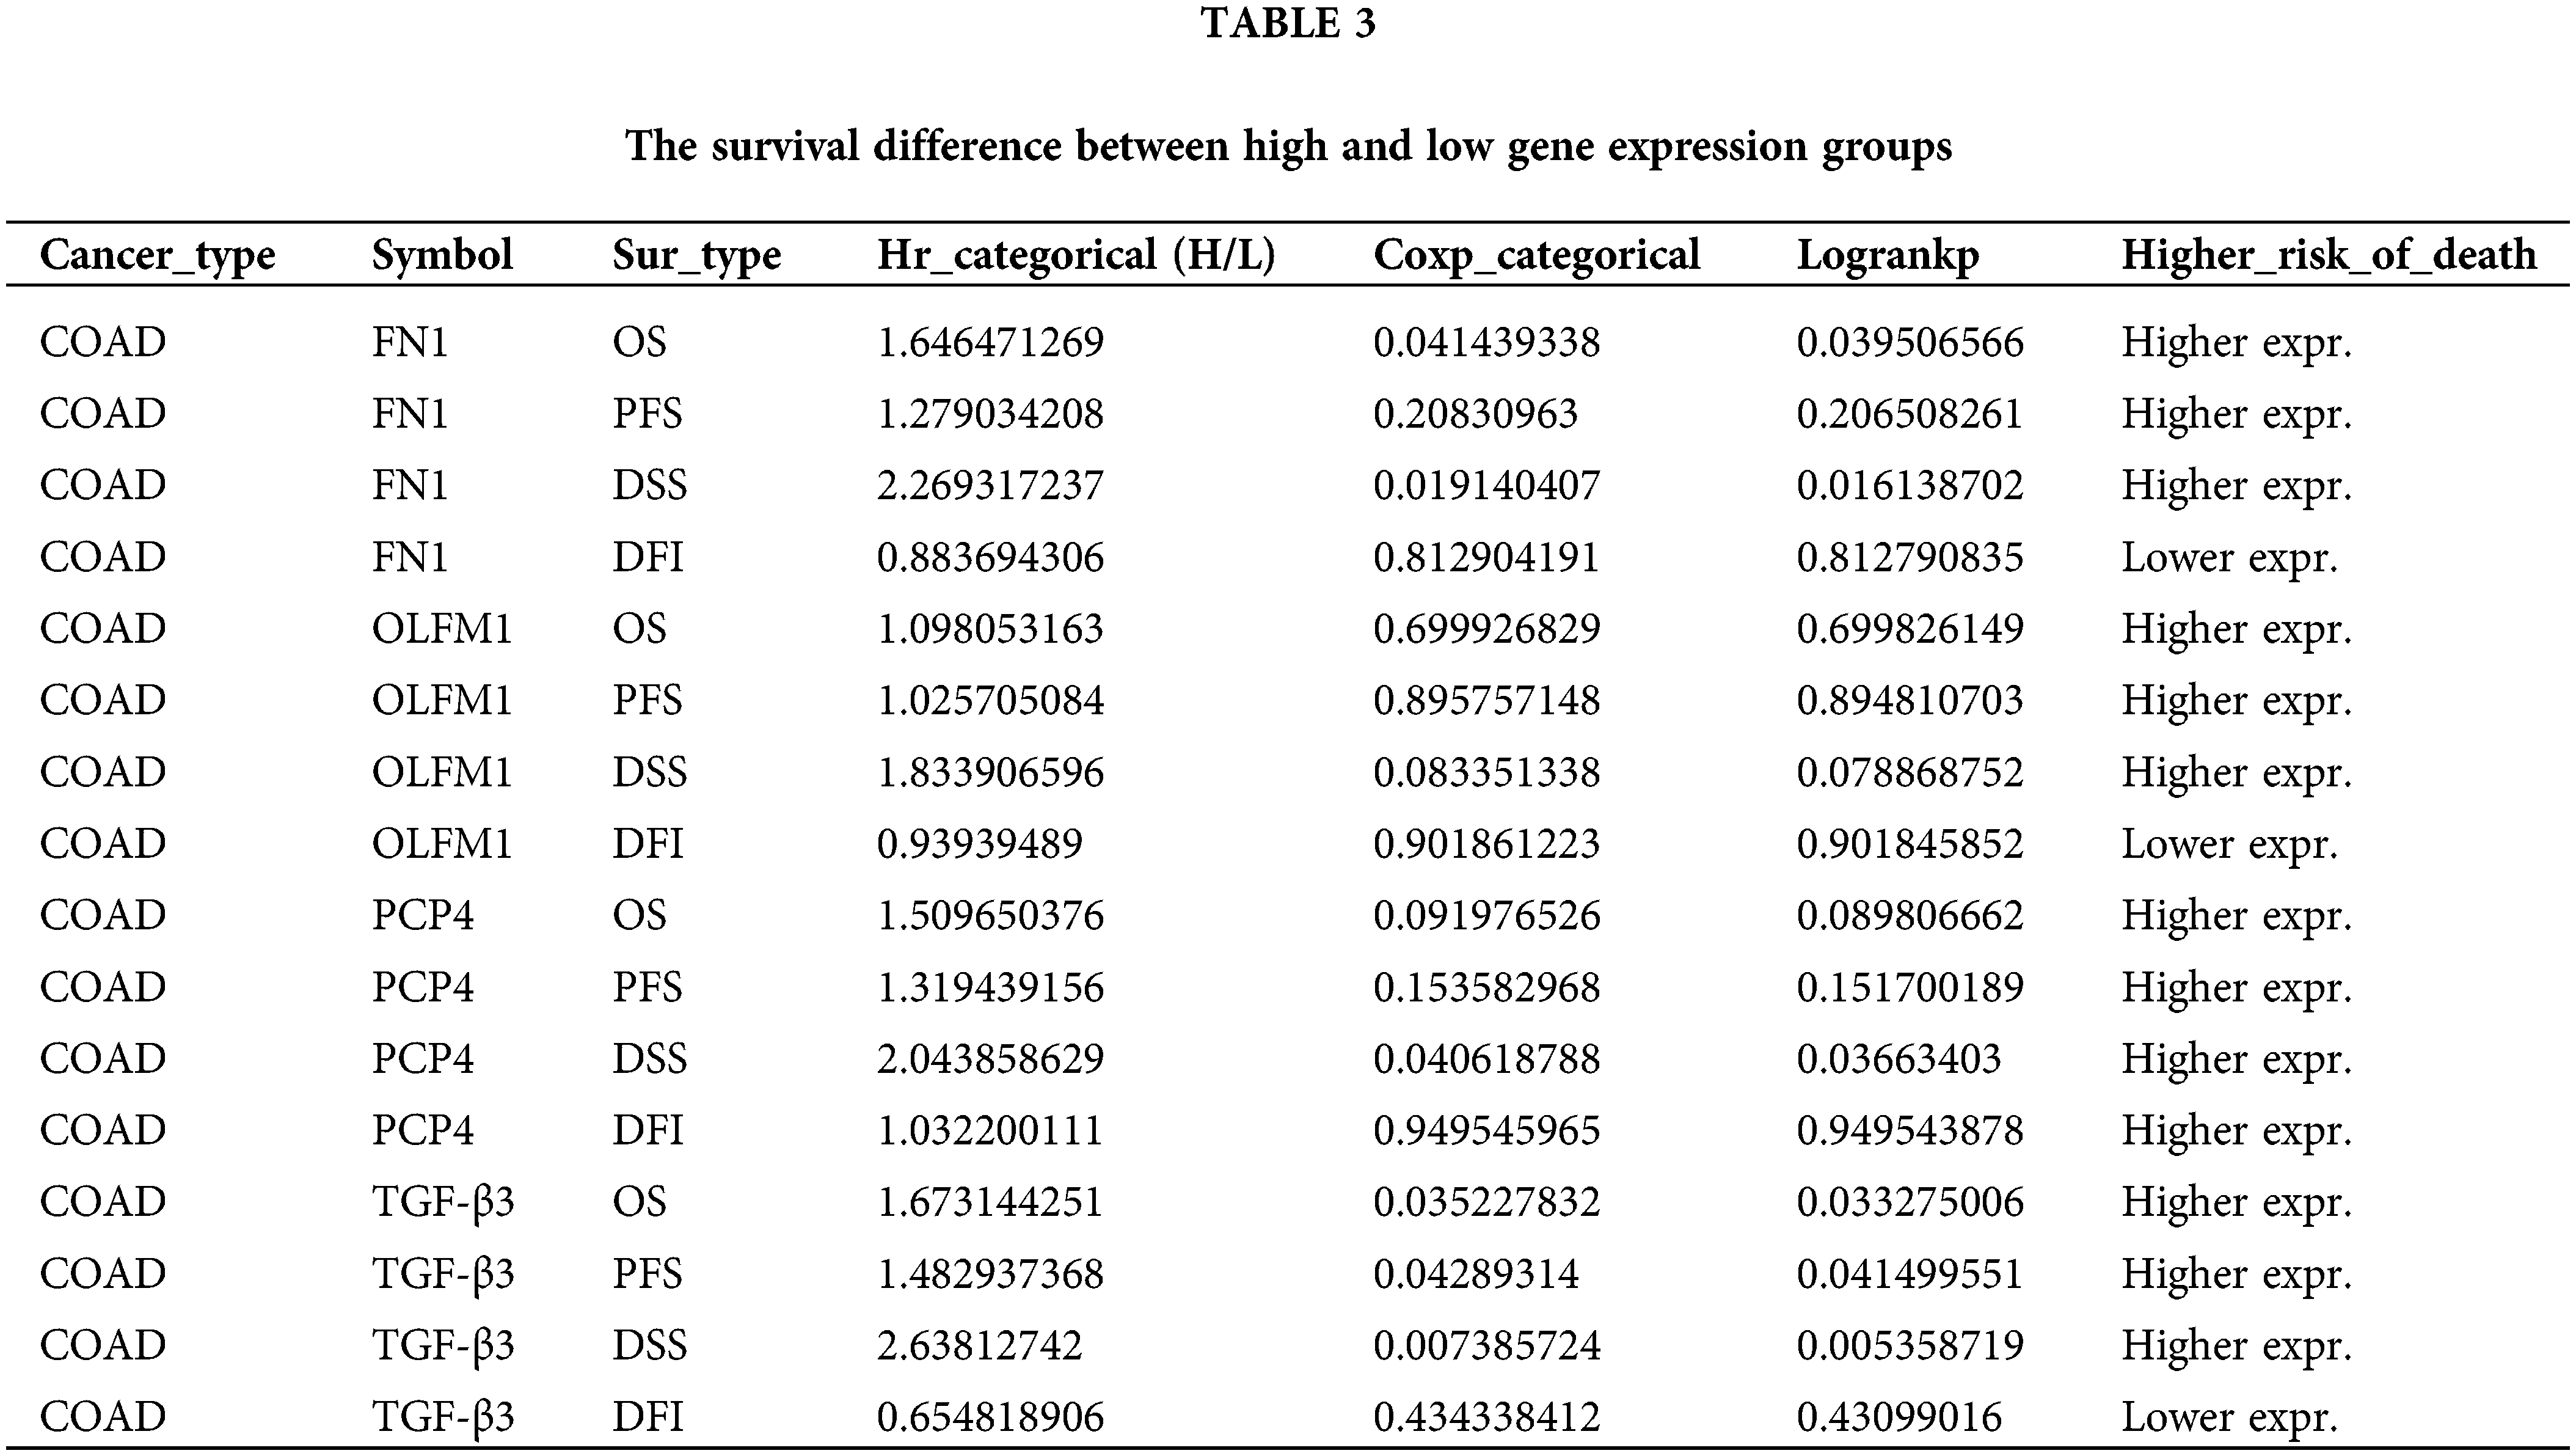
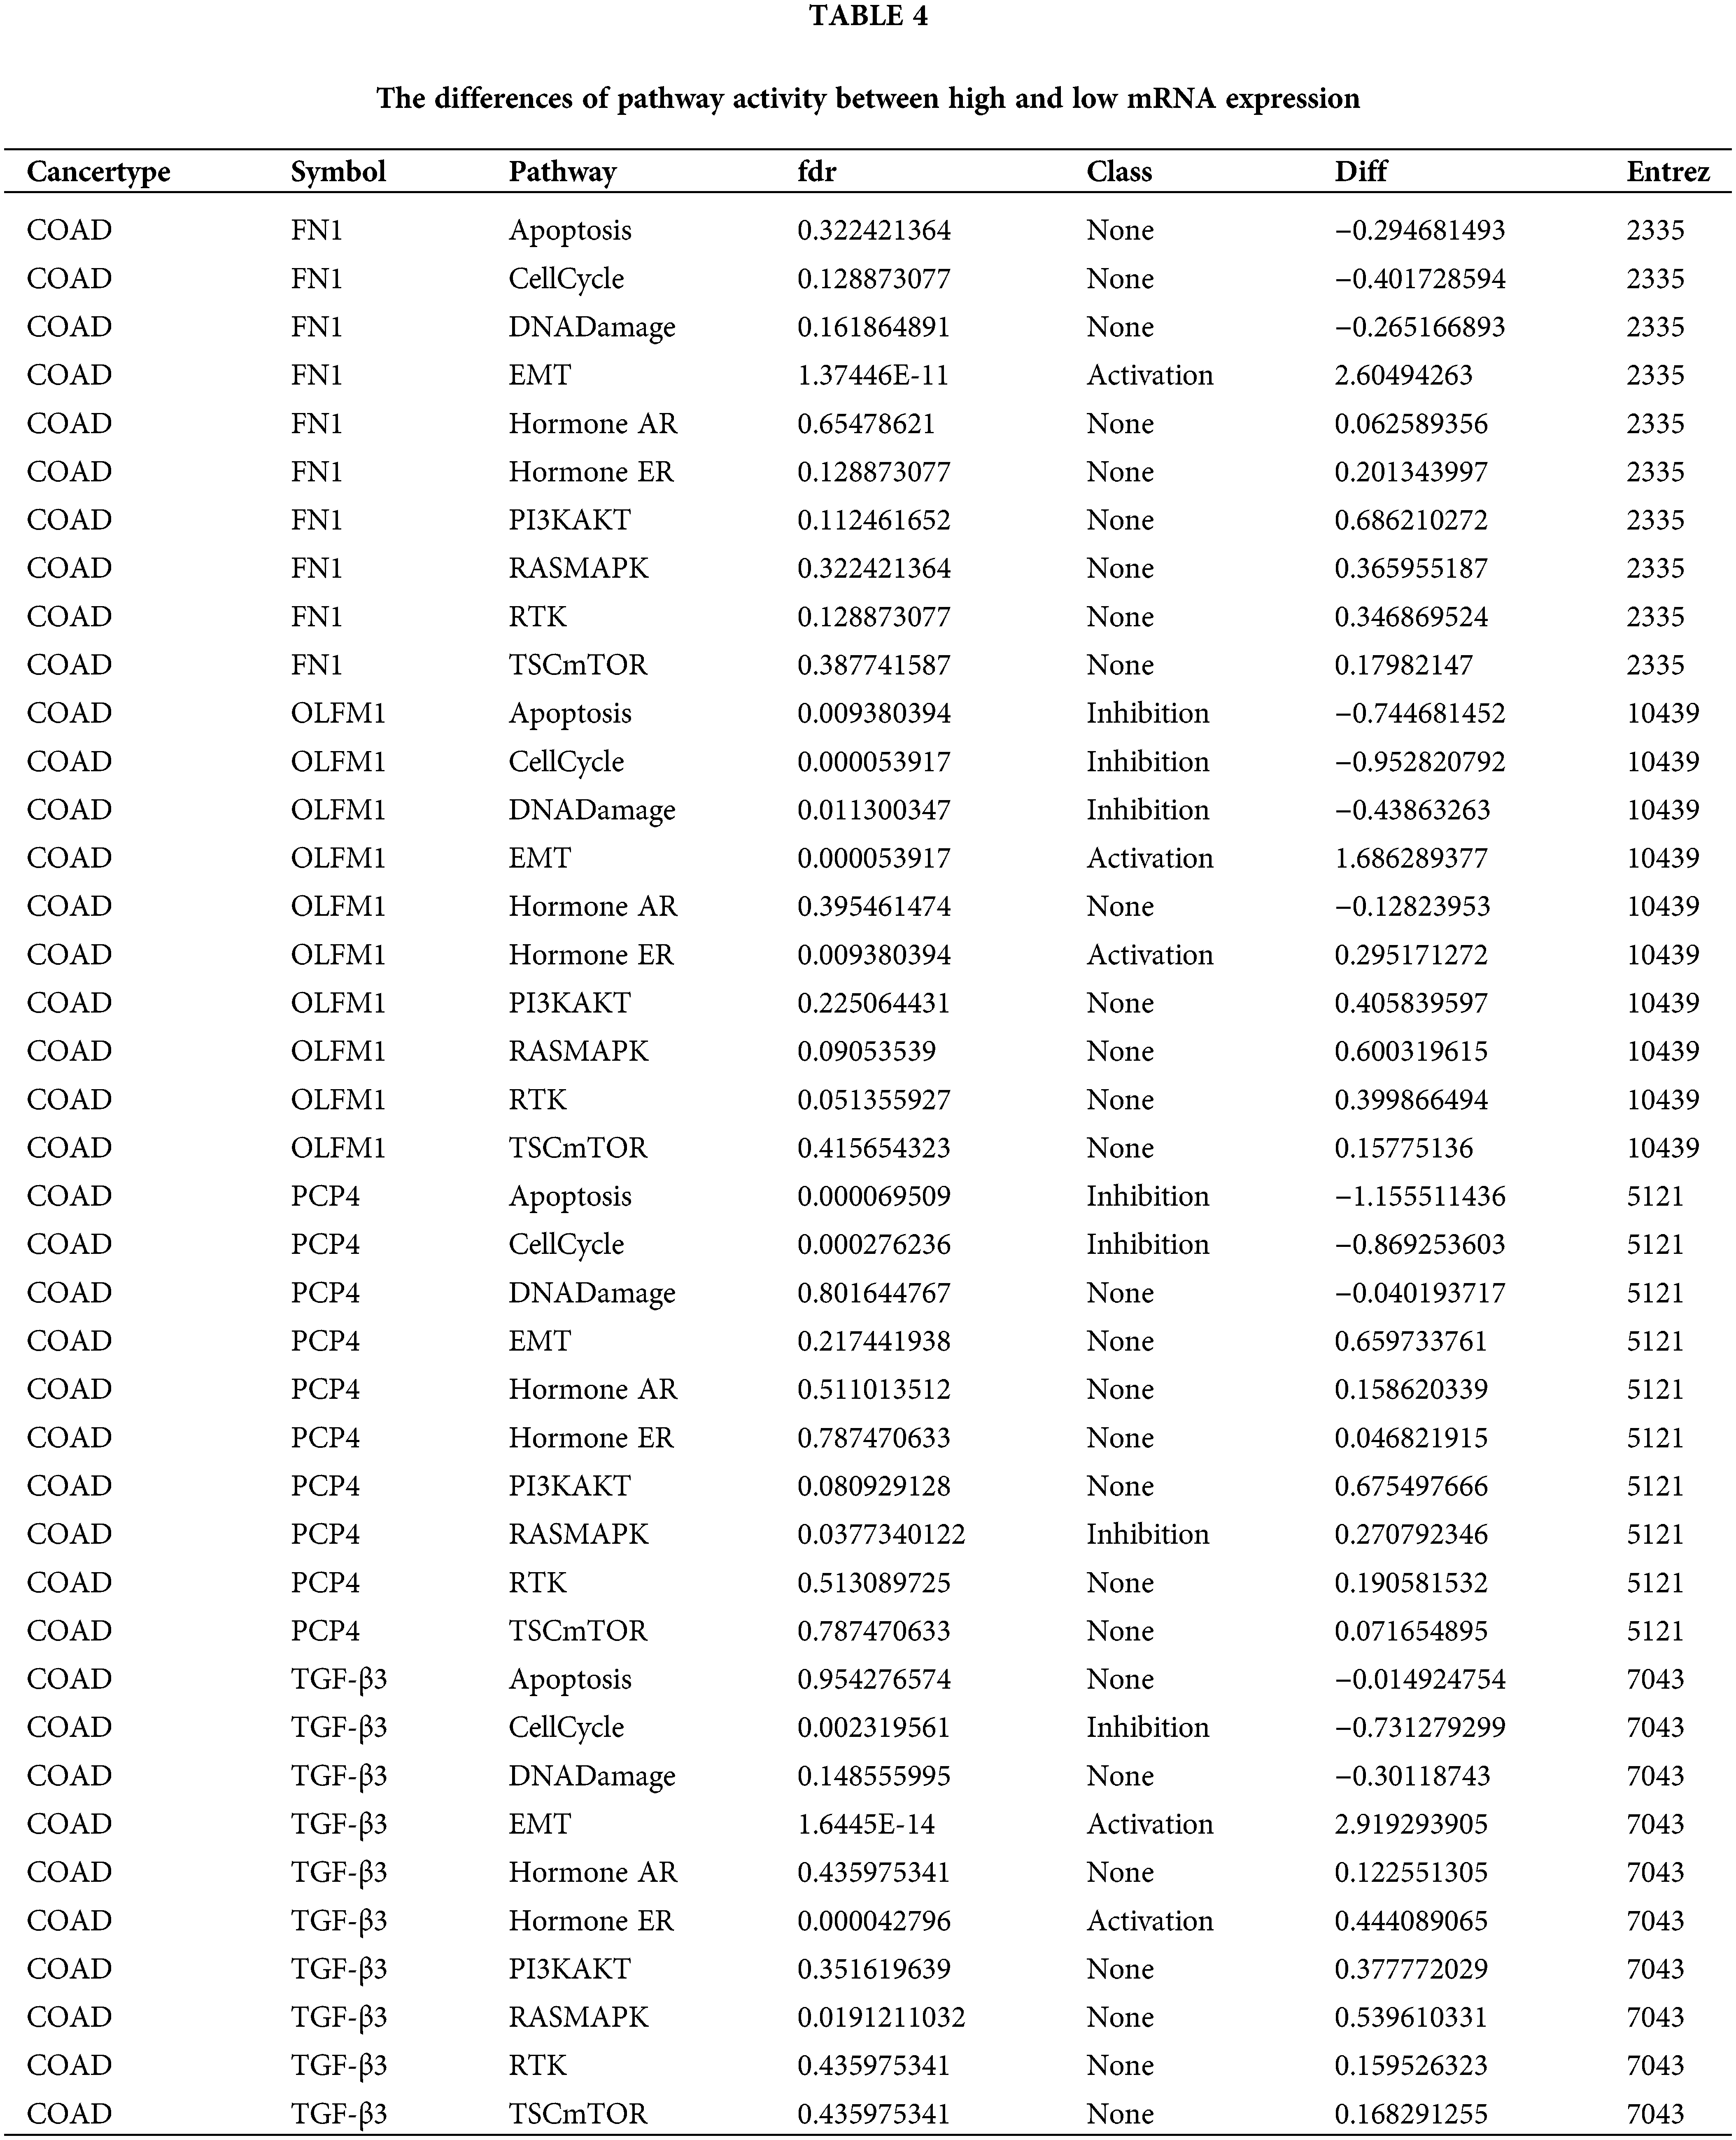
The expression trend analysis in pathological stages (trend plot) showed that PCP4 was closely related to stage development (Fig. 3a and Table 2). The survival analysis showed that higher expression of FN1, PCP4, and TGF-β3 indicated higher risk (Fig. 3b and Table 3). The pathway activity analysis showed that PCP4, OLFM1, and TGF-β3 probably inhibited the cell cycle (Fig. 3c and Table 4). Additionally, the correlation between PCP4, FN1, OLFM1, and TGF-β3 was analyzed using TIMER (https://cistrome.shinyapps.io/timer/). The results showed that TGF-β3 was significantly positively correlated with FN1 (cor = 0.754), OLFM1 was positively correlated with FN1 (cor = 0.451), OLFM1 was positively correlated with TGF-β3 (cor = 0.451), and OLFM1 was positively correlated with PCP4 (cor = 0.159) (Fig. 3d).
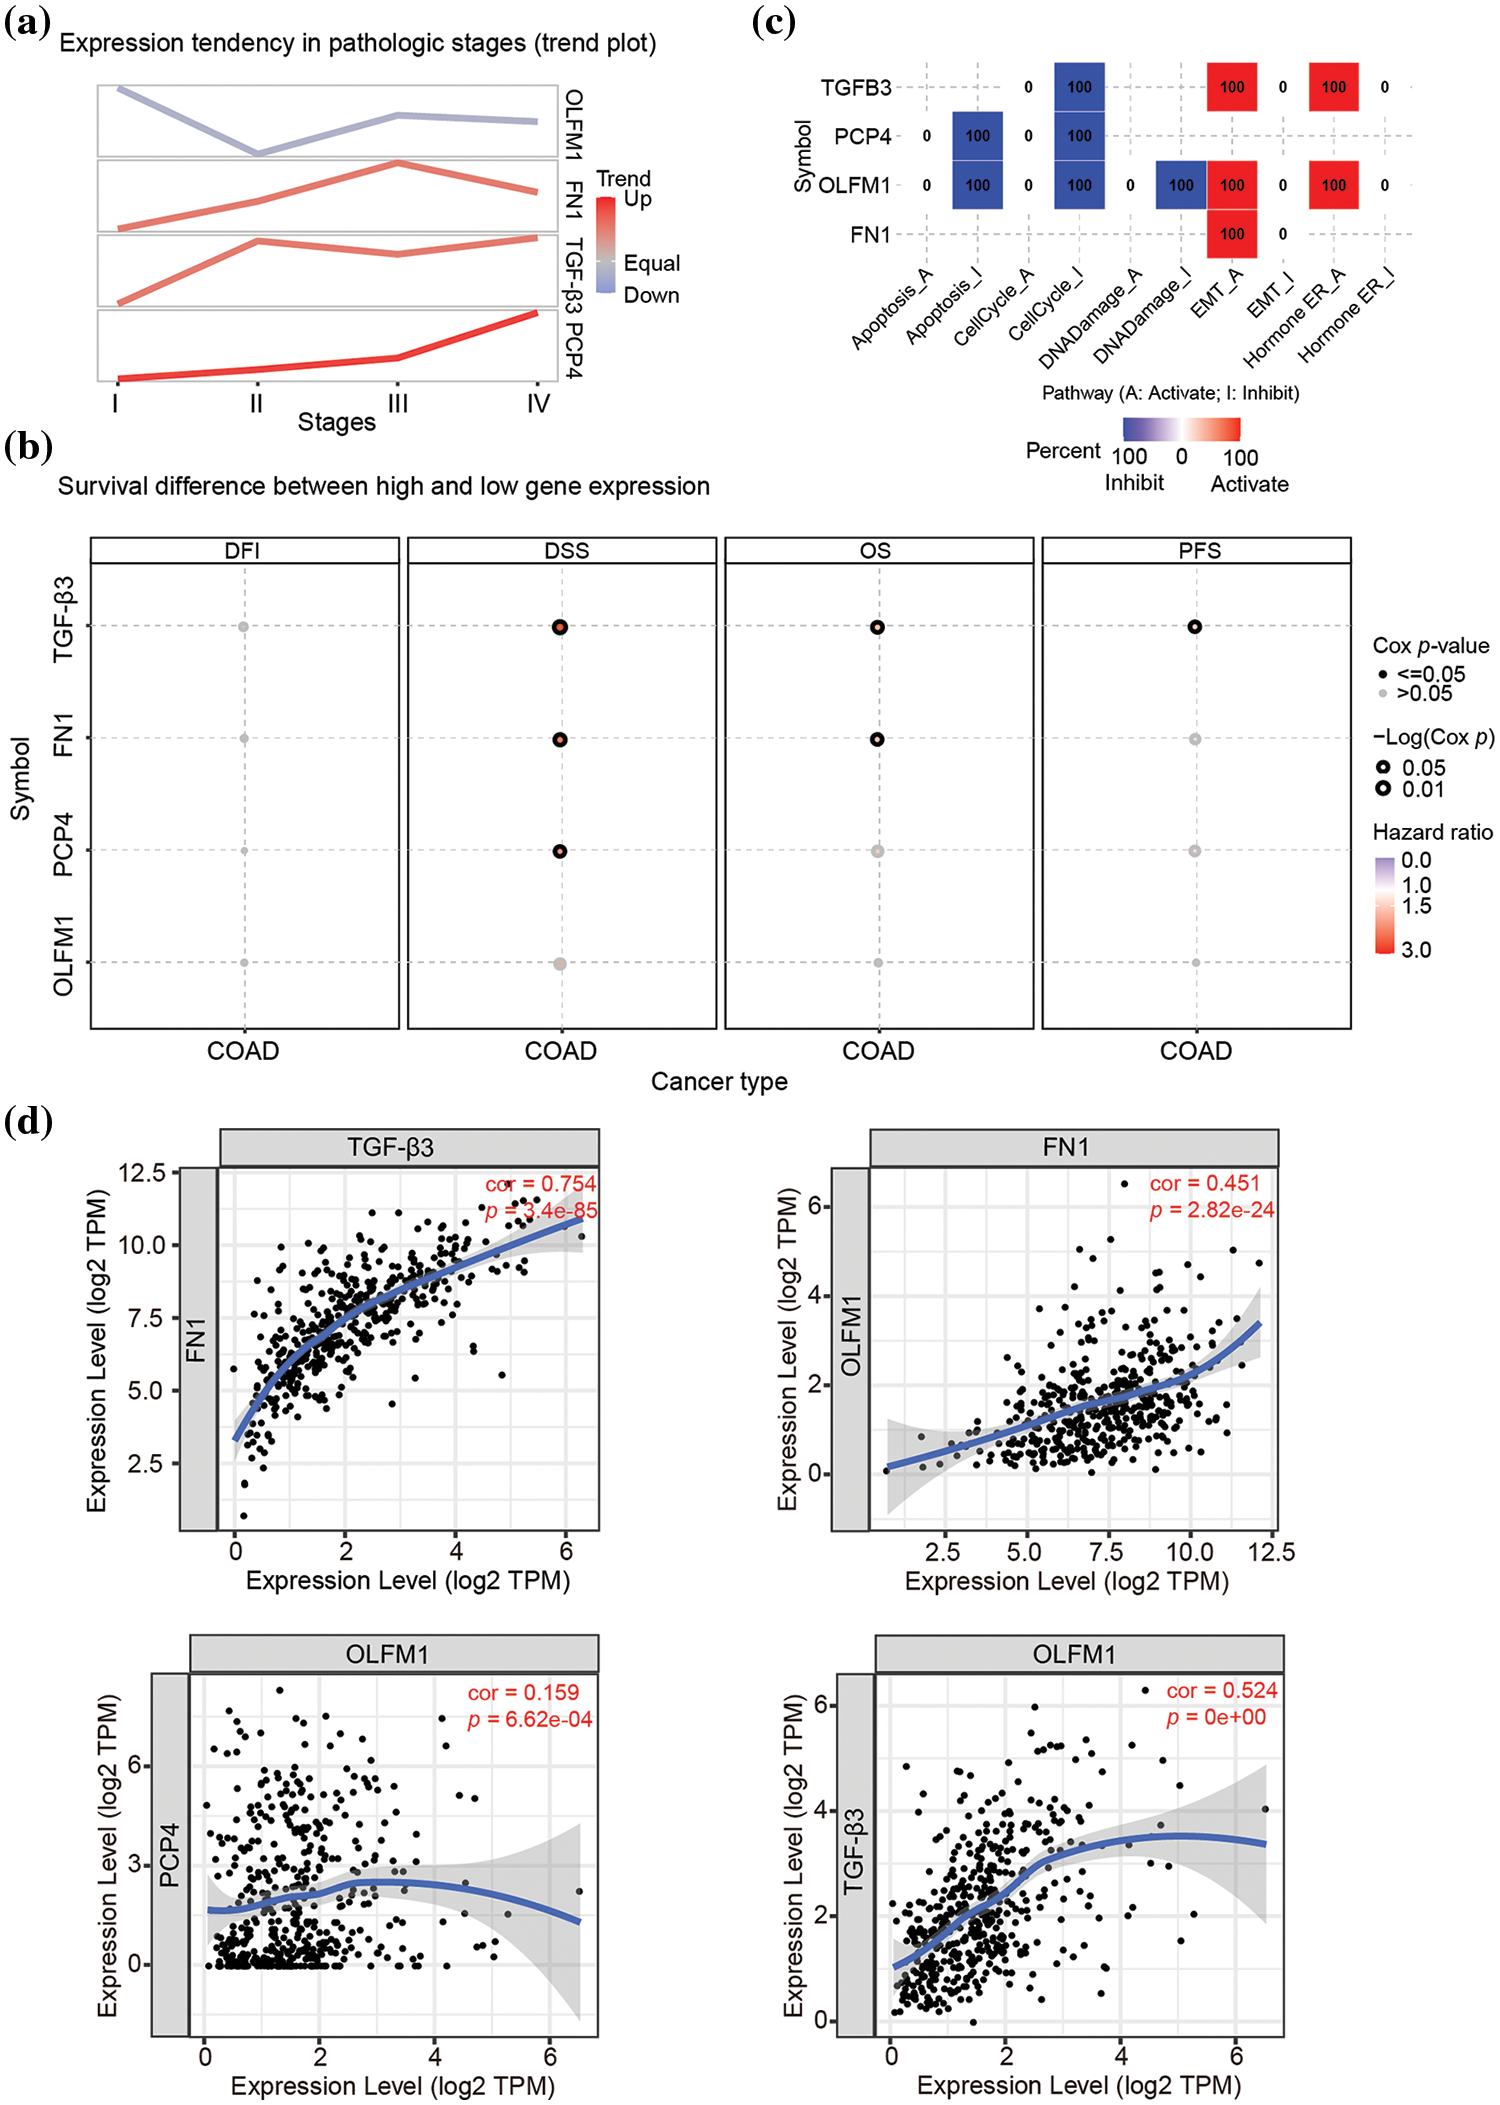
Figure 3: Tumor correlation analysis of candidate genes in the TCGA-COAD database. (a) Expression trend in pathological stages (trend plot). (b) Survival difference between high and low gene expression. (c) The proportion of COAD instances in which the mRNA expression of a particular gene may influence pathway activity. (d) Correlation between expression levels of PCP4, FN1, TGF-β3, and OLFM1 in COAD. The correlation module plots expression scatterplots for user-defined gene pairs in COAD, displaying Spearman’s rho and statistical significance. p < 0.05 indicates significant correlation.
IHC analysis was performed for the four candidate genes
IHC analysis showed that OLFM1 was localized in the cytoplasmic matrix and expressed in the glandular cavity and smooth muscle tissue. And further statistical analyses were conducted on the positive signal intensity of OLFM1 within the unit area, and the same was done for the other three candidate proteins. Compared to the Ord group, OLFM1 expression was significantly decreased in the MetS group (p = 0.0053) (Fig. 4a). FN1 was localized in the cytoplasmic matrix, mainly expressed in tissues outside the glandular lumen such as smooth muscle, and there was no significant difference between the Ord group and MetS group (Fig. 4b). Similarly, PCP4 was localized in the cytoplasmic matrix and expressed in glandular lumen and smooth muscle tissue. There was no significant difference between the Ord group and MetS group (Fig. 4c). TGF-β3 was localized in the cytoplasmic matrix and mainly expressed in the glandular lumen, but there was no significant difference between the Ord group and MetS group (Fig. 4d).
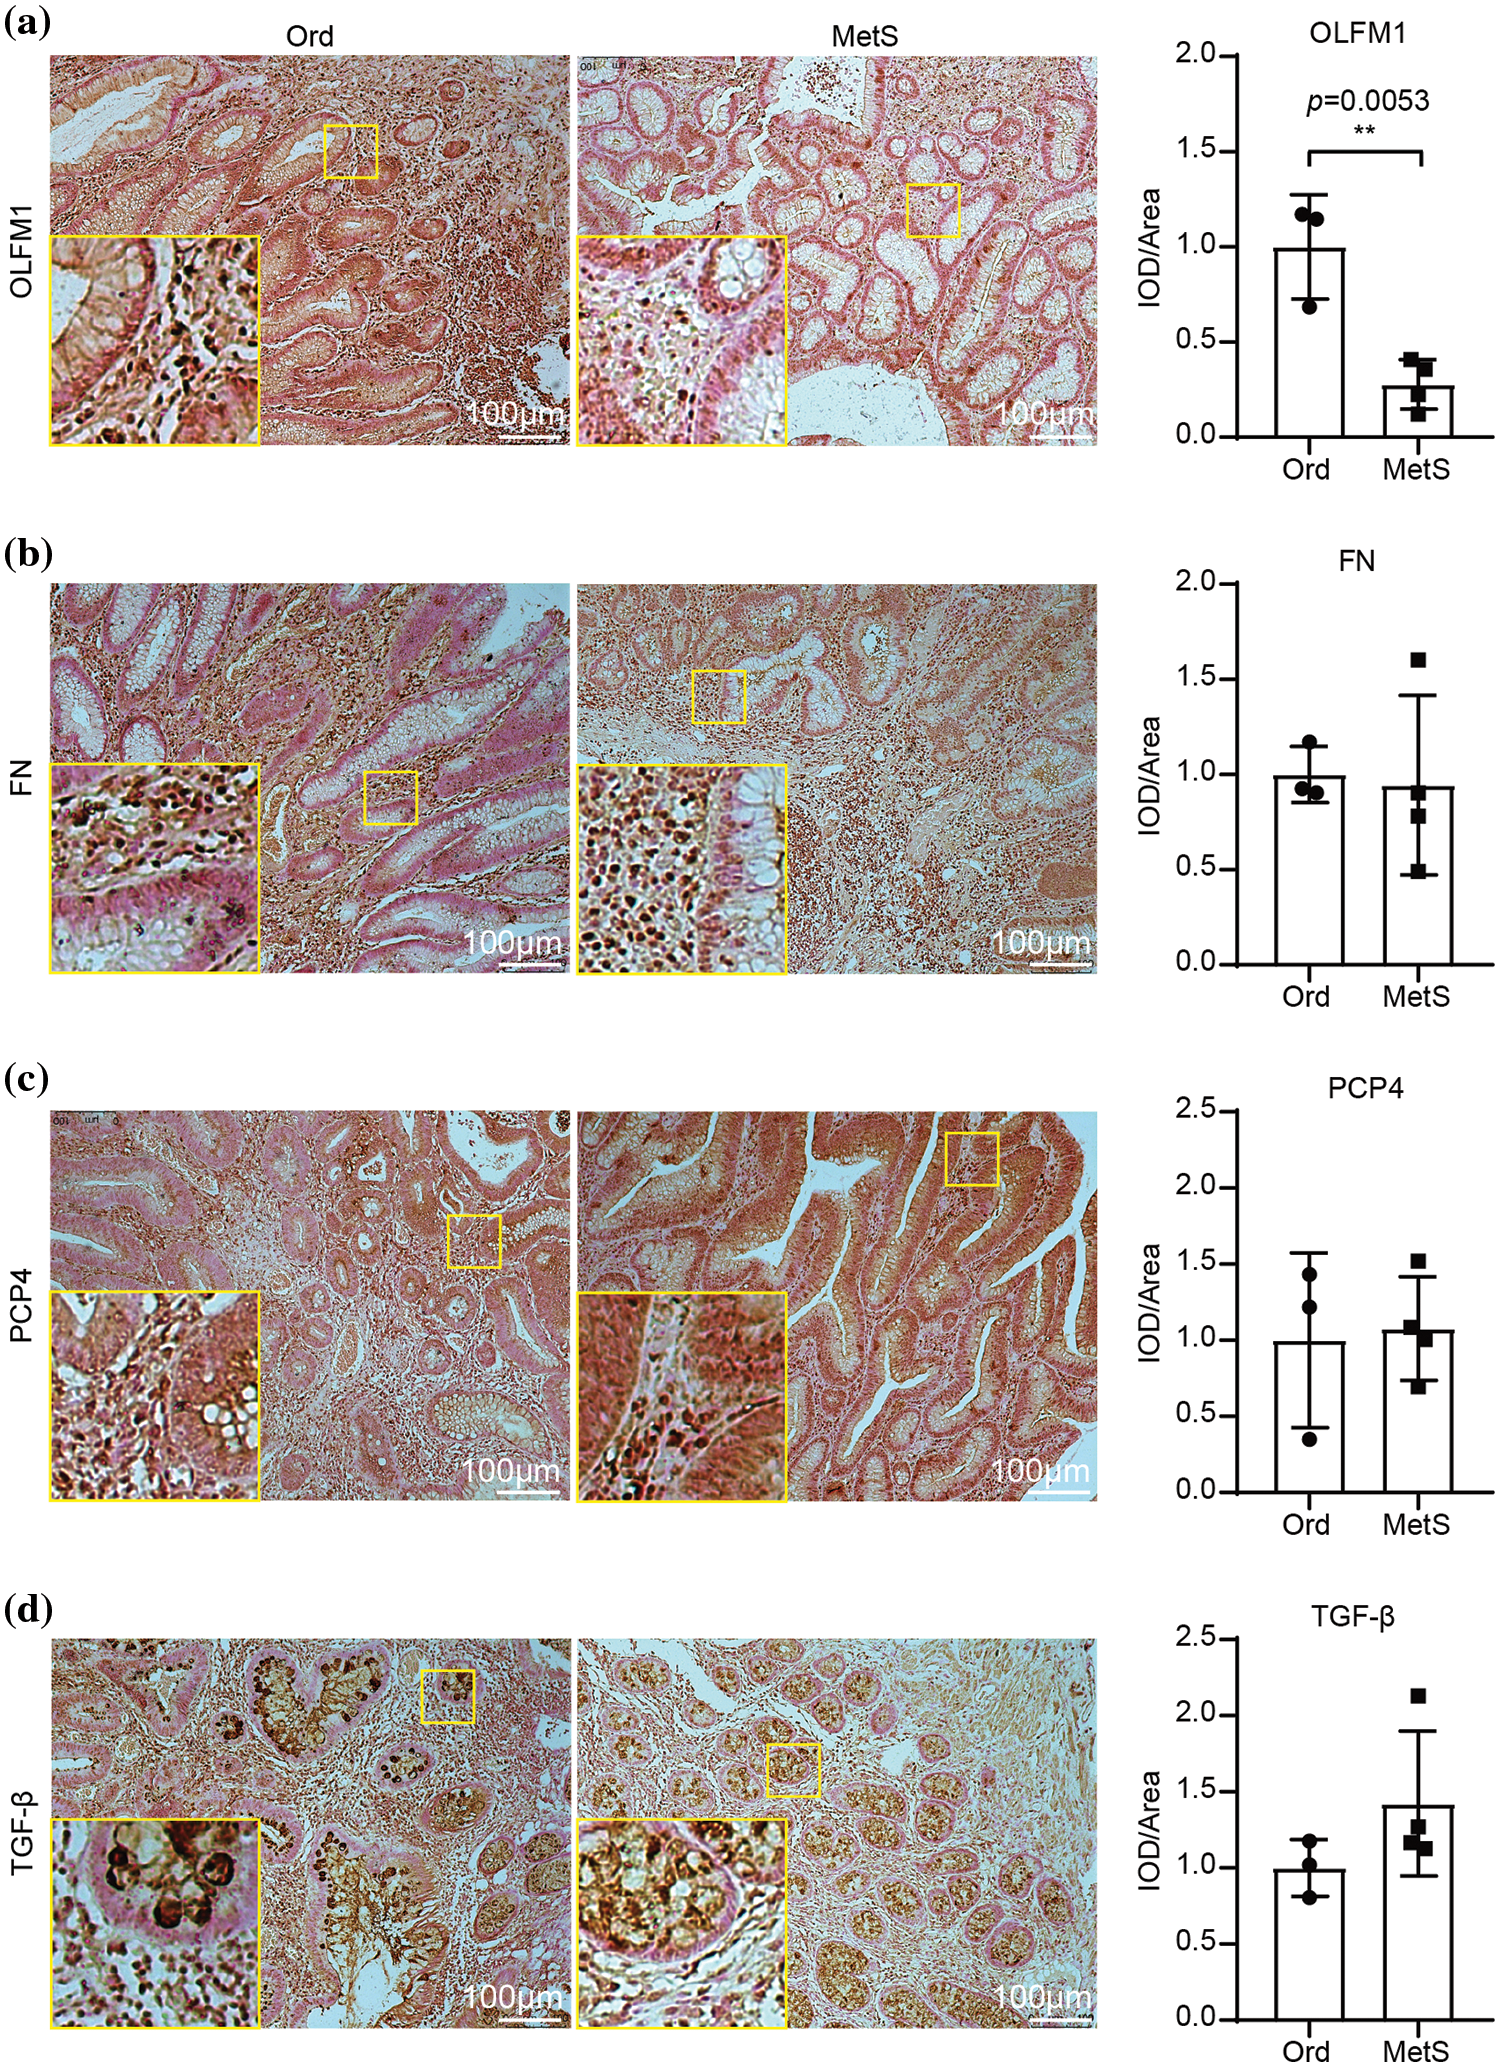
Figure 4: Immunohistochemistry of the four candidate genes. Immunohistochemistry shows the expression of OLFM1 (a), FN1 (b), PCP4 (c), and TGF-β (d). The values are presented as mean ± SD (n = 3 in the non-MetS group and n = 4 in the MetS group). **p < 0.01. Scale bar = 100 μm. Metabolic syndrome (MetS) group: polyps from patients with MetS; Ordinary (Ord) group: polyps from patients without MetS.
OLFM1 inhibited cell colony formation, proliferation and migration
To further explore the molecular mechanism of OLFM1 in intestinal polyps, we designed OLFM1 SiRNA to reduce the expression of OLFM1 in human intestinal polyp epithelial cells. The results of WB and qPCR showed that SiRNA-1 had the best interference effect among the three interference sequences (Figs. 5a and 5b), and SiRNA-1 was selected for subsequent experiments. Further, we examined the proliferation ability of HIPEC by CCK8 Kit. Our results revealed that compared with the cells in the NC group, Si-OLFM1 significantly promoted the growth of HIPEC cells on 48 and 72 h (Fig. 5c). Then, Colony formation assays also revealed that the number of clones in Si-OLFM1 group was significantly higher than that in NC group (Fig. 5d). Wound healing and transwell assays were used to detect the migration ability of HIPEC. The results showed that the migration ability has been enhanced by OLFM1 knocking down (Figs. 5e and 5f).
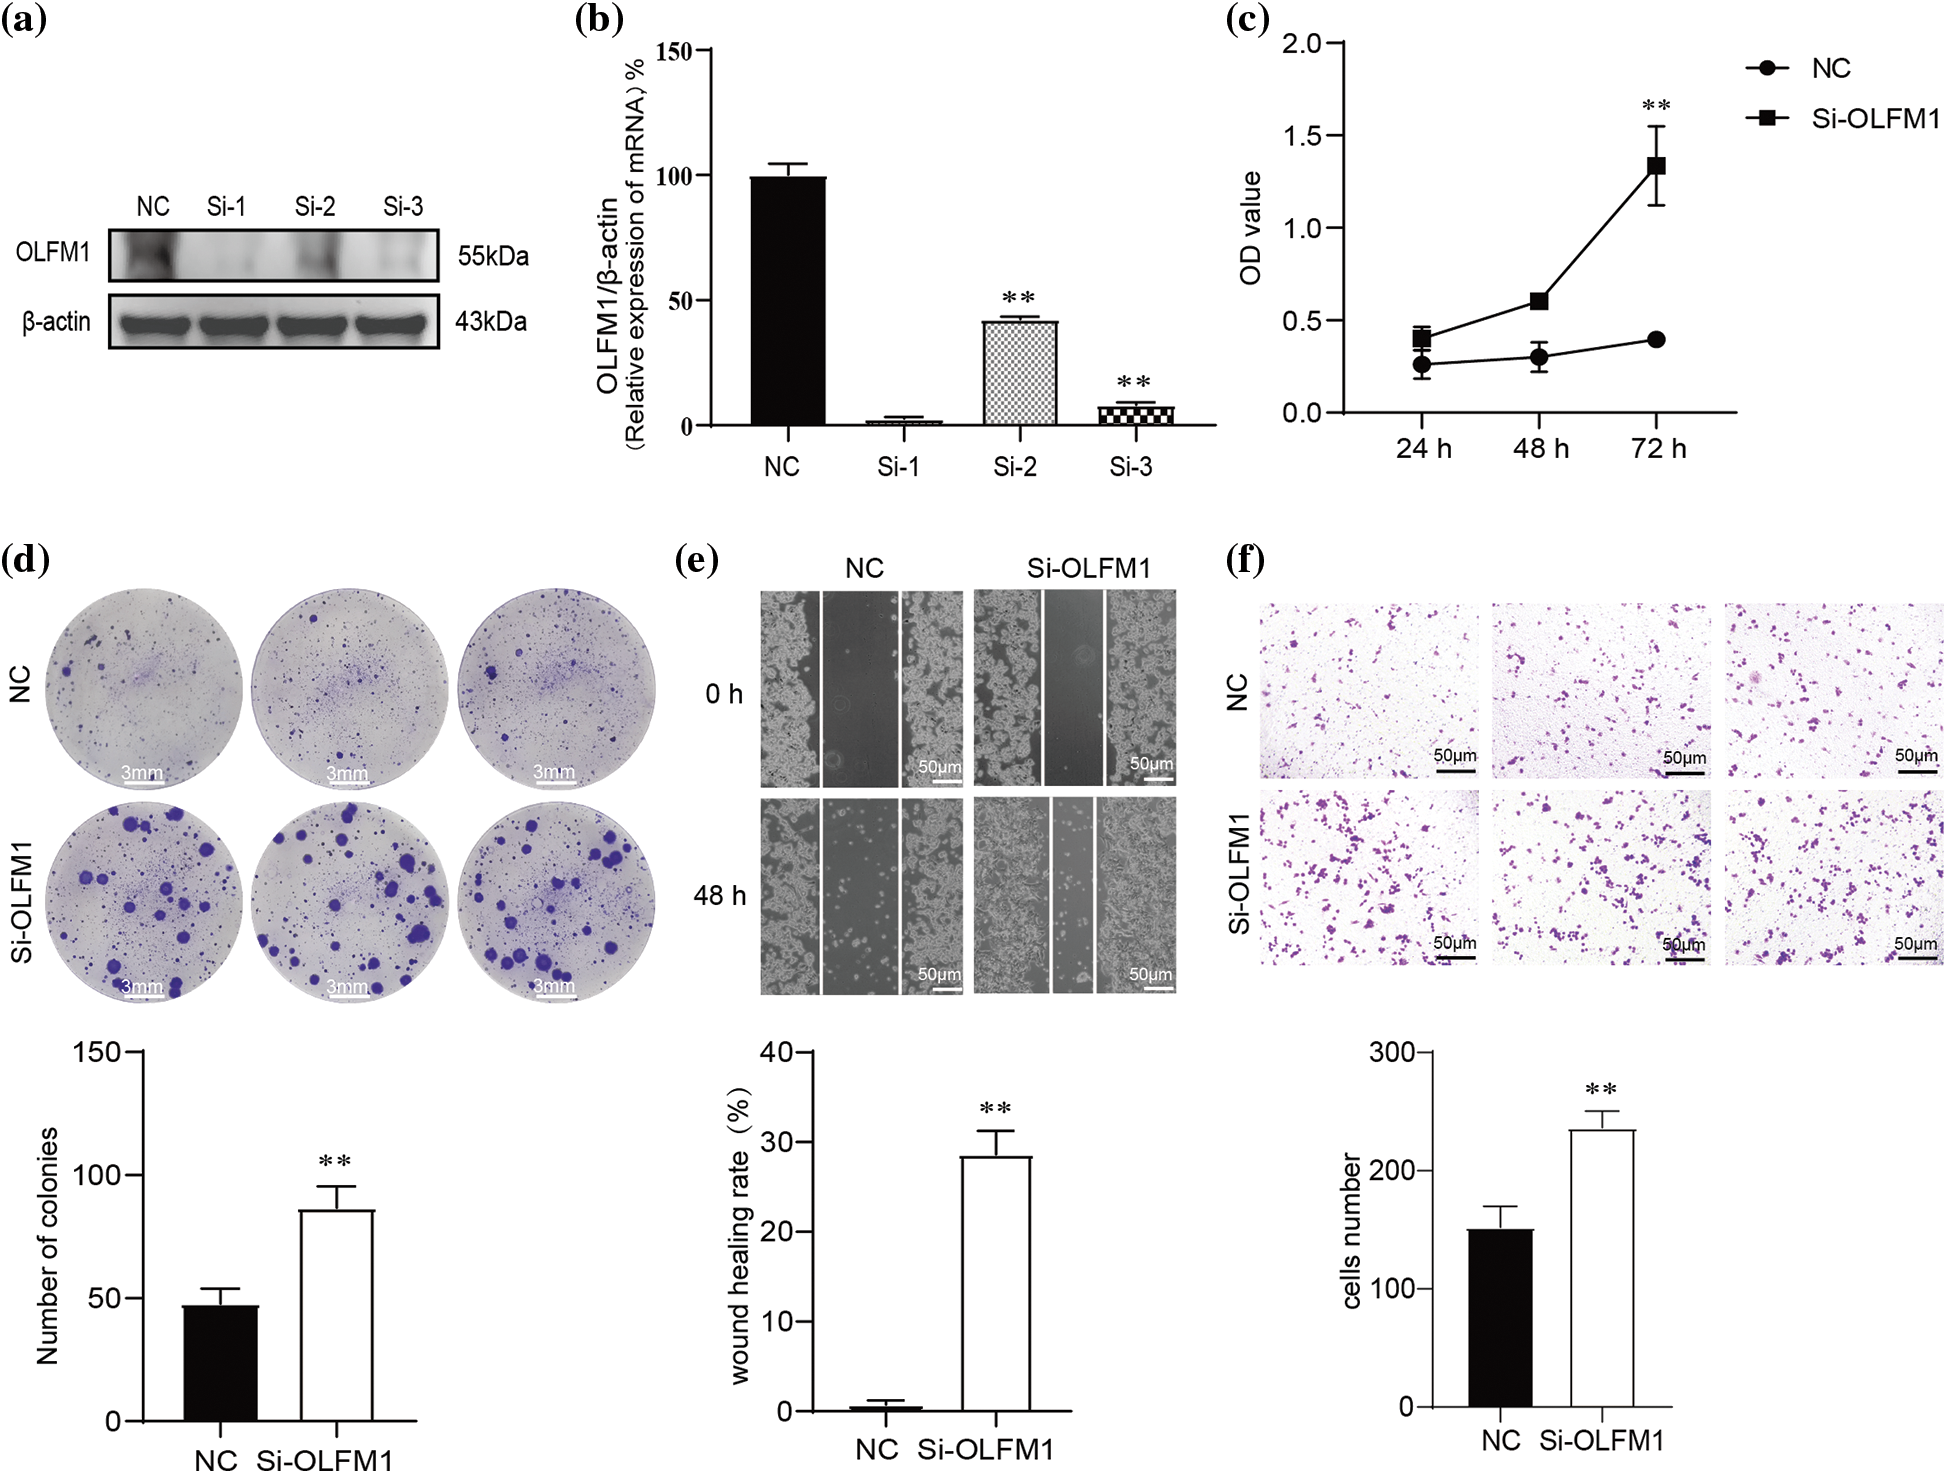
Figure 5: OLFM1 inhibited cell colony formation, proliferation and migration. Verification of siRNA interference efficiency which were assessed by RT-qPCR (b) and WB (a); (c) knockdown of OLFM1 promoted the proliferation of human intestinal polyp epithelial cell (HIPEC) which was assessed by CCK-8 assay; (d) knockdown of OLFM1 promoted the colony formation ability of HIPEC, scale bar = 3 mm; (e) and (f) knockdown of OLFM1 promoted the migration of HIPEC which were assessed by wound healing assay and transwell assays. The values are performed as mean ± SD (n = 3, **p < 0.01), scale bar = 50 μm. NC, Negative Control. Si-1, OLFM1 siRNA-1. Si-2, OLFM1 siRNA-2. Si-3, OLFM1 siRNA-3.
In our study, the age range of the metabolic syndrome (MetS) group was notably broad, spanning from 47 to 81 years with a median age of 65.5. In contrast, the ordinary polyp (Ord) group’s median age was 51 (Table 1). This significant median age difference of 14.5 years between the groups could suggest a more rapid progression to advanced stages of polyp carcinization in the MetS group, potentially indicating a heightened CRC risk for these individuals. This hypothesis aligns with recent research indicating that MetS is a significant independent risk factor for colorectal polyps in middle-aged and elderly populations in Taiwan [43]. The increased recurrence of intestinal polyps observed in the MetS group might be a contributing factor to the larger proportion of older patients in this cohort.
Our transcriptome data analysis of intestinal polyp samples from the metabolic syndrome (MetS) and ordinary polyp (Ord) groups revealed marked differences in the process of metaphase chromosome segregation, suggesting a potential role in the cancerous transformation of intestinal polyps. Gene Ontology (GO) analysis highlighted variations in key cellular components, including the spindle, spindle pole, and kinetochore (as shown in Fig. 2b), all of which are integral to chromosome segregation. Additionally, the data indicated distinct differences in the Biological Process and Molecular Function categories, further suggesting divergent mechanisms in chromosome division between the two groups.
Chromosomal missegregation can lead to genomic rearrangements encompassing seven primary types of structural aberrations: translocations, insertions, deletions, and complex recombination events often associated with chromosomal mutations through classical non-homologous end joining [44]. These structural aberrations are commonly seen in colorectal cancer (CRC) with chromosome instability, a feature present in approximately 80% to 85% of CRC cases [45]. Additionally, the missegregation of chromosomes can induce DNA damage [46] and the formation of micronuclei [47]. These micronuclei can then trigger a cascade of carcinogenic events, including further DNA damage [48,49], chromothripsis (a phenomenon of extensive chromosomal shattering and rearrangement) [50], and complex genomic rearrangements [44], further exacerbating the risk of cancer development.
In the majority of CRC cases featuring chromosome instability (CIN), there is a notable activation of the Wnt signaling pathway [36]. This observation is corroborated by our study’s KEGG pathway enrichment analysis, which revealed that the differentially expressed genes (DEGs) in intestinal polyps from both MetS and Ord groups are implicated in the Wnt signaling pathway (Fig. 1d), as depicted in Fig. 1d. Activation of the Wnt pathway leads to the increased transcriptional activity of β-Catenin in the nucleus, resulting in the ongoing activation of genes that play a pivotal role in the development of cancer, including VEGF, MYC, and CCND1 [51,52]. This evidence underscores the critical role of the Wnt pathway in the pathogenesis of CRC, particularly in cases associated with CIN.
A key characteristic of cancer development is uncontrolled cell proliferation, which often results from a disrupted cell cycle. Our study’s KEGG pathway enrichment analysis highlights that the DEGs related to the cell cycle were significantly distinct between the MetS and Ord groups, as shown in Figs. 1d and 2c. These DEGs were also linked to the p53 signaling pathway, a critical regulator of the cell cycle (Figs. 1d, 2c). Given the patterns observed in the transcriptome data, it suggests a notable difference in the risk of polyp progression to CRC between the two patient groups. This increased risk may stem from errors in chromosome segregation during mitosis, underscoring the importance of genomic stability in the prevention of CRC.
Analysis of the pathological stages in our study revealed a notable trend: the proteins FN1, TGF-β3, and PCP4 showed increasing expression levels correlating with the progression of CRC, as depicted in Fig. 3a and detailed in Table 2. These proteins are known to facilitate tumor metastasis and invasion and are implicated in CRC development [53–55]. However, our immunohistochemical analysis did not find a significant difference in the expression levels of these proteins between the metabolic syndrome (MetS) and ordinary polyp (Ord) groups, as illustrated in Figs. 4b–4d. This observation aligns with the typical progression of CRC, where invasive and metastatic characteristics are more pronounced in advanced stages of the disease. Since the polyps in our study had not yet progressed to CRC, it is reasonable that the levels of these proteins, which are associated with tumor metastasis and invasion, were not excessively elevated.
Our study’s trend analysis indicated that OLFM1 expression was highest in the early stages of CRC and displayed a general decreasing trend with the disease’s progression, as shown in Fig. 3a and Table 2. The role of OLFM1 in tumors [56–59], including CRC, is not extensively understood, with only a handful of omics studies mentioning its involvement. Particularly noteworthy is research indicating that the down-regulation of OLFM1 enhances the proliferative abilities of CRC cells in vitro, an effect linked to the activation of the non-classical NF-κB signaling pathway [60]. Our immunohistochemical findings corroborate this, revealing significantly lower OLFM1 expression in the metabolic syndrome (MetS) group compared to the ordinary polyp (Ord) group (Fig. 4a), aligning with our transcriptome data. Moreover, experiments demonstrated that OLFM1 knockdown notably increased the proliferation and migration of human intestinal polyp epithelial cells (Fig. 5), as evidenced in Fig. 5. These observations suggest a crucial role for OLFM1 in the transition from intestinal polyps to CRC.
An intriguing aspect of this study is the recent findings on adipose-derived mesenchymal stem cells, which indicated that extracellular vesicles secreted by MetS-derived cells can promote the nuclear expression of NF-κB in target cells [61]. Given that NF-κB is a key transcription factor regulating a range of cell cycle proteins, the down-regulation of OLFM1 in MetS-associated intestinal polyps could potentially impact mitosis [62]. The involvement of exosomes and the NF-κB pathway in this context opens up new avenues for understanding how MetS might contribute to the advancement of CRC. Although some critical evidence is still lacking, these findings provide a promising direction for future research in this area. Currently, the majority of research on metabolic syndrome and CRC primarily addresses their incidence and epidemiological links [21–23]. Although the relationship between insulin resistance, a component of MetS, and CRC has been more thoroughly investigated, the precise molecular mechanisms involved remain largely unexplored [13,63].
The age factor of intestinal polyp sample providers is a limiting factor in this research, due to the uncontrollable nature of clinical sample collection, which makes it challenging to gather a large number of samples with consistent ages. Advanced age may simultaneously be a risk factor for both metabolic diseases and CRC, potentially influencing the interpretation of experimental results. However, recent investigations have established a close correlation between metabolic diseases and the onset of CRC [16,64], supporting the inferences of this study. Additionally, this research does not elucidate how low OLFM1 expression, induced by intestinal polyps concurrent with metabolic diseases, triggers the transformation of intestinal polyps into CRC. Although several hypotheses are proposed in this study, further verification and mechanistic exploration are required in animal models, such as inducing intestinal polyps to cause downregulation of OLFM1 expression, investigating how OLFM1 downregulation leads to the formation of CRC, and exploring related mechanisms. This aspect is intriguing, yet it necessitates further scientific investment.
Our study contributes to this field by demonstrating a decrease in OLFM1 protein expression in intestinal polyps associated with MetS. This reduction in OLFM1 may have significant implications for mitotic processes within these polyps. In the context of MetS, the altered metabolic environment, coupled with reduced OLFM1 expression, appears to influence the behavior of exosomes and potentially activates the NF-κB signaling pathway. While there are still gaps in our understanding, particularly regarding the direct molecular pathways involved, our findings offer a novel perspective on how MetS may facilitate the progression of CRC. This new direction in research could prove pivotal in fully elucidating the complex interactions between MetS and CRC development.
Our research uncovers noteworthy disparities in gene expression and cellular pathways between intestinal polyps in patients with metabolic syndrome (MetS) and those in non-MetS individuals. These differences suggest an elevated risk of polyp progression to colorectal cancer (CRC) in the MetS group. Specifically, the decreased expression of OLFM1 in MetS-associated intestinal polyps emerges as a critical factor potentially influencing mitotic regulation. The alteration of OLFM1 expression seems to promote cell migration and proliferation in intestinal polyps, underscoring a potentially significant role in the progression of CRC. These insights offer a fresh perspective on the impact of MetS on CRC development. Future research is necessary to delve deeper into the specific molecular mechanisms at play and to assess the implications of these findings for both diagnostic and therapeutic strategies in the context of CRC.
Acknowledgement: A preprint [1] has previously been published on the Research Square platform with the DOI number https://doi.org/10.21203/rs.3.rs-2336031/v1.
Funding Statement: This work was supported by Hospital Incubation Fund of the First Affiliated Hospital of Chongqing Medical and Pharmaceutical College (No. 201704).
Author Contributions: The authors confirm contribution to the paper as follows: conceptualization, data curation and project administration: Shan Ou; formal analysis: Qinglan Liu; resources: Jie Yao; investigation: Yun Xu and Tianwen Yang; methodology and supervision: Shan Ou and Qinglan Liu; validation: Yun Xu and Tianwen Yang; visualization: Xiu Yuan, Wei Chen and Xin Zuo; writing-original draft: Shan Ou and Yun Xu; writing-review & editing: Jie Yao and Peng Shi. All authors reviewed the results and approved the final version of the manuscript.
Availability of Data and Materials: The datasets used during the current study are available through SRA Series accession number PRJNA915670 (https://dataview.ncbi.nlm.nih.gov/object/PRJNA915670?reviewer=mvl3gcuklag6ronvav092ntrs5).
Ethics Approval: This study was conducted in accordance with the principles outlined in the Declaration of Helsinki. Ethical approval for the research was obtained from the Ethics Committee of The First Affiliated Hospital of Chongqing Medical and Pharmaceutical College (Date 2021/No. 8). Written informed consent was obtained from all participants before entering the study.
Conflicts of Interest: The authors declare no conflicts of interest.
References
1. Bettington M, Walker N, Clouston A, Brown I, Leggett B, Whitehall V. The serrated pathway to colorectal carcinoma: current concepts and challenges. Histopathol. 2013;62(3):367–86. doi:10.1111/his.12055 [Google Scholar] [PubMed] [CrossRef]
2. IJspeert JE, Vermeulen L, Meijer GA, Dekker E. Serrated neoplasia-role in colorectal carcinogenesis and clinical implications. Nat Rev Gastroenterol Hepatol. 2015;12(7):401–9. doi:10.1038/nrgastro.2015.73 [Google Scholar] [PubMed] [CrossRef]
3. East JE, Saunders BP, Jass JR. Sporadic and syndromic hyperplastic polyps and serrated adenomas of the colon: classification, molecular genetics, natural history, and clinical management. Gastroenterol Clin North Am. 2008;37(1):25–46. doi:10.1016/j.gtc.2007.12.014 [Google Scholar] [PubMed] [CrossRef]
4. Kaminski MF, Regula J, Kraszewska E, Polkowski M, Wojciechowska U, Didkowska J, et al. Quality indicators for colonoscopy and the risk of interval cancer. N Engl J Med. 2010;362(19):1795–803. doi:10.1056/NEJMoa0907667 [Google Scholar] [PubMed] [CrossRef]
5. Corley DA, Levin TR, Doubeni CA. Adenoma detection rate and risk of colorectal cancer and death. N Engl J Med. 2014;370(26):2541. doi:10.1056/NEJMc1405329 [Google Scholar] [CrossRef]
6. Zhao S, Wang S, Pan P, Xia T, Chang X, Yang X, et al. Magnitude, risk factors, and factors associated with adenoma miss rate of tandem colonoscopy: a systematic review and meta-analysis. Gastroenterol. 2019;156(6):1661–74. doi:10.1053/j.gastro.2019.01.260 [Google Scholar] [PubMed] [CrossRef]
7. Anderson R, Burr NE, Valori R. Causes of post-colonoscopy colorectal cancers based on world endoscopy organization system of analysis. Gastroenterol. 2020;158(5):1287–99. doi:10.1053/j.gastro.2019.12.031 [Google Scholar] [PubMed] [CrossRef]
8. Freeman HJ. Early stage colon cancer. World J Gastroenterol. 2013;19(46):8468–73. doi:10.3748/wjg.v19.i46.8468 [Google Scholar] [PubMed] [CrossRef]
9. Bray F, Ferlay J, Soerjomataram I, Siegel RL, Torre LA, Jemal A. Global cancer statistics 2018: gLOBOCAN estimates of incidence and mortality worldwide for 36 cancers in 185 countries. CA Cancer J Clin. 2018;68(6):394–424. doi:10.3322/caac.21492 [Google Scholar] [PubMed] [CrossRef]
10. Santiago CN, Rifkin S, Drewes J, Mullin G, Spence E, Hylind LM, et al. Self-reported metabolic risk factor associations with adenomatous, sessile serrated, and synchronous adenomatous and sessile serrated polyps. Cancer Prev Res. 2021;14(7):697–708. doi:10.1158/1940-6207.CAPR-20-0664 [Google Scholar] [PubMed] [CrossRef]
11. Tal S, Melzer E, Chsherbakov T, Malnick S. Metabolic syndrome is associated with increased prevalence of advanced colorectal polyps. J Nutr Health Aging. 2014;18(1):22–5. doi:10.1007/s12603-013-0360-9 [Google Scholar] [PubMed] [CrossRef]
12. Xie C, Wen P, Su J, Li Q, Ren Y, Liu Y, et al. Elevated serum triglyceride and low-density lipoprotein cholesterol promotes the formation of colorectal polyps. BMC Gastroenterol. 2019;19(1):195. doi:10.1186/s12876-019-1115-9 [Google Scholar] [PubMed] [CrossRef]
13. Suchanek S, Grega T, Ngo O, Vojtechova G, Majek O, Minarikova P, et al. How significant is the association between metabolic syndrome and prevalence of colorectal neoplasia? World J Gastroenterol. 2016;22(36):8103–11. doi:10.3748/wjg.v22.i36.8103 [Google Scholar] [PubMed] [CrossRef]
14. Ling S, Brown K, Miksza JK, Howells L, Morrison A, Issa E, et al. Association of type 2 diabetes with cancer: a meta-analysis with bias analysis for unmeasured confounding in 151 cohorts comprising 32 million people. Diabetes Care. 2020;43(9):2313–22. doi:10.2337/dc20-0204 [Google Scholar] [PubMed] [CrossRef]
15. Singh S, Earle CC, Bae SJ, Fischer HD, Yun L, Austin PC, et al. Incidence of diabetes in colorectal cancer survivors. J Natl Cancer Inst. 2016;108(6):v402. doi:10.1093/jnci/djv402 [Google Scholar] [PubMed] [CrossRef]
16. Hawkins ML, Blackburn BE, Rowe K, Snyder J, Deshmukh VG, Newman M, et al. Endocrine and metabolic diseases among colorectal cancer survivors in a population-based cohort. J Natl Cancer Inst. 2020;112(1):78–86. doi:10.1093/jnci/djz040 [Google Scholar] [PubMed] [CrossRef]
17. Larsson SC, Wolk A. Obesity and colon and rectal cancer risk: a meta-analysis of prospective studies. AM J Clin Nutr. 2007;86(3):556–65. doi:10.1093/ajcn/86.3.556 [Google Scholar] [PubMed] [CrossRef]
18. Kyrgiou M, Kalliala I, Markozannes G, Gunter MJ, Paraskevaidis E, Gabra H, et al. Adiposity and cancer at major anatomical sites: umbrella review of the literature. BMJ. 2017;356:j477. doi:10.1136/bmj.j477 [Google Scholar] [PubMed] [CrossRef]
19. Wang JY, Li ZT, Zhu YM, Wang WC, Ma Y, Liu YL. Utility of the Asia-Pacific colorectal screening scoring system and the presence of metabolic syndrome components in screening for sporadic colorectal cancer. World J Gastroenterol. 2014;20(32):11394–9. doi:10.3748/wjg.v20.i32.11394 [Google Scholar] [PubMed] [CrossRef]
20. Kaminski MF, Polkowski M, Kraszewska E, Rupinski M, Butruk E, Regula J. A score to estimate the likelihood of detecting advanced colorectal neoplasia at colonoscopy. Gut. 2014;63(7):1112–9. doi:10.1136/gutjnl-2013-304965 [Google Scholar] [PubMed] [CrossRef]
21. Chen H, Zheng X, Zong X, Li Z, Li N, Hur J, et al. Metabolic syndrome, metabolic comorbid conditions and risk of early-onset colorectal cancer. Gut. 2021;70(6):1147–54. doi:10.1136/gutjnl-2020-321661 [Google Scholar] [PubMed] [CrossRef]
22. Mikolasevic I, Orlic L, Stimac D, Hrstic I, Jakopcic I, Milic S. Non-alcoholic fatty liver disease and colorectal cancer. Postgrad Med J. 2017;93(1097):153–8. doi:10.1136/postgradmedj-2016-134383 [Google Scholar] [PubMed] [CrossRef]
23. Lee J, Lee KS, Kim H, Jeong H, Choi MJ, Yoo HW, et al. The relationship between metabolic syndrome and the incidence of colorectal cancer. Environ Health Prev Med. 2020;25(1):6. doi:10.1186/s12199-020-00845-w [Google Scholar] [PubMed] [CrossRef]
24. Fang X, Wei J, He X, Lian J, Han D, An P, et al. Quantitative association between body mass index and the risk of cancer: a global meta-analysis of prospective cohort studies. Int J Cancer. 2018;143(7):1595–603. doi:10.1002/ijc.31553 [Google Scholar] [PubMed] [CrossRef]
25. Bardou M, Barkun AN, Martel M. Obesity and colorectal cancer. Gut. 2013;62(6):933–47. doi:10.1136/gutjnl-2013-304701 [Google Scholar] [PubMed] [CrossRef]
26. Vulcan A, Manjer J, Ohlsson B. High blood glucose levels are associated with higher risk of colon cancer in men: a cohort study. BMC Cancer. 2017;17(1):842. doi:10.1186/s12885-017-3874-4 [Google Scholar] [PubMed] [CrossRef]
27. Barber TM, Kyrou I, Randeva HS, Weickert MO. Mechanisms of insulin resistance at the crossroad of obesity with associated metabolic abnormalities and cognitive dysfunction. Int J Mol Sci. 2021;22(2):546. doi:10.3390/ijms22020546 [Google Scholar] [PubMed] [CrossRef]
28. Gonzalez H, Hagerling C, Werb Z. Roles of the immune system in cancer: from tumor initiation to metastatic progression. Genes Dev. 2018;32(19–20):1267–84. doi:10.1101/gad.314617.118 [Google Scholar] [PubMed] [CrossRef]
29. Shen YM, Arbman G, Olsson B, Sun XF. Overexpression of GLUT1 in colorectal cancer is independently associated with poor prognosis. Int J Biol Markers. 2011;26(3):166–72. doi:10.5301/JBM.2011.8550 [Google Scholar] [PubMed] [CrossRef]
30. Ma YS, Yang IP, Tsai HL, Huang CW, Juo SH, Wang JY. High glucose modulates antiproliferative effect and cytotoxicity of 5-fluorouracil in human colon cancer cells. DNA Cell Biol. 2014;33(2):64–72. doi:10.1089/dna.2013.2161 [Google Scholar] [PubMed] [CrossRef]
31. Brownlee M. The pathobiology of diabetic complications: a unifying mechanism. Diabetes. 2005;54(6):1615–25. doi:10.2337/diabetes.54.6.1615 [Google Scholar] [PubMed] [CrossRef]
32. Fardini Y, Dehennaut V, Lefebvre T, Issad T. O-GlcNAcylation: a new cancer hallmark? Front Endocrinol. 2013;4:99. doi:10.3389/fendo.2013.00099 [Google Scholar] [PubMed] [CrossRef]
33. Srinivas US, Tan B, Vellayappan BA, Jeyasekharan AD. ROS and the DNA damage response in cancer. Redox Biol. 2019;25:101084. doi:10.1016/j.redox.2018.101084 [Google Scholar] [PubMed] [CrossRef]
34. Moloney JN, Cotter TG. ROS signalling in the biology of cancer. Semin Cell Dev Biol. 2018;80:50–64. doi:10.1016/j.semcdb.2017.05.023 [Google Scholar] [PubMed] [CrossRef]
35. de Almeida A, de Almeida RM, Dantas SH, de Lima SS, de Oliveira J, de Lourdes AADA, et al. Unveiling the role of inflammation and oxidative stress on age-related cardiovascular diseases. Oxid Med Cell Longev. 2020;2020:1954398. doi:10.1155/2020/1954398 [Google Scholar] [PubMed] [CrossRef]
36. The Cancer Genome Atlas NetworkComprehensive molecular characterization of human colon and rectal cancer. Nature. 2012;487(7407):330–7. doi:10.1038/nature11252 [Google Scholar] [PubMed] [CrossRef]
37. Vigneri PG, Tirro E, Pennisi MS, Massimino M, Stella S, Romano C, et al. The insulin/IGF system in colorectal cancer development and resistance to therapy. Front Oncol. 2015;5:230. doi:10.3389/fonc.2015.00230 [Google Scholar] [PubMed] [CrossRef]
38. Djiogue S, Nwabo KA, Vecchio L, Kipanyula MJ, Farahna M, Aldebasi Y, et al. Insulin resistance and cancer: the role of insulin and IGFs. Endocr Relat Cancer. 2013;20(1):R1–17. doi:10.1530/ERC-12-0324 [Google Scholar] [PubMed] [CrossRef]
39. Sun J, Jin T. Both Wnt and mTOR signaling pathways are involved in insulin-stimulated proto-oncogene expression in intestinal cells. Cell Signal. 2008;20(1):219–29. doi:10.1016/j.cellsig.2007.10.010 [Google Scholar] [PubMed] [CrossRef]
40. Jain S, Ghanghas P, Rana C, Sanyal SN. Role of GSK-3β in regulation of canonical Wnt/β-catenin signaling and PI3-K/Akt oncogenic pathway in colon cancer. Cancer Invest. 2017;35(7):473–83. doi:10.1080/07357907.2017.1337783 [Google Scholar] [PubMed] [CrossRef]
41. Kasprzak A. Insulin-like growth factor 1 (IGF-1) signaling in glucose metabolism in colorectal cancer. Int J Mol Sci. 2021;22(12):6434. doi:10.3390/ijms22126434 [Google Scholar] [PubMed] [CrossRef]
42. Veisaga ML, Ahumada M, Soriano S, Acuna L, Zhang W, Leung I, et al. Anti-proliferative effect of Annona extracts on breast cancer cells. Biocell. 2023;47(8):1835–52. doi:10.32604/biocell.2023.029076 [Google Scholar] [CrossRef]
43. Loke SS, Chuah SK. Factors associated with colorectal polyps in middle-aged and elderly populations. Int J Environ Res Public Health. 2022;19(12):7543. doi:10.3390/ijerph19127543 [Google Scholar] [PubMed] [CrossRef]
44. Ly P, Brunner SF, Shoshani O, Kim DH, Lan W, Pyntikova T, et al. Chromosome segregation errors generate a diverse spectrum of simple and complex genomic rearrangements. Nat Genet. 2019;51(4):705–15. doi:10.1038/s41588-019-0360-8 [Google Scholar] [PubMed] [CrossRef]
45. Grady WM, Carethers JM. Genomic and epigenetic instability in colorectal cancer pathogenesis. Gastroenterol. 2008;135(4):1079–99. doi:10.1053/j.gastro.2008.07.076 [Google Scholar] [PubMed] [CrossRef]
46. Leibowitz ML, Papathanasiou S, Doerfler PA, Blaine LJ, Sun L, Yao Y, et al. Chromothripsis as an on-target consequence of CRISPR-Cas9 genome editing. Nat Genet. 2021;53(6):895–905. doi:10.1038/s41588-021-00838-7 [Google Scholar] [PubMed] [CrossRef]
47. Thompson SL, Compton DA. Chromosome missegregation in human cells arises through specific types of kinetochore-microtubule attachment errors. Proc Natl Acad Sci USA. 2011;108(44):17974–8. doi:10.1073/pnas.1109720108 [Google Scholar] [PubMed] [CrossRef]
48. Ly P, Cleveland DW. Rebuilding chromosomes after catastrophe: emerging mechanisms of chromothripsis. Trends Cell Biol. 2017;27(12):917–30. doi:10.1016/j.tcb.2017.08.005 [Google Scholar] [PubMed] [CrossRef]
49. Mohr L, Toufektchan E, von Morgen P, Chu K, Kapoor A, Maciejowski J. ER-directed TREX1 limits cGAS activation at micronuclei. Mol Cell. 2021;81(4):724–38. doi:10.1016/j.molcel.2020.12.037 [Google Scholar] [PubMed] [CrossRef]
50. Zhang CZ, Spektor A, Cornils H, Francis JM, Jackson EK, Liu S, et al. Chromothripsis from DNA damage in micronuclei. Nat. 2015;522(7555):179–84. doi:10.1038/nature14493 [Google Scholar] [PubMed] [CrossRef]
51. Bian J, Dannappel M, Wan C, Firestein R. Transcriptional regulation of Wnt/β-catenin pathway in colorectal cancer. Cells. 2020;9(9):2125. doi:10.3390/cells9092125 [Google Scholar] [PubMed] [CrossRef]
52. Mann B, Gelos M, Siedow A, Hanski ML, Gratchev A, Ilyas M, et al. Target genes of β-catenin-T cell-factor/lymphoid-enhancer-factor signaling in human colorectal carcinomas. Proc Natl Acad Sci USA. 1999;96(4):1603–8. doi:10.1073/pnas.96.4.1603 [Google Scholar] [PubMed] [CrossRef]
53. Cai X, Liu C, Zhang TN, Zhu YW, Dong X, Xue P. Down-regulation of FN1 inhibits colorectal carcinogenesis by suppressing proliferation, migration, and invasion. J Cell Biochem. 2018;119(6):4717–28. doi:10.1002/jcb.26651 [Google Scholar] [PubMed] [CrossRef]
54. Liu YP, Zhu HF, Liu DL, Hu ZY, Li SN, Kan HP, et al. DcR3 induces epithelial-mesenchymal transition through activation of the TGF-β3/SMAD signaling pathway in CRC. Oncotarget. 2016;7(47):77306–18. doi:10.18632/oncotarget.12639 [Google Scholar] [PubMed] [CrossRef]
55. Yoshimura T, Hamada T, Hijioka H, Souda M, Hatanaka K, Yoshioka T, et al. PCP4/PEP19 promotes migration, invasion and adhesion in human breast cancer MCF-7 and T47D cells. Oncotarget. 2016;7(31):49065–74. doi:10.18632/oncotarget.7529 [Google Scholar] [PubMed] [CrossRef]
56. Tong DL, Boocock DJ, Dhondalay GK, Lemetre C, Ball GR. Artificial neural network inference (ANNIa study on gene-gene interaction for biomarkers in childhood sarcomas. PLoS One. 2014;9(7):e102483. doi:10.1371/journal.pone.0102483 [Google Scholar] [PubMed] [CrossRef]
57. Allander SV, Illei PB, Chen Y, Antonescu CR, Bittner M, Ladanyi M, et al. Expression profiling of synovial sarcoma by cDNA microarrays: association of ERBB2, IGFBP2, and ELF3 with epithelial differentiation. Am J Pathol. 2002;161(5):1587–95. doi:10.1016/S0002-9440(10)64437-9 [Google Scholar] [PubMed] [CrossRef]
58. Alivand MR, Najafi S, Esmaeili S, Rahmanpour D, Zhaleh H, Rahmati Y. Integrative analysis of DNA methylation and gene expression profiles to identify biomarkers of glioblastoma. Cancer Genet. 2021;258–259:135–50. doi:10.1016/j.cancergen.2021.10.008 [Google Scholar] [PubMed] [CrossRef]
59. Wong YF, Cheung TH, Lo KW, Yim SF, Siu NS, Chan SC, et al. Identification of molecular markers and signaling pathway in endometrial cancer in Hong Kong Chinese women by genome-wide gene expression profiling. Oncogene. 2007;26(13):1971–82. doi:10.1038/sj.onc.1209986 [Google Scholar] [PubMed] [CrossRef]
60. Shi W, Ye Z, Zhuang L, Li Y, Shuai W, Zuo Z, et al. Olfactomedin 1 negatively regulates NF-κB signalling and suppresses the growth and metastasis of colorectal cancer cells. J Pathol. 2016;240(3):352–65. doi:10.1002/path.4784 [Google Scholar] [PubMed] [CrossRef]
61. Pawar AS, Eirin A, Tang H, Zhu XY, Lerman A, Lerman LO. Upregulated tumor necrosis factor-alpha transcriptome and proteome in adipose tissue-derived mesenchymal stem cells from pigs with metabolic syndrome. Cytokine. 2020;130(9):155080. doi:10.1016/j.cyto.2020.155080 [Google Scholar] [PubMed] [CrossRef]
62. Ledoux AC, Perkins ND. NF-κB and the cell cycle. Biochem Soc Trans. 2014;42(1):76–81. doi:10.1042/BST20130156 [Google Scholar] [PubMed] [CrossRef]
63. Vekic J, Zeljkovic A, Stefanovic A, Giglio RV, Ciaccio M, Rizzo M. Diabetes and colorectal cancer risk: a new look at molecular mechanisms and potential role of novel antidiabetic agents. Int J Mol Sci. 2021;22(22):12409. doi:10.3390/ijms222212409 [Google Scholar] [PubMed] [CrossRef]
64. Lundqvist E, Myrberg IH, Boman SE, Saraste D, Weibull CE, Landerholm K, et al. Autoimmune and metabolic diseases and the risk of early-onset colorectal cancer, a nationwide nested case-control study. Cancers. 2023;15(3):688. doi:10.3390/cancers15030688 [Google Scholar] [PubMed] [CrossRef]
Cite This Article
 Copyright © 2024 The Author(s). Published by Tech Science Press.
This work is licensed under a Creative Commons Attribution 4.0 International License , which permits unrestricted use, distribution, and reproduction in any medium, provided the original work is properly cited.
 Downloads
 Citation Tools