
 Submit a Paper
 Propose a Special lssue
 Open Access
ARTICLE

Identification of prognostic molecular subtypes and model based on CD8+ T cells for lung adenocarcinoma
1 Internal Medicine-Oncology, Dongguan Songshan Lake Central Hospital, Dongguan, 523326, China
2 Tumor Center, First Dongguan Affiliated Hospital, Guangdong Medical University, Dongguan, 523888, China
* Corresponding Author: HONGMIN CAO. Email:
# Equal Contribution
(This article belongs to the Special Issue: Bioinformatics Study of Diseases)
BIOCELL 2024, 48(3), 473-490. https://doi.org/10.32604/biocell.2024.048946
Received 22 December 2023; Accepted 10 January 2024; Issue published 15 March 2024
 View Full Text
 Download PDF
Abstract
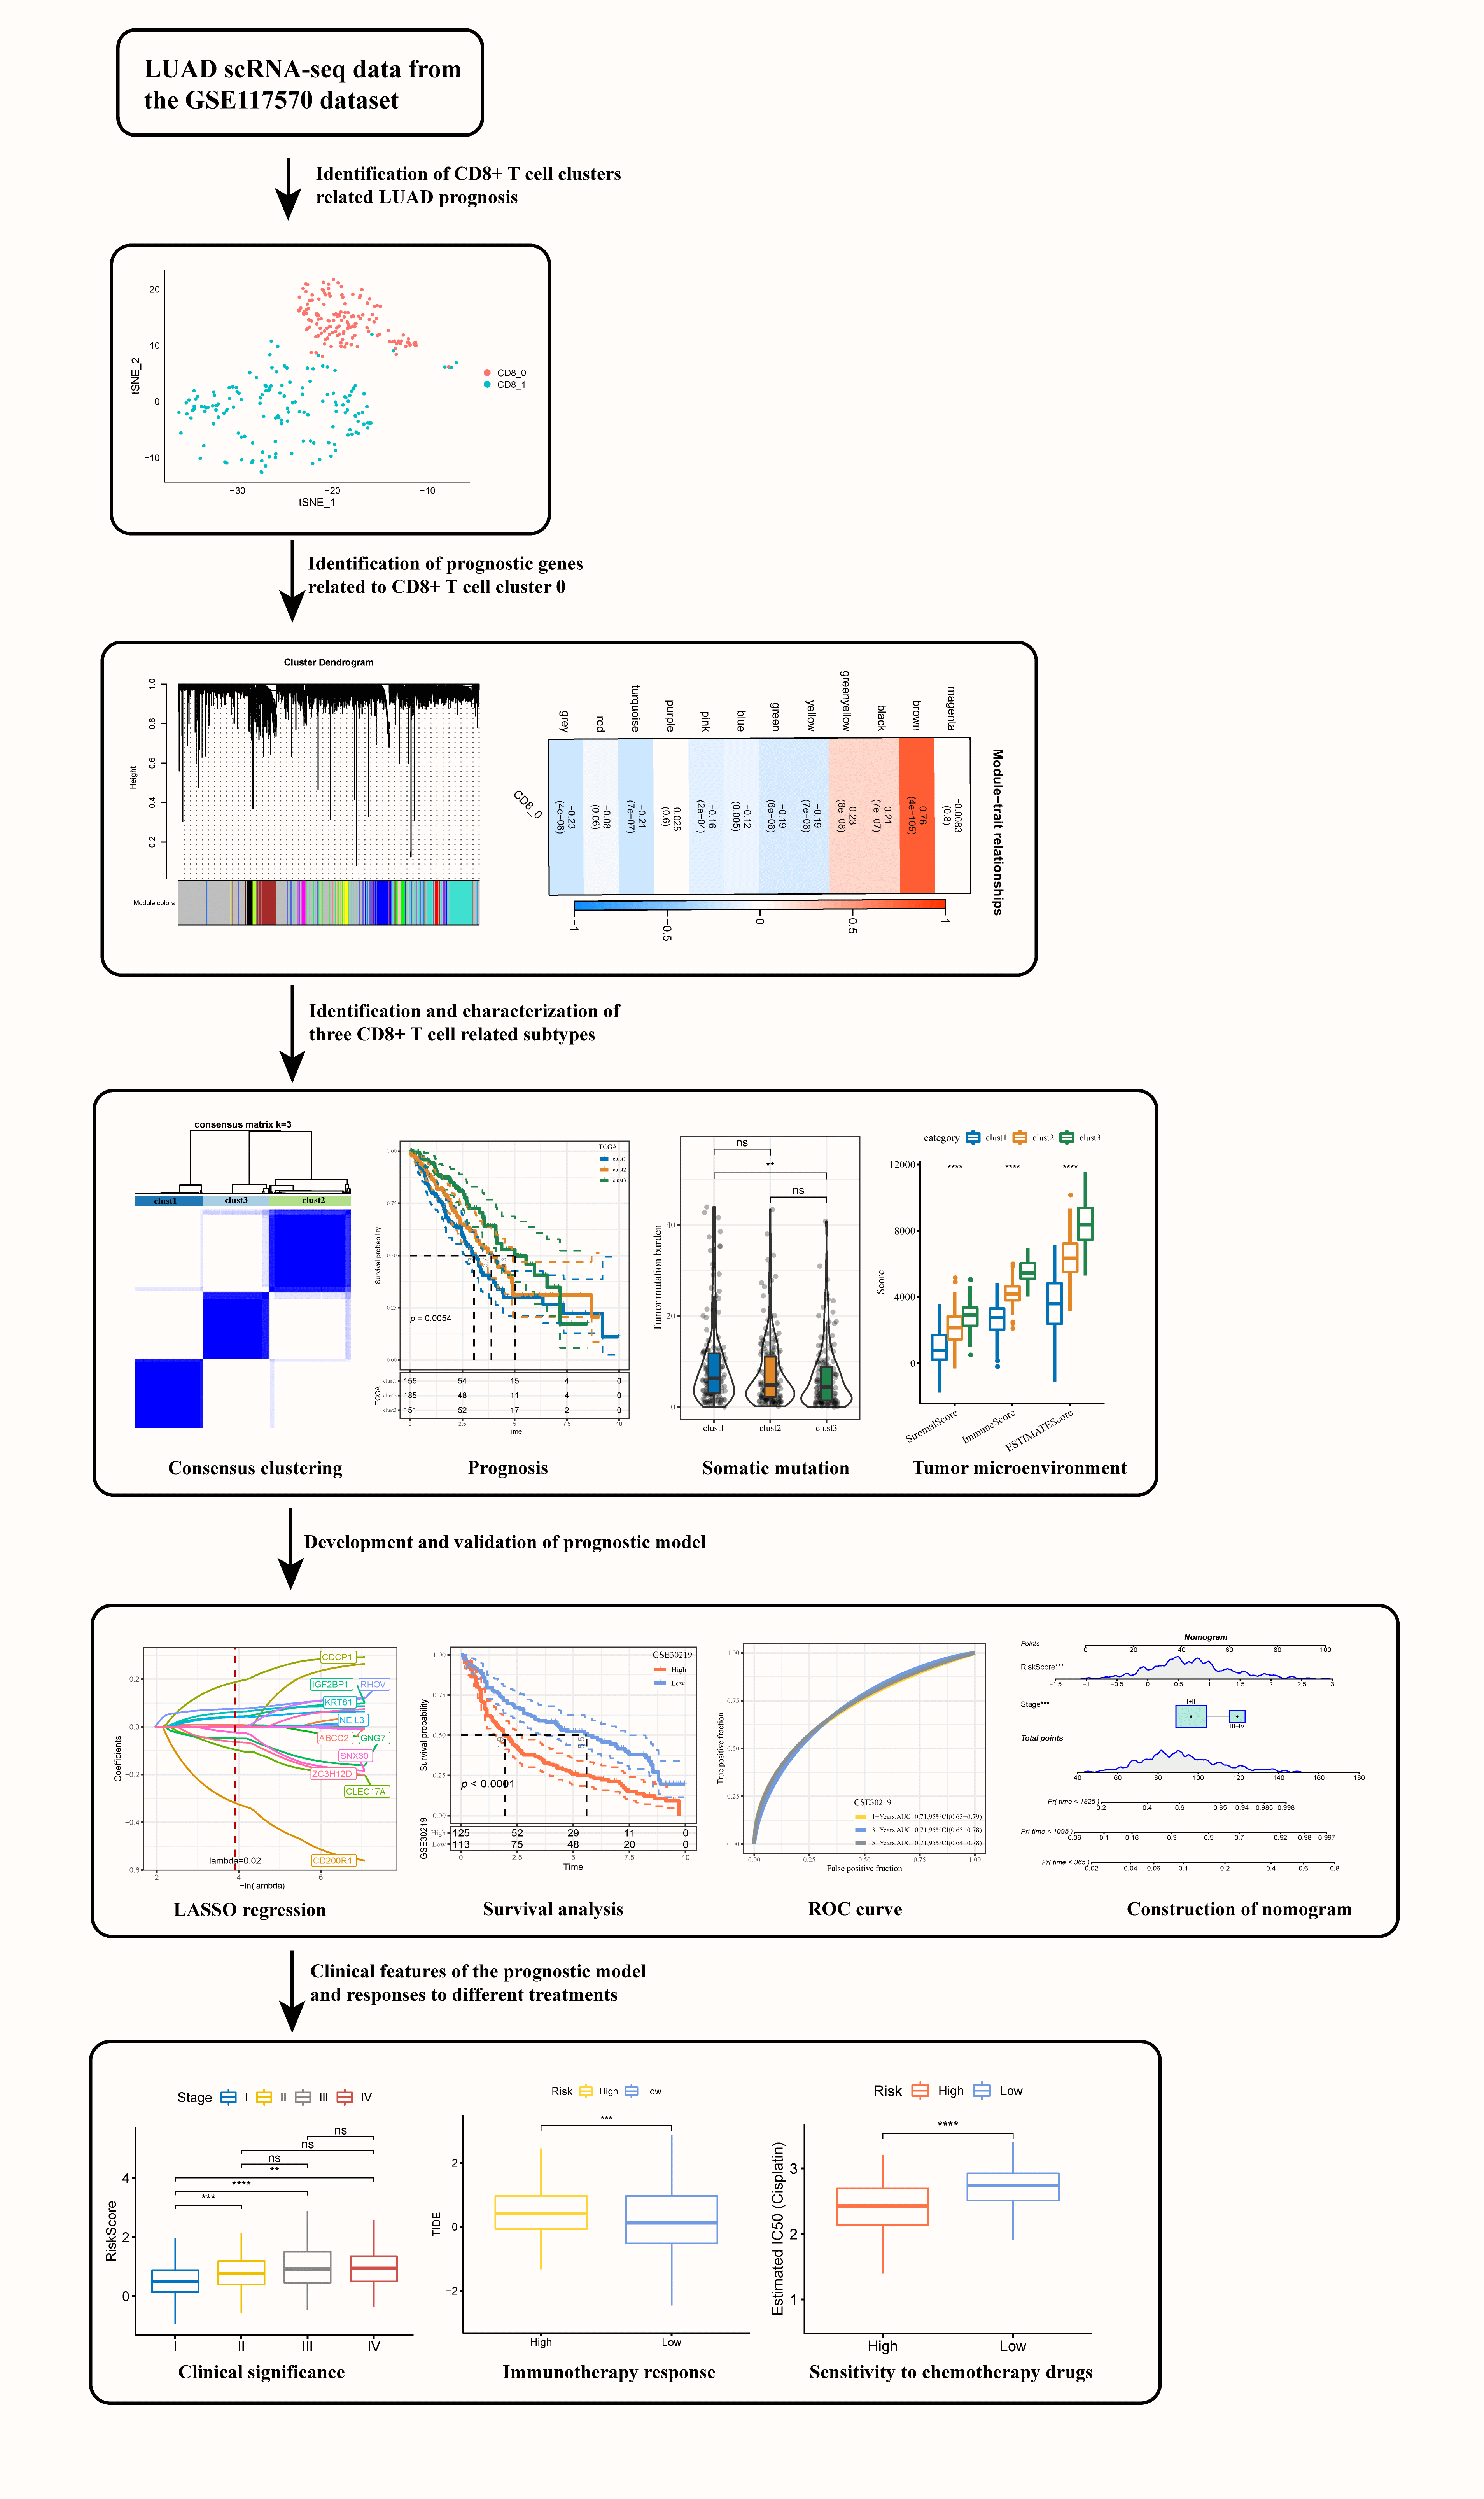
Background: Cytotoxic T lymphocytes (CD8+ T) cells function critically in mediating anti-tumor immune response in cancer patients. Characterizing the specific functions of CD8+ T cells in lung adenocarcinoma (LUAD) could help better understand local anti-tumor immune responses and estimate the effect of immunotherapy. Methods: Gens related to CD8+ T cells were identified by cluster analysis based on the single-cell sequencing data of three LUAD tissues and their paired normal tissues. Weighted gene co-expression network analysis (WGCNA), consensus clustering, differential expression analysis, least absolute shrinkage and selection operator (LASSO) and Cox regression analysis were conducted to classify molecular subtypes for LUAD and to develop a risk model using prognostic genes related to CD8+ T cells. Expression of the genes in the prognostic model, their effects on tumor cell invasion, and interactions with CD8+ T cells were verified by cell experiments. Results: This study defined two LUAD clusters (CD8+ 0 and CD8+ 1) based on CD8+ T cells, with cluster CD8+ 0 being significantly associated with the prognosis of LUAD. Three heterogeneous subtypes (clusters 1, 2, and 3) differing in prognosis, genome mutation events, and immune status were categorized using 42 prognostic genes. A prognostic model created based on 11 significant genes (including CD200R1, CLEC17A, ZC3H12D, GNG7, SNX30, CDCP1, NEIL3, IGF2BP1, RHOV, ABCC2, and KRT81) was able to independently estimate the death risk for patients in different LUAD cohorts. Moreover, the model also showed general applicability in external validation cohorts. Low-risk patients could benefit more from taking immunotherapy and were significantly related to the resistance to anticancer drugs. The results from cell experiments demonstrated that the expression of CD200R1, CLEC17A, ZC3H12D, GNG7, and SNX30 was significantly downregulated, while that of CDCP1, NEIL3, IGF2BP1, RHOV, ABCC2 and KRT81 was upregulated in LUAD cells. Inhibition of CD200R1 greatly increased the invasiveness of the LUAD cells, but inhibiting CDCP1 expression weakened the invasion ability of LUAD cells. Conclusion: This study defined two prognostic CD8+ T cell clusters and classified three heterogeneous molecular subtypes for LUAD. A prognostic model predictive of the potential effects of immunotherapy on LUAD patients was developed.Graphic Abstract
Keywords
Supplementary Material
Supplementary Material FileLung cancer occurs mainly to women aged 60 and older and to men aged 40 and older [1,2]. Lung cancer subtypes are usually divided according to different anatomical locations and cell origins in the lung [3]. LUAD, the most representative histological type of lung cancer, is mainly derived from ATII cells and has specific epidemiological, molecular, and clinical features [4,5]. Women are more likely to have LUAD than men [6]. LUAD is one of the most aggressive tumor types, with an overall survival of shorter than 5 years [7]. Heterogeneity within and between tumors remains a major challenge in LUAD treatment [8]. Study indicates that the interaction between infiltrating immune cells and tumors in tumor microenvironment (TME) has the potential to serve as a guiding principle for developing new therapies for cancer patients [9].
T cells play a critical role in tumorigenesis. Traditional Chinese herbal formulas can effectively inhibit lung cancer growth by promoting T-cell activation [10], suggesting that T cells might be important targets for lung cancer treatment [11]. Cellular immunotherapy targeting T cells offers new opportunities for developing conventional lung cancer therapies [12]. Cytotoxic T lymphocytes (CD8+ T) cells directly participate in anti-tumor cytotoxic response, and their ability to kill malignant cells plays a critical role in cancer immunity [13]. Characterizing the effector function of CD8+ T lymphocytes in infiltrating solid tumors could help mediate local antitumor immune responses and determine their specific role in cancer immunotherapy [14]. Gene signatures related to CD8+ T cells have been increasingly developed and applied to evaluate the prognosis and immunotherapy efficacy in cancers such as breast cancer [15] and head and neck squamous cell carcinoma [16]. However, prognostic models based on CD8+ T cells for lung cancer are yet to be developed.
Single-cell RNA sequencing (scRNA-seq) can reveal rare and complex cell populations and unique changes in each cell type [17]. The present study analyzed multicenter data, including scRNA-seq and bulk RNA-seq, to comprehensively explore CD8+ T cells derived from LUAD and its paired normal tissues. WGCNA, consensus clustering analysis, differential expression analysis, LASSO and Cox regression analyses were employed to screen prognostic genes related to CD8+ T cells, based on which molecular subtypes were classified, and a prognostic model was developed for LUAD patients. The current findings could improve the understanding of the immune status and clinical management of LUAD.
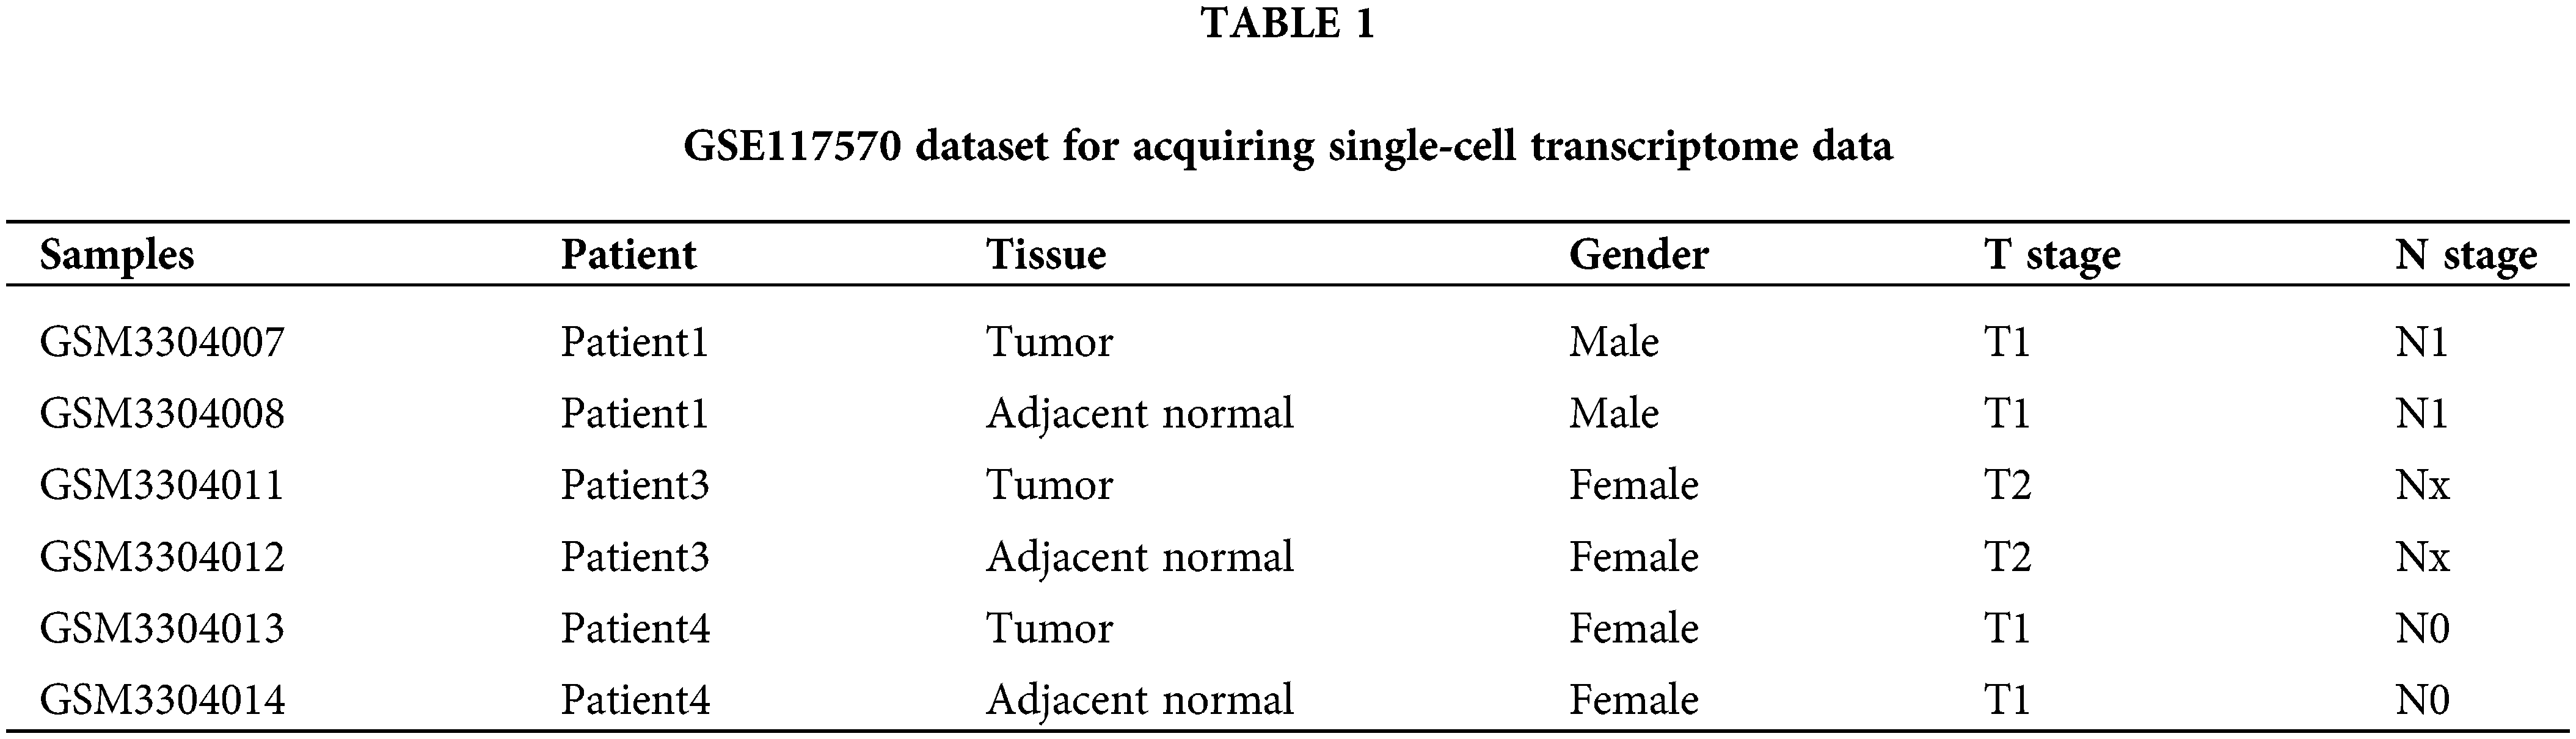
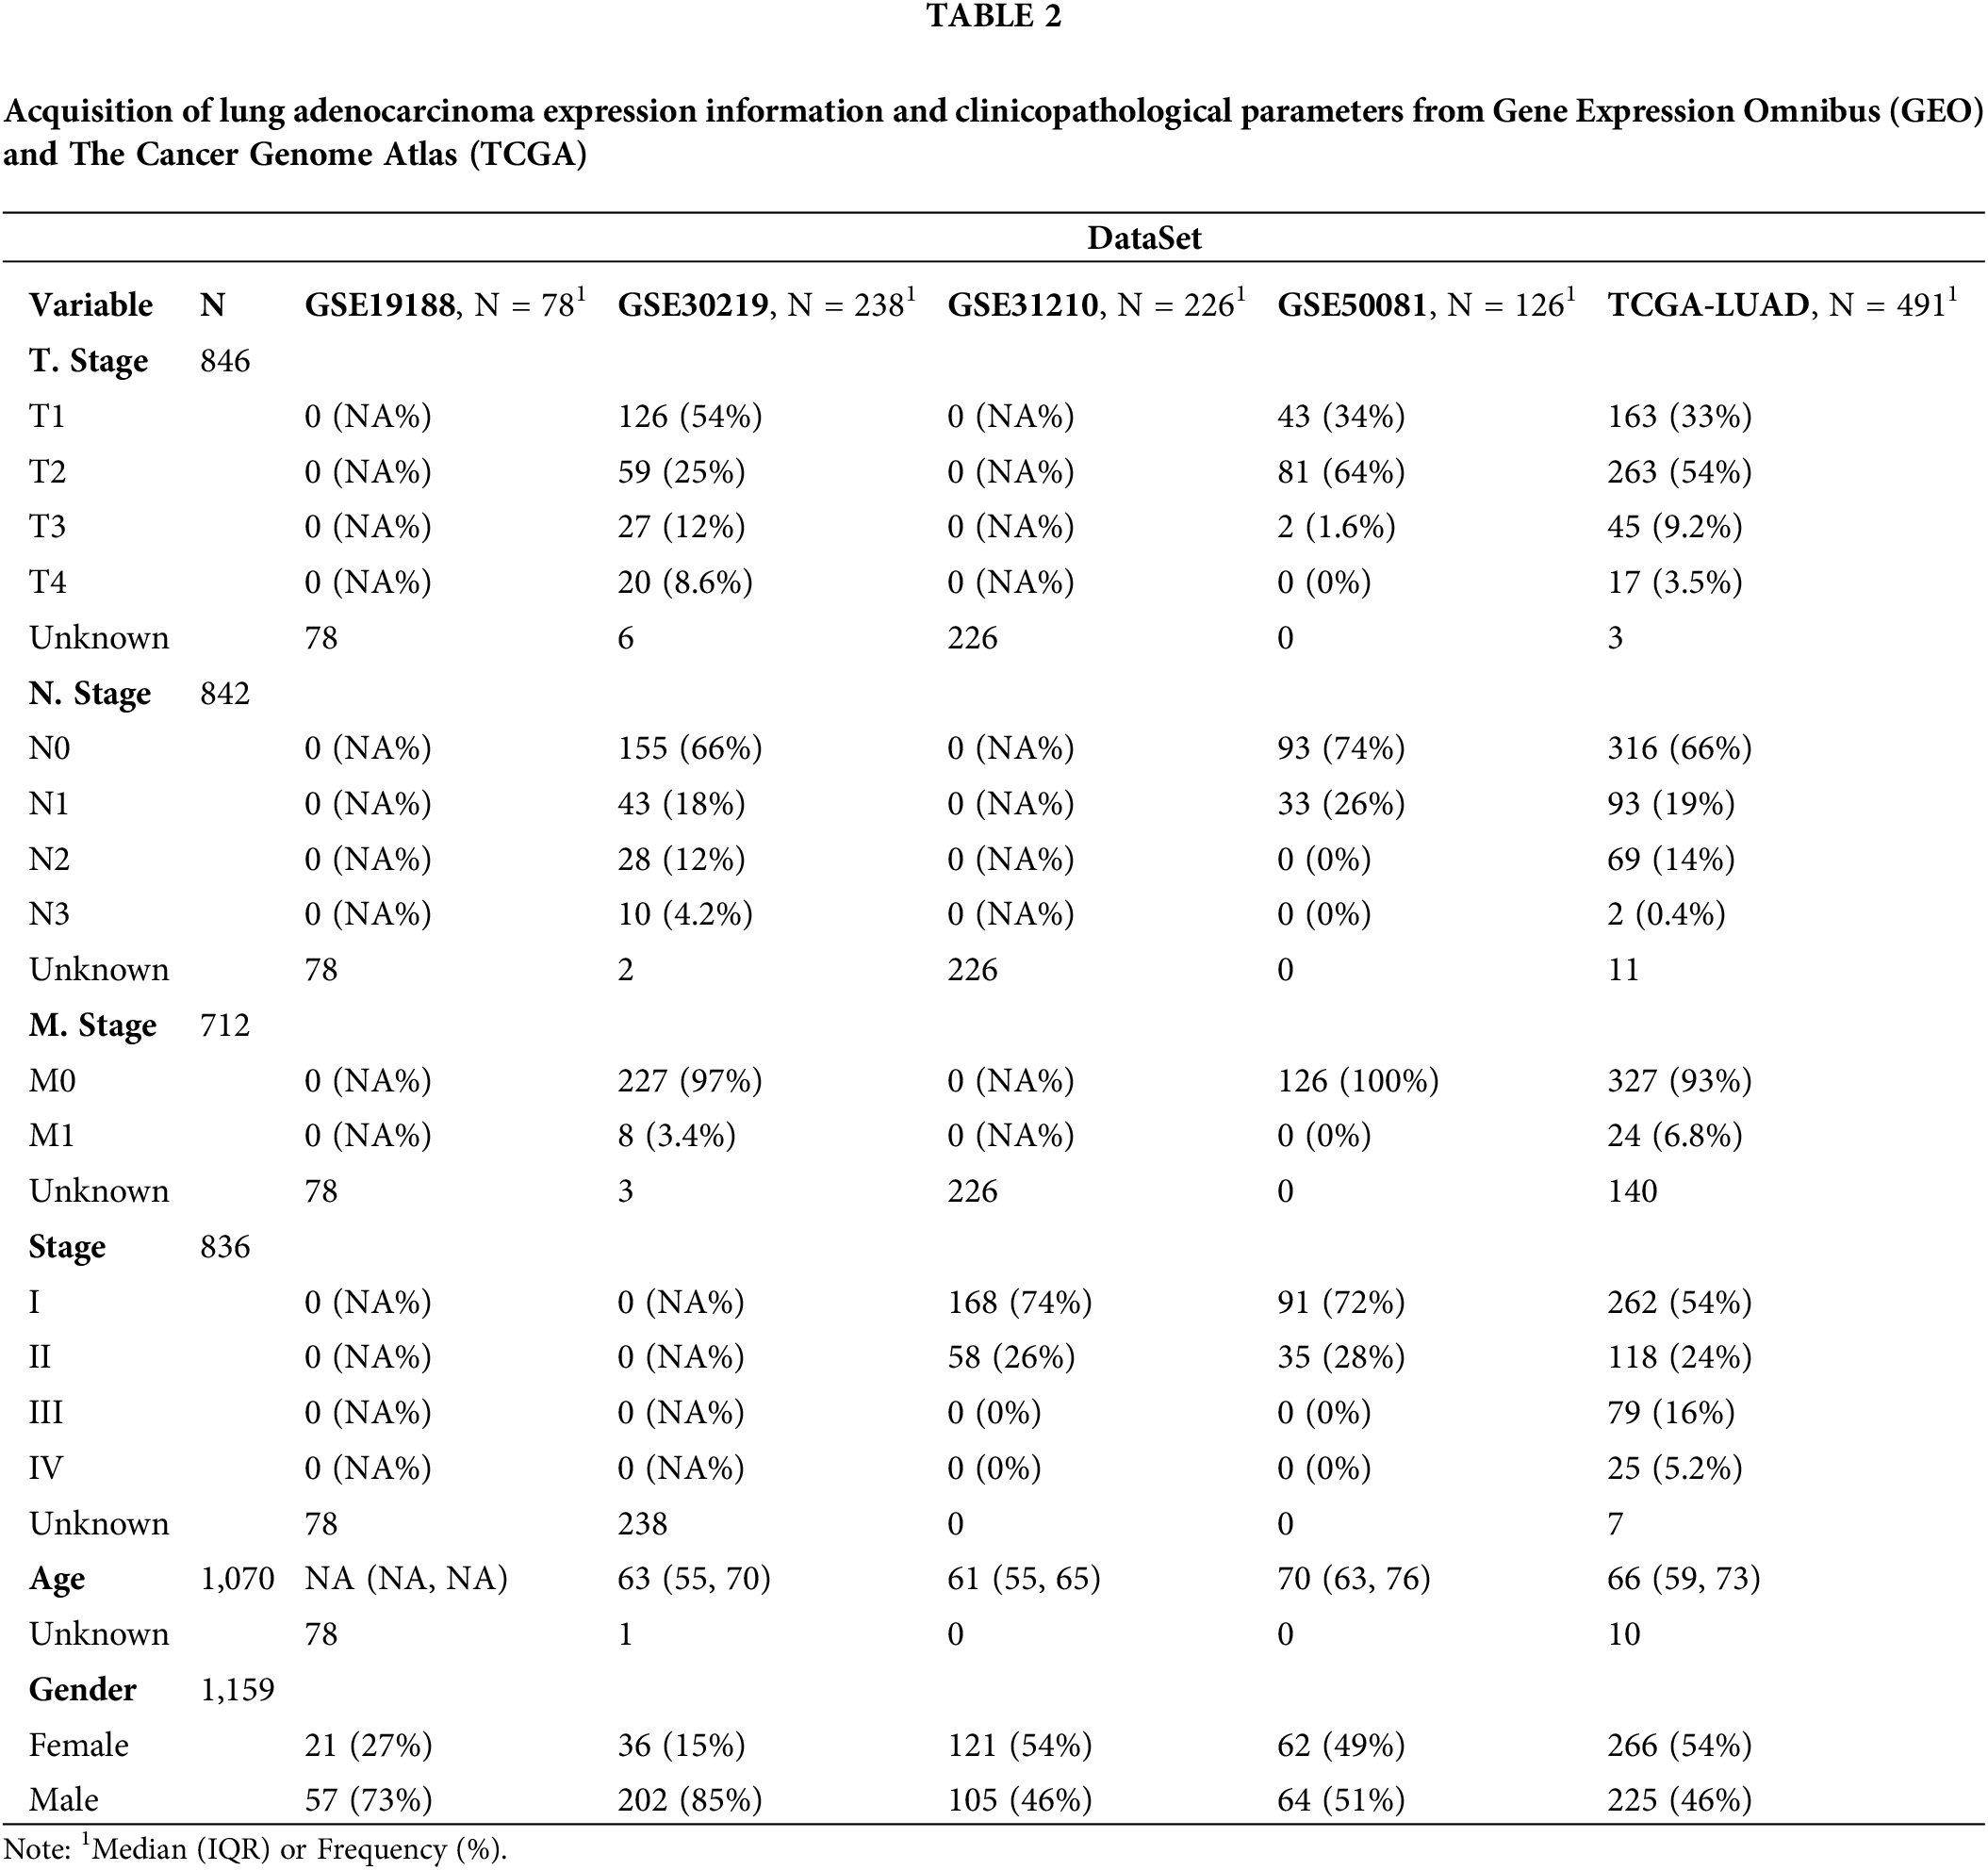
Single-cell transcriptomic profiles of LUAD samples were downloaded from the GSE117570 dataset, which contained single-cell sequencing data of four non-small cell lung cancer (NSCLC) tissues and four paired normal tissues (Table 1). Of the eight tissue samples, three pairs of LUAD tissues and paired normal tissues were the objects of analysis in this study after excluding one pair of lung squamous cell carcinoma and matched normal tissues. The RNA-seq data of LUAD were extracted from Gene Expression Omnibus (GEO) and The Cancer Genome Atlas (TCGA) (Table 2). The samples of the two databases were processed in the same way, and only those with complete survival time and survival time shorter than 10 years were retained. The TCGA database included 491 samples of LUAD and 59 paracancerous tissues. Four GEO datasets analyzed were GSE30219 (n = 238), GSE31210 (n = 226), GSE19188 (n = 78), and GSE50081 (n = 126).
Processing and analysis of scRNA-seq data
R package SeuratR package (version 3.6.3, https://satijalab.org/seurat/) [18] was adopted to process and analyze the scRNA-seq data. Mitochondrial genes were filtered using PercentageFeatureSet function, and cells with mitochondrial genes <15% and gene number <250 were included in the analysis. The FindVariableFeatures function was used to filter highly variable genes after data normalization. Then, the batches were removed using FindIntegrationAnchors function, the scRNA-seq data were integrated by the IntegrateData method and scaled by the ScaleData function, followed by using principal component analysis (PCA) to reduce dimensionality (dim = 30). The cells on the first 50 principal components were clustered by the FindNeighbors and main cell clusters were classified by FindClusters functions. The markers for each cell cluster were screened under the criteria of logfc = 0.35, Minpct = 0.35, and corrected p < 0.05.
Identification of CD8+ T cell cluster related to the prognosis of lung adenocarcinoma
T cell clusters were identified according to CD45 (PTPRC) and CD3 (CD3D, CD3E, CD3G) [19] of T cells, and then CD8+ T cells were screened based on CD8+ (CD8A and CD8B). The same clustering method was used to divide CD8+ T cells into subgroups at Resolution = 0.1. Gene set variation analysis score was calculated based on the expression data for CD8+ T cells in different subgroups of normal samples and LUAD samples in TCGA [20], and then the samples were grouped by the median score of each CD8+ T cell subgroup. Survival analyses in both groups were conducted using the “survival” package, and the prognosis of each CD8+ T cell subgroup was evaluated using the Kaplan-Meier (KM) method.
A co-expression network was developed using the “WGCNA” package [21] based on the LUAD expression profile data of TCGA. The matrix was generated by calculating the distance between genes using the Pearson correlation coefficient. To ensure a scale-free nature of the network, soft threshold was determined by selecting the smallest network. Hierarchical clustering was performed based on topological overlap matrix (TOM), which was converted from adjacency matrix. Dynamic tree cut was performed, with a minimum number of 70 genes in a module, and then eigengenes in each gene module were calculated. Finally, cluster analysis was performed to combine modules close to each other into a new module.
Identification of key genes related to prognostic CD8+ T cell subgroups
The Pearson correlation test was employed to analyze the relationship between each module and prognostic CD8+ T cell subgroups so as to determine the modules with the highest positive correlation. Genes with genetic significance (GS) > 0.8 and module membership (MM) > 0.6 in each module were imported into the “survival” package to perform univariate COX regression analysis. Under the threshold of p < 0.05, prognostic genes for LUAD were filtered.
Clustering analysis was conducted by running the “pam” algorithm of the “ConsensusClusterPlus” package. The optimal number of clusters in the range of set k (2–10) was determined by extracting 80% of the LUAD samples in TCGA during 500 bootstrap resampling. Distribution differences of different clinical characteristics among the clusters were analyzed by Chi-square test.
‘Maftools’ was used to visualize and analyze the top 20 most frequently mutated genes in subtypes in TCGA. Following the study of Thorsson et al. [22], the scores of fraction altered, homologous recombination defects (HRDs), tumor mutation burden (TMB), and number of segments were calculated and compared by the Kruskal-Wallis Test.
Transcriptional profiles of each subgroup in TCGA-LUAD were used for pathway enrichment analysis of the Kyoto Encyclopedia of Genes and Genomes (KEGG) for Gene Set Enrichment Analysis (GSEA). Significant KEGG pathways were selected under false discovery rate (FDR) < 0.05. The scores of 10 carcinogenic signaling pathways (nuclear respiratory factor 1 [Nrf1], transforming growth factor-β [TGF-β] signaling, Notch, p53, β-catenin/Wnt, cell cycle, Myc, Hippo, phosphatidylinositol 3-kinase/protein kinase B [PI3K/Akt], and receptor tyrosine kinase [RTK]-RAS) were calculated [23] and compared using Kruskal-Wallis Test.
Evaluation of tumor microenvironment and immune pathways
The TME characteristics of each subgroup were analyzed using ESTIMATE [24] and CIBERSORT [25] algorithms. The stromal score was calculated based on the gene expression profile of each subgroup in the R package “ESTIMATE”. The levels of 22 infiltrating immune cells were calculated by CIBERSORT using the gene signature matrix. Gene sets of immune-related KEGG pathways were identified, and their expression in each subgroup was analyzed.
Selection of differentially expressed genes (DEGs) among the subtypes and development of a risk score
Differential expression between each subgroup and the other two subgroups in the TCGA-LUAD dataset was analyzed using the R package “limma”. DEGs screened under the thresholds of FDR < 0.05 and | log2 (Fold Change) | > log2 (1.5) were integrated to further select prognostically significant genes using the coxph function of the “survival” package (p < 0.0001). Then, a risk score system for evaluating LUAD prognosis was developed according to the coefficient of the genes selected by LASSO in the R package “glmnet” with 10-fold cross-validation. The formula of Risk score = ∑ CoefficienmRNAi × Expression mRNAi was employed to calculate the risk score for each case in the TCGA-LUAD dataset and four independent GEO datasets (GSE30219, GSE31210, GSE19188, GSE50081). Data were normalized by Z-score, with 0 as the boundary to classify samples into risk groups. Survival differences between risk groups were reflected in the KM curves. The area under the curve (AUC) of the receiver operating characteristics curve was measured to assess the prediction accuracy of the risk score system.
Immune correlation assessment of the risk score
Rooney et al. [26] designed a quantitative method for measuring immune cytolytic activity (CYT) based on the average of Granzyme A and Perforin expression levels. Using this method, the CYT scores of LUAD samples in TCGA were determined. Tumor Immune Dysfunction and Exclusion scores [27] of the risk groups in TCGA-LUAD were calculated. A tumor-reactive T cell signature (TRS) for indicating tumor reactivity [28] was introduced to further calculate the TRS score of the LUAD samples in TCGA.
Screening independent prognostic factors for lung adenocarcinoma and development of a nomogram
Independent prognostic variables for LUAD were selected from age, gender, risk score and American Joint Committee on Cancer (AJCC) stage by performing univariate and multivariate Cox regression analysis using the “survival” package. Next, the independent prognostic factors were integrated into the “rms” package in the R program to develop a nomogram. Calibration curve, ROC curve, and decision curve analysis (DCA) were employed to assess the accuracy and clinical benefit of the nomogram.
Quantitative real-time polymerase chain reaction (qRT-PCR)
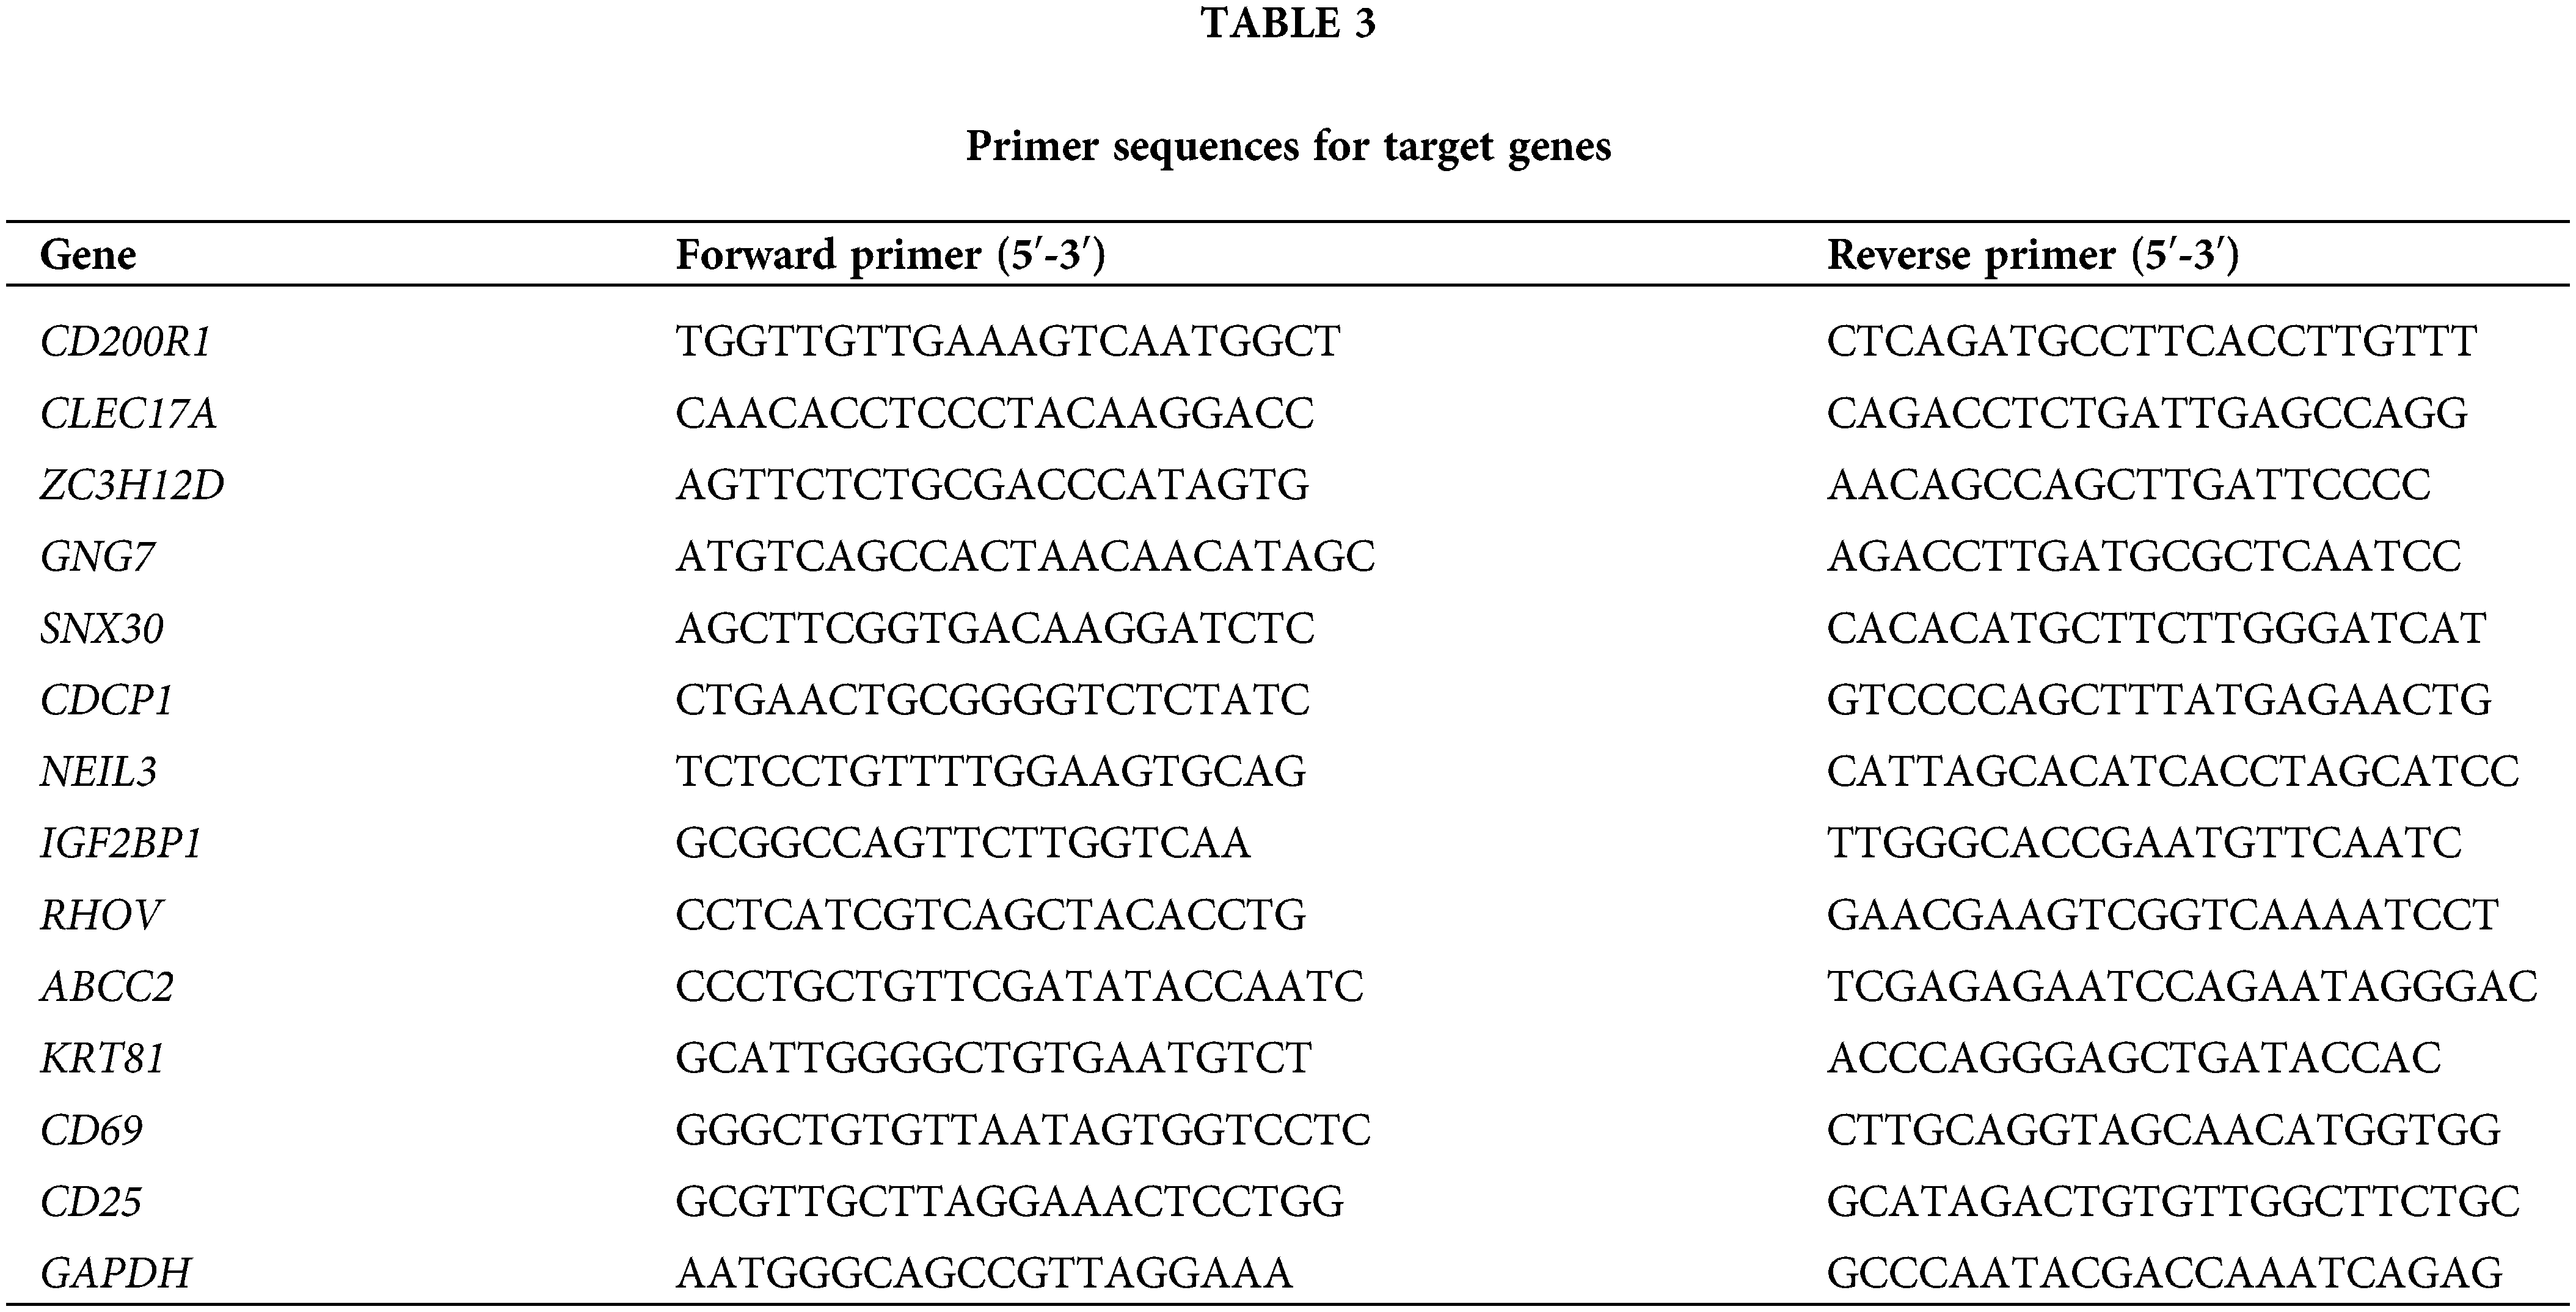
Total RNA from BEAS-2B, H1299, and A549 was extracted using TRIzol reagent (Thermo Fisher, Waltham, MA, USA). Using the HiScript II SuperMix (Vazyme, Nanjing, Jiangsu province, China), cDNA was obtained from the RNA (500 ng). Subsequently, qRT-PCR was conducted with SYBR Green Master Mix in ABI 7500 System (Thermo Fisher, Waltham, MA, USA) under the conditions of 45 cycles for 10 min at 94°C, for 10 s at 94°C, and for 45 s at 60°C. The internal reference was GAPDH. See Table 3 for the primer sequences for target genes.
Cell culture and transient transfection
BEAS-2B (BNCC359274), H1299 (BNCC100268), and A549 (BNCC337696) cells (Beijing Bena Biotechnology Co., Beijing, China) were commercially purchased and cultured in DEME F-12 medium. of the negative control (NC), CD200R1 siRNA, and CDCP1 siRNA (Sagon, China) were transfected utilizing Lipofectamine 2000 (Invitrogen, Carlsbad, California, USA). The siRNAs, GGCTACTGTTGATTTTGACTATC (CD200R1-si) and AGCAACATTACAGTTCTCATAAA (CDCP1-si) were the target sequences for CD200R1 siRNA and CDCP1 siRNA, respectively. An anti-mouse CD8 microbeads isolation kit (Miltenyi, Bergesch Gladbach, Germany) was used to extract splenic CD8+ T cells from two euthanized mice with a magnetic separator.
The invasion of BEAS-2B, H1299, and A549 cell lines was analyzed by performing a Transwell assay. The cells (5 × 10⁴) were inoculated to chambers coated with Matrigel (BD Biosciences, New York, USA). Complete Dulbecco’s modified Eagles medium and serum-free medium were added to the lower and the upper layers, respectively. The migrating or invading cells were fixed using 4% paraformaldehyde. The cells were stained with 0.1% crystalline violet after 24-h incubation. A light microscope was used to count cell numbers.
Lactate dehydrogenase (LDH) assay
We used a cytotoxicity assay kit (Roche, Basel, Switzerland) for LDH detection. After co-culturing the H1299 and A549 cell lines with CD8+ T cells for 24 h, 50 μL of each sample was transferred into a 96-well plate and mixed with an equal amount of reagent mixtures. The intensity of red color in the colorimetric assay was determined at 490-nm wavelength after incubation at 37°C (Thermo Fisher, Waltham, MA, USA) to calculate the number of damaged/dead cells.
Data were analyzed using the R program and GraphPad Prism. The clinical characteristics of each molecular subtype were compared using the chi-square test, and the biological characteristics were compared using the Kruskal-Wallis test. The KM curve and ROC curve were plotted using “survival” and “survivalROC” packages, respectively. Unless otherwise specified, a default p < 0.05 was considered statistically significant.
Identification of CD8+ T cell clusters associated with lung adenocarcinoma prognosis
A total of 7484 cells from three pairs of LUAD tissues and paired normal tissues were included after quality control (Suppl. Fig. S1A). After eliminating the batch effect, cells in the samples were distributed unevenly (Suppl. Fig. S1B, Suppl. Fig. S1C). A total of 20 cell subsets were identified by clustering. Clusters 0 and 6 were considered the main T cell distribution subsets as they specifically expressed CD45 and CD3 (CD3D, CD3E, CD3G) (Suppl. Fig. S1D). CD8+ T cells were screened based on CD8 expression from all the identified T cells were extracted and divided into two clusters (Suppl. Fig. S1E, Fig. 1A). CD8+ T cells only existed in two samples, and the proportions of clusters CD8+ 0 and CD8+ 1 in the two samples were noticeably different (Fig. 1B). Expression analysis showed that the top 10 high-expressed gene markers in CD8+ T cell cluster 0 had a low expression in CD8+ T cell cluster 1, while the top 10 high-expressed gene markers in CD8+ T cell cluster 1 had a low expression in CD8+ T cell cluster 0 (Fig. 1C). KEGG enrichment analysis showed that the gene markers of the two CD8+ T cell clusters were significantly enriched in apoptosis and salmonella infection, and CD8+ T cell cluster 0 was also significantly correlated with natural killer cell mediated cytotoxicity, viral myocarditis, graft vs. host disease, allograft rejection and human cytomegalovirus infection (Fig. 1D). In LUAD samples, the content of CD8+ T cell cluster 0 was noticeably lower but that of CD8+ T cell cluster 1 was significantly higher (Fig. 1E).
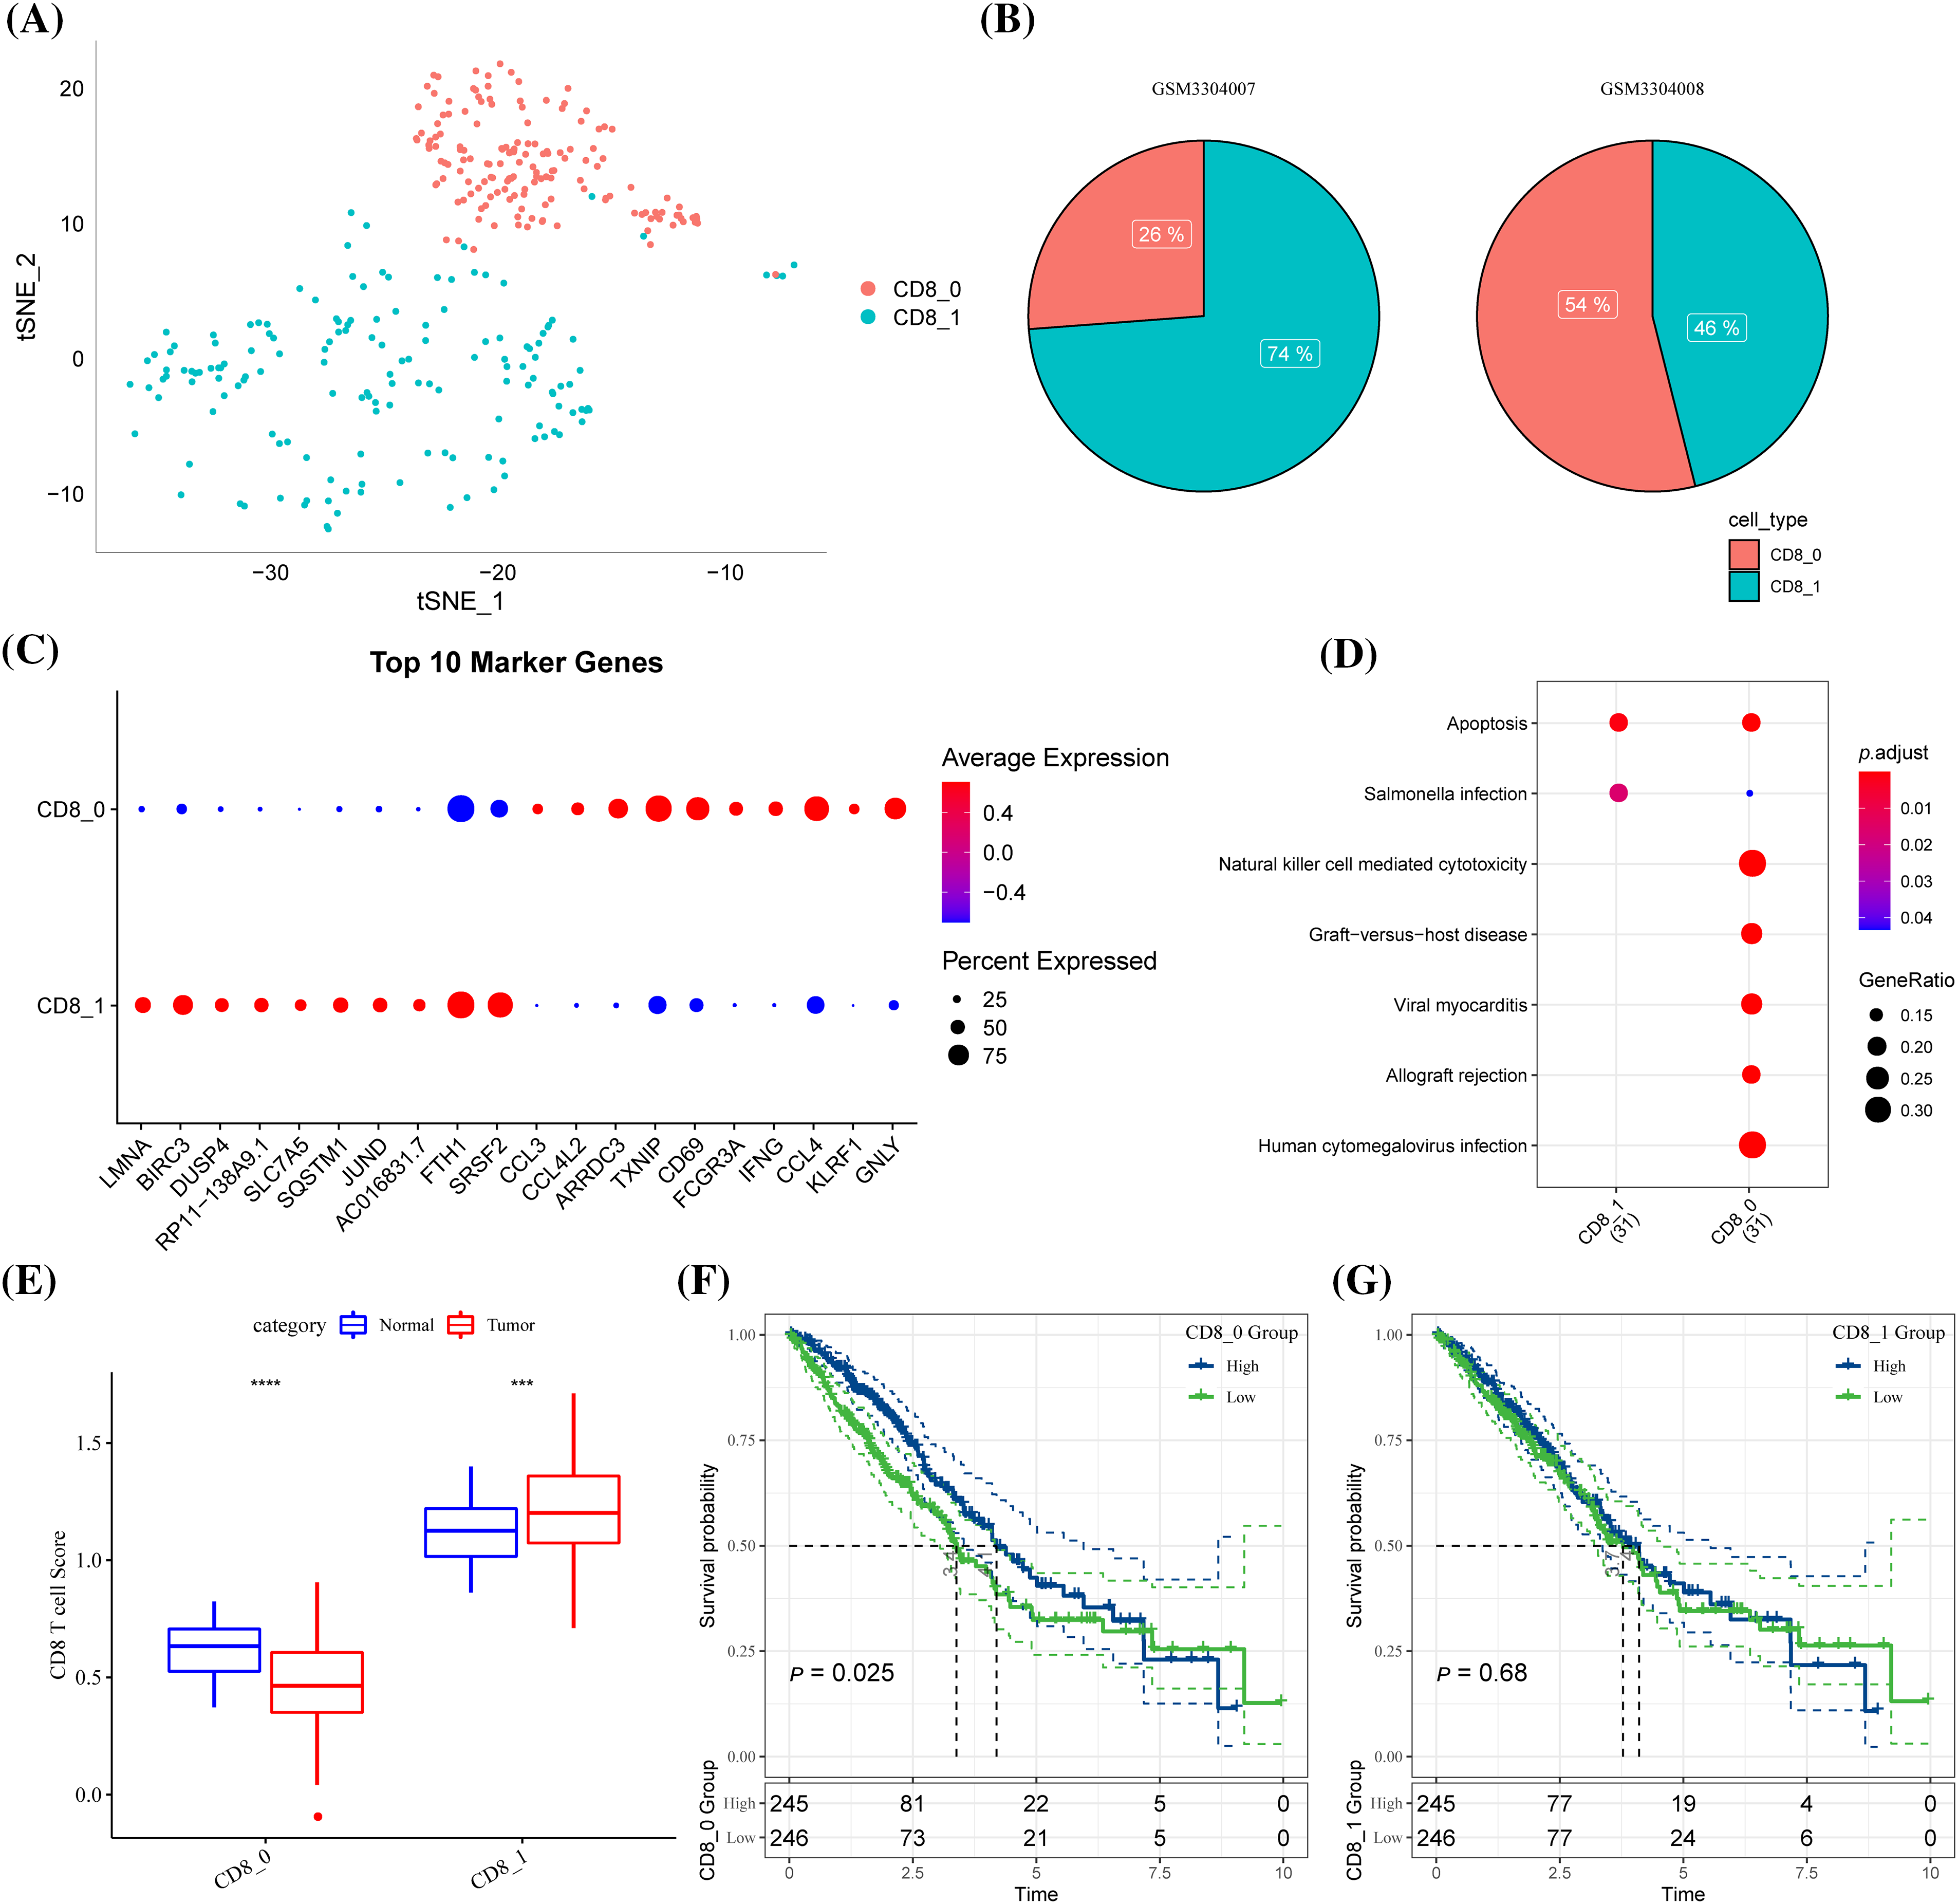
Figure 1: Identification of CD8+ T cell clusters associated with lung adenocarcinoma (LUAD) prognosis. (A) The distribution of the two clusters of CD8+ T cells (clusters CD8+ 0 and CD8+ 1) is shown in the T-distributed stochastic neighbor embedding (tSNE) plot. (B) The pie chart showed the proportion of two CD8+ T cell subgroups in each sample. (C) Bubble diagram of the gene marker expression in each CD8+ T cell cluster. (D) The Kyoto Encyclopedia of Genes and Genomes pathways significantly enriched by gene markers of the two CD8+ T cell clusters. (E) The difference in the contents of two CD8+ T cell clusters between the LUAD samples and the normal samples of The Cancer Genome Atlas. (F) Samples with high CD8+0 score showed significantly better OS than that of samples with low CD8+ 0 score. (G) CD8+ 1 score. ***p < 0.001, ****p < 0.0001.
A high score of CD8+ T cell cluster 0 was related to a noticeably better OS of the samples (Fig. 1F). However, no significant difference in the OS was detected between samples grouped based on cluster CD8+ 1 (Fig. 1G). In other words, CD8+ 0 was the most related to LUAD prognosis.
WGCNA was conducted to cluster genes of LUAD samples in TCGA into modules and hierarchical clustering was performed to detect the outliers (Fig. 2A). When the soft threshold was 10, the correlation noise was noticeably reduced and the network was scale-free (Fig. 2B). A total of 12 modules were dissected by clustering tree (Fig. 2C). The brown module containing 710 genes was significantly correlated with CD8+ 0 (Fig. 2D). A significant correlation between GS and MM could be observed from the scatter diagram of these genes (Fig. 2E), with 106 genes under the criteria of GS > 0.6 and MM > 0.8, of which 42 were significantly linked with the prognosis of LUAD (Suppl. Table S1).
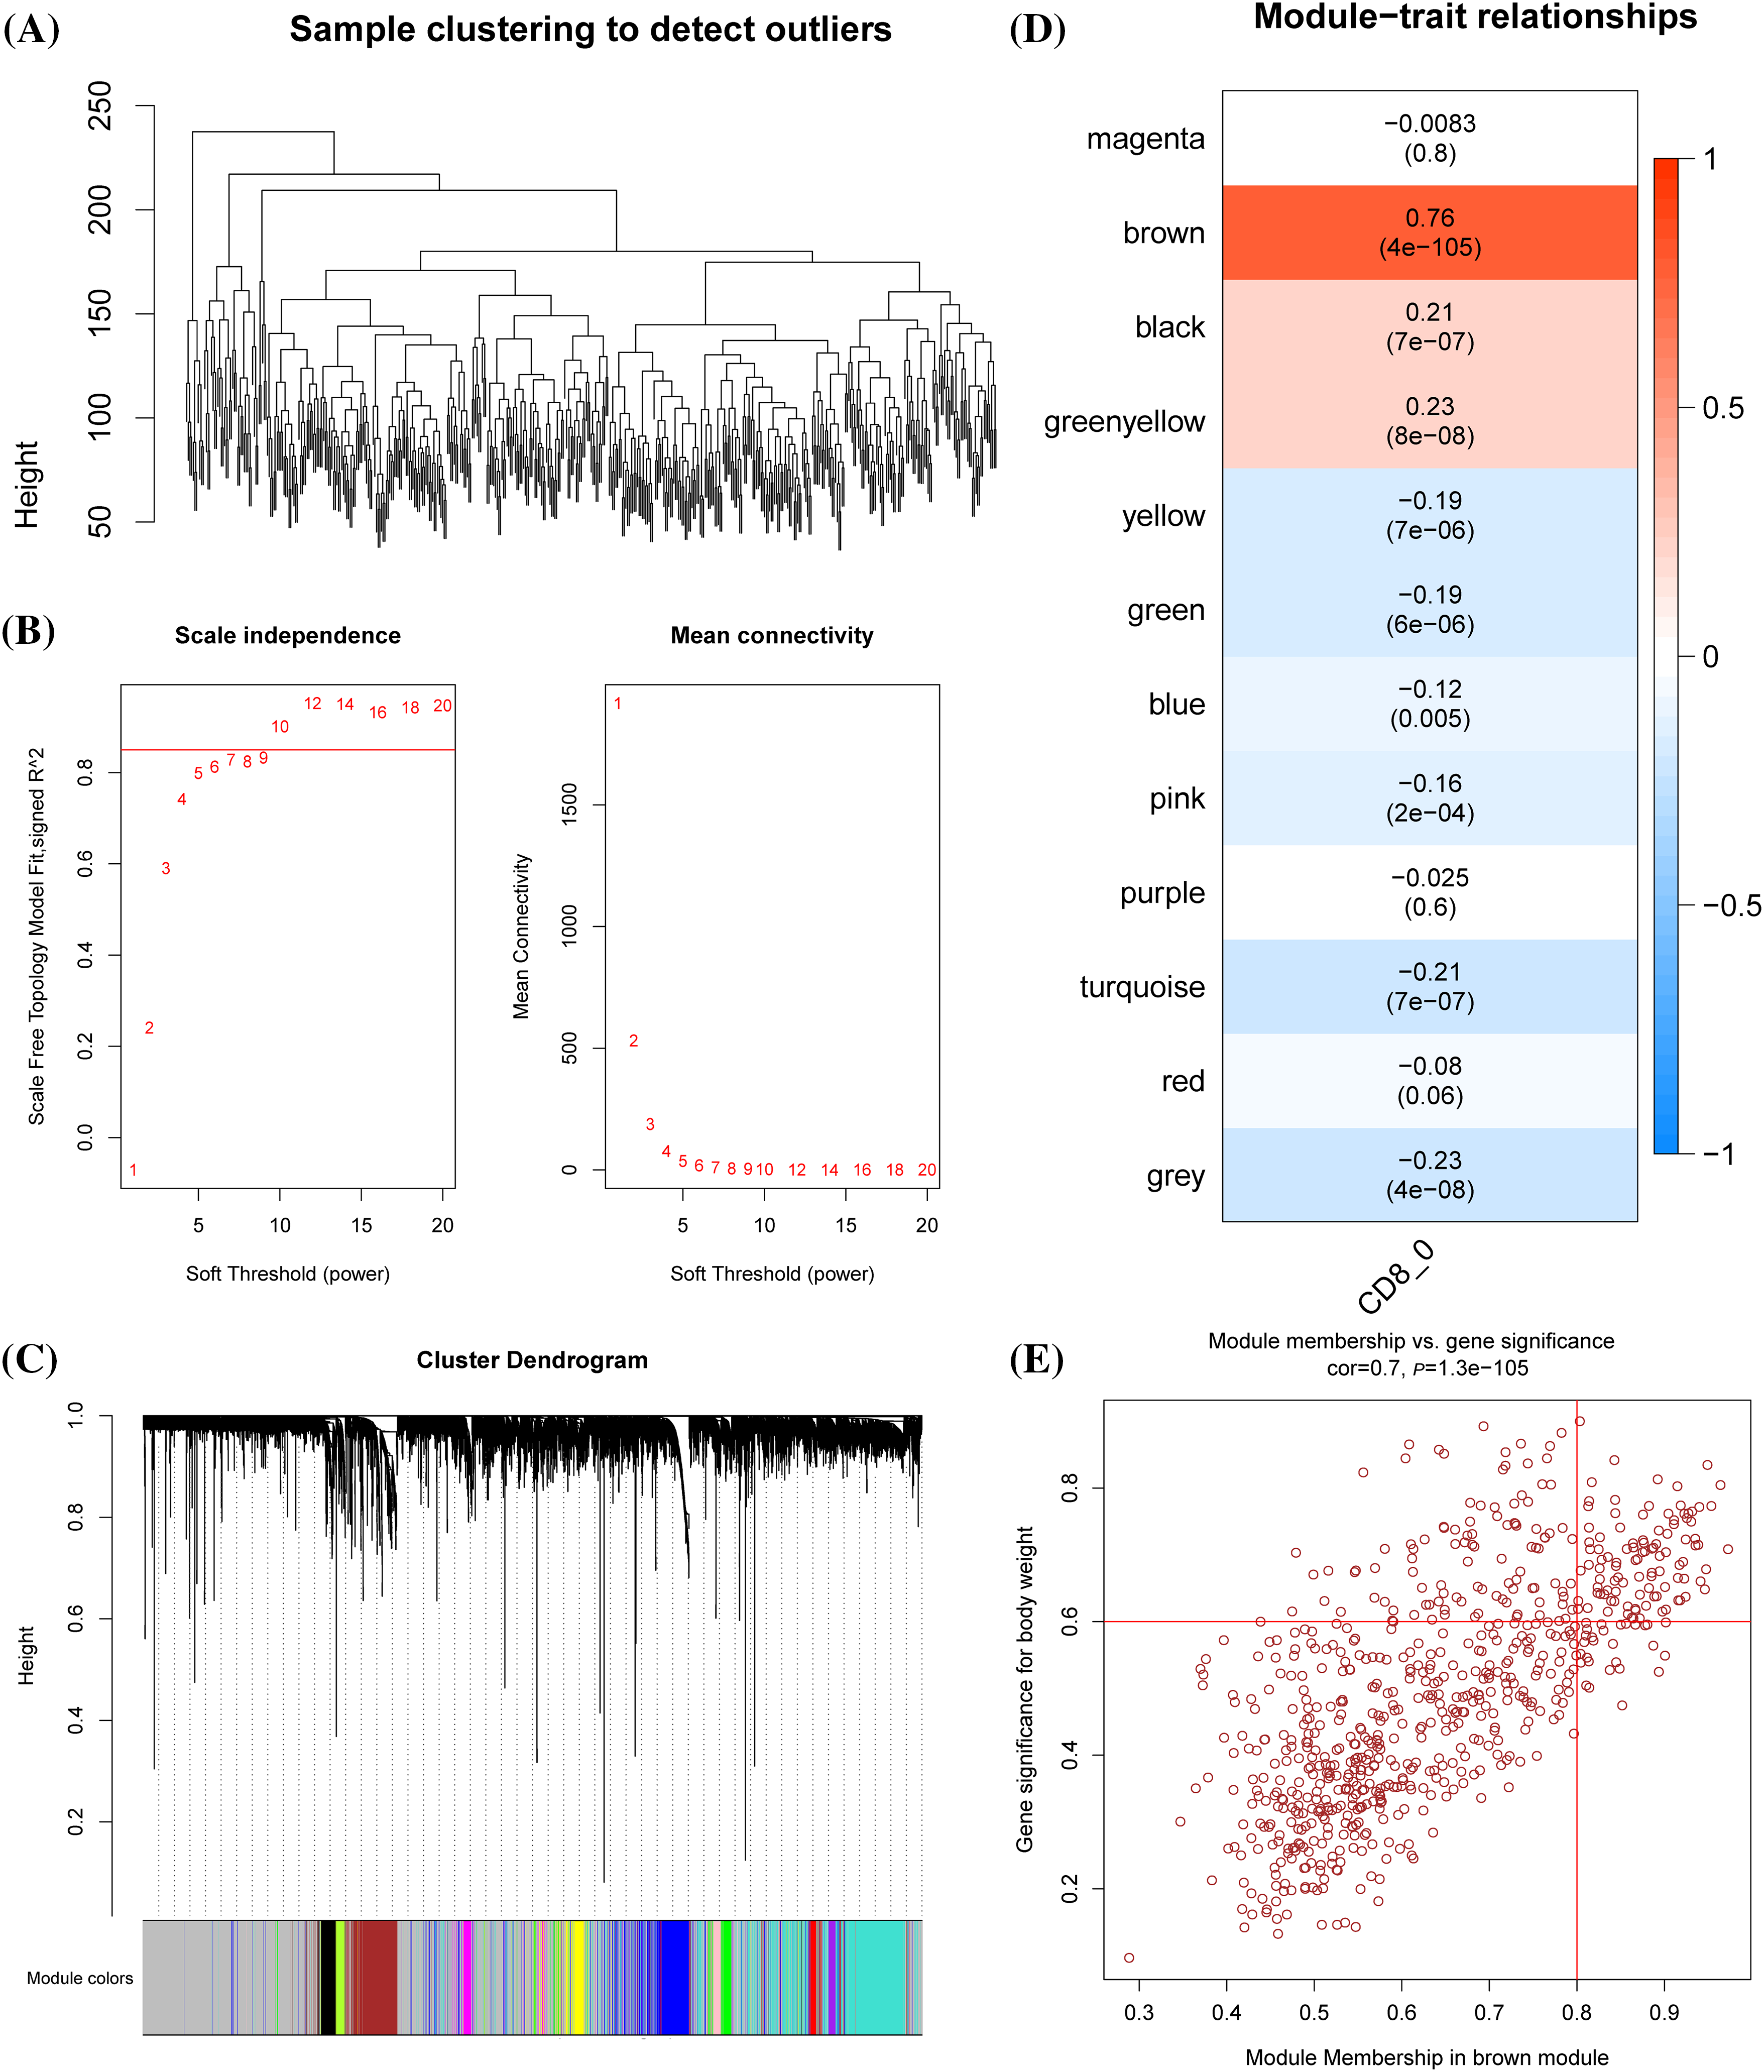
Figure 2: Identification of the prognostic genes related to cluster CD8+ 0. (A) Dendrogram of sample clustering. (B) The scale-free fit index for distinct soft-thresholding powers (β) and the mean connectivity for different soft-thresholding powers. (C) The clustering dendrogram of the weighted gene co-expression network. The generated modules were colored using different colors. (D) The association between each clinical phenotype and 12 modules. (E) The correlation between module membership (MM) and genetic significance (GS) of genes in the brown module was shown in a scatter plot.
According to the cumulative distribution function (CDF) curve, the delta area of CDF, and the consistency matrix, the classification was stable when there were three clusters. Therefore, the samples were divided into three subtypes (clusters 1, 2, and 3) (Figs. 3A–3C). TCGA samples in the three clusters showed significant differences in the 5-year survival rate. Specifically, the 5-year survival rate of cluster 1 was the lowest but the highest in cluster 3, and that of cluster 2 was intermediate between clusters 1 and 3 (Fig. 3D). In GSE30219, significant prognostic differences were observed between the three clusters, with the optimal prognosis in cluster 3 and the worst in cluster 1 (Fig. 3E).
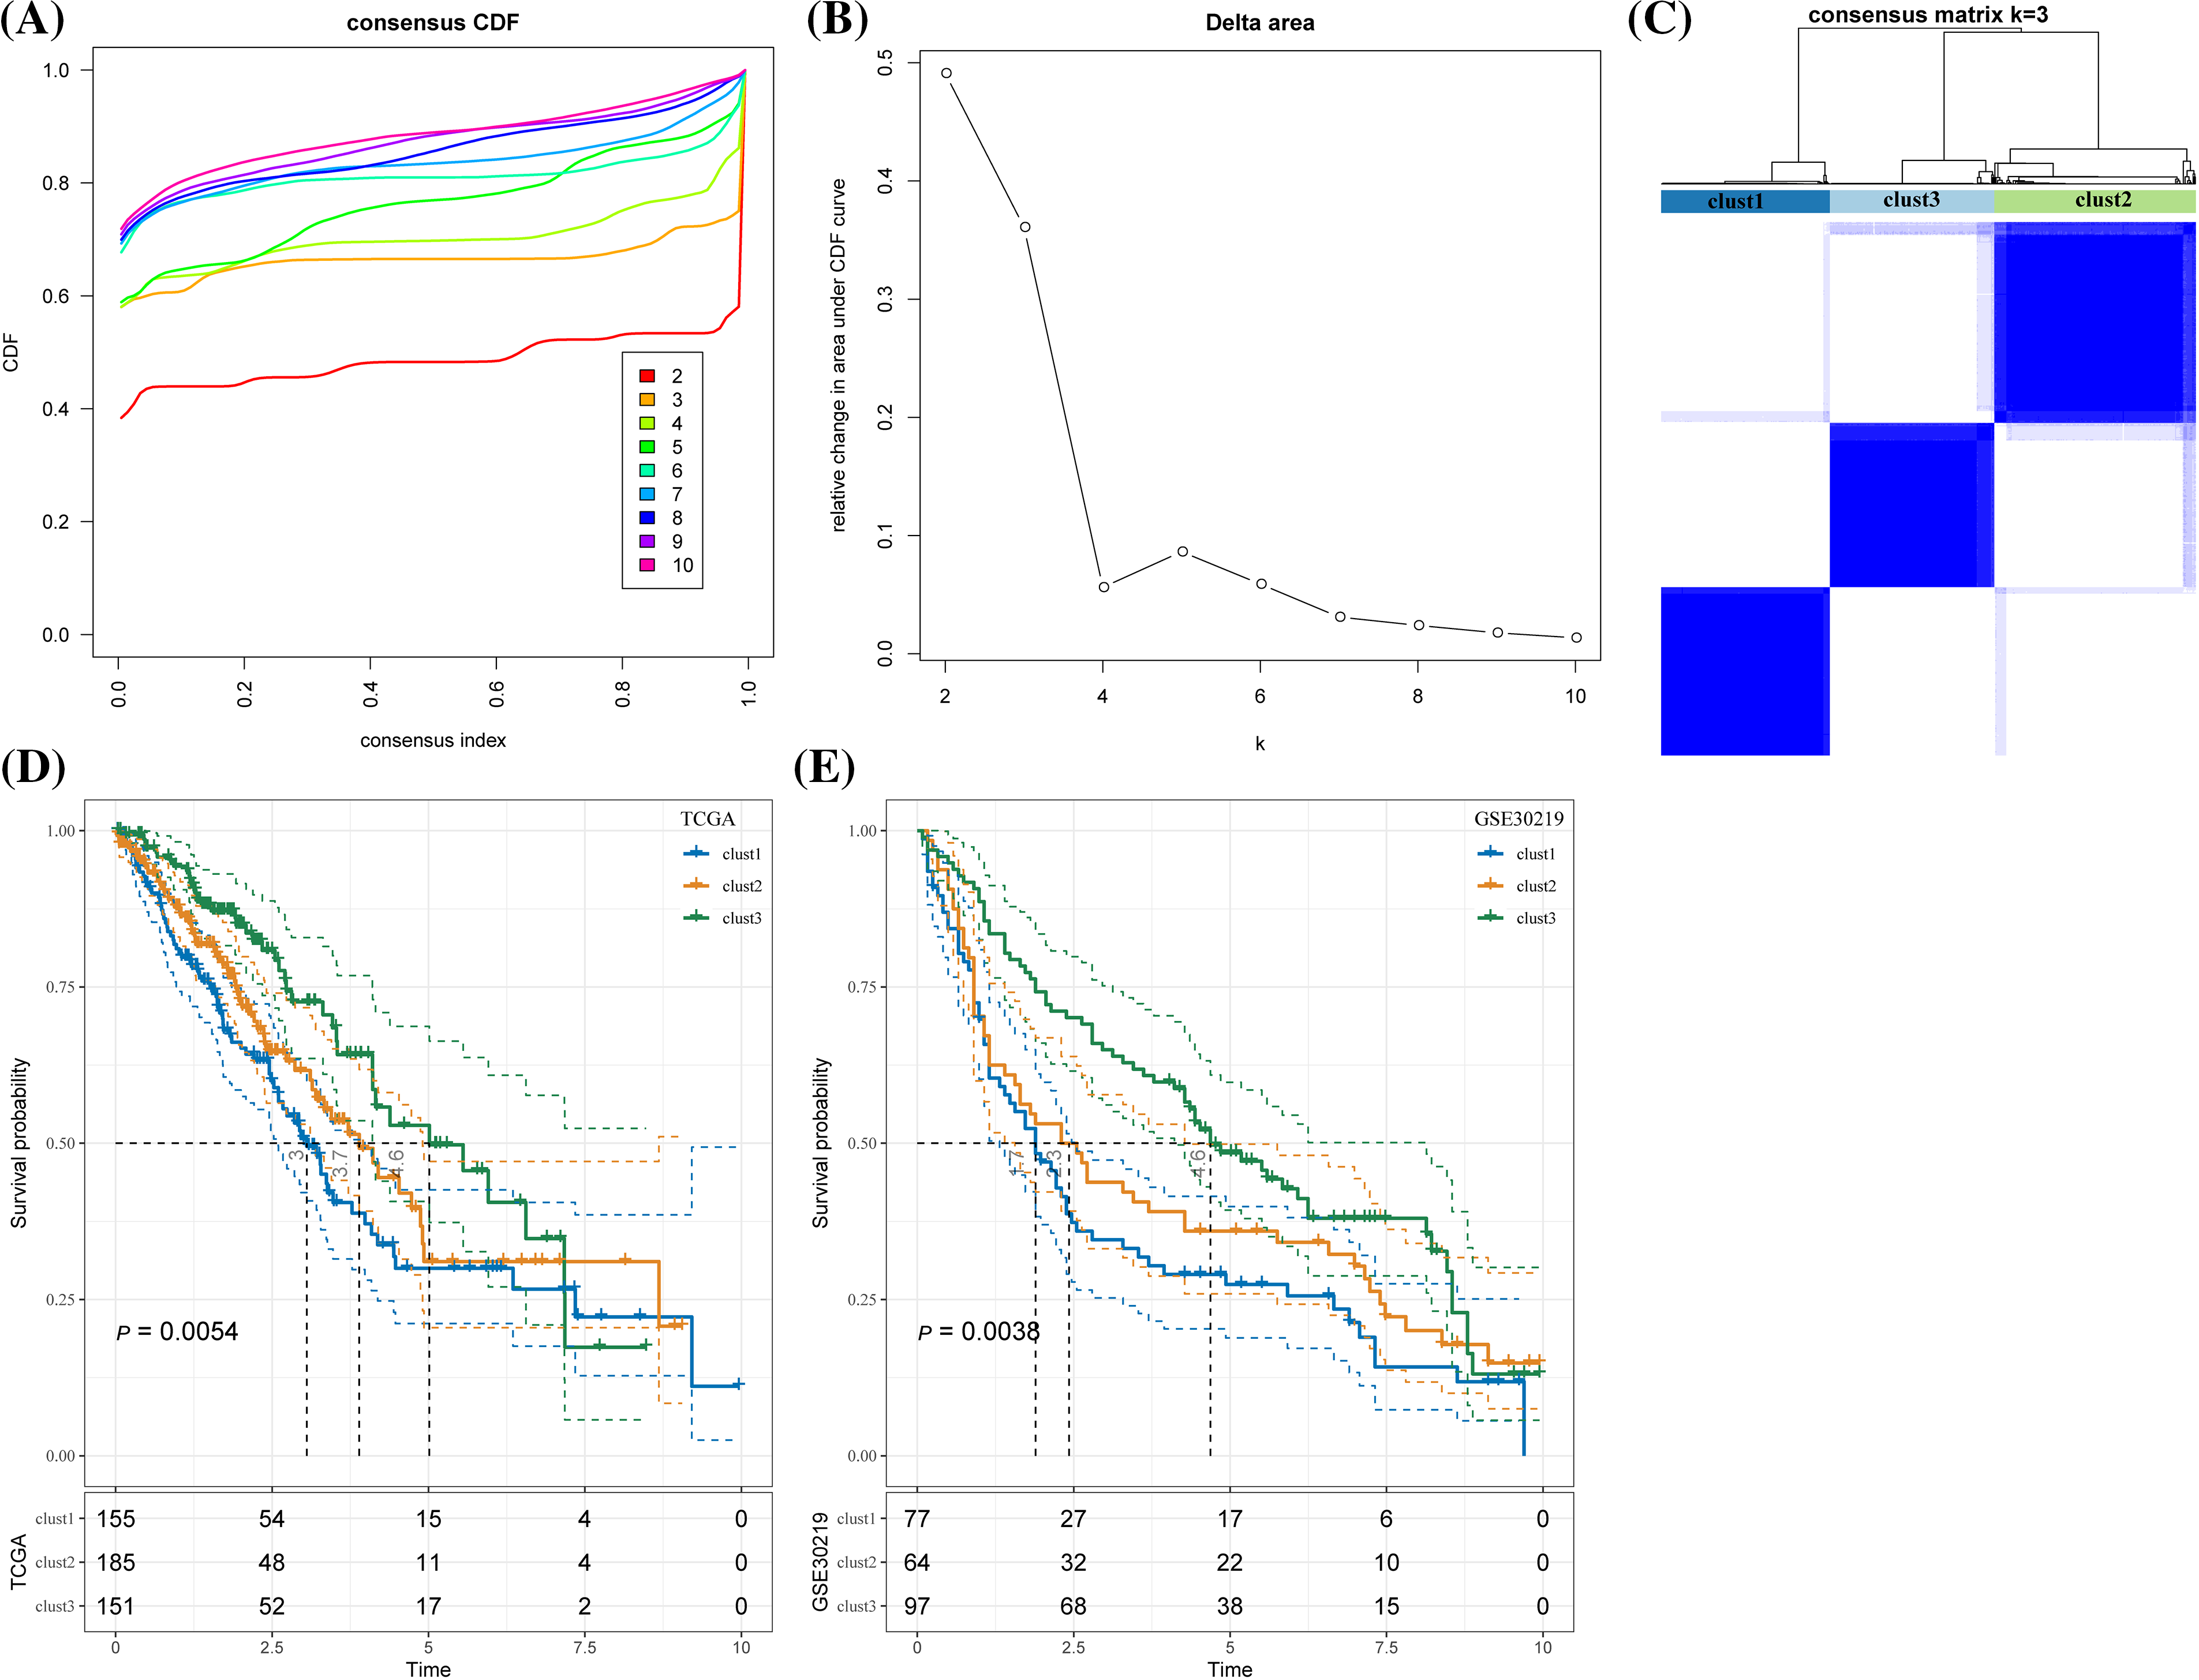
Figure 3: Lung adenocarcinoma classification based on the prognostic genes related to cluster CD8+ 0. (A) Cumulative distribution function (CDF) curves for distinct consensus. (B) Relative change in area under CDF curve for each k. (C) Consensus matrix for k = 3. (D) The Kaplan-Meier curve of the sample of the three clusters in The Cancer Genome Atlas. (E) The Kaplan-Meier curves of the three clusters in GSE30219.
The chi-square test was used to confirm the proportion of different clinical phenotypes in clusters 1, 2, and 3. T stage distribution and survival state of the three clusters were significantly different. A difference in clinical phenotypic distribution between cluster 3 and the other two clusters was observed. Compared with clusters 1 and cluster 2, cluster 3 (T1 stage, N0 stage, stage I) had a higher proportion of female samples at early stages (Fig. 4A). Among all three clusters, TTN, RYR2, and ZFHX4 had the highest mutation in cluster 1 and the lowest in cluster 3 (Fig. 4B). HRDs, fraction altered, number of segments and TMB scores were used to evaluate the mutation status in LUAD. We found that the mutation score of the first three factors was the lowest in cluster 3 and the highest in cluster 1 but TMB score in cluster 1 was significantly higher than in cluster 3 (Fig. 4C).
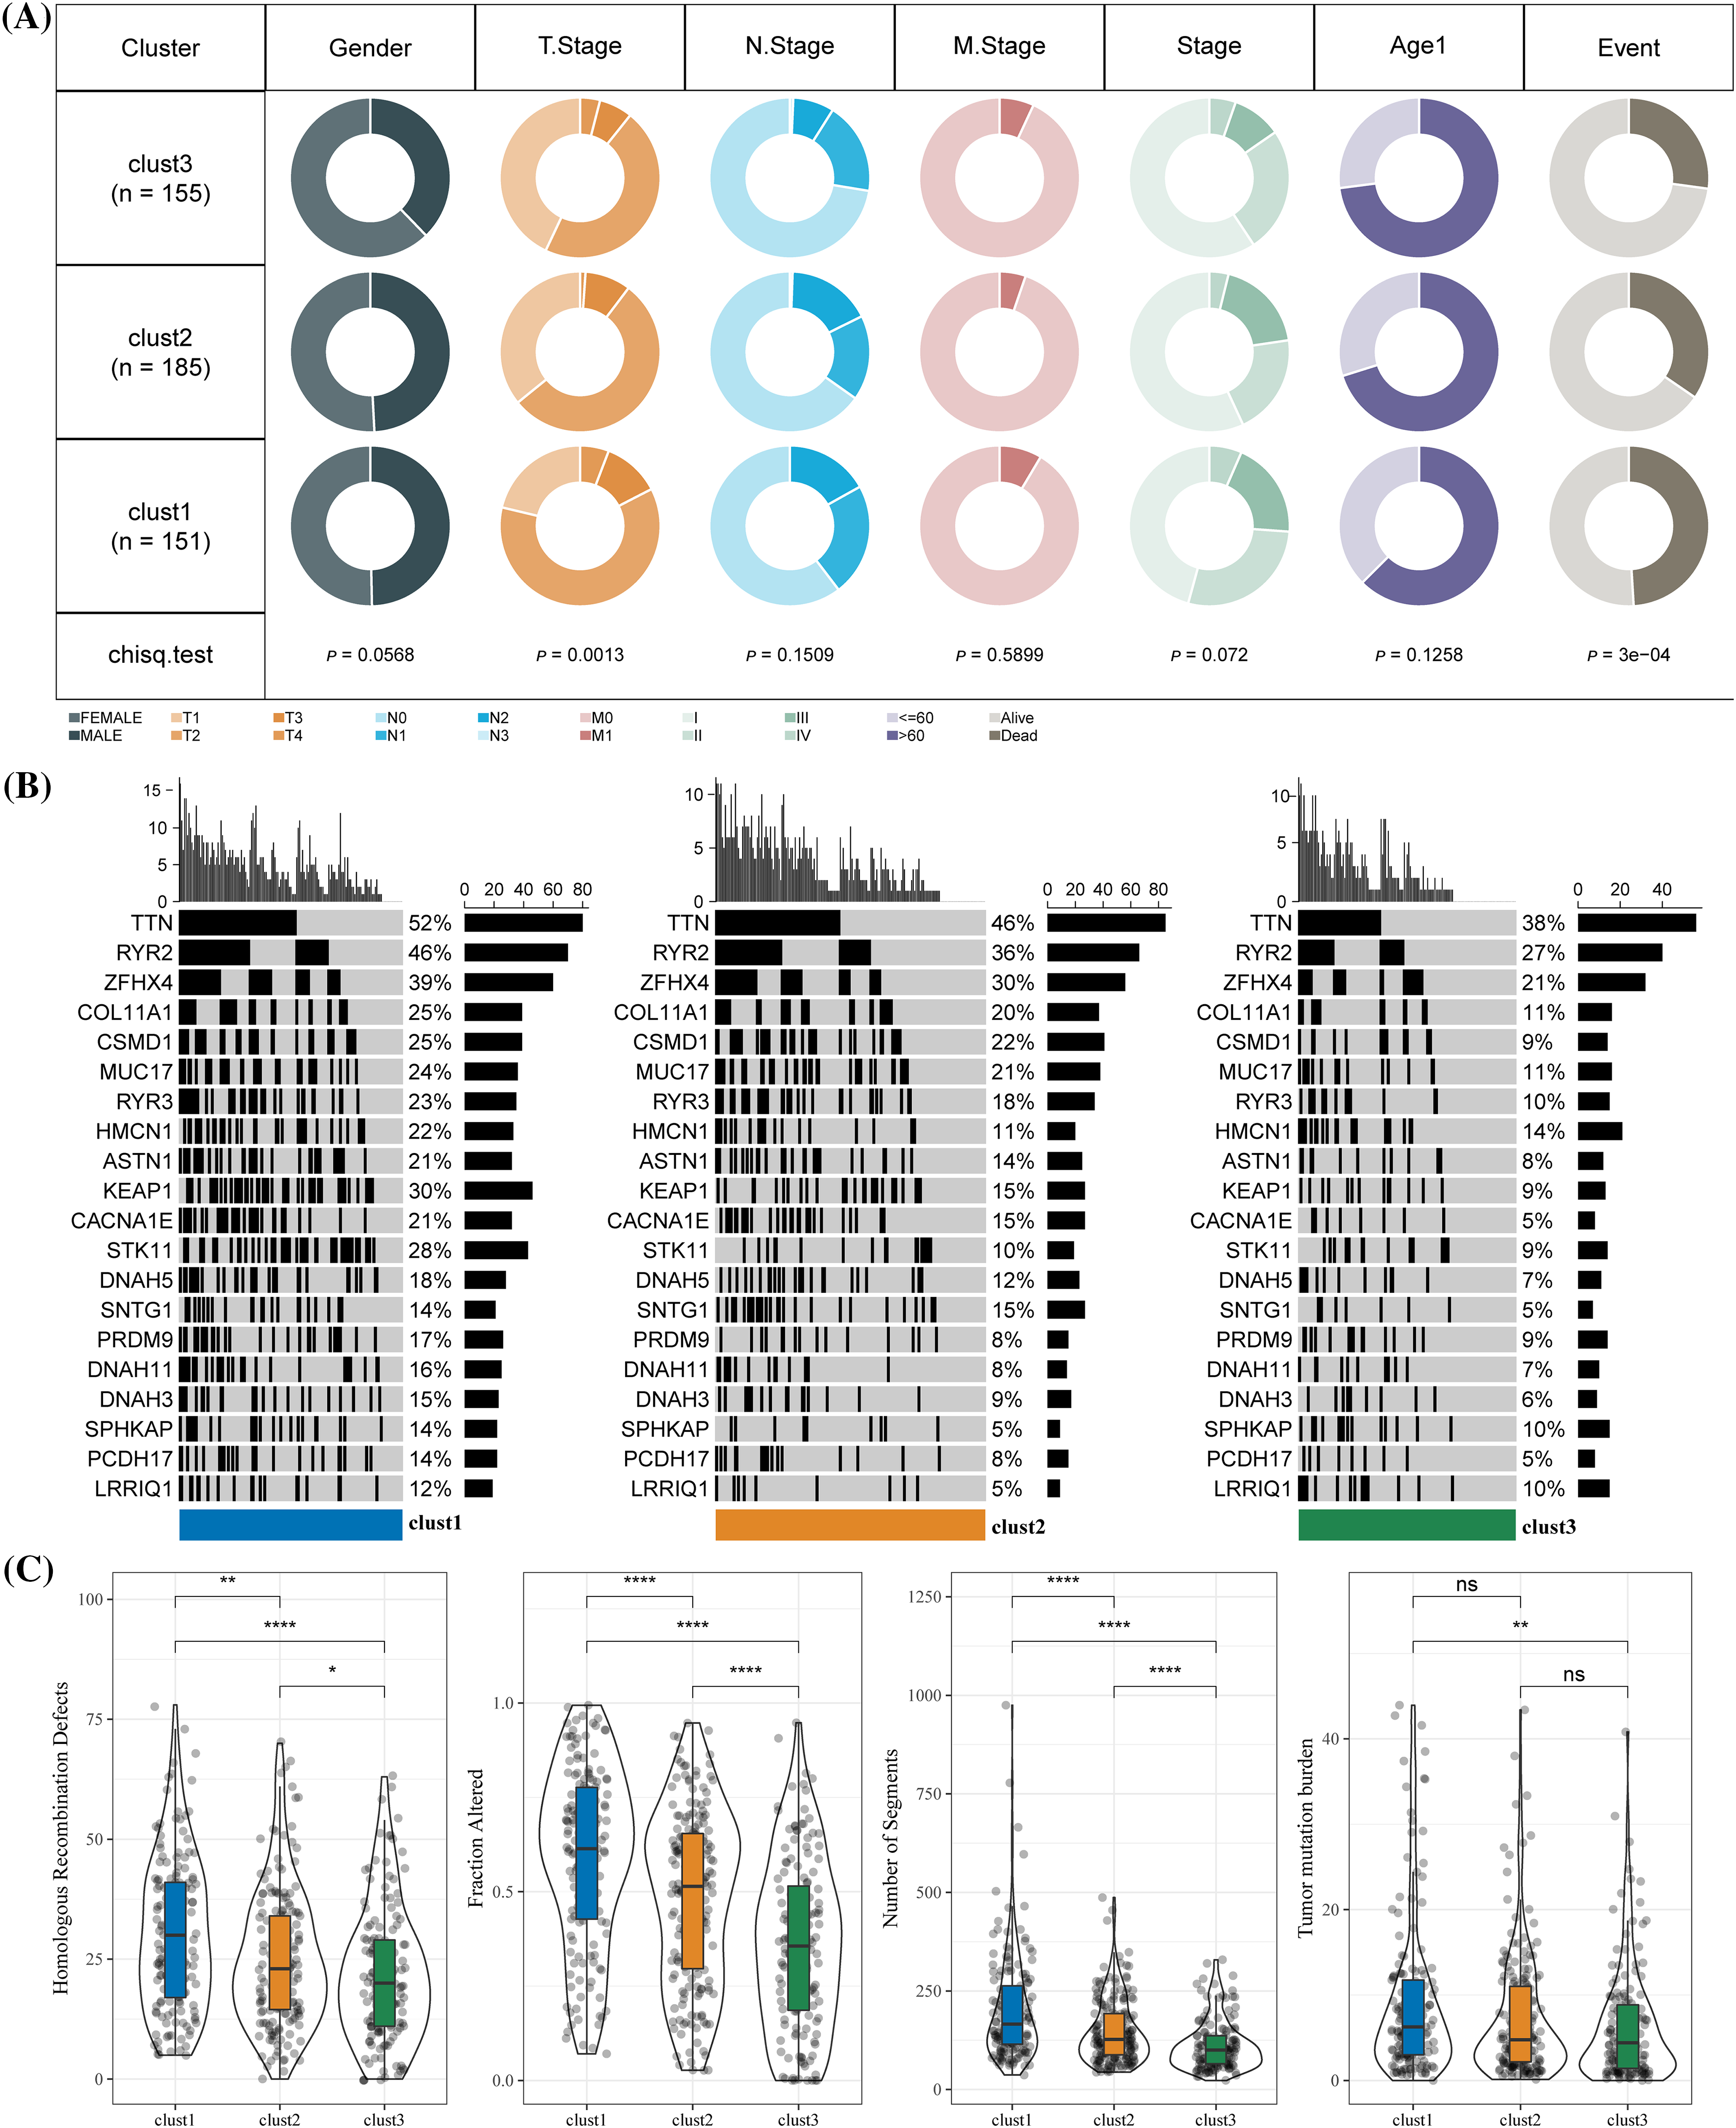
Figure 4: Clinical phenotypes and mutational status of the three molecular clusters. (A) The difference in the proportion of different clinical phenotypes in the three molecular subtypes. (B) Alterations frequencies of the top 20 genes in each cluster. (C) Differences in tumor mutation burden, homologous recombination defects, number of segments and fraction altered among the three molecular subtypes. *p < 0.05, **p < 0.01, ****p < 0.0001, ns: no significance (p < 0.05).
Enriched biological pathways in TCGA were identified by GSEA. A total of 18 biological pathways in cluster 1 were significantly inhibited, 17 of these 18 pathways were highly activated in cluster 3, and 23 pathways were activated in cluster 2. Many of these pathways significantly associated with the three clusters were modulated immune responses, such as complement, inflammatory response, interferon alpha/gamma response, allograft rejection, etc. (Fig. 5A). Among the 10 major biological pathways regulating cancer progression, Hippo, Myc, Notch, Nrf1 and RTK-RAS and TGF β signaling showed significantly different ssGSEA scores among the three molecular subtypes (Fig. 5B).
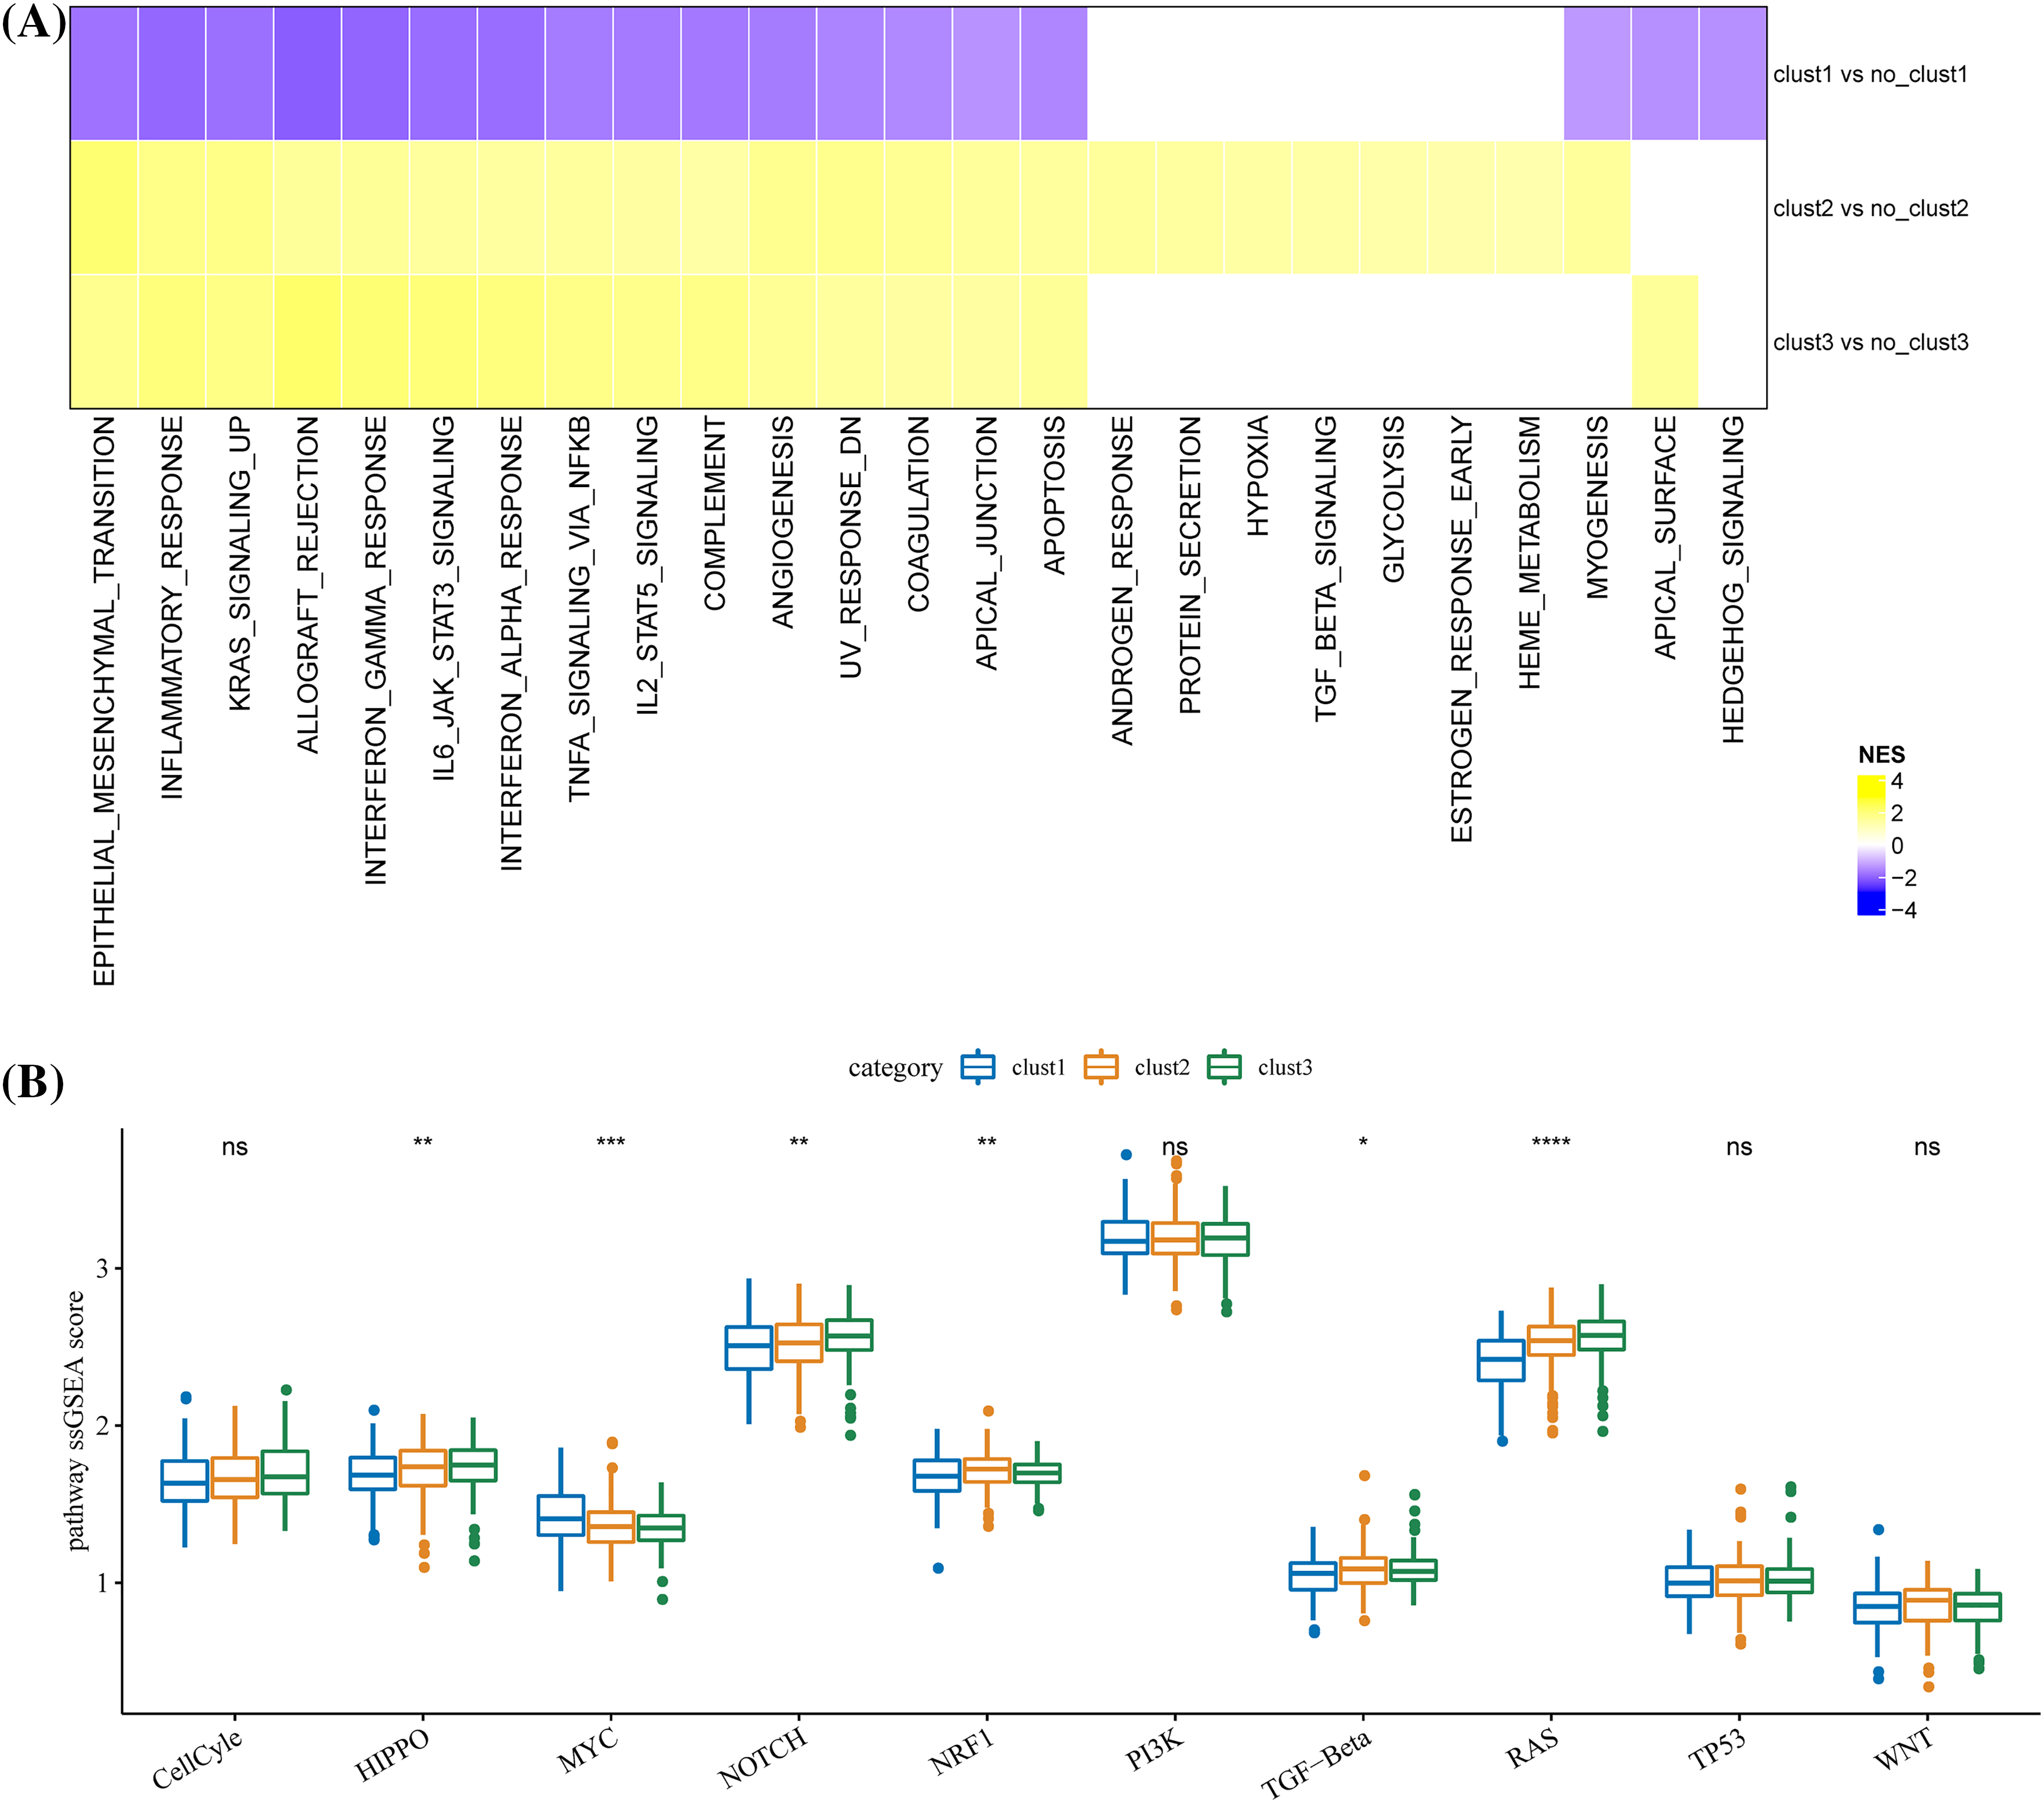
Figure 5: Differences in biological pathways regulated by the three molecular clusters. (A) The different biological pathways between each cluster and the rest of the clusters. The purple bar represents the normalized enrichment score (NES) < 0, and the yellow bar represents NES > 0. (B) Scores difference of the 10 major biological pathways regulating cancer progression among the three clusters. *p < 0.05, **p < 0.01, ***p < 0.001, ****p < 0.0001, ns: no significance (p < 0.05).
The stromal score, immune cell infiltration, immune score, immune checkpoints, and signal molecules in immune pathways among the three clusters were calculated. CIBERSORT was used to calculate and compare the scores of 22 immune cells of each cluster. Significant differences in helper follicular T cells, memory B cells, naive B cells, CD8+ T cells, plasma cells, delta gamma T cells, resting/activated mast cells, M1 macrophage, resting/activated memory CD4 T cells, M2 macrophage, resting/activated dendritic cells, and activated NK cells were observed among the three clusters (Fig. 6A). The levels of immune and stromal scores were cluster 1 < cluster 2 < cluster 3 (Fig. 6B). Specifically, the number of immune checkpoints in cluster 1 was significantly lower than in cluster 2, and the content of immune checkpoints in these two clusters was significantly lower than those in cluster 3 (Fig. 6C). Moreover, the expression of signal molecules in the immune pathway was the highest in clusters 3 and the lowest in cluster 2 (Fig. 6D).
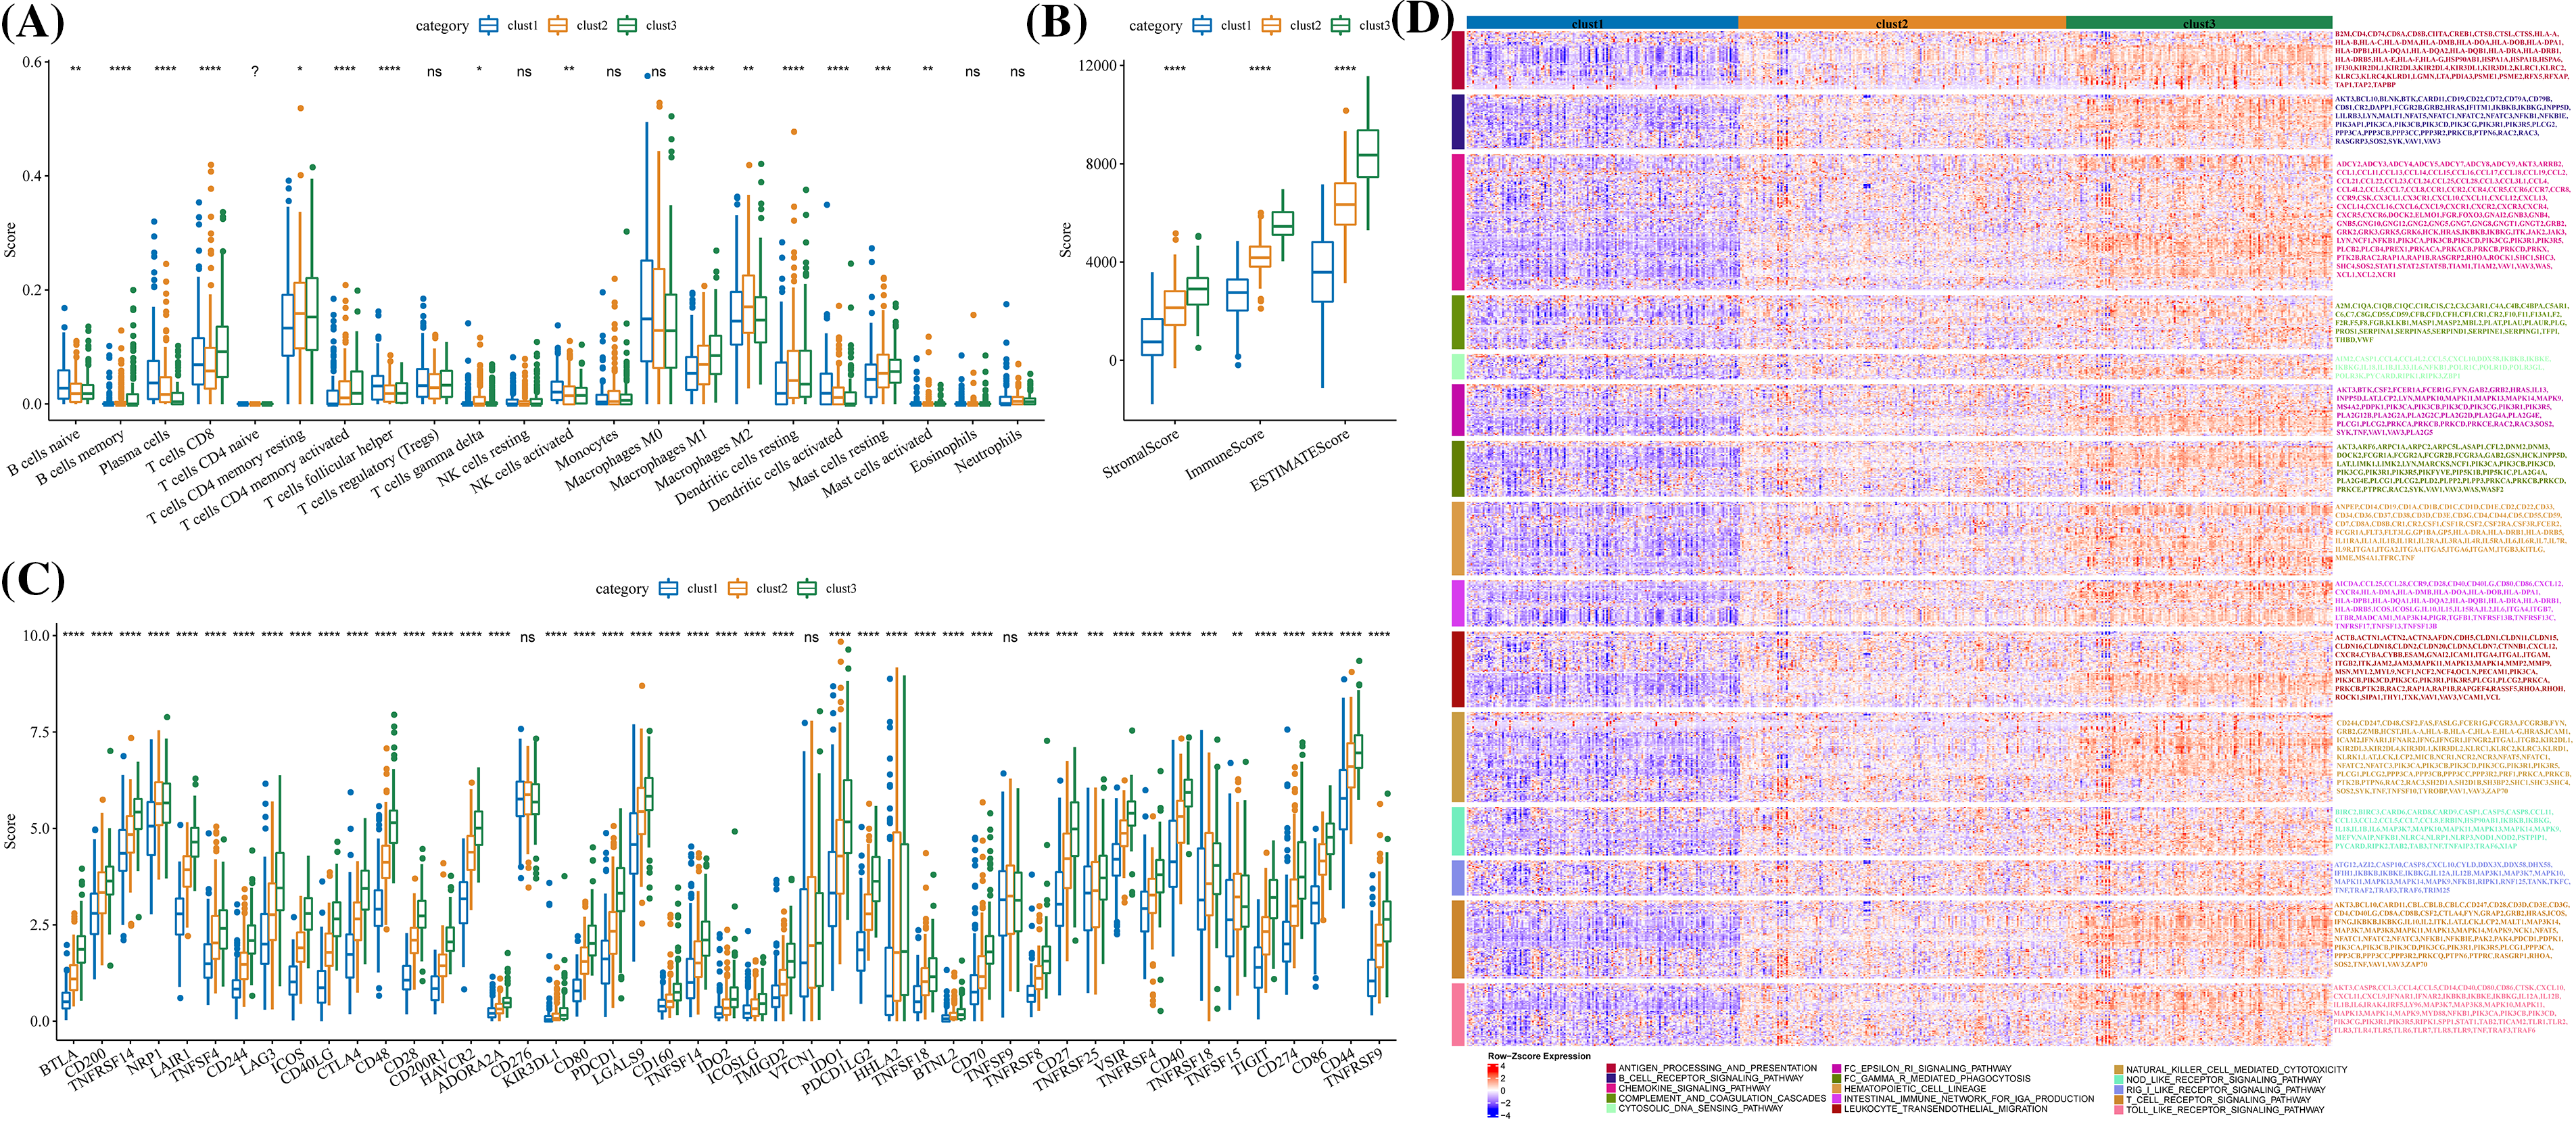
Figure 6: Immunological characteristics of the three molecular clusters. (A) Differences in the levels of immune cell score among the three clusters in TCGA-LUAD. (B) The level difference of ESTIMATE score, stromal score, and immune score among the three clusters. (C) The difference in immune checkpoint level among three clusters. (D) The expression of signal molecules in the immune pathway in each cluster was shown in the heatmap. *p < 0.05; **p < 0.01; ***p < 0.001; ****p < 0.0001, ns: no significance (p < 0.05).
A total of 1833 DEGs, 18 DEGs, and 1264 DEGs were screened from cluster 1 and non-cluster 1, cluster 2 and non-cluster 2, cluster 3 and non-cluster 3 in TCGA-LUAD datasets, respectively. After integrating all these DEGs, we obtained 1915 genes. Univariate COX regression analysis on these 1915 genes selected 23 genes with prognostic effects (Fig. 7A). The optimal λ was determined by Lasso, and a prognostic model (Figs. 7B, 7C) was successfully devised using 11 genes. The risk score formula was Risk score = −0.391 × CD200R1 − 0.141 × CLEC17A − 0.076 × ZC3H12D − 0.049 × GNG7 − 0.038 × SNX30 + 0.229 × CDCP1 + 0.05 × NEIL3 + 0.05 × IGF2BP1 + 0.081 × RHOV + 0.006 × ABCC2 + 0.073 × KRT81. Normalized risk score was calculated for each case in the LUAD sample set in TCGA as the training cohort. We observed that a greater death risk was positively correlated with a higher risk score (Fig. 7D). The survival curve revealed the significant difference between the two risk groups; specifically, the low-risk patients showed a significantly improved OS than high-risk patients (Fig. 7E), with 1-, 3-, 5-year AUC of ROC curve of 0.72, 0.73 and 0.69, respectively (Fig. 7F). In all the four cohorts (GSE30219, GSE31210, GSE19188, and GSE50081), the KM curve demonstrated that low-risk samples of had greater survival advantages than the high-risk samples (Figs. 7G, 7I–7K). According to the AUC of the ROC curve, the prognostic model showed a stable and accurate prediction of OS for the samples in GSE30219 (Fig. 7H). In the GSE31210 and GSE50081 cohorts, the AUC for 1-, 3- and 5-year survival prediction was higher than 0.7 (Figs. 7L, 7N). For another validation cohort of GSE19188, the AUC for 1-year, the respective 3- and 5-year survival prediction were 0.77, 0.68, and 0.65 (Fig. 7M).
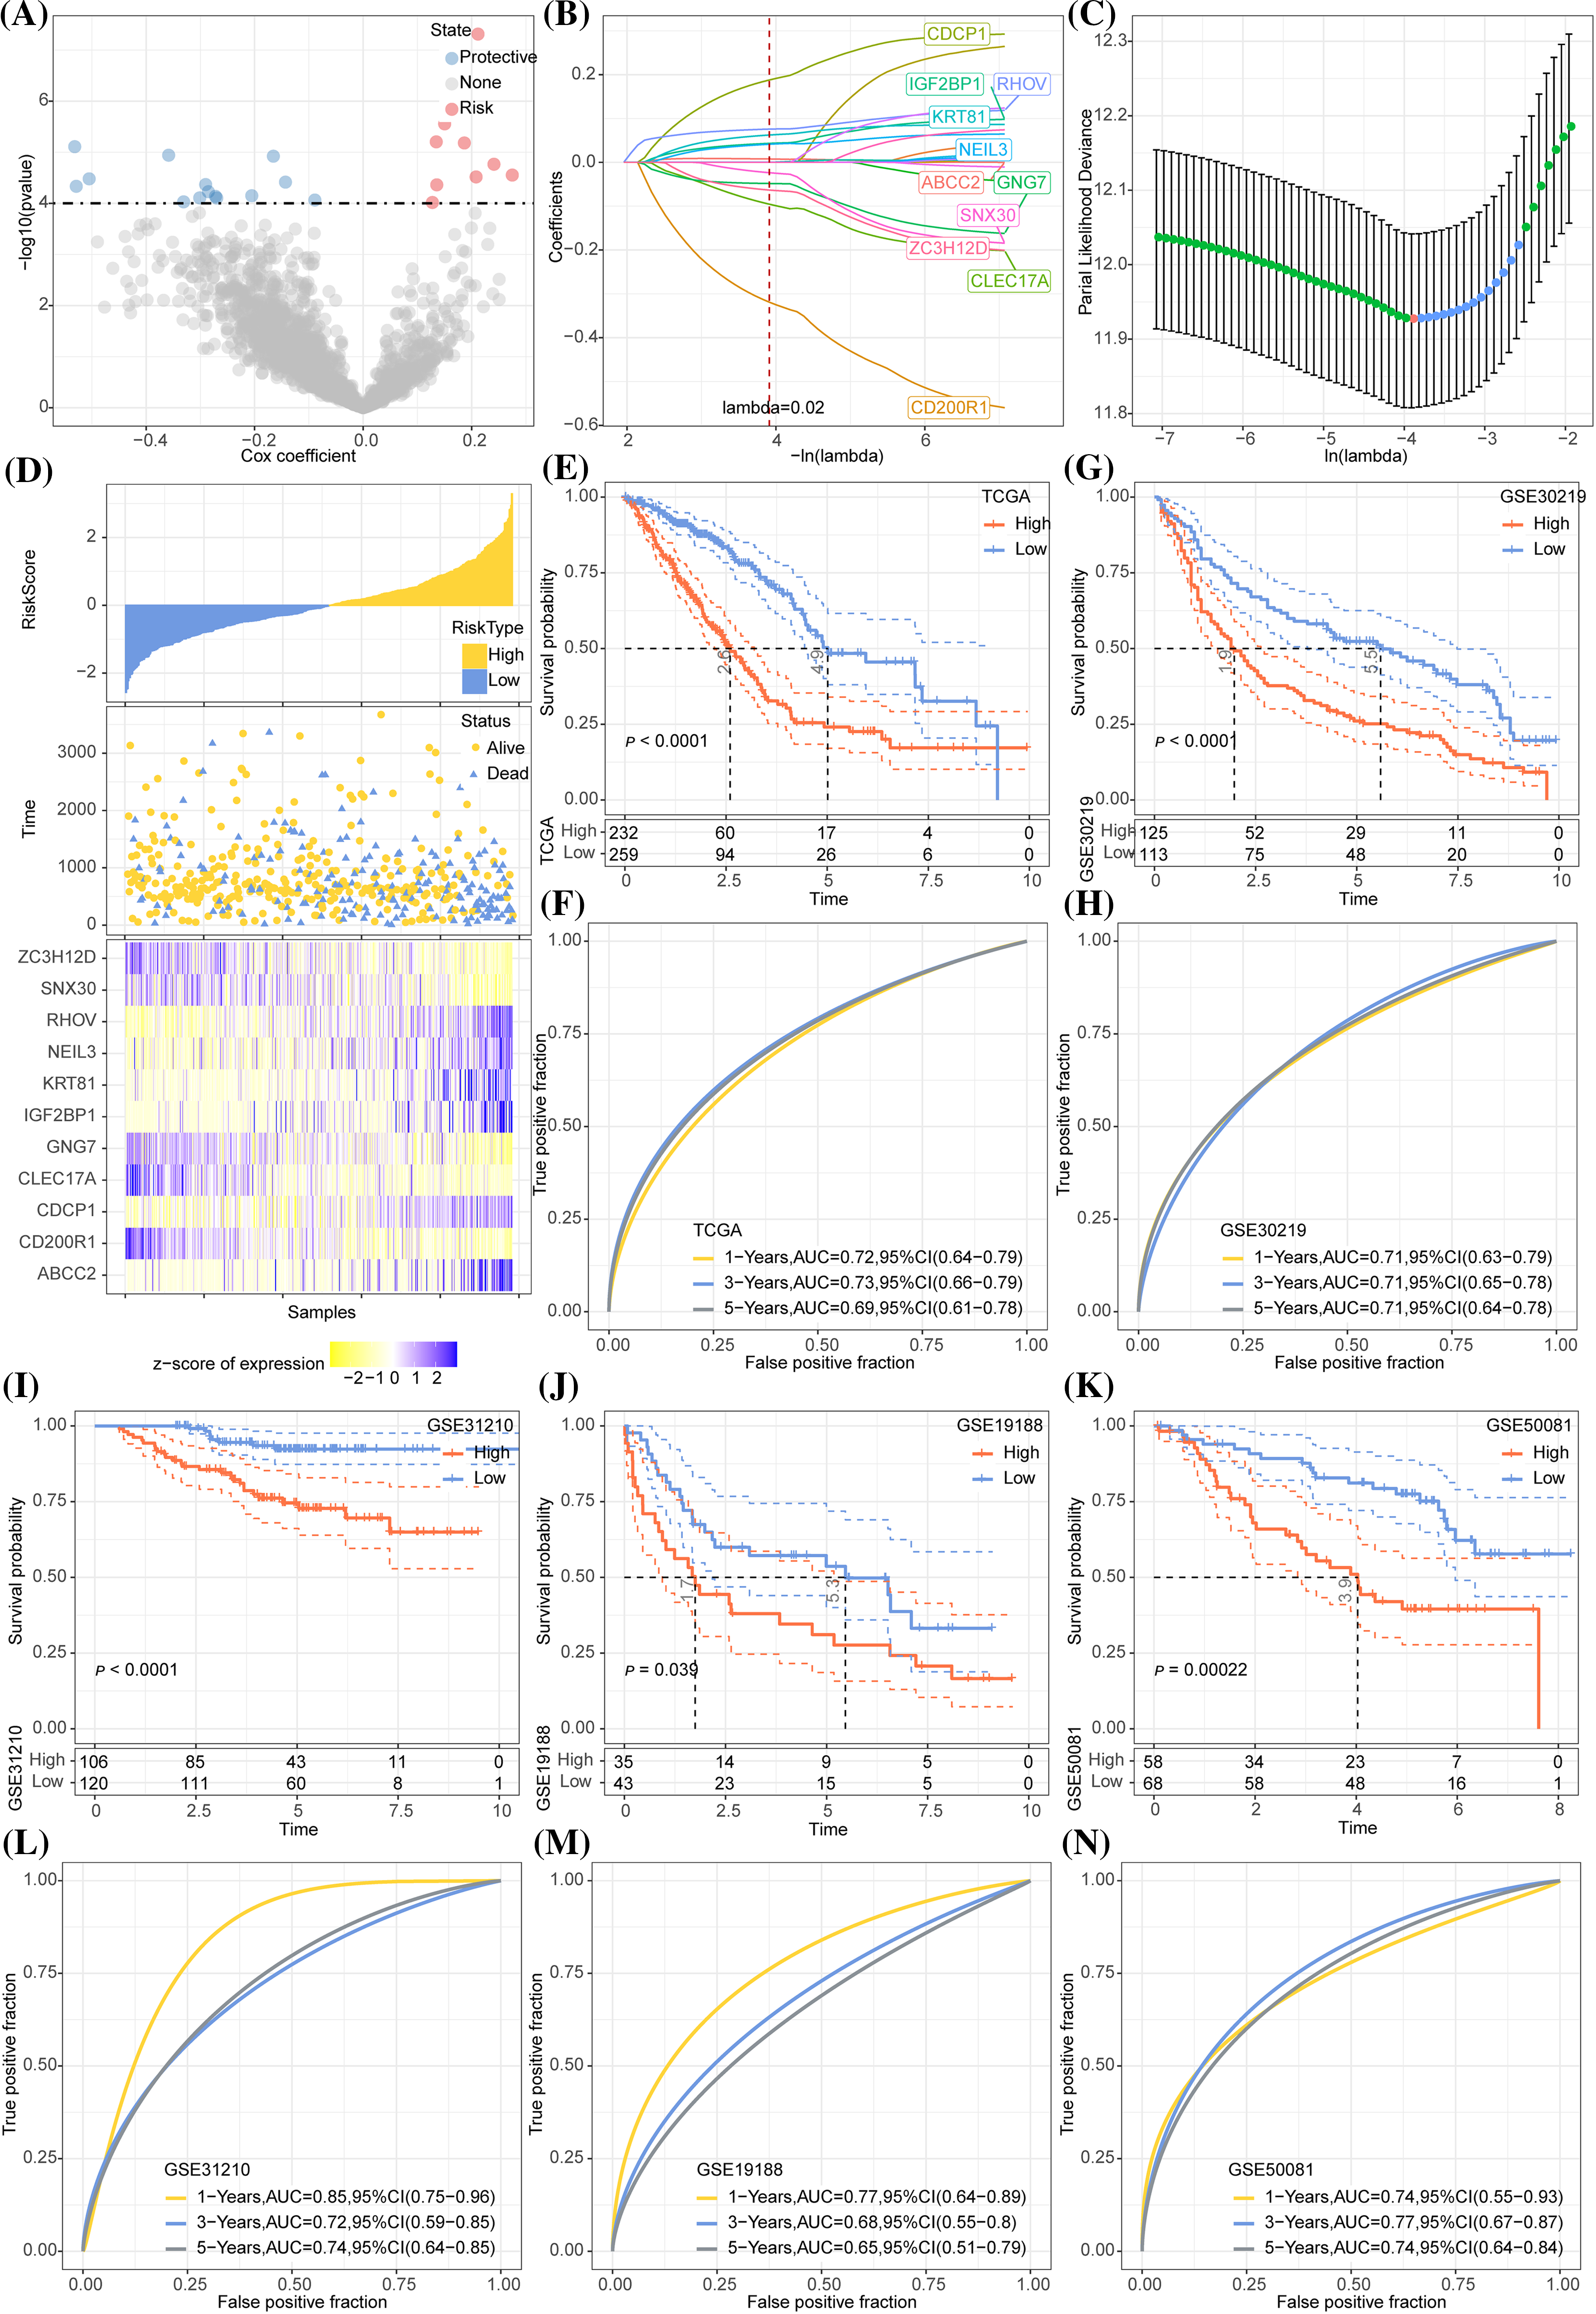
Figure 7: Development and validation of the prognostic model. (A) A total 1915 genes were subjected to Univariate COX regression analysis. The red dots represent the gene with a significant positive relation to the overall survival (OS) of lung adenocarcinoma (LUAD), while the blue dots represented the gene showing a significant negative relation to the OS of LUAD. (B) Trajectories of LASSO coefficient changes for 11 genes. (C) 10-fold cross-validation for variable selection in LASSO regression analysis. (D) The change in survival state of risk score ascending sequence and the expression trend of 11 genes in TCGA-LUAD. (E) The survival curve revealed the OS difference in LUAD between the two TCGA risk groups in terms of the p-value. (F) The ROC curve of the prognostic model in the TCGA-LUAD cohort. (G) The survival trend of the samples in the GSE30219 cohort is shown here by the Kaplan-Meier curve. (H) The efficacy of the prognostic model in GSE30219 cohort assessed by ROC curves. (I–K) Grouping of samples in the GSE31210, GSE19188, and GSE50081 cohorts according to the normalized risk score survival curve. (L–N) The ROC curve displaying that prognostic model predicts OS in GSE31210, GSE19188, and GSE50081 cohorts.
The relationship between different clinical features and the risk score in TCGA, where the risk score showed gender differences, was analyzed. Samples with high T stage, N stage, and AJCC stage tended to have a higher risk score, and male patients had a significantly higher risk score than females. Samples with high T stage, N stage, and AJCC stage tended to have a high risk-score. The risk score of samples at the T3 stage was significantly higher than those at T1 and T2 stages. Compared with N0 stage samples, the risk score of samples at N1 and N2 stage was significantly higher. Samples at stage IV and stage III had a significantly higher risk score than those at stage I. The risk score was also related to smoking history (Fig. 8A). Sankey diagram displayed that the samples in the high-risk group were mainly from clusters 1 and 2, and that most of the samples in cluster 3 were high-risk samples (Fig. 8B).
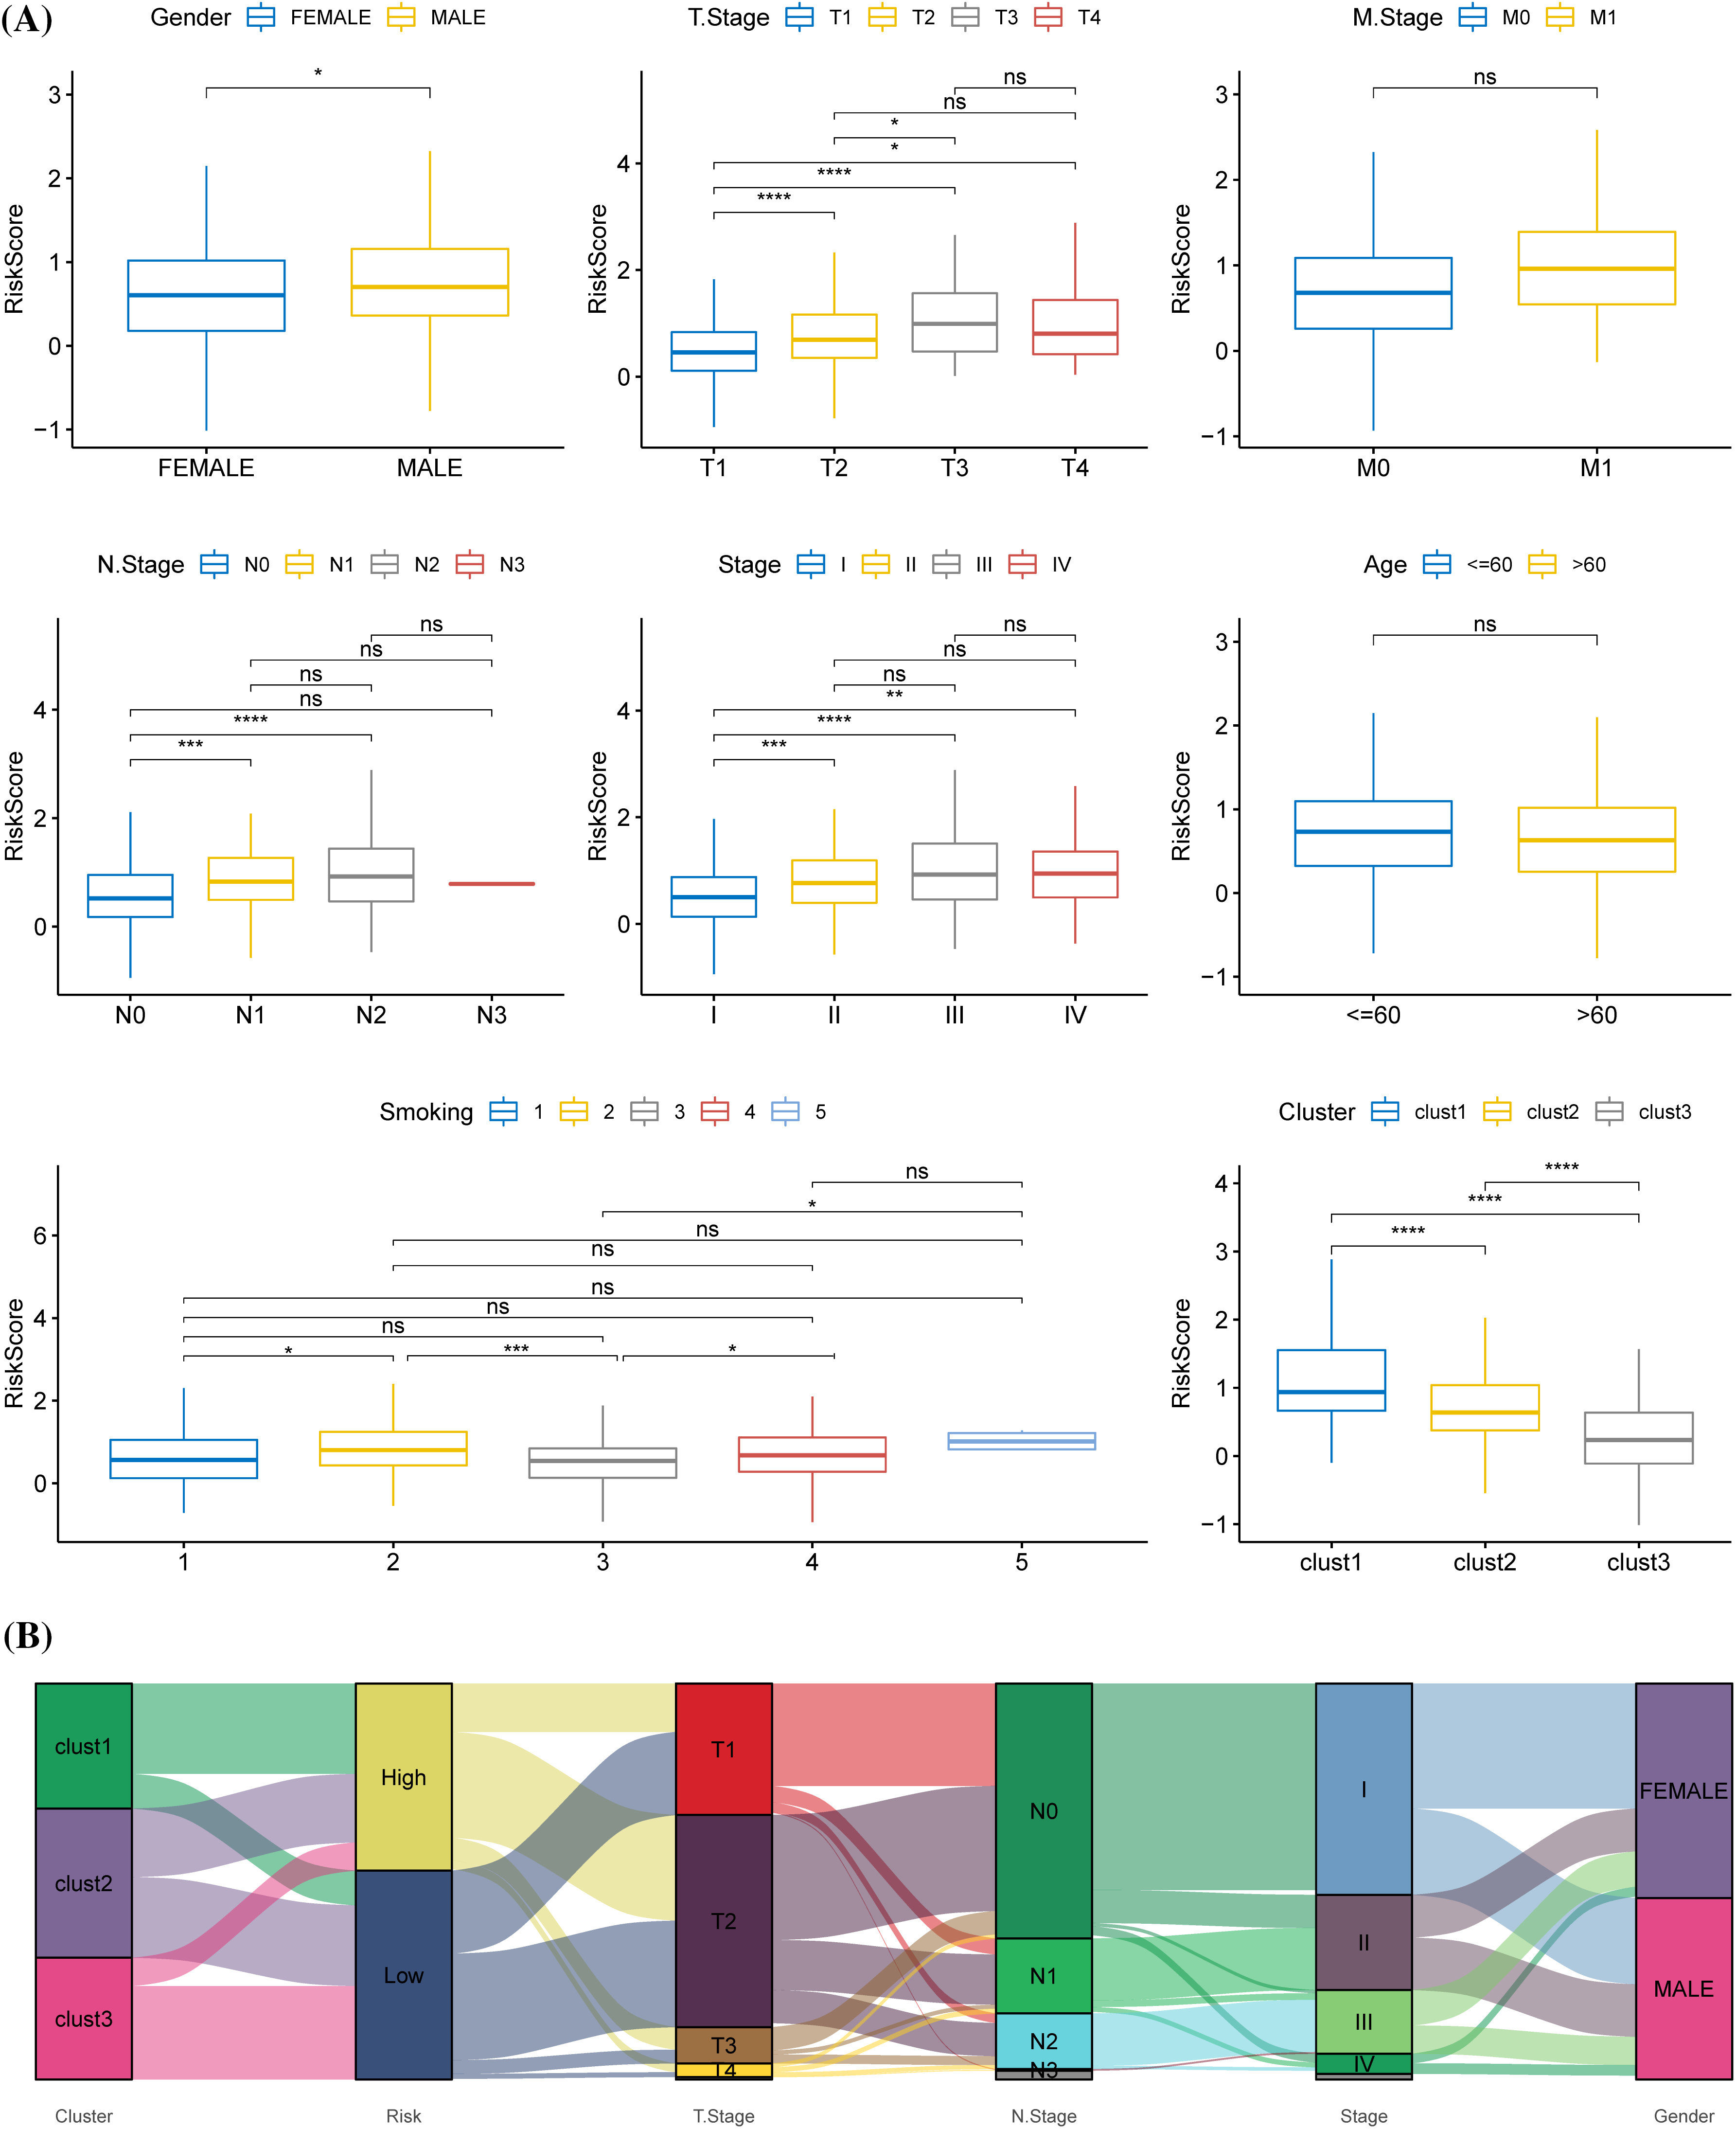
Figure 8: Relationship between prognostic model and clinical phenotypes. (A) The risk scores of samples were stratified according to different clinical characteristics (gender, T stage, M stage, N stage, American Joint Committee on Cancer (AJCC) stage, age, smoking history, molecular subtype) in The Cancer Genome Atlas. (B) Sankey diagram of risk score, molecular subtype, and distinct clinical phenotypes. *p < 0.05, **p < 0.01, ***p < 0.001, ****p < 0.0001, ns: no significance (p < 0.05).
ESTIMATE and Spearman correlation analysis showed a significantly negatively related association between risk score and immune score in the TCGA cohort (Fig. 9A). Low-risk group had a significantly higher immune score than the high-risk group (Fig. 9B). As for the three immune checkpoints CTLA4, PD-L1 and PD-1, the expression of CTLA-4 and PD-1 was significantly downregulated in high-risk group (Fig. 9C), and the TIDE score of anti-PD1 or anti-CTLA4 treatment was significantly higher in high-risk groups (Fig. 9D). Samples with a low-risk score showed greater tumor immunoreactivity as cytolytic activity and TRS score were obviously high (Figs. 9E, 9F).
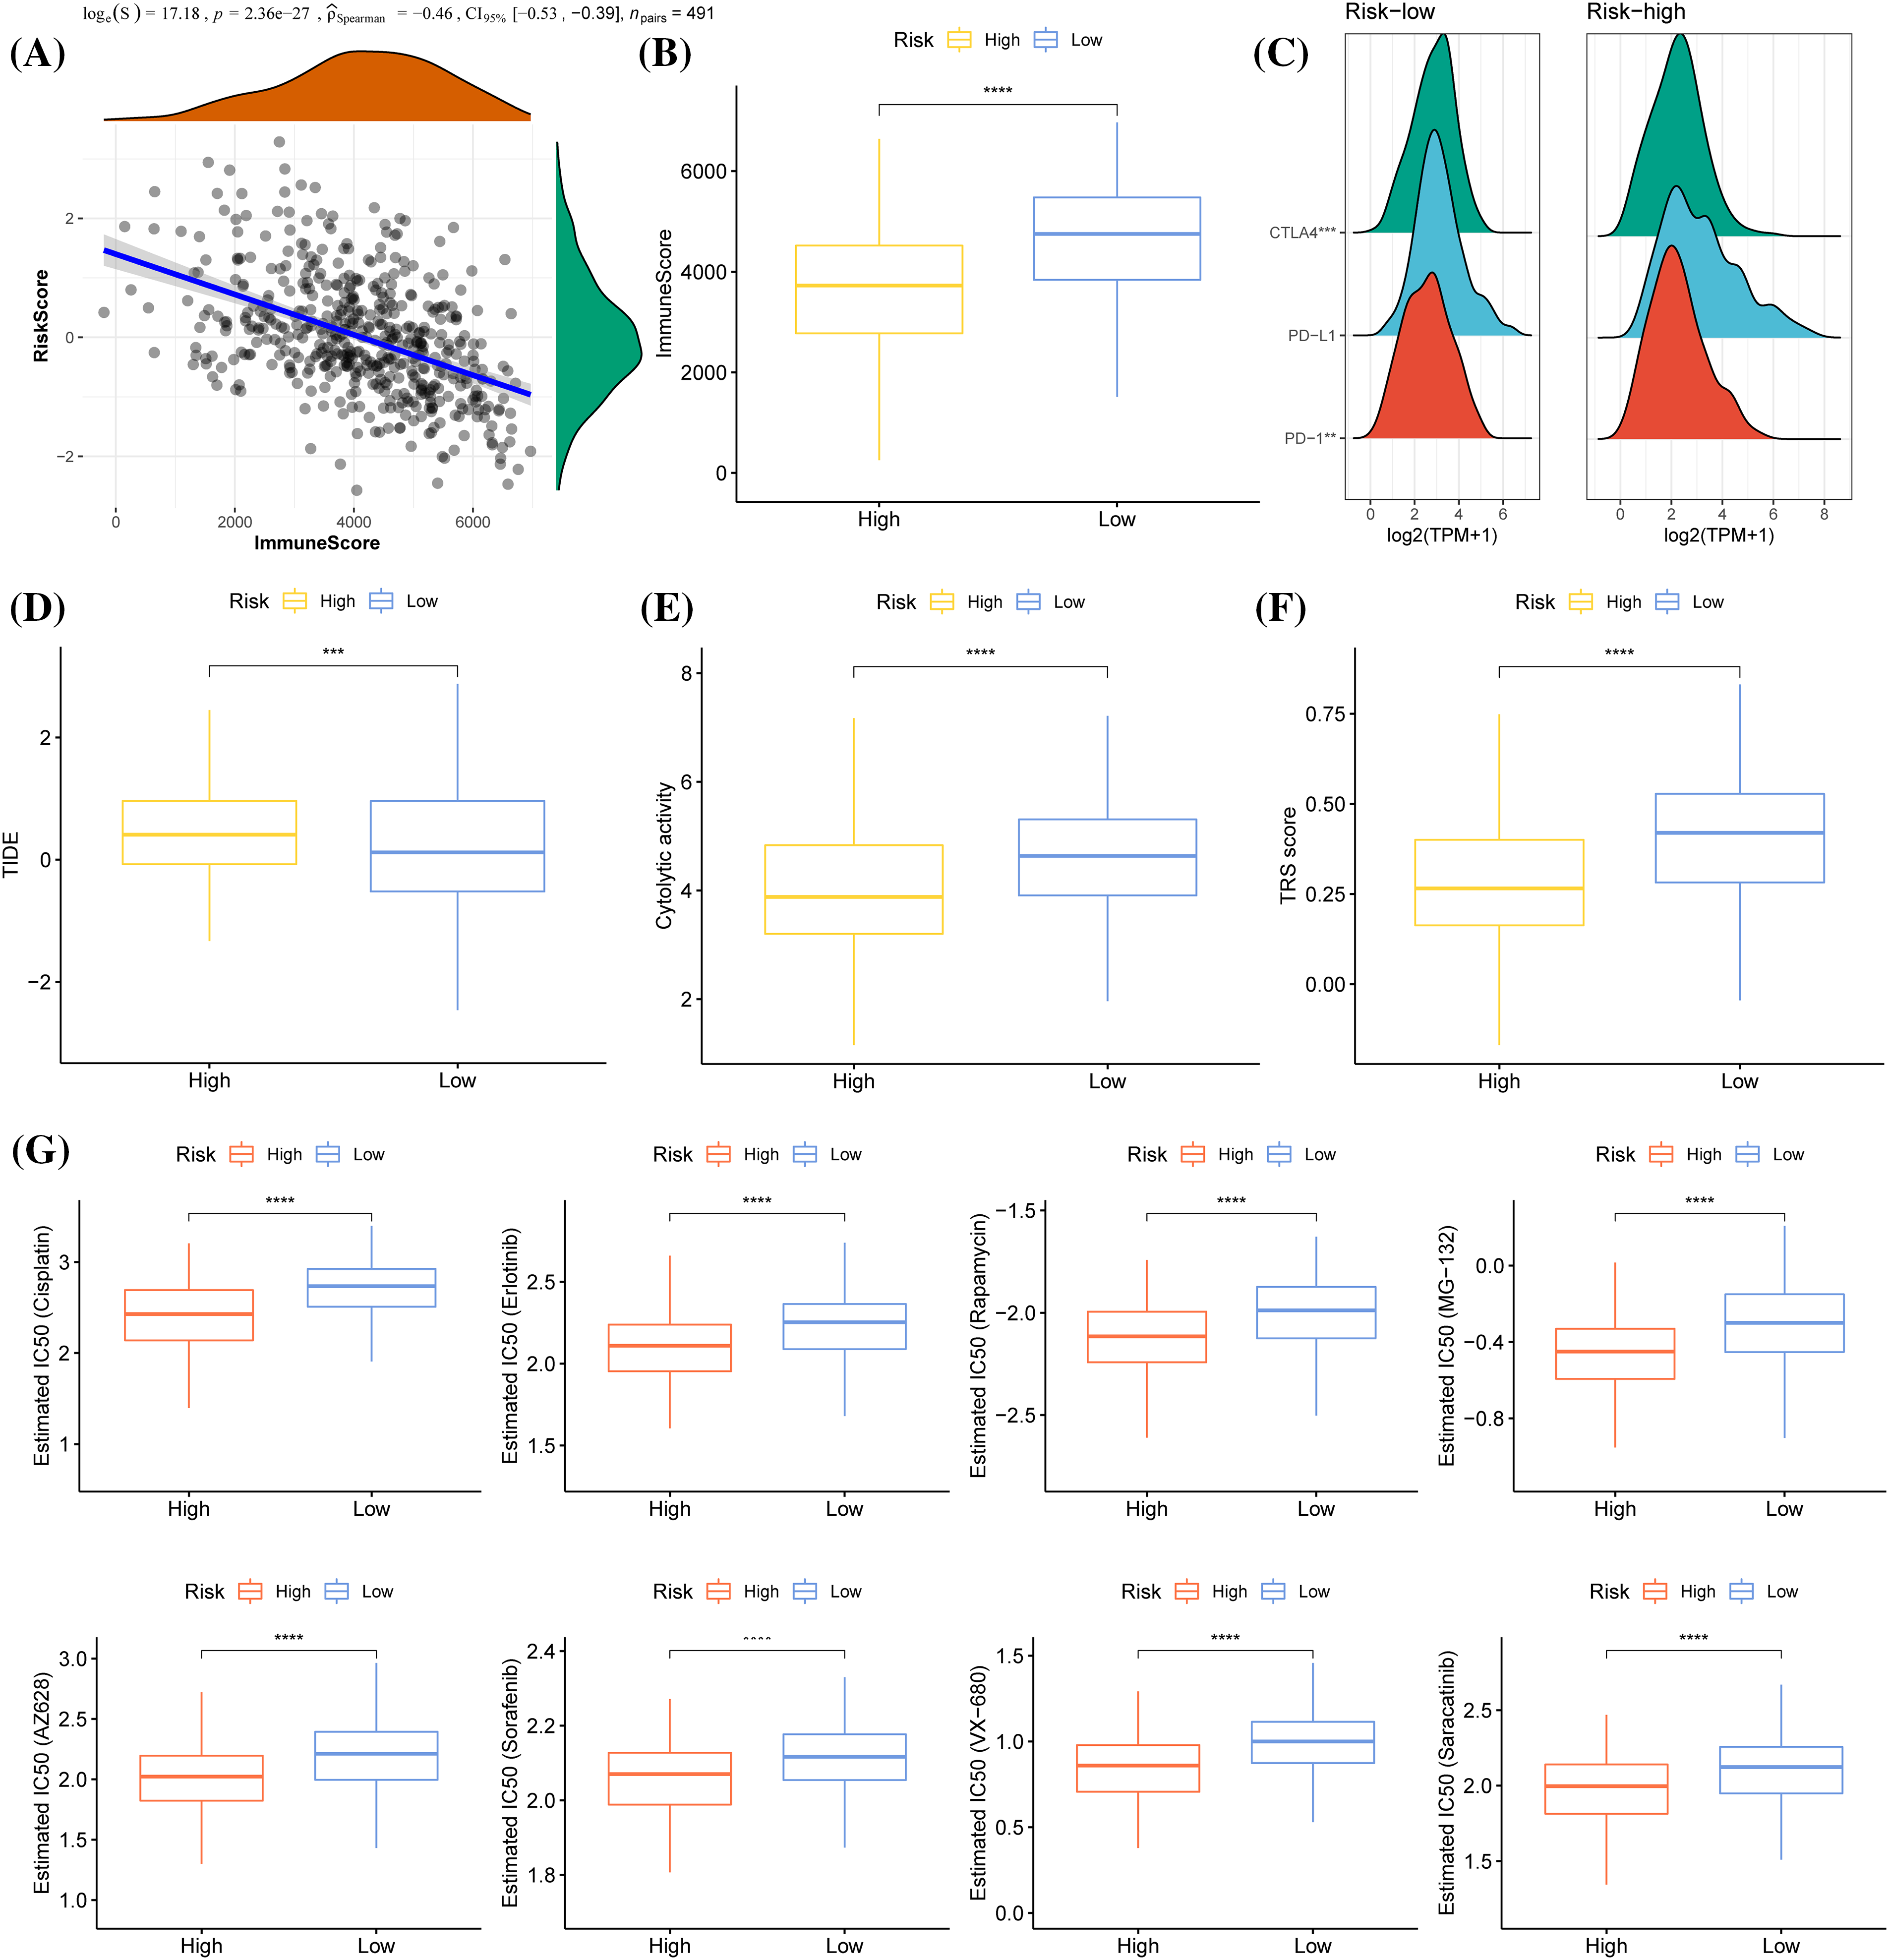
Figure 9: Immunological relevance of the prognostic model. (A) Spearman correlation analysis of risk score and immune score. (B) Immune score comparison between the two risk groups. (C) Mountain map of the expression of CTLA4, PD-L1, and PD-1 in the two risk groups. (D) The level of TIDE (Tumor Immune Dysfunction and Exclusion) score in samples showing a high-risk and low-risk score. (E) The difference in cytolytic activity between low-risk and high-risk score samples. (F) TRS score of high- and low- risk score samples. (G) A comparison of IC50 values of cisplatin, erlotinib, rapamycin, MG−132, AZ628, sorafenib, VX−680, and saracatinib between the two risk groups. ***p < 0.001, ****p < 0.0001.
We also obtained IC50 values from the Genomics of Drug Sensitivity in Cancer (GDSC) for chemotherapy drugs and targeted therapeutic drugs such as Cisplatin, Erlotinib, Rapamycin, Sorafenib, MG−132, AZ628, VX−680, and Saracatinib. It was found that the high-risk patients were closely correlated with the sensitivity of all of these drugs, while the low-risk patients were closely related to the resistance to these drugs (Fig. 9G).
According to Cox regression analysis (Figs. 10A, 10B), the risk score and AJCC stage were independent indicators for predicting the OS of LUAD and were combined to create a nomogram (Fig. 10C). The calibration curve demonstrated that the nomogram accurately predicted 1-, 3-, and 5-year OS (Fig. 10D). The DCA results showed that the nomogram had the greatest net benefit, indicating that the nomogram was the most practical indicator among other variables (Fig. 10E). The tROC and C-index also supported that the nomogram had the strongest prediction ability (Fig. 10F, Suppl. Fig. S2).
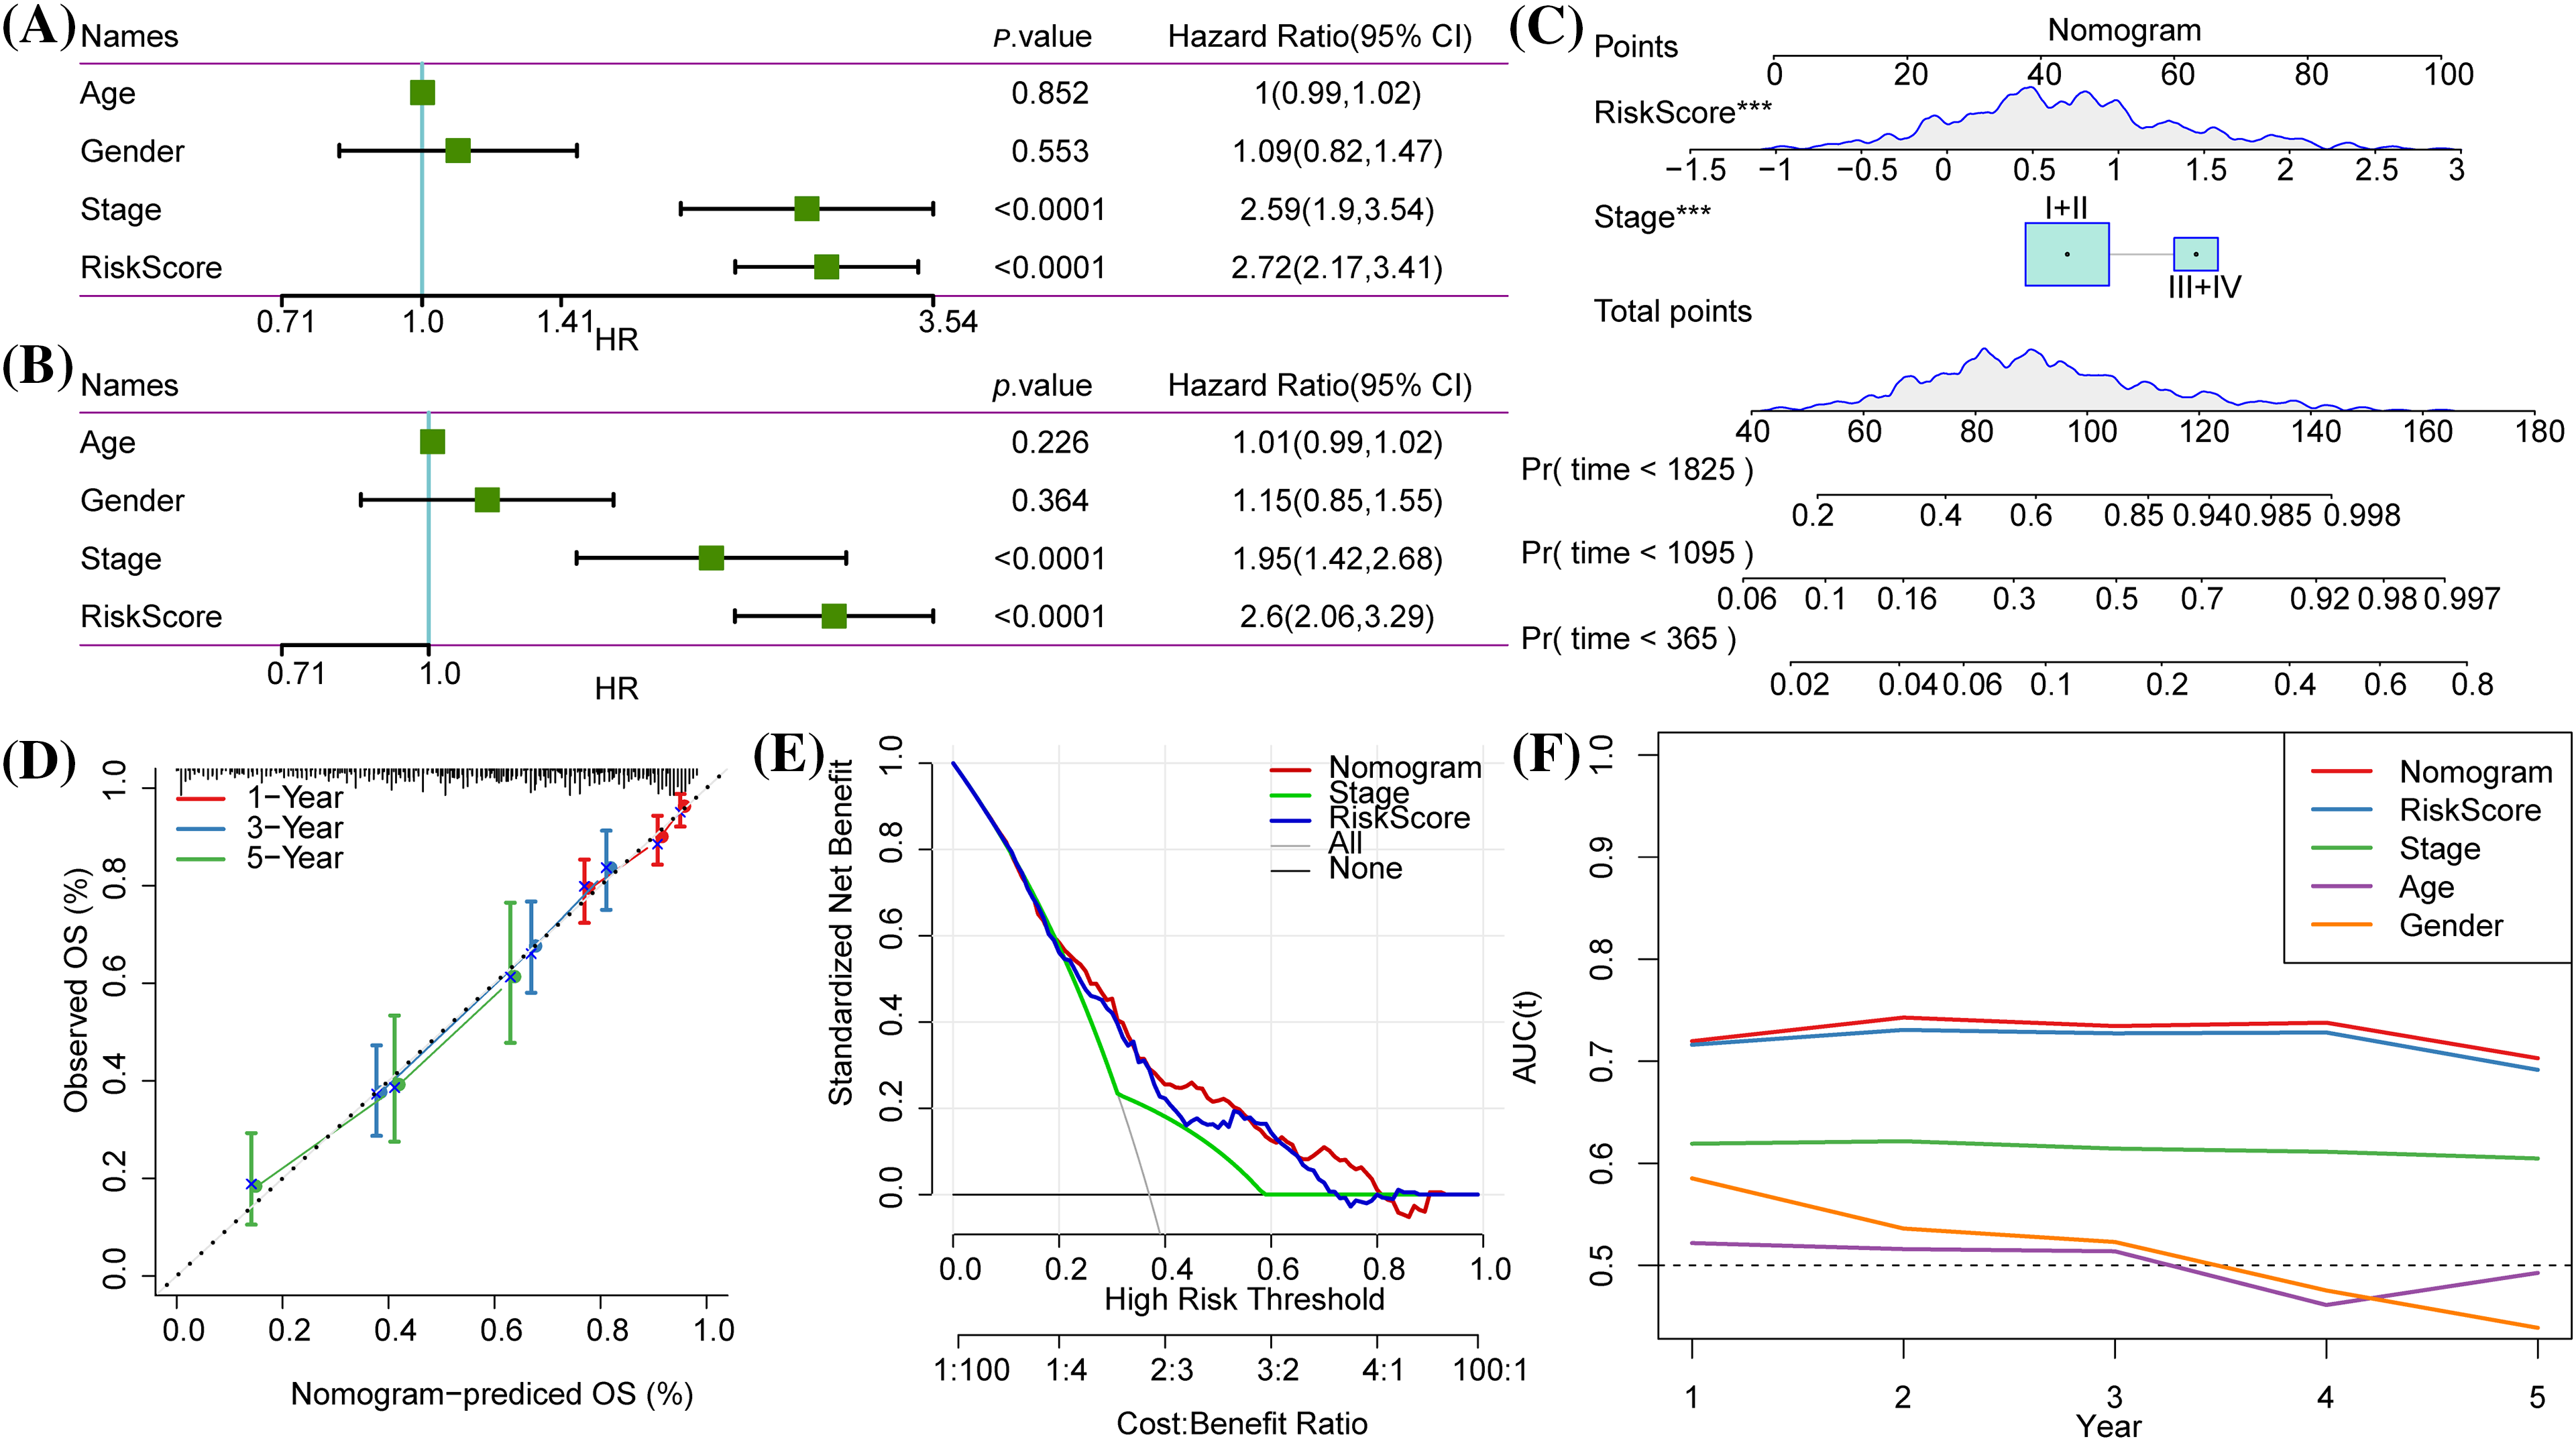
Figure 10: Independent prognostic value and development of a nomogram. (A and B) Univariate Cox and multivariate Cox regression analysis of Risk score, age and gender, and the American Joint Committee on Cancer (AJCC) stage. (C) The nomogram was constructed according to the two independent prognostic variables of lung adenocarcinoma (LUAD). (D) The calibration curve showed the 1-year, 3-year and 5-year overall survival (OS) predicted by the nomogram was close to the 45° ideal curve. (E) Net benefits of each independent prognostic factor and the nomogram quantified by decision curve analysis. (F) The time-dependent receiver operating characteristic (tROC) curves for nomogram, risk score, AJCC stage, age and gender.
We also conducted PCR to detect the mRNA expression of CD200R1, CLEC17A, ZC3H12D, GNG7, SNX30, CDCP1, NEIL3, IGF2BP1, RHOV, ABCC2, KRT81 in BEAS-2B, H1299 and A549 cell lines. In H1299 and A549 cell lines. The results showed that the expression of CD200R1, CLEC17A, ZC3H12D, GNG7 and SNX30 was significantly downregulated (Figs. 11A–11E), but that of CDCP1, NEIL3, IGF2BP1, RHOV, ABCC2 and KRT81 was upregulated (Figs. 11F–11K). Subsequently, the invasion of H1299 and A549 cell lines was detected after the interference with CD200R1 and CDCP1. Inhibition of CD200R1 significantly increased the viability of H1299 and A549 cell lines (Figs. 11L–11N). However, the viability of H1299 and A549 cell lines was significantly reduced after suppressing CDCP1 (Figs. 11O–11Q). These findings verified the reliability of the risk score model.
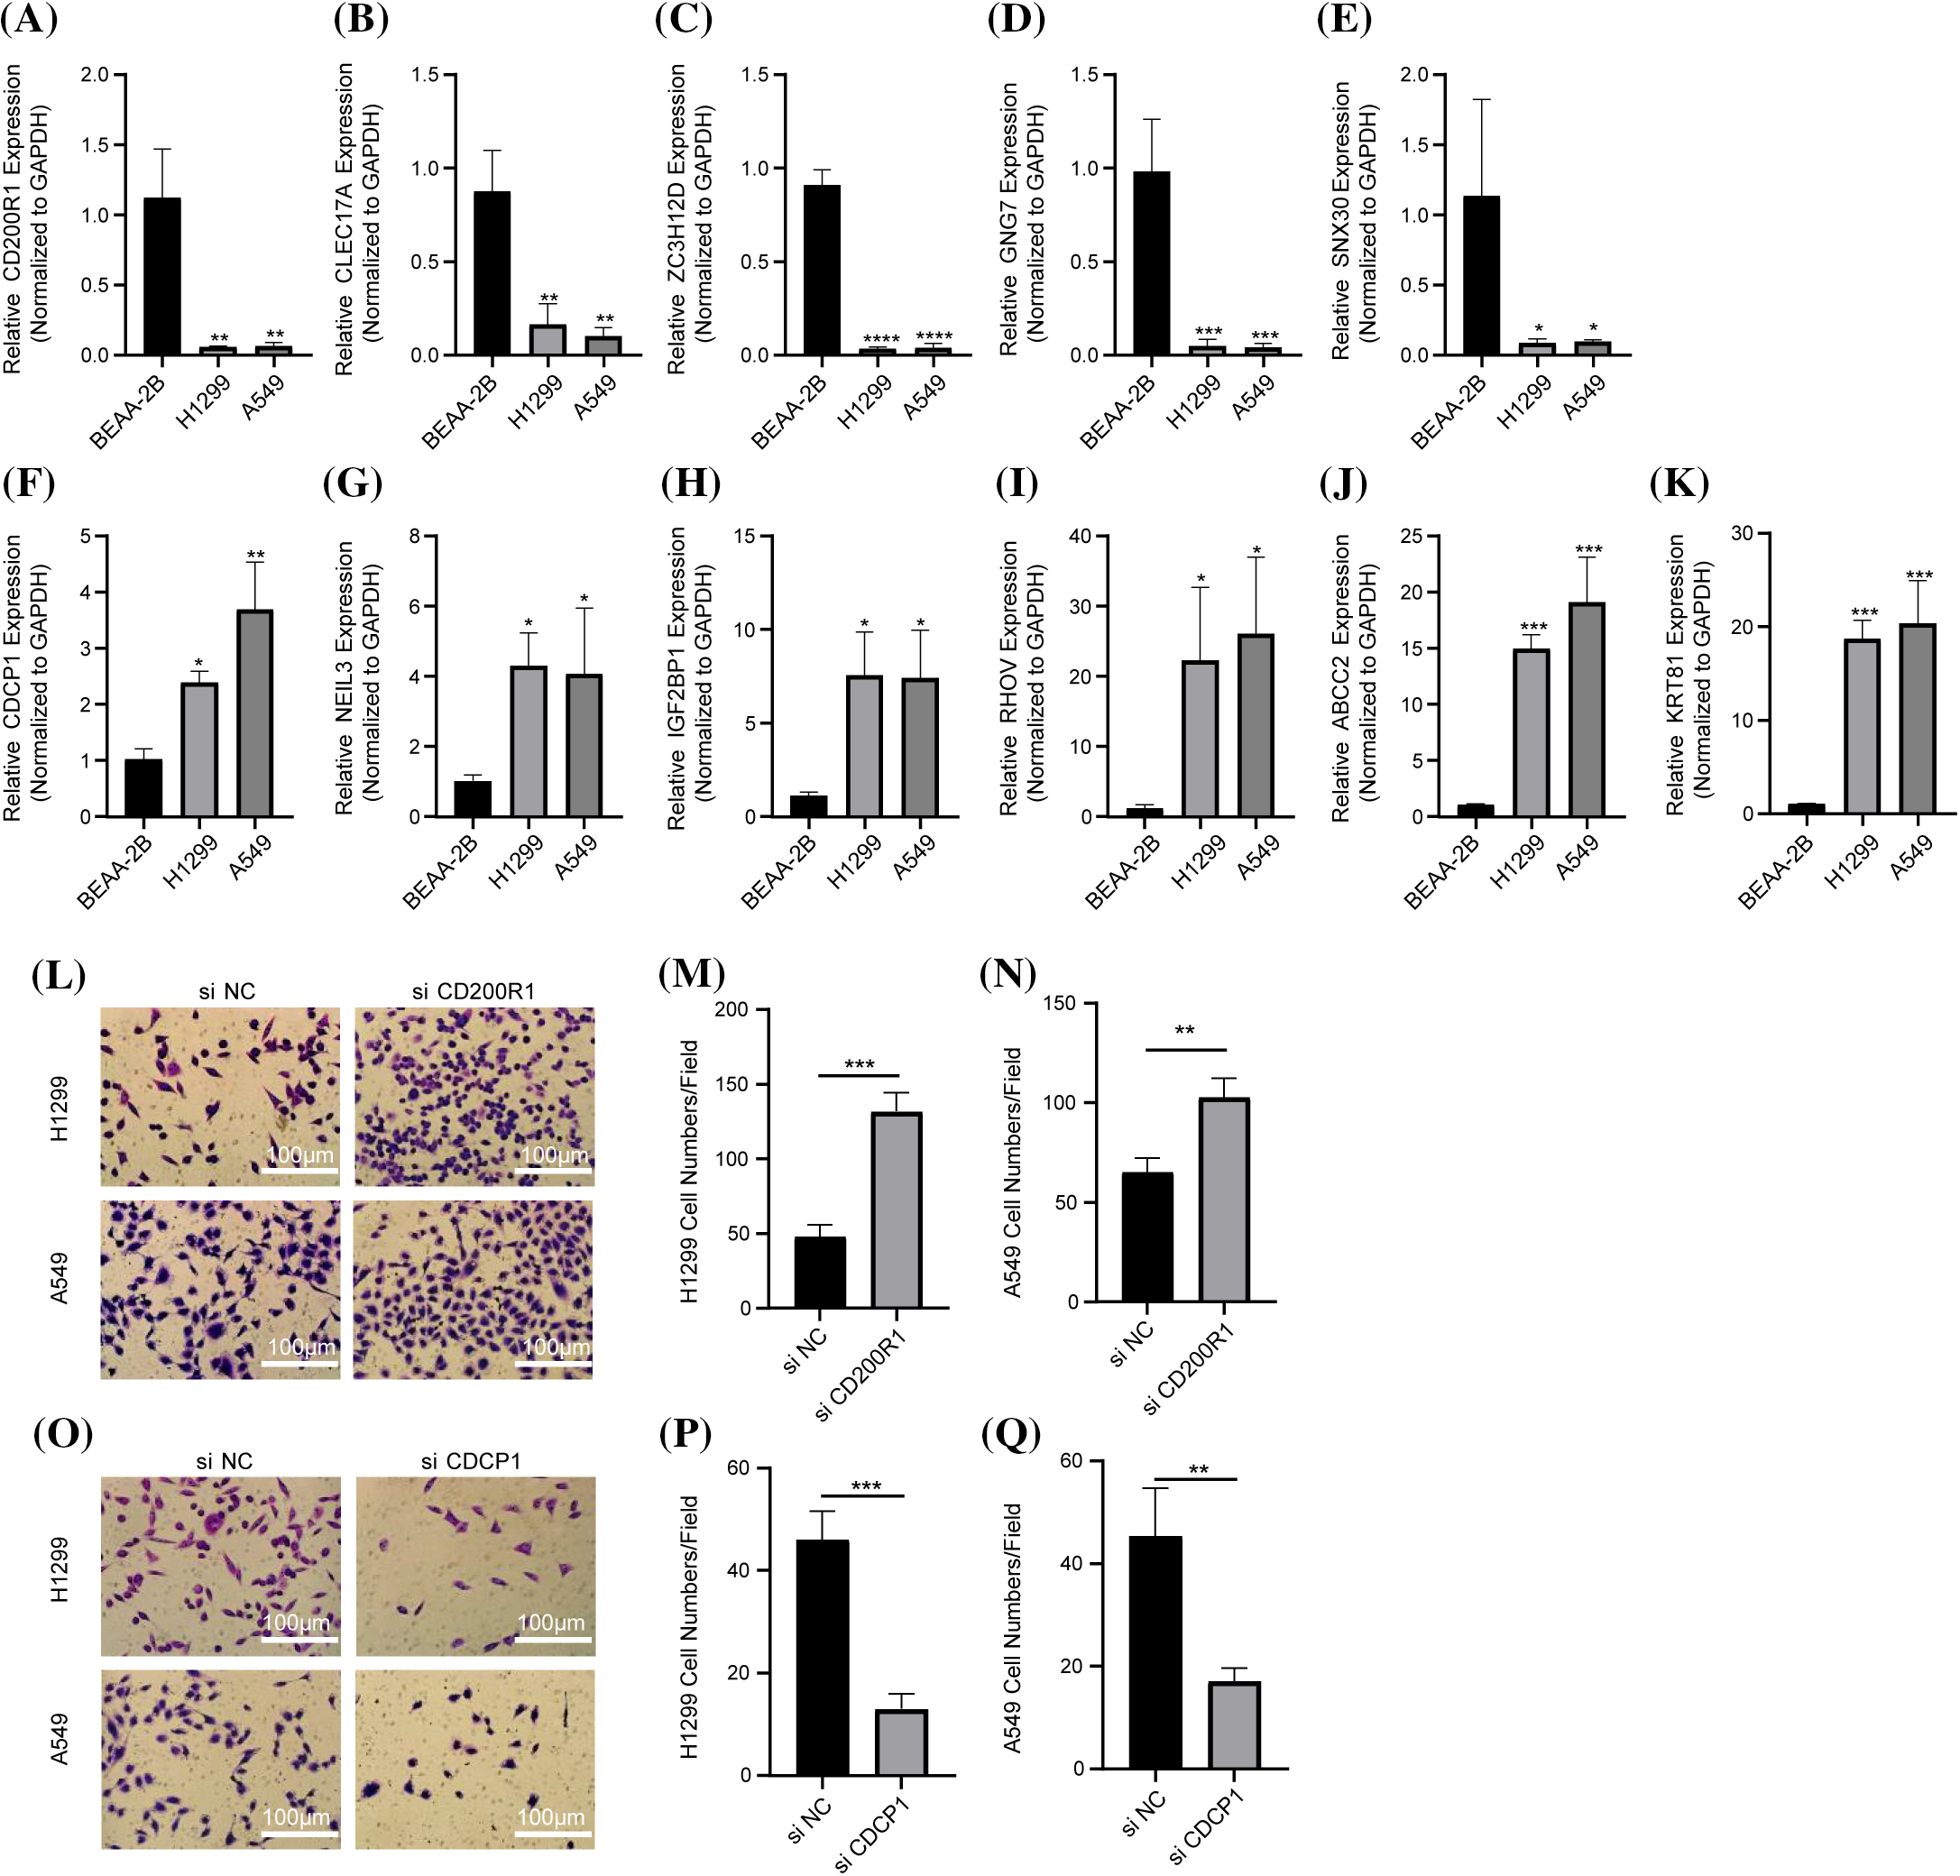
Figure 11: In vitro experiments to verify the reliability of the prognosis model. (A–K) The results of quantitative real-time polymerase chain reaction assays for CD200R1, CLEC17A, ZC3H12D, GNG7, SNX30, CDCP1, NEIL3, IGF2BP1, RHOV, ABCC2, and KRT81 in BEAS-2B, H1299 and A549 cell lines (n = 3). (L–N) Detection of invasive ability of H1299 and A549 cell lines after CD200R1 inhibition (n = 3). (O–Q) Detection of invasive ability of H1299 and A549 cell lines after the inhibition of CDCP1 expression (n = 3). *p ≤ 0.05, **p ≤ 0.01, ***p ≤ 0.001, ****p ≤ 0.0001. The results were shown as mean ± SD.
Similarly, the cell viability of H1299 and A549 cell lines was increased by inhibiting CD200R1 expression but reduced after inhibiting CDCP1 expression (Figs. 12A and 12B). To elucidate the effects of CD200R1 and CDCP1 expression on CD8+ T cells, we co-cultured tumor cell lines and CD8+ T lymphocytes using Transwell assay. The effects of knocking down CD200R1 and CDCP1 on tumor cell killing of CD8+ T cells in H1299 and A549 cell lines were analyzed. As shown in Figs. 12C–12E, knocking down CD200R1 inhibited the tumor-killing effect of CD8+ T cells, whereas knocking down CDCP1 enhanced the killing ability of CD8+ T cells. In addition, we examined the expression of surface markers CD69 and CD25 in CD8+ T cells after 24-h of co-culturing. CD69 is widely recognized as an activation marker for T cells, and its expression level reflects the killing capacity of CD8+ T cells. CD25 is an activation marker for regulatory T cells that reflects the immunosuppressive function of T cells. When CD200R1 was inhibited in H1299 and A549 cell lines, the results showed that the expression level of CD69 on the surface of CD8+ T cells was downregulated, but that of CD25 was upregulated. In contrast, when CDCP1 was inhibited in the H1299 and A549 cell lines, the level of CD69 on the surface of CD8+ T cells was increased, whereas CD25 expression was decreased (Figs. 12F–12J).
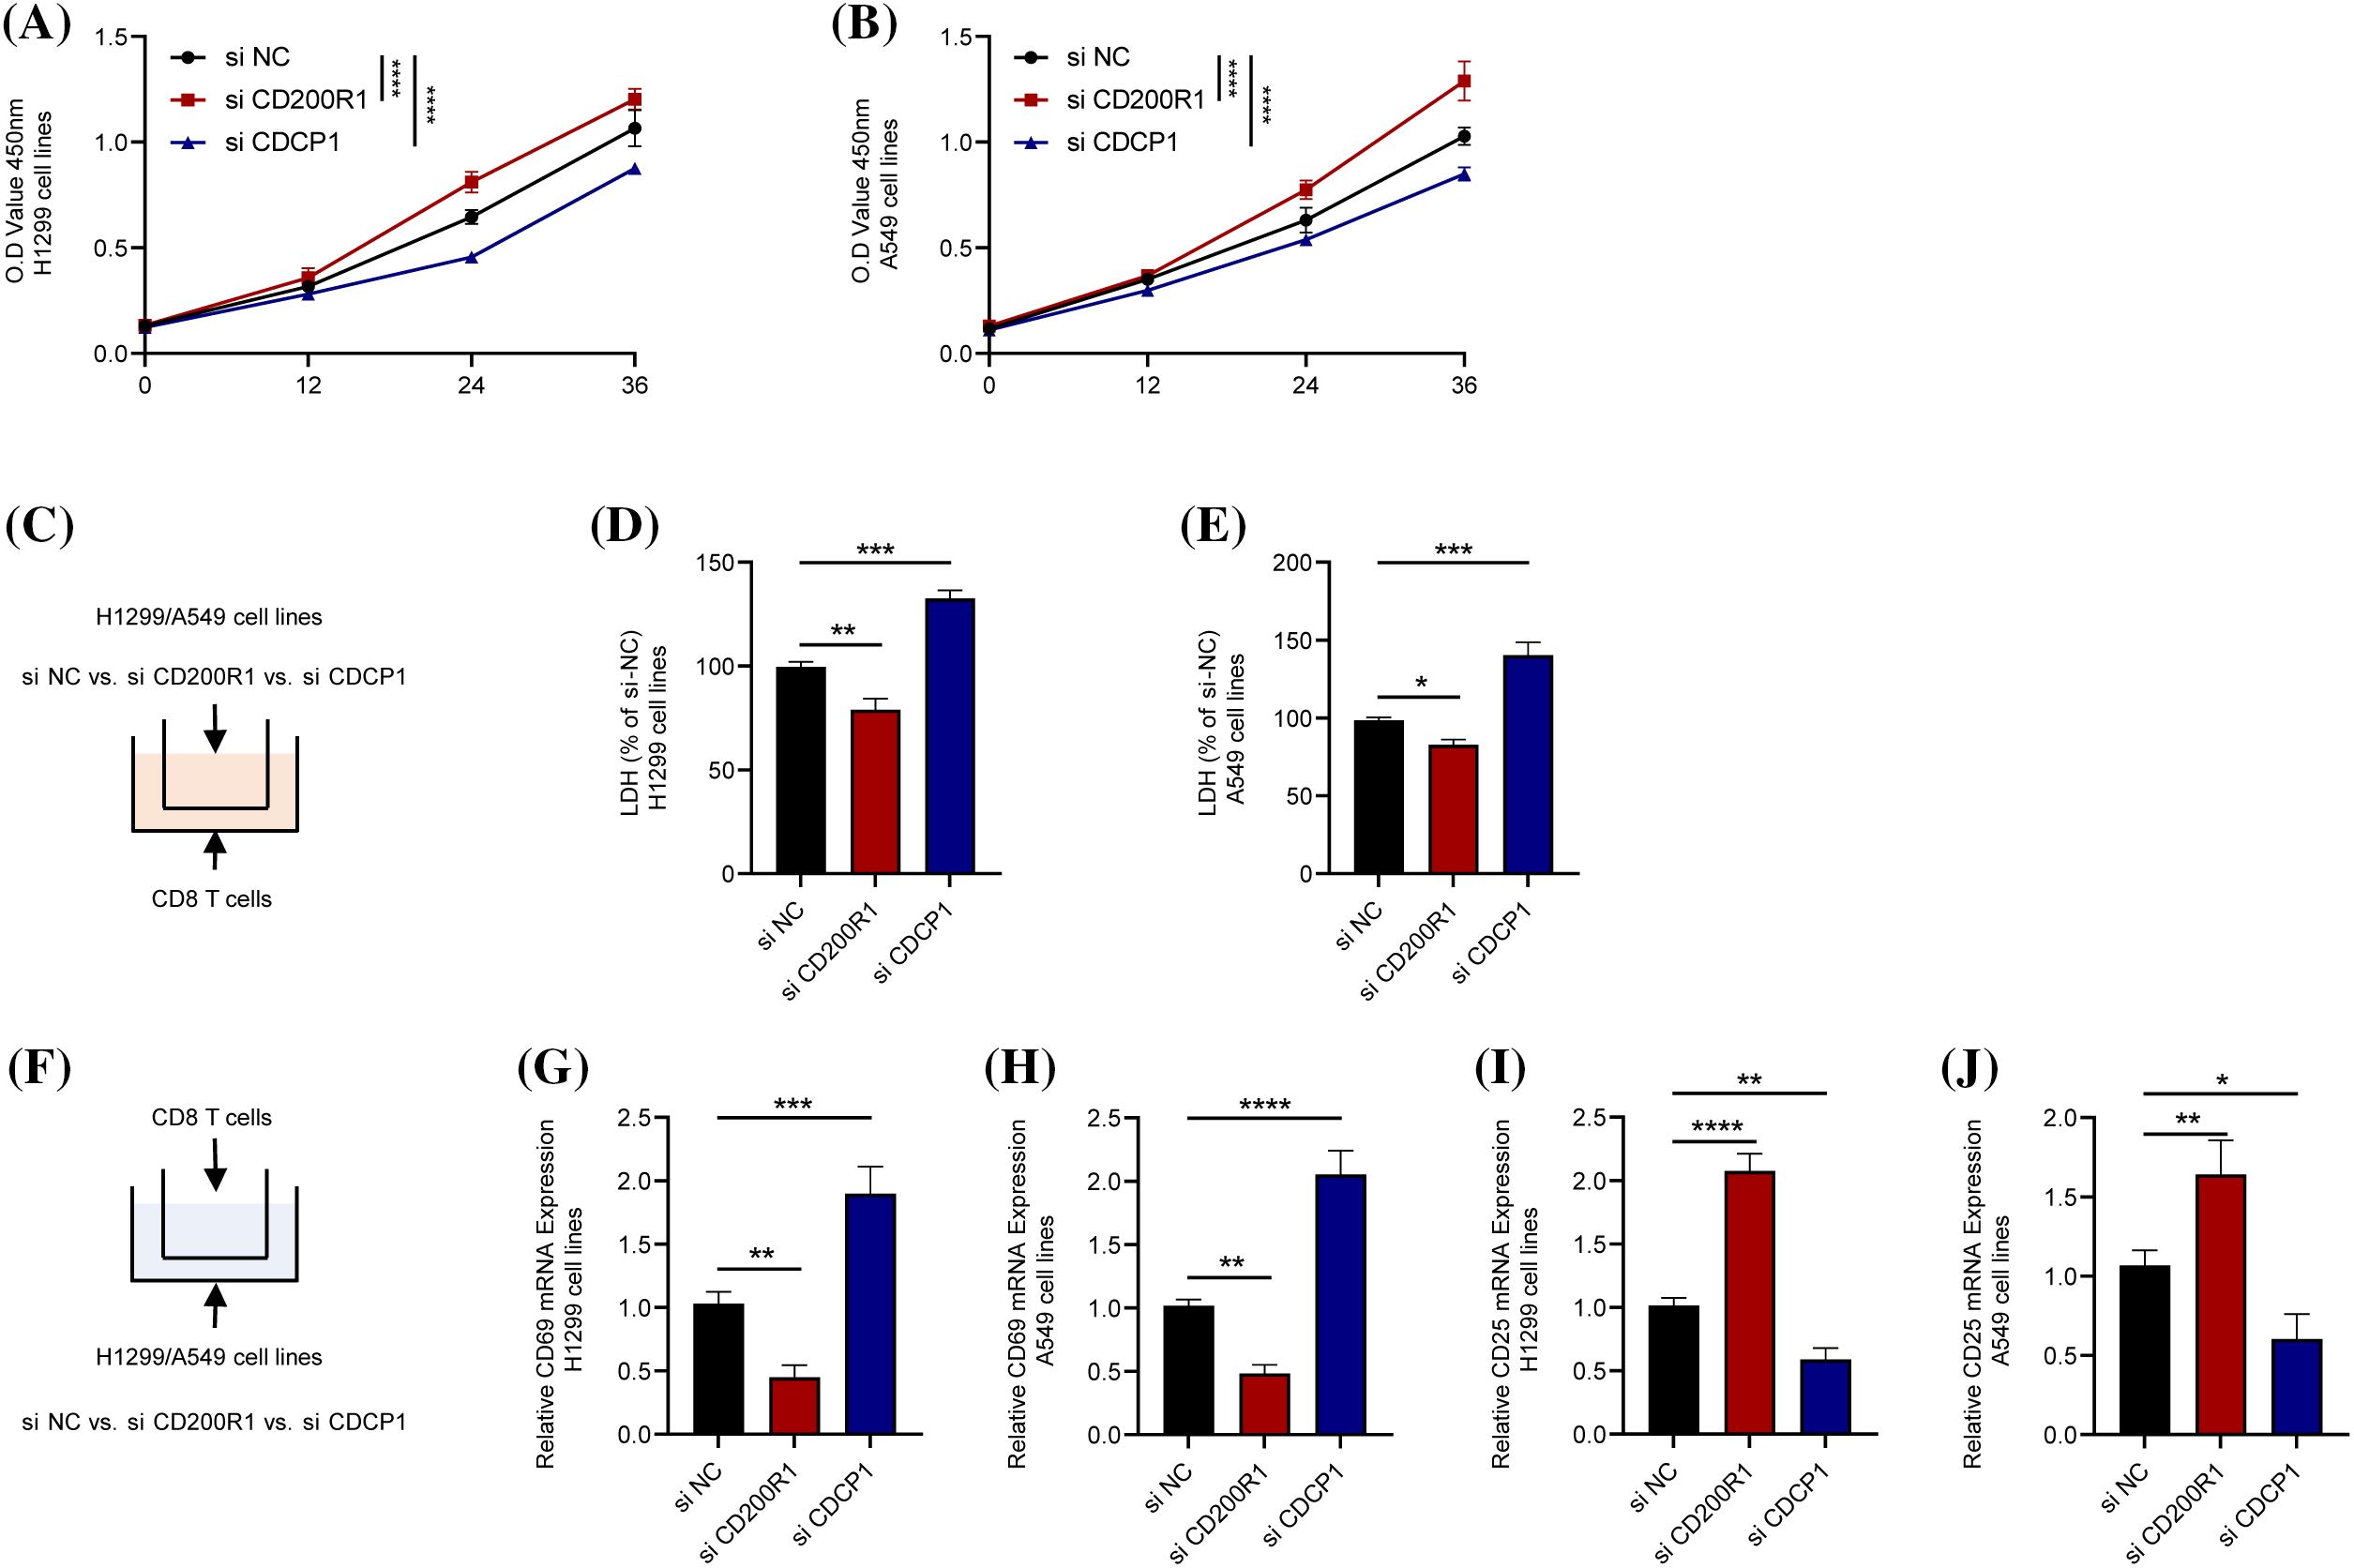
Figure 12: Contrasting effects of genes CD200R1 and CDCP1 on CD8+ T cells. (A and B) Alterations in cell viability after knockdown of CD200R1 and CDCP1 expression in H1299 and A549 cell lines, respectively, and OD value was determined at 0, 12, 24, and 36 h (n = 3). (C) Transwell assay was carried out to construct a co-culture system for tumor cell lines and CD8+ T lymphocytes. (D–E) Changes in the killing ability of CD8+ T cells for H1299 and A549 after knockdown of CD200R1 and CDCP1 expression in H1299 and A549 cell lines, respectively. The relative quantification of lactate dehydrogenase (LDH) concentration was also analyzed (n = 3). (F) Schematic representation of the co-culture system showing the expression of surface markers in CD8+ T cells. (G–J) Quantitative real-time-polymerase chain reaction was performed to detect changes in the surface markers CD69 and CD25 on CD8+ T cells co-cultured with H1299 and A549 cell lines after knocking down CD200R1 and CDCP1 expression, respectively, and analyzed for relative quantification (n = 3). *p ≤ 0.05, **p ≤ 0.01, ***p ≤ 0.001, ****p ≤ 0.0001. The results are presented as mean ± SD.
LUAD is characterized by different molecular pathways [29]. Assessment of intratumoral immune infiltration within a tumor enables more precise stratification of patients, and advances in immunotherapy are largely dependent on a better understanding of these cells [30]. CD8+ T cells are a crucial component of tumor-infiltrating immune cells, and therefore, an active anti-tumor immune response controlled by CD8+ T cells may be a prerequisite for the efficacy of specific immunotherapy in LUAD [31]. CD8+ T cells have several subsets with varied phenotype, function, and gene expression in cancer tissues [32]. Liu et al. indicated that low expression of CD8+ tumor-infiltrating lymphocytes is predictive of a poor OS for patients with lacunar LUAD [33]. By analyzing scRNA-seq data from three LUAD tissues and their paired paracancarcinoma tissues, CD8+ T cells were screened and classified into two clusters.
Analysis of large-scale molecular profiles redefines the pathological categorization of lung cancer and helps discover novel molecular targets for treating some particular lung cancer patients [34]. In recent years, new subtypes and risk models have been increasingly defined based on immune cell-associated genes for predicting the prognosis of patients with different cancers. For example, pancreatic cancer patient samples could be divided into two subtypes using prognostically significant genes related to immunity [35]. Moreover, pancreatic cancer is classified into two subtypes using the immune cell-related expression profiling data of TCGA and GEO databases, and a total of 10 genes related to CD8+ T cells are found to be effective in predicting patients’ prognosis [36]. The current study analyzed the bulk RNA-seq data of LUAD samples from TCGA and discovered that cluster 0 of CD8+ T cells was significantly related to LUAD prognosis. In WGCNA, 42 genes significantly correlated with LUAD prognosis were screened from the brown gene module, showing the strongest correlation with cluster 0. Consensus cluster analysis further classified LUAD into three subtypes based on the expression profiles of the 42 genes.
LUAD exhibits a high degree of heterogeneity at the clinical, regulatory mechanism, cellular, and molecular levels [37]. An in-depth understanding of how genetic alterations and TME influence the occurrence and therapeutic response of LUAD is critical for developing new therapies for cancer [8]. This study analyzed the heterogeneity of clinical phenotypes, mutations, regulatory pathways, and immune cellular and molecular characteristics in TME among the three clusters of LUAD. Significant differences were noted in T-stage distribution, survival status and prognosis. The survival of cluster 3 was the most favorable and that of cluster 1 was the worst. As for genetic variation, genes with the most frequent mutations significantly differed in their mutation rates among the three molecular clusters in terms of HRDs, fraction altered, and the number of segments. These genomic mutation-related events were the lowest in cluster 3, with significantly lower TME than that of cluster 1. We also found that many pathways regulating immune response (inflammatory response, allograft rejection, complement, and interferon alpha/gamma response) were significantly inhibited in cluster 1 but strongly activated in cluster 3. More importantly, the three molecular clusters also manifested significant differences in immune score, infiltration of many kinds of immune cells, the expressions of immune checkpoints, and signal molecules in immune pathways. Generally, these immune cells and immune molecular indexes were the highest in cluster 3. Some of these indicators are associated with the anti-tumor or pro-tumor properties in cancers. CD8+ T cells, M1 macrophages and M2 macrophages account for a large proportion of TME. M1 macrophages have anti-tumor properties, while M2 macrophages are considered to have tumor-promoting properties [38]. In this study, we observed that cluster 3 had the highest CD8+ T cell score and M2 macrophage score, and the lowest M1 macrophage score. The expressions of inhibitory immune checkpoint molecules, such as B- and T-Lymphocyte Attenuator (BLTA), cytotoxic T lymphocyte-associated antigen-4 (CTLA-4), T cell immunoreceptor with Ig and immunoreceptor tyrosine-based inhibitory domains (TIGIT), PD-1, and Lymphocyte activation gene 3 (LAG-3) [39,40], were also significantly higher in cluster 3 than in the other two clusters. These findings could explain the most favorable prognosis of cluster 3.
Risk-based screening is a common method to evaluate patients’ prognosis. Considering a high heterogeneity among the three clusters, Lasso and Cox analysis was performed to screen 11 genes (ZC3H12D, SNX30, RHOV, NEIL3, KRT81, IGF2BP1, GNG7, CLEC17A, CDCP1, CD200R1, and ABCC2) to develop a prognostic model for LUAD. Among these genes, ZC3H12D alone could serve as a biomarker to indicate the prognostic and immunotherapeutic relevance for LUAD patients. Yang et al. showed that ZC3H12D is highly-expressed in LUAD tissues, and that its expression level is correlated with a higher cancer stage and poor survival [41]. RHOV can increase the proliferation, migration, and invasion of LUAD cells, and overexpressed RHOV results in a shorter OS of LUAD [42]. NEIL3 is associated with poorer clinical characteristics (including stage, and T and N classifications) and unfavorable prognosis. NEIL3 promotes the development of NSCLC and affects immunotherapy sensitivity [43]. KRT81 has emerged as a novel immunohistochemical marker for squamous cell lung carcinoma [44]. The expression of GNG7 is downregulated in LUAD, and is thus strongly related to B-cell infiltration and a poor patient prognosis [45]. A previous risk model created using three immune signature genes, including CLEC17A, could effectively estimate the prognostic outcomes for LUAD patients [46]. An elevated level of CDCP1 is also associated with the development of lung cancer, independent of smoking history [47]. Knocking down CD200R1 suppresses NSCLC cell proliferation, and its expression is related to an unfavorable prognosis [48]. In addition, upregulated ABCC2 in cisplatin-resistant lung cancer cell lines could promote G1-phase blockade, suggesting that downregulating ABCC2 expression is an important agent to increase the sensitivity of NSCLC to cisplatin [49]. However, studies on SNX30 and IGF2BP1 in LUAD are still limited. These results suggest that mining prognostic genes based on the characteristics of CD8+ T cells are highly effective in assessing the immunotherapy benefit to LUAD patients and predicting patients’ prognosis.
To conclude, this study defined two clusters related to CD8+ T cells by performing scRNA-seq analysis. Further analysis of bulk RNA-seq data showed that CD8+ T cell cluster 0 was closely involved in the prognosis of LUAD. Using the prognostic genes related to cluster 0, LUAD was further classified into three clusters (clusters 1, 2, and 3). Finally, a universally applicable, effective, and accurate prognostic model for LUAD was created.
Acknowledgement: None.
Funding Statement: The authors received no specific funding for this study.
Author Contributions: HMC and YX conducted statistical analyses of the data and prepared the draft manuscript. FW and GYL edited the manuscript. YLZ and JWG critically reviewed the manuscript. All authors have checked and proofread the final version of the manuscript.
Availability of Data and Materials: The datasets generated during and analyzed during the current study are available from the corresponding author upon reasonable request.
Ethics Approval: Not applicable.
Conflicts of Interest: The authors have declared that no competing interests exist.
Supplementary Materials: The supplementary material is available online at https://doi.org/10.32604/biocell.2024.048946.
References
1. Siegel RL, Miller KD, Jemal A. Cancer statistics, 2020. CA Cancer J Clin. 2020;70(1):7–30 [Google Scholar] [PubMed]
2. Wang H, Fang J, Wang Y, Li S, Wang Z, He W, et al. Gene editing in non-small cell lung cancer: current application and future perspective. Oncologie. 2022;24(1):65–83. [Google Scholar]
3. Kadara H, Scheet P, Wistuba II, Spira AE. Early events in the molecular pathogenesis of lung cancer. Cancer Prev Res. 2016;9(7):518–27. [Google Scholar]
4. Mainardi S, Mijimolle N, Francoz S, Vicente-Duenas C, Sanchez-Garcia I, Barbacid M. Identification of cancer initiating cells in K-Ras driven lung adenocarcinoma. Proc Natl Acad Sci USA. 2014;111(1):255–60 [Google Scholar] [PubMed]
5. Ortega MA, Navarro F, Pekarek L, Fraile-Martinez O, Garcia-Montero C, Saez MA, et al. Exploring histopathological and serum biomarkers in lung adenocarcinoma: clinical applications and translational opportunities (Review). Int J Oncol. 2022;61(6):154. doi:10.3892/ijo.2022.5444 [Google Scholar] [PubMed] [CrossRef]
6. Maitra R, Malik P, Mukherjee TK. Targeting estrogens and various estrogen-related receptors against non-small cell lung cancers: a perspective. Cancers. 2021;14(1):80. doi:10.3390/cancers14010080 [Google Scholar] [PubMed] [CrossRef]
7. Denisenko TV, Budkevich IN, Zhivotovsky B. Cell death-based treatment of lung adenocarcinoma. Cell Death Dis. 2018;9(2):117 [Google Scholar] [PubMed]
8. Seguin L, Durandy M, Feral CC. Lung adenocarcinoma tumor origin: a guide for personalized medicine. Cancers. 2022;14(7):1759. doi:10.3390/cancers14071759 [Google Scholar] [PubMed] [CrossRef]
9. Succony L, Rassl DM, Barker AP, McCaughan FM, Rintoul RC. Adenocarcinoma spectrum lesions of the lung: detection, pathology and treatment strategies. Cancer Treat Rev. 2021;99:102237 [Google Scholar] [PubMed]
10. Chen Y, Wu H, Jiao A, Tong J, Zhu J, Zhang M, et al. Chinese herbal prescription QYSL prevents progression of lung cancer by targeting tumor microenvironment. Oncologie. 2022;24(2):295–307. [Google Scholar]
11. Djenidi F, Adam J, Goubar A, Durgeau A, Meurice G, de Montpreville V, et al. CD8+CD103+ tumor-infiltrating lymphocytes are tumor-specific tissue-resident memory T cells and a prognostic factor for survival in lung cancer patients. J Immunol. 2015;194(7):3475–86 [Google Scholar] [PubMed]
12. Li K, Zhang Q, Zhang Y, Yang J, Zheng J. T-cell-associated cellular immunotherapy for lung cancer. J Cancer Res Clin Oncol. 2015;141(7):1249–58 [Google Scholar] [PubMed]
13. Durgeau A, Virk Y, Corgnac S, Mami-Chouaib F. Recent advances in targeting CD8 T-cell immunity for more effective cancer immunotherapy. Front Immunol. 2018;9:14 [Google Scholar] [PubMed]
14. Corgnac S, Boutet M, Kfoury M, Naltet C, Mami-Chouaib F. The emerging role of CD8+ tissue resident memory T (TRM) cells in antitumor immunity: a unique functional contribution of the CD103 integrin. Front Immunol. 2018;9:1904 [Google Scholar] [PubMed]
15. Lv LH, Lu JR, Zhao T, Liu JL, Liang HQ. A CD8+ T cell-related genes expression signature predicts prognosis and the efficacy of immunotherapy in breast cancer. J Mammary Gland Biol Neoplasia. 2022;27(1):53–65 [Google Scholar] [PubMed]
16. Wu Y, Meng L, Cai K, Zhao J, He S, Shen J, et al. A tumor-infiltration CD8+ T cell-based gene signature for facilitating the prognosis and estimation of immunization responses in HPV+ head and neck squamous cell cancer. Front Oncol. 2021;11:749398 [Google Scholar] [PubMed]
17. Lin Y, Chen D, Ding Q, Zhu X, Zhu R, Chen Y. Progress in single-cell RNA sequencing of lung adenocarcinoma. Zhongguo Fei Ai Za Zhi. 2021;24(6):434–40 (In Chinese) [Google Scholar] [PubMed]
18. Butler A, Hoffman P, Smibert P, Papalexi E, Satija R. Integrating single-cell transcriptomic data across different conditions, technologies, and species. Nat Biotechnol. 2018;36(5):411–20 [Google Scholar] [PubMed]
19. Dianzani U, Luqman M, Rojo J, Yagi J, Baron JL, Woods A, et al. Molecular associations on the T cell surface correlate with immunological memory. Eur J Immunol. 1990;20(10):2249–57 [Google Scholar] [PubMed]
20. Hanzelmann S, Castelo R, Guinney J. GSVA: gene set variation analysis for microarray and RNA-seq data. BMC Bioinformatics. 2013;14(1):7 [Google Scholar] [PubMed]
21. Langfelder P, Horvath S. WGCNA: an R package for weighted correlation network analysis. BMC Bioinformatics. 2008;9(1):559 [Google Scholar] [PubMed]
22. Thorsson V, Gibbs DL, Brown SD, Wolf D, Bortone DS, Ouyang TH, et al. The immune landscape of cancer. Immunity. 2018;48(4):812–30.e14 [Google Scholar] [PubMed]
23. Sanchez-Vega F, Mina M, Armenia J, Chatila WK, Luna A, La KC, et al. Oncogenic signaling pathways in the cancer genome atlas. Cell. 2018;173(2):321–37.e10 [Google Scholar] [PubMed]
24. Yoshihara K, Shahmoradgoli M, Martinez E, Vegesna R, Kim H, Torres-Garcia W, et al. Inferring tumour purity and stromal and immune cell admixture from expression data. Nat Commun. 2013;4(1):2612 [Google Scholar] [PubMed]
25. Newman AM, Liu CL, Green MR, Gentles AJ, Feng W, Xu Y, et al. Robust enumeration of cell subsets from tissue expression profiles. Nat Methods. 2015;12(5):453–7 [Google Scholar] [PubMed]
26. Rooney MS, Shukla SA, Wu CJ, Getz G, Hacohen N. Molecular and genetic properties of tumors associated with local immune cytolytic activity. Cell. 2015;160(1–2):48–61 [Google Scholar] [PubMed]
27. Jiang P, Gu S, Pan D, Fu J, Sahu A, Hu X, et al. Signatures of T cell dysfunction and exclusion predict cancer immunotherapy response. Nat Med. 2018;24(10):1550–8 [Google Scholar] [PubMed]
28. Yan M, Hu J, Ping Y, Xu L, Liao G, Jiang Z, et al. Single-cell transcriptomic analysis reveals a tumor-reactive T cell signature associated with clinical outcome and immunotherapy response in melanoma. Front Immunol. 2021;12:758288 [Google Scholar] [PubMed]
29. Yatabe Y, Borczuk AC, Powell CA. Do all lung adenocarcinomas follow a stepwise progression? Lung Cancer. 2011;74(1):7–11 [Google Scholar] [PubMed]
30. Wang H, Meng D, Guo H, Sun C, Chen P, Jiang M, et al. Single-cell sequencing, an advanced technology in lung cancer research. Onco Targets Ther. 2021;14:1895–909 [Google Scholar] [PubMed]
31. Verdegaal EM, Hoogstraten C, Sandel MH, Kuppen PJ, Brink AA, Claas FH, et al. Functional CD8+ T cells infiltrate into nonsmall cell lung carcinoma. Cancer Immunol Immunother. 2007;56(5):587–600 [Google Scholar] [PubMed]
32. Brummelman J, Mazza EMC, Alvisi G, Colombo FS, Grilli A, Mikulak J, et al. High-dimensional single cell analysis identifies stem-like cytotoxic CD8+ T cells infiltrating human tumors. J Exp Med. 2018;215(10):2520–35 [Google Scholar] [PubMed]
33. Liu J, Gu M, Xue Y, Wang Q, Ren Y, Huang W. Clinical significance of PD-L1 expression and CD8-positive tumor-infiltrating lymphocytes in patients with cavitary lung adenocarcinoma. Oncologie. 2021;23(3):439–52. [Google Scholar]
34. Rodriguez-Canales J, Parra-Cuentas E, Wistuba II. Diagnosis and molecular classification of lung cancer. Cancer Treat Res. 2016;170:25–46 [Google Scholar] [PubMed]
35. Fei X, Kong L, Shi C, Wang G, Liu C, Wang C, et al. Identification of prognosis-related molecular subgroups and construction of a prognostic prediction model using immune-related genes in pancreatic cancer. J Oncol. 2022;2022(2):7117014–21 [Google Scholar] [PubMed]
36. Xu D, Wang Y, Chen Y, Zheng J. Identification of the molecular subtype and prognostic characteristics of pancreatic cancer based on CD8 + T cell-related genes. Cancer Immunol Immunother. 2023;72(3):647–64 [Google Scholar] [PubMed]
37. Senosain MF, Massion PP. Intratumor heterogeneity in early lung adenocarcinoma. Front Oncol. 2020;10:349 [Google Scholar] [PubMed]
38. Garrido-Martin EM, Mellows TWP, Clarke J, Ganesan AP, Wood O, Cazaly A, et al. M1hot tumor-associated macrophages boost tissue-resident memory T cells infiltration and survival in human lung cancer. J Immunother Cancer. 2020;8(2):e000778. doi:10.1136/jitc-2020-000778 [Google Scholar] [PubMed] [CrossRef]
39. Rowshanravan B, Halliday N, Sansom DM. CTLA-4: a moving target in immunotherapy. Blood. 2018;131(1):58–67 [Google Scholar] [PubMed]
40. Qin S, Xu L, Yi M, Yu S, Wu K, Luo S. Novel immune checkpoint targets: moving beyond PD-1 and CTLA-4. Mol Cancer. 2019;18(1):155 [Google Scholar] [PubMed]
41. Yang B, Ji LL, Xu HL, Li XP, Zhou HG, Xiao T, et al. Zc3h12d, a novel of hypomethylated and immune-related for prognostic marker of lung adenocarcinoma. J Inflamm Res. 2021;14:2389–401 [Google Scholar] [PubMed]
42. Zhang D, Jiang Q, Ge X, Shi Y, Ye T, Mi Y, et al. RHOV promotes lung adenocarcinoma cell growth and metastasis through JNK/c-Jun pathway. Int J Biol Sci. 2021;17(10):2622–32 [Google Scholar] [PubMed]
43. Huang H, Hua Q. NEIL3 mediates lung cancer progression and modulates PI3K/AKT/mTOR signaling: a potential therapeutic target. Int J Genomics. 2022;2022:8348499 [Google Scholar] [PubMed]
44. Campayo M, Navarro A, Viñolas N, Tejero R, Muñoz C, Diaz T, et al. A dual role for KRT81: a miR-SNP associated with recurrence in non-small-cell lung cancer and a novel marker of squamous cell lung carcinoma. PLoS One. 2011;6(7):e22509 [Google Scholar] [PubMed]
45. Wei Q, Miao T, Zhang P, Jiang B, Yan H. Comprehensive analysis to identify GNG7 as a prognostic biomarker in lung adenocarcinoma correlating with immune infiltrates. Front Genet. 2022;13:984575 [Google Scholar] [PubMed]
46. Qi X, Qi C, Qin B, Kang X, Hu Y, Han W. Immune-stromal score signature: novel prognostic tool of the tumor microenvironment in lung adenocarcinoma. Front Oncol. 2020;10:541330 [Google Scholar] [PubMed]
47. Dagnino S, Bodinier B, Guida F, Smith-Byrne K, Petrovic D, Whitaker MD, et al. Prospective identification of elevated circulating CDCP1 in patients years before onset of lung cancer. Cancer Res. 2021;81(13):3738–48 [Google Scholar] [PubMed]
48. Yoshimura K, Suzuki Y, Inoue Y, Tsuchiya K, Karayama M, Iwashita Y, et al. CD200 and CD200R1 are differentially expressed and have differential prognostic roles in non-small cell lung cancer. Oncoimmunology. 2020;9(1):1746554 [Google Scholar] [PubMed]
49. Chen Y, Zhou H, Yang S, Su D. Increased ABCC2 expression predicts cisplatin resistance in non-small cell lung cancer. Cell Biochem Funct. 2021;39(2):277–86 [Google Scholar] [PubMed]
Cite This Article
 Copyright © 2024 The Author(s). Published by Tech Science Press.
This work is licensed under a Creative Commons Attribution 4.0 International License , which permits unrestricted use, distribution, and reproduction in any medium, provided the original work is properly cited.
 Downloads
 Citation Tools