
 Submit a Paper
 Propose a Special lssue
 Open Access
ARTICLE

Identification prognostic features related to sphingolipid metabolism and experimental validation of TRIM47 in hepatocellular carcinoma
1 Department of Intensive Care Unit, The First People’s Hospital of Linping District, Hangzhou, China
2 Department of Pharmacy, The First People’s Hospital of Linping District, Hangzhou, China
* Corresponding Author: MINGHUA XIE. Email:
(This article belongs to the Special Issue: Navigating the Interplay of Cancer, Autophagy, ER Stress, Cell Cycle and Apoptosis: Mechanisms, Therapies, and Future Directions)
BIOCELL 2024, 48(4), 639-651. https://doi.org/10.32604/biocell.2024.047562
Received 09 November 2023; Accepted 14 December 2023; Issue published 09 April 2024
 View Full Text
 Download PDF
Abstract
Background: The specific impact of sphingolipid metabolism on developing hepatocellular Carcinoma (HCC) remains unclear. This study aims to explore the relationship between sphingolipid metabolism and HCC prognosis, immune response, and drug sensitivity. Methods: Data were obtained from The Cancer Genome Atlas (TCGA)-Hepatocellular Carcinoma (LIHC) and Gene Expression Omnibus (GEO, GSE14520 datasets). 47 sphingolipid metabolism genes were obtained from the Kyoto Encyclopedia of Genes and Genomes (KEGG) database. After classifying HCC samples using the Non-negative Matrix Factorization (NMF) clustering method, differentially expressed genes were screened. Then, 8 risk genes were obtained by univariate analysis, survival random forest reduction and lasso analysis. The expression of 8 risk genes was verified in vitro. Results: 8 risk genes were used to construct the Sphingolipid score model. High-Sphingolipid score predicted poor prognosis of HCC patients. Sphingolipid score was associated with immune checkpoints (IL-1B, TLR4, TGFB1, and IL-10), immune cells (Th2, Treg, MDSC, Neutrophil, Fibroblasts and macrophage), and MAPK Cascade. In the High-Sphingolipid score group, a significantly higher proportion of patients with TP53 (p53) mutations was significantly higher (56%). Furthermore, patients with a high-Sphingolipid score were predicted to have a higher sensitivity to chemotherapy drugs. In vitro validation showed that compared with normal liver cells LX-2, TRIM47, and S100A9 significantly increased in liver cancer cells Hep G2, MHCC-97H, and Hep3B2.1-7, while SLC1A7, LPCAT1, and CFHR4 significantly decreased. Silencing TRIM47 reduced the proliferation and promoted apoptosis. The levels of ceramide synthesis-related indexes (CERS1, CERS6, CERS5, and SPTLC2) increased, and the ACER3 related to catalytic hydrolysis decreased. Conclusion: We constructed a sphingolipid metabolism-related prognostic signature (Sphingolipid score) based on 8 risk genes. TRIM47 may affect the development of liver cancer by regulating the relevant indicators of ceramide synthesis and catalytic hydrolysis.Graphic Abstract

Keywords
Supplementary Material
Supplementary Material FileAccording to global cancer statistics in 2020, primary liver cancer (with Hepatocellular Carcinoma (HCC)) accounts for 75%–85% of cases) is the 6th most common cancer worldwide and the third leading cause of cancer-related deaths [1]. HCC, also known as malignant liver cancer, is a malignant tumor that is prone to spread metastasis and has a high recurrence rate. Currently, the main treatment methods for HCC patients include surgical resection, chemotherapy and immunotherapy [2]. However, due to the complexity and heterogeneity of tumors, the prognosis of HCC patients is still unsatisfactory [3]. As a result, there is a need to identify novel prognostic markers and potential therapeutic targets for HCC to provide clues for developing future treatment strategies for patients.
Sphingolipids, containing ceramide and sphingosine-1-phosphate (S1P), can be phosphorylated, acylated, glycosylated or sulfated by related metabolic enzymes to produce different subclasses [4]. Sphingolipids, as a structural molecule of the cell membrane, play a crucial role in maintaining the barrier function of cells [5]. At the same time, as an active molecule of cell signaling, some sphingolipids play an important role in regulating cell function and balance, including proliferation, migration, cell survival and angiogenesis [6–9]. In addition, sphingolipid metabolites can also be used as potential biomarkers for predicting lymph node metastasis of papillary thyroid carcinoma [10] and candidate predictors for postoperative recurrence of lung squamous cell carcinoma [11]. However, based on signals related to sphingolipid metabolism, potential targets for neurological diseases [12] and the immune status of melanoma patients [13] can be predicted. Analysis of the characteristics related to sphingolipid metabolism has not been fully explained in HCC.
We developed a prognostic risk model based on 8 sphingolipid metabolism-related genes. Sphingolipid score was associated with HCC gene mutations and the immune microenvironment. In addition, we performed a drug susceptibility analysis, which may provide a new reference for determining the prognostic risk and selecting treatment strategies in HCC patients.
Data acquisition and preprocessing
The Cancer Genome Atlas (TCGA)-Hepatocellular Carcinoma (LIHC) database (training set) was downloaded from UCSC Xena (https://xenabrowser.net/) [14]. GSE14520 database (validation set) obtained from Gene Expression Omnibus (GEO) (http://www.ncbi.nlm.nih.gov/geo/) [15]. Clinical information of the HCC patients was collected from the TCGA-LIHC. The data preprocessing procedure converted fragments per kilobase million (FPKM) to transcripts per million (TPM).
47 sphingolipid metabolism genes (hsa00600, Sphingolipid metabolism) were obtained from the Kyoto Encyclopedia of Genes and Genomes (KEGG) database. After taking the intersection of sphingolipid genes and TCGA-LIHC, 20 genes (p < 0.05) were screened by univariate cox analysis. Furthermore, the Non-negative Matrix Factorization (NMF) clustering method was used to classify HCC, and cluster1 and cluster2 (k = 2) were obtained [14].
Then, based on Sphingolipid subtyping, the limma package determined the differentially expressed genes (DEGs) related to sphingolipid metabolism (p < 0.05 and |logFC| > 1). After univariate analysis (p < 0.05), the survival random forest dimensionality reduction analysis was performed. LASSO analysis identified 8 risk genes, including S100A9, TRIM47, SLC1A7, G6PD, LPCAT1, SAPCD2, CCNB1, and CFHR4. Based on the 8 risk genes, the riskscore model (Sphingolipid score) was constructed [16]. Then, the surv cutpoint method of the survminer package was used to divide the patients into High- and Low-Sphingolipid score groups for further analysis.
Somatic mutation and drug susceptibility prediction
Somatic mutation data were obtained from TCGA-LIHC. maftools R package was used to analyze and visualize gene mutations in the 2 Sphingolipid score groups in HCC.
The susceptibility data of HCC patients was accessed from the Genomics of Drug Sensitivity in Cancer (GDSC) database (https://www.cancerrxgene.org/). oncoPredict R package was adopted for drug prediction.
Immune and functional enrichment analysis
ssGSEA, ESTIMATE, MCPcounter and TIMER algorithms were used to quantify the abundance of immune cells in HCC samples and compare the difference of immune infiltration in different cluster categories or risk groups. Gene Set Enrichment Analysis (GSEA) was applied to explore KEGG pathway regulation.
Cell culture and RNA intervention
Normal liver cells LX2 (AW-CNH008) and liver cancer cells Hep G2 (AW-CCH024), MHCC-97H (AW-CCH088), and Hep3B2.1-7 (AW-CCH035) were purchased from abiowell company (Changsha, China). LX2 cells were cultured in 1640 medium, Hep G2 and Hep3B2.1-7 cells in MEM medium, and MHCC-97H cells in DMEM medium. All media contained 10% fetal bovine serum and 1% Penicillin/Streptomycin. Ambient conditions for cell culture were 37°C and 5% CO2.
TRIM47 siRNA (si-TRIM47) and its negative control (si-NC) were purchased from Sangon Biotech (Shanghai, China). The si-TRIM47 sequence is 5′-CACCAAAUCAUCCCAAGCUGUTT-3'. The si-TRIM47 and si-NC were transfected into cells via Lipofectamine™ 2000 (Invitrogen, CA, USA) for 48 h. Experimental analysis was then performed.
Reverse transcription-quantitative PCR (RT-qPCR)
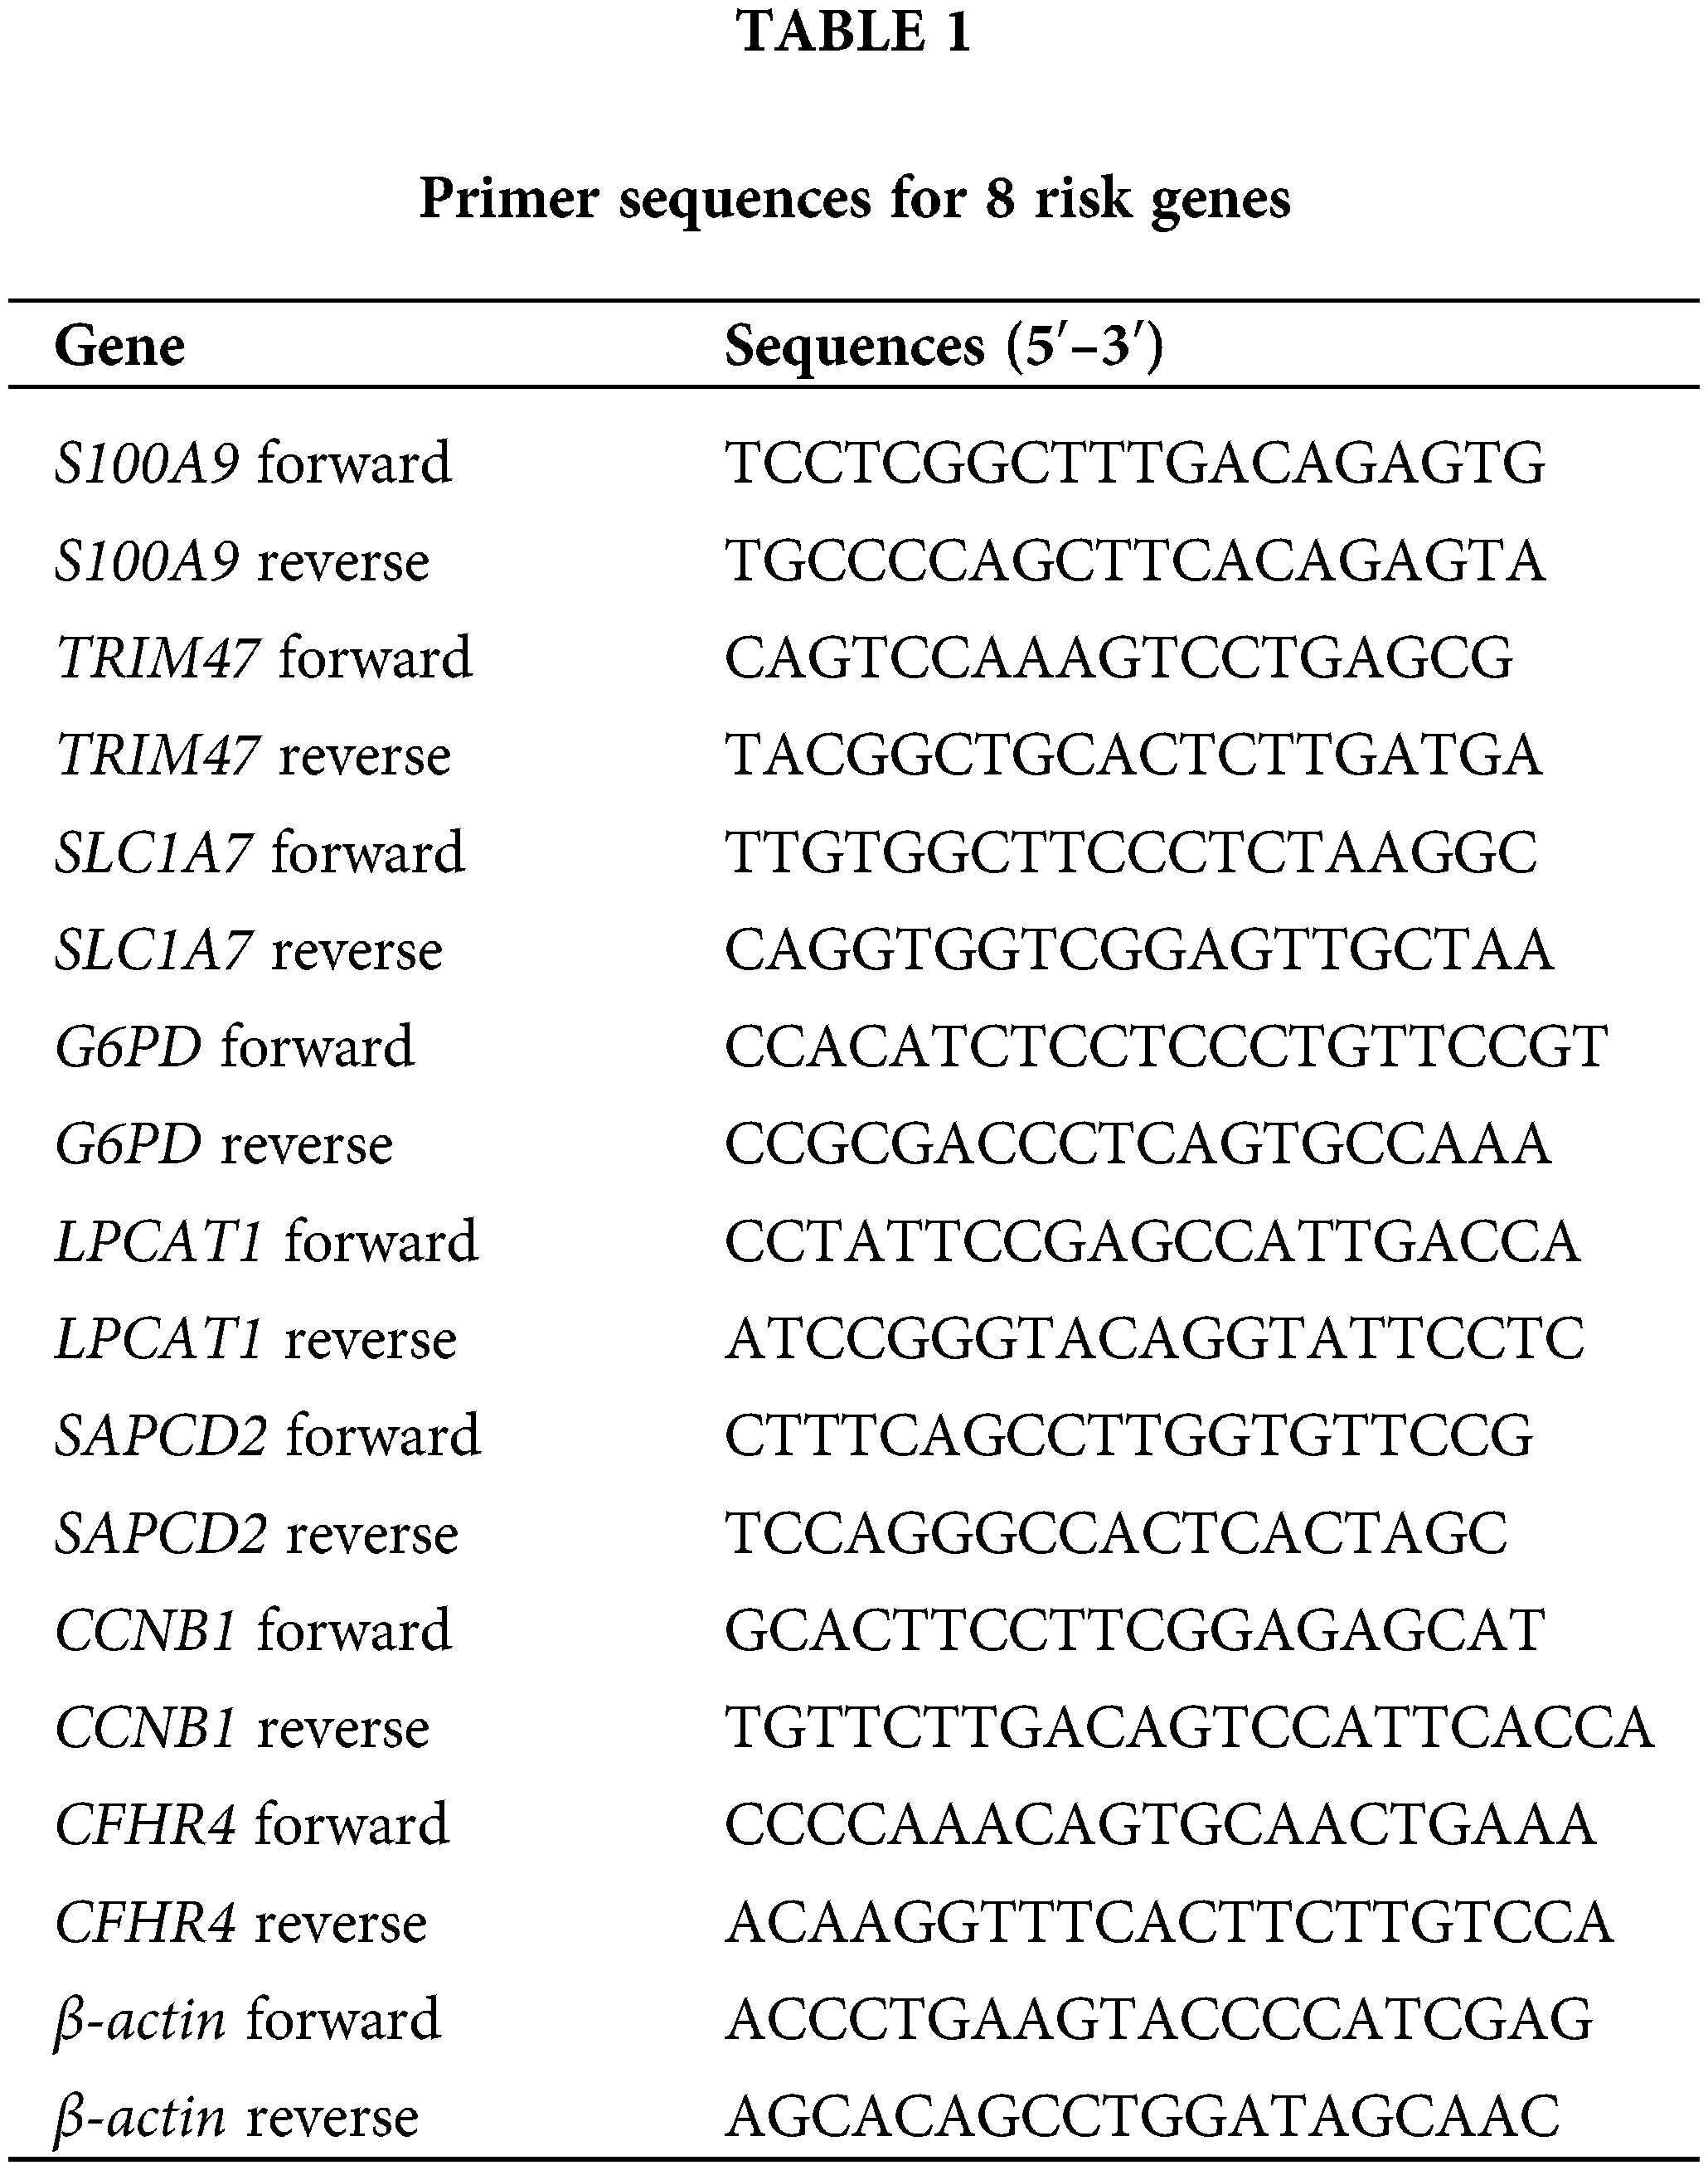
RT-qPCR analysis was performed to identify the mRNA levels of 8 risk genes in LX2, Hep G2, MHCC-97H, and Hep3B2.1-7 cells. First, the total RNA in the cells was extracted using the Trizol method. An RNA reverse transcription kit (CWBIO, Beijing, China) was employed for the reverse transcription of the extracted RNA into cDNA. Total mRNA served as the template for this process. The mRNA levels were detected via SYBR. The results were normalized using the expression of β-actin as an endogenous control. Relative mRNA levels were calculated as 2−ΔΔCt. Primer sequences for the genes are shown in Table 1.
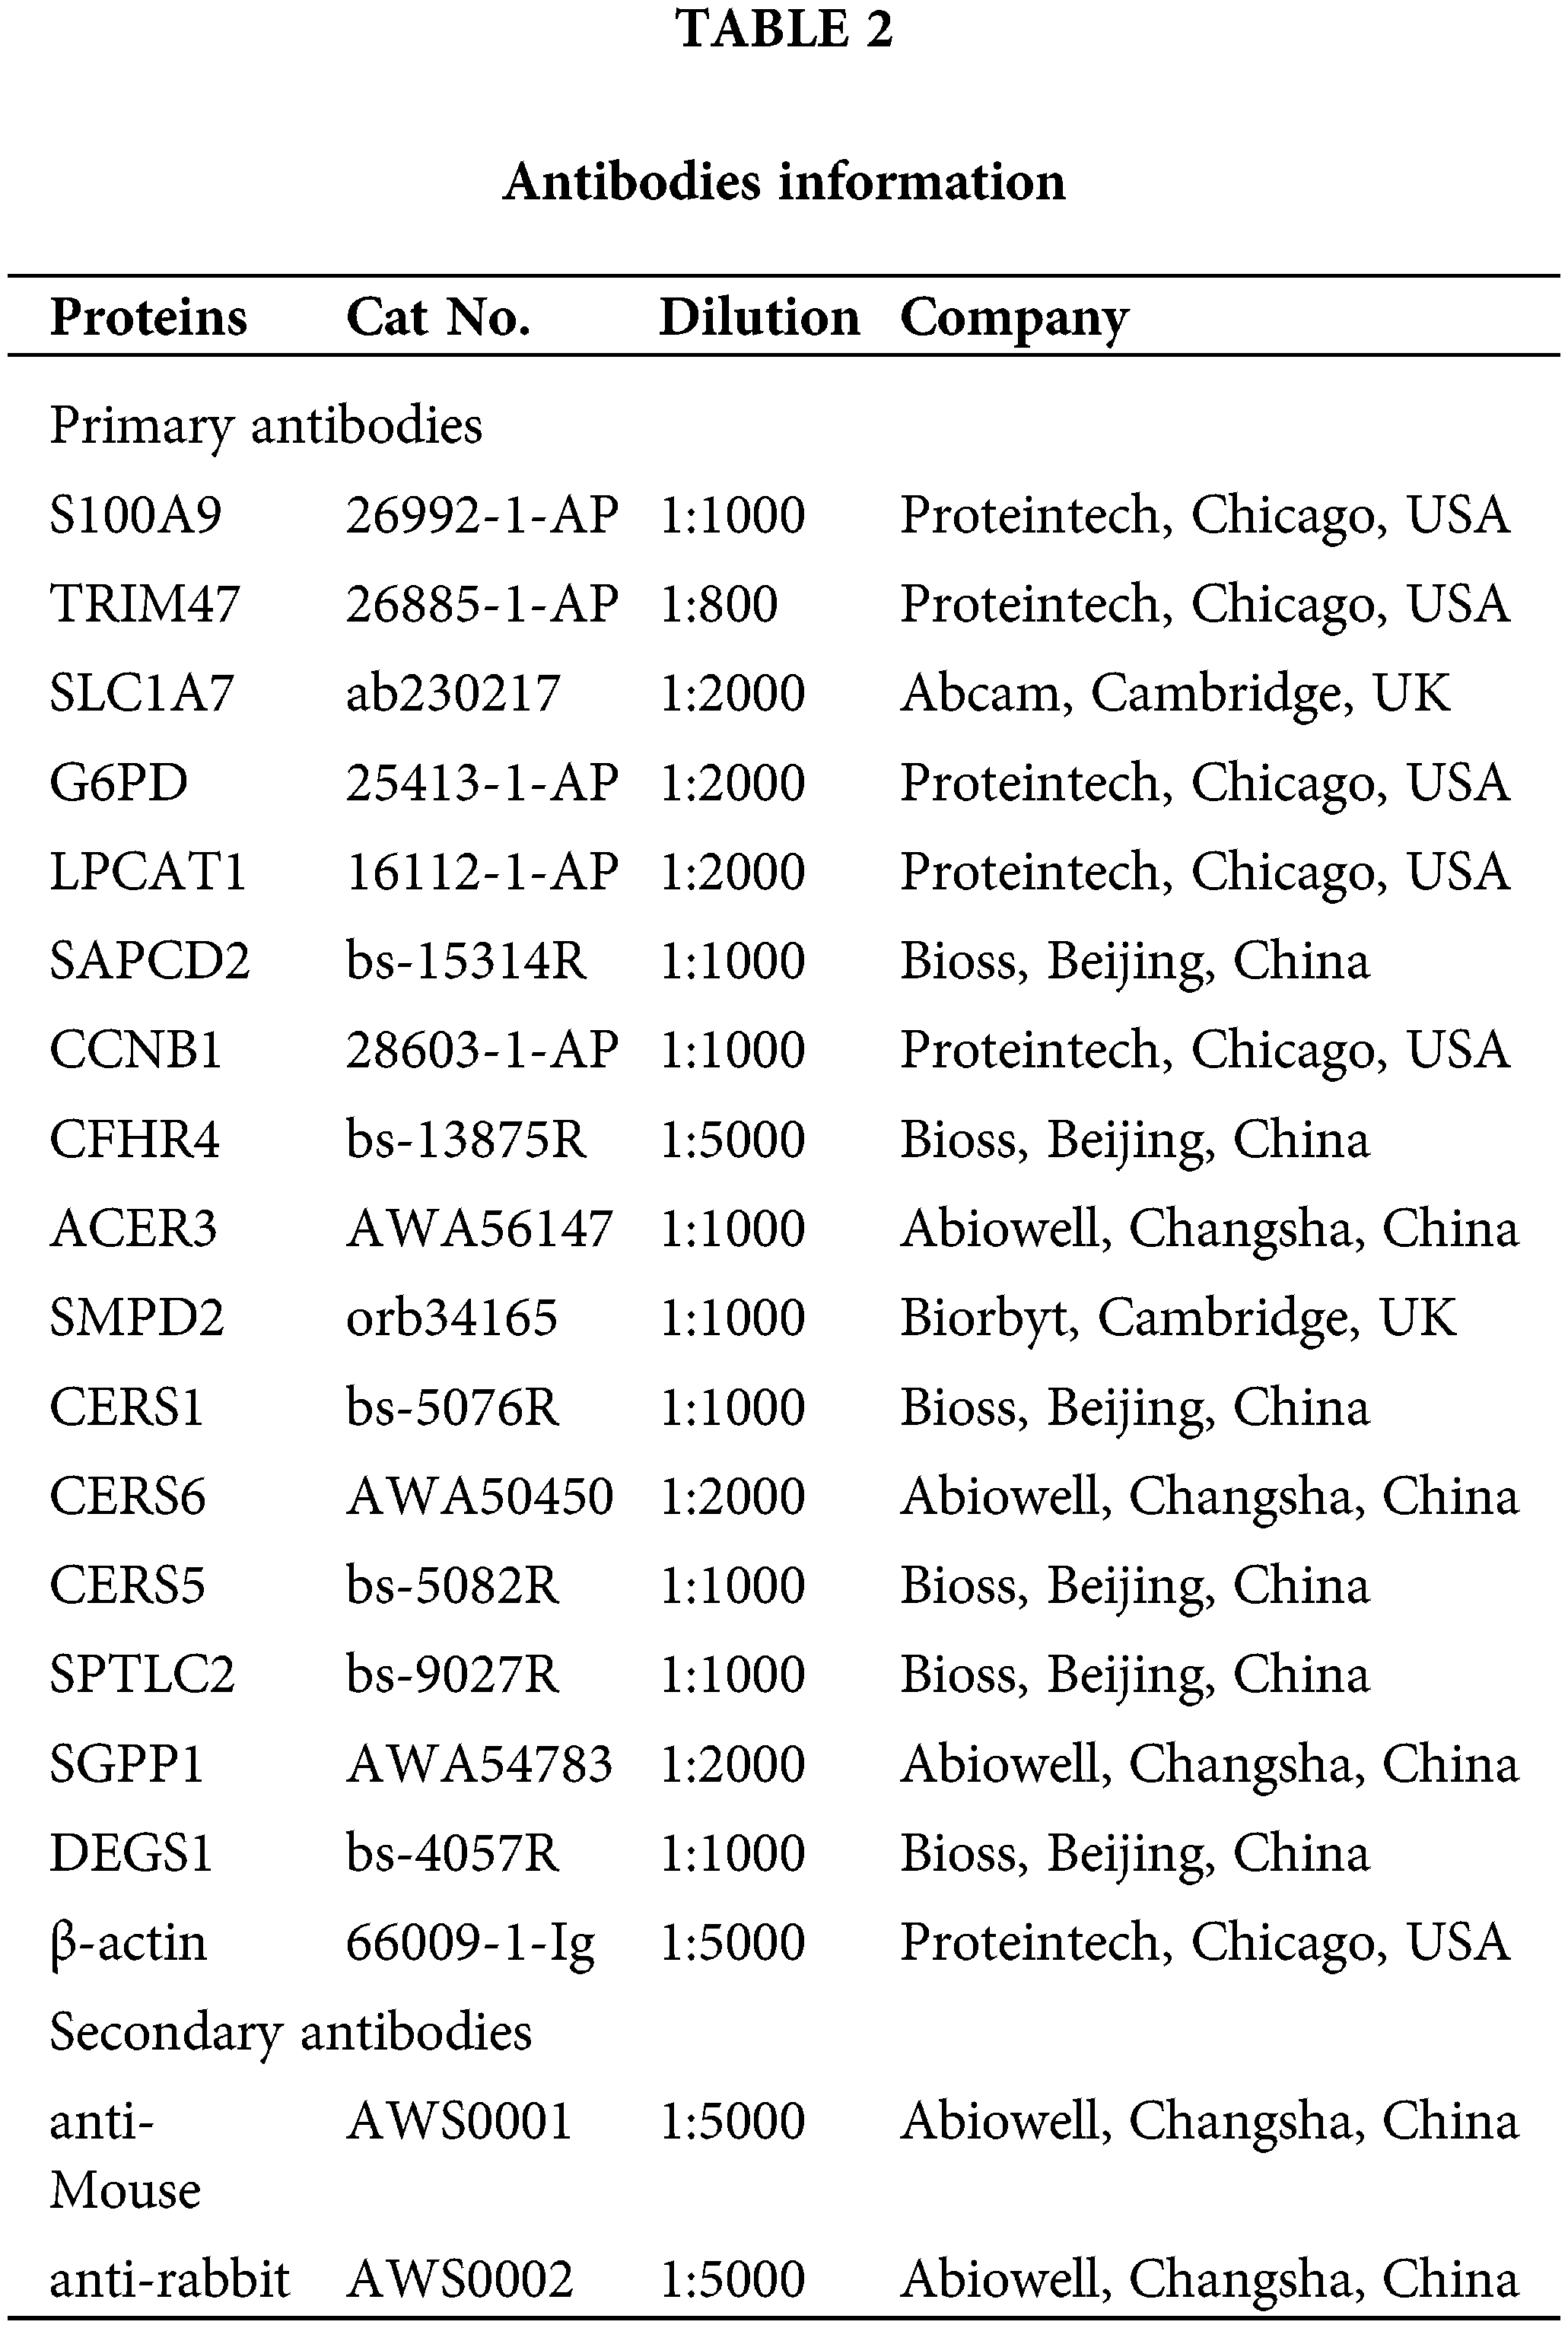
Proteins from LX2, Hep G2, MHC-97H, and Hep3B2.1-7 cells were extracted. Target proteins were separated by 10% and 15% SDS-PAGE. After blocking using 5% skim milk, primary antibodies were used to incubate samples overnight at 4°C. Then, samples were followed by incubation with secondary antibodies for 90 min. After adding the SuperECL Plus luminescent solution, it was observed and imaged using an imaging system. Primary and secondary antibodies used in this study are shown in Table 2. Expression of β-actin as a reference for normalization of target protein levels.
Cell proliferation and apoptosis analysis
The impact of TRIM47 silencing intervention on cell proliferation was evaluated using CCK-8 assay. A solution of CCK-8 was added to the treated cells. After incubation at 37°C and 5% CO2 for 4h, absorbance (OD) at 450 nm was analyzed.
The effect of TRIM47 silencing on the apoptosis rate was performed by flow cytometry. Cells were collected after transfection with si-NC or si-TRIM47. 5 μl Annexin V-APC and Propidium Iodide were added. Flow cytometry was used for detection after reacting for 10 min at room temperature and shading conditions.
Measurement of ceramide levels
Ceramide levels were determined using a kit (YJ037872, mlbio, Shanghai, China). Cells were collected and reagents were added following the manufacturer’s instructions. After incubating for 60 min, the OD value (450 nm) was measured.
R (version 3.6.1) and GraphPad Prism 9.0 were used for statistical analysis. The Shapiro-Wilk normality test was utilized to assess the normality of the variables. Unpaired Student t-test, Wilcoxon test, one-way ANOVA, and Kruskal-Wallis test were employed for data analysis. Pearson correlation and distance correlation analyses were performed to determine correlation coefficients. Patients were classified into High- or Low-Sphingolipid score for each dataset based on the dichotomous riskscore. Data visualization was primarily carried out using the R package ggplot2. The Benjamini-Hochberg method was employed for differential gene expression analysis, and p-values were converted to FDR to identify significant genes. Survival and timeROC curves were generated and plotted using the Kaplan-Meier method and the timeROC R package. The log-rank test assessed the statistical significance of differences in each dataset. Heatmaps were created utilizing pheatmap. All experiments were performed in three biological replicates. p < 0.05 were considered statistically significant.
Subtyping of sphingolipid metabolism and screening of risk genes in HCC
47 sphingolipid genes (KEGG ID: hsa00600, sphingolipid metabolism) were obtained from the KEGG database. After the intersection of sphingolipid genes with TCGA-LIHC (47 genes), 20 genes were screened by univariate analysis (Fig. 1A, p < 0.05). The NMF clustering method was further utilized for the classification of HCC, resulting in the identification of two clusters, referred to as cluster1 and cluster2 (Fig. 1B, k = 2). The survival time of patients with 2 Sphingolipid subtypes was significantly longer (Fig. 1C, p = 0.005).
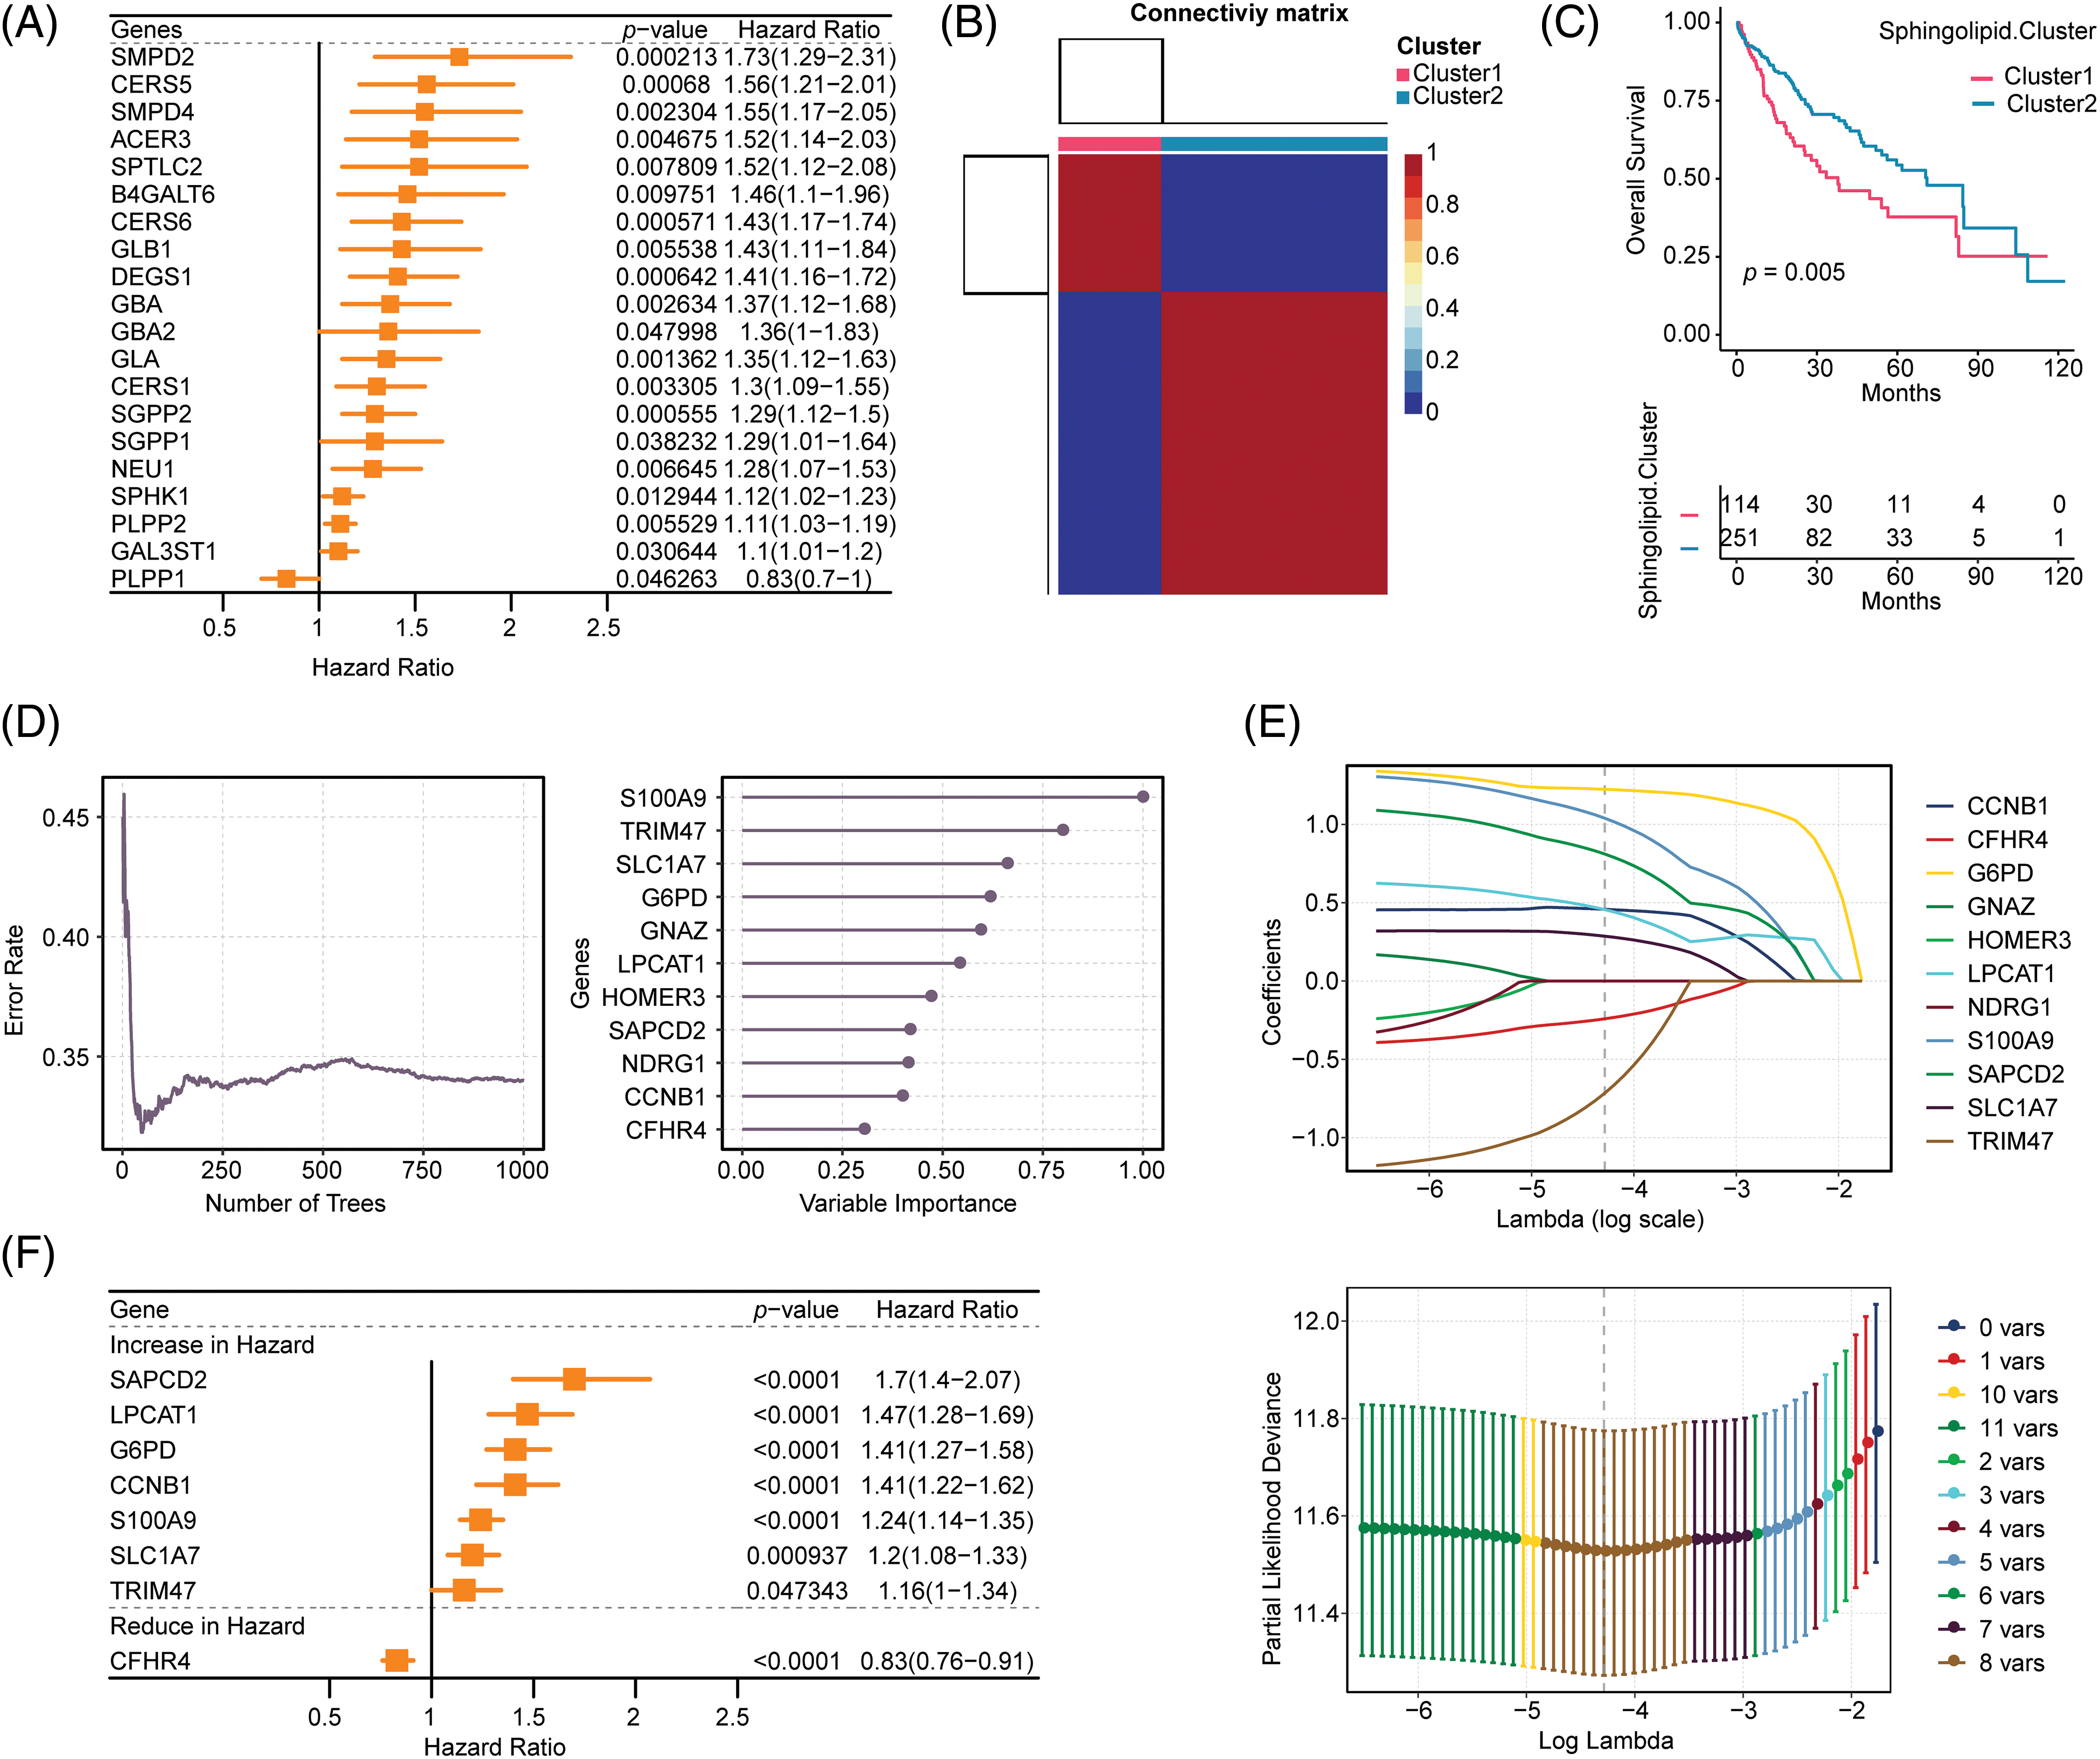
Figure 1: Construction of the Sphingolipid associated risk model in HCC. (A) 20 genes related to sphingolipid metabolism were obtained by univariate analysis. (B) HCC patients were stratified into 2 clusters by NMF clustering (k = 2). (C) Survival analysis (based on 2 subclasses). (D) Random forest dimensionality reduction analysis. (E) LASSO analysis. (F) Forestplot of 8 genes.
Based on Sphingolipid subtyping, 739 sphingolipid-related differential genes were identified. 368 DEGs were obtained after univariate analysis (Suppl. Table S1). After random forest dimension reduction, LASSO analysis obtained 8 risk genes (Figs. 1D and 1E). Among them, S100A9, TRIM47, SLC1A7, G6PD, LPCAT1, SAPCD2, and CCNB1 were predicted to be risk genes in HCC, while CFHR4 was a protective gene (Fig. 1F).
Survival analysis of HCC patients based on 8 risk genes
We further analyzed the effect of 8 risk genes on survival in HCC patients (Fig. 2). Kaplan-Meier survival analysis showed that within 120 months, high levels of S100A9, TRIM47, SLC1A7, G6PD, LPCAT1, SAPCD2, and CCNB1 predicted poor prognosis in HCC patients. The high expression of the protective gene CFHR4 predicted a good prognosis.
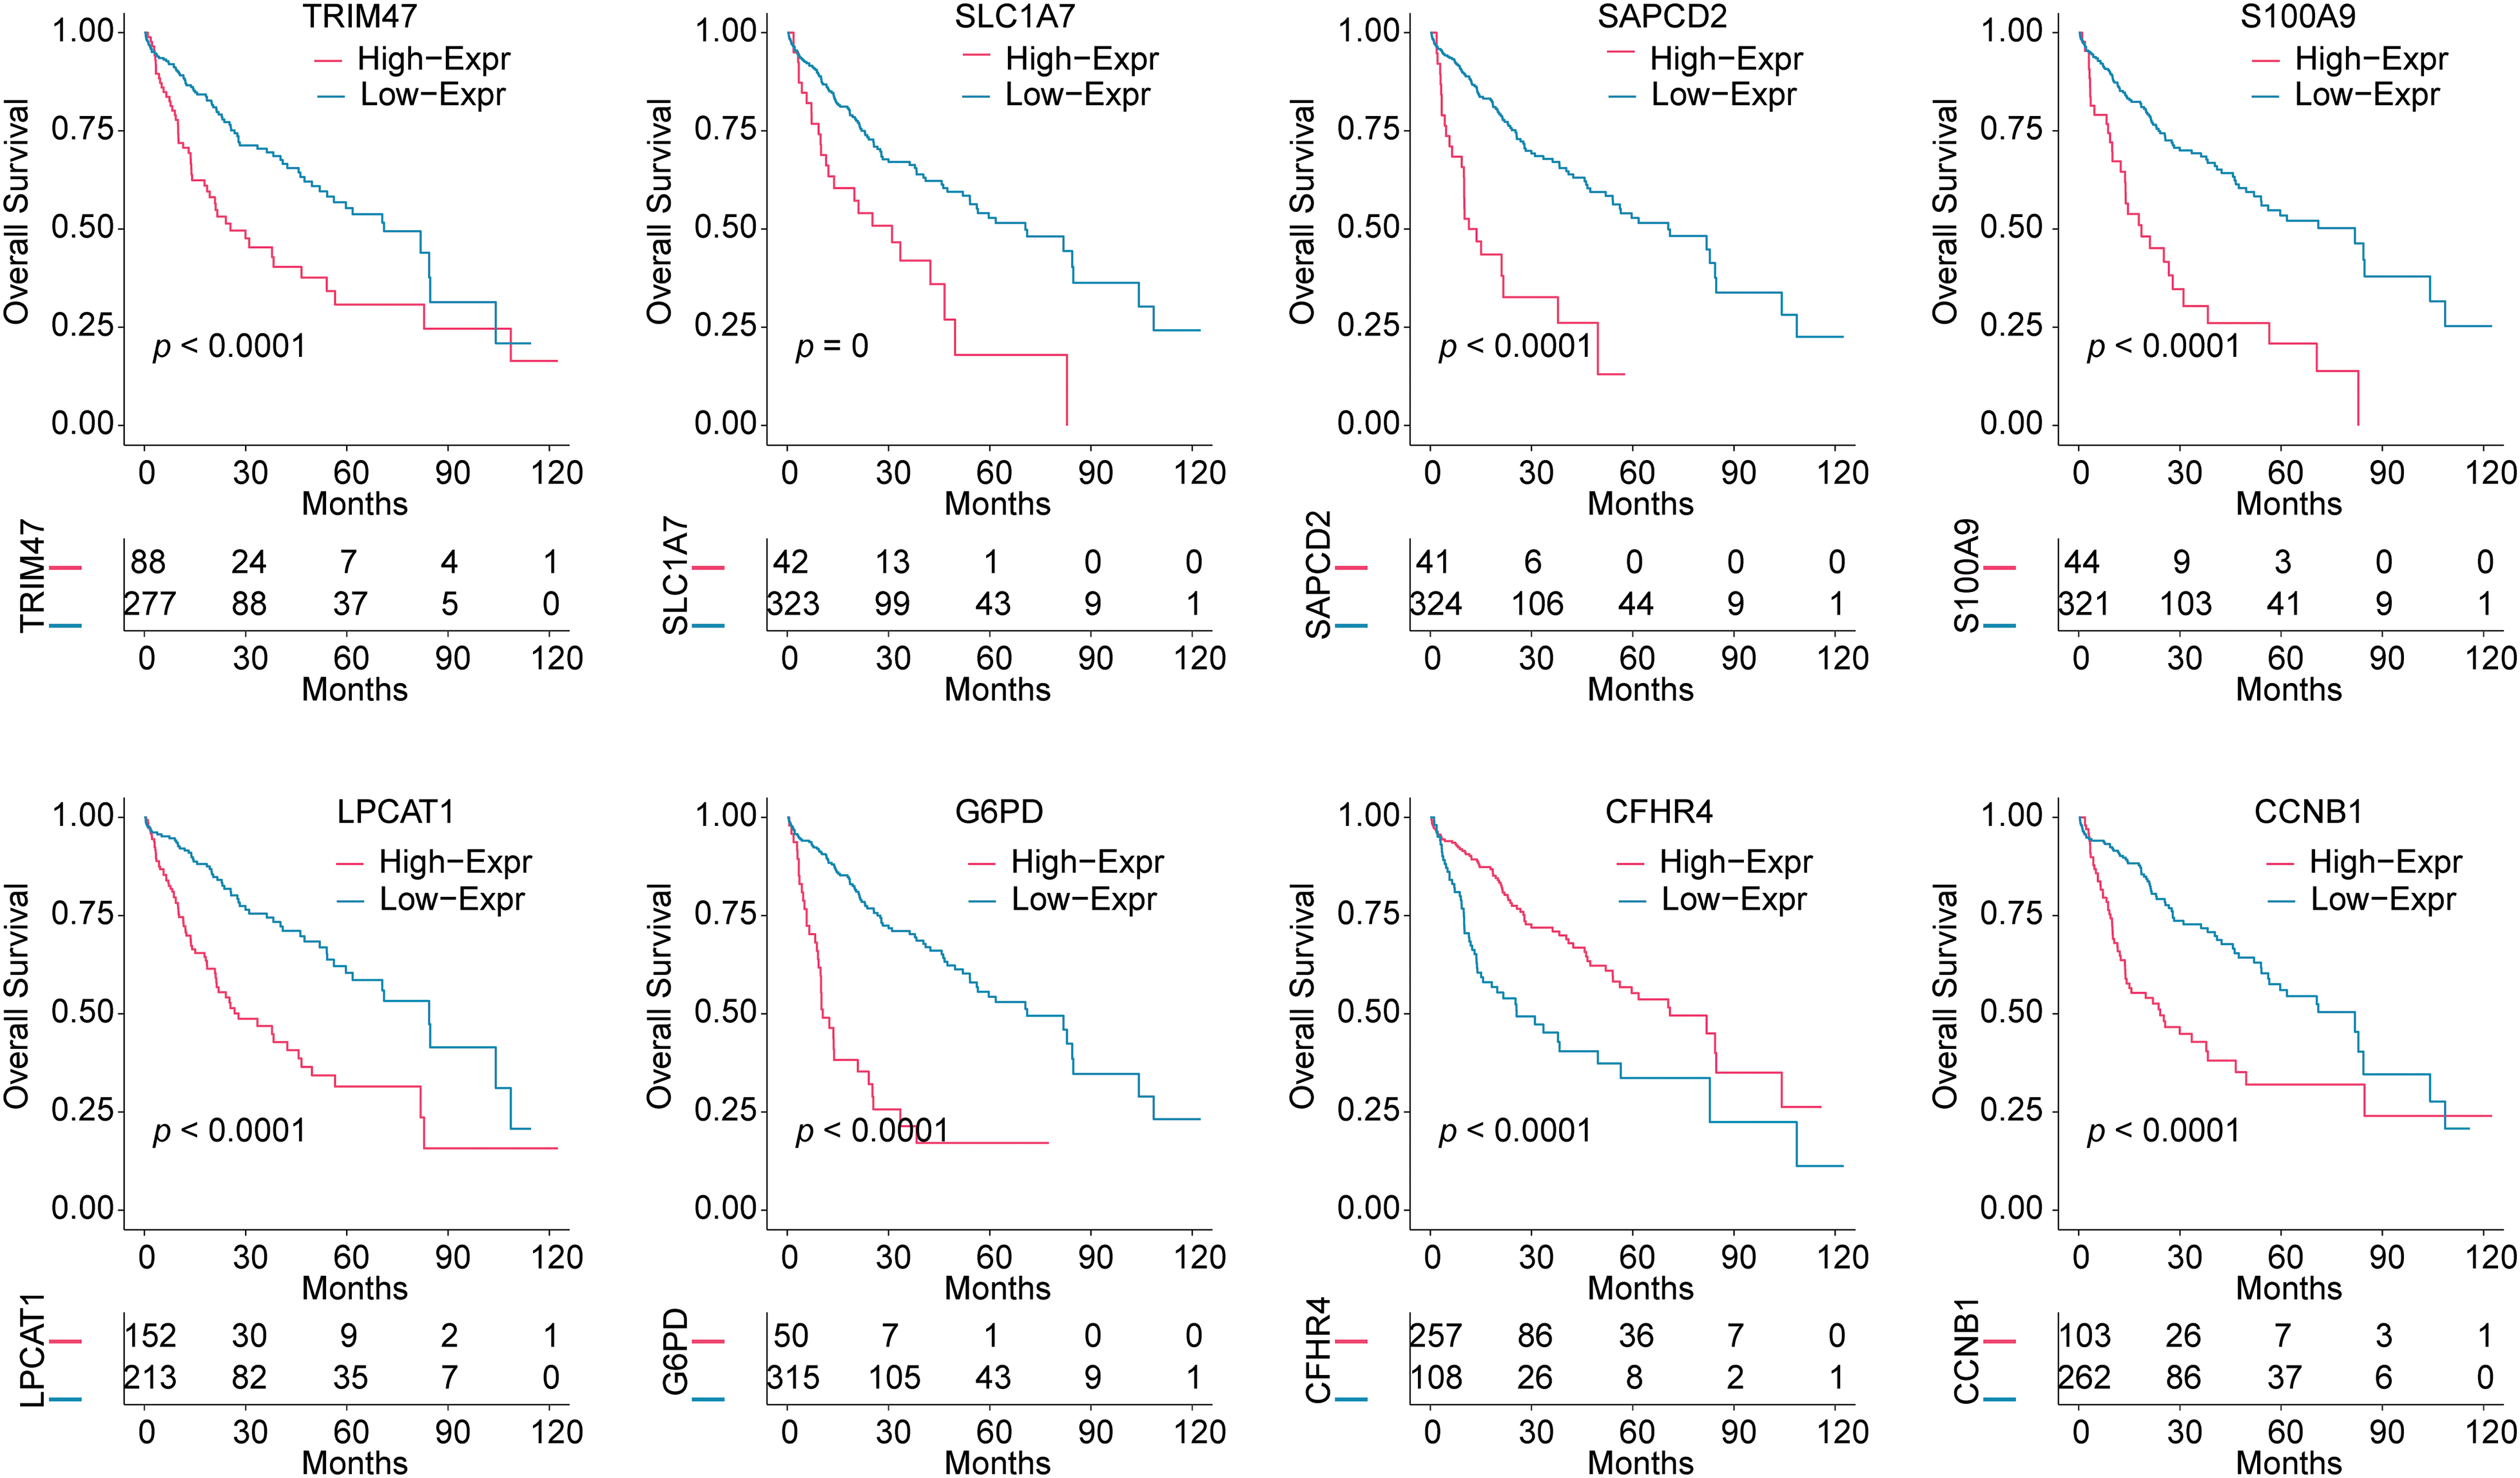
Figure 2: Survival analysis based on the expression of 8 risk genes. Kaplan-Meier analysis was used to analyze the effects of TRIM47, SLC1A7, SAPCD2, S100A9, LPCAT1, G6PD, CFHR4, and CCNB1 expressions on the survival time of HCC patients.
Validation of sphingolipid-related Riskscore model and evaluation of clinicopathological characteristics of HCC patients
Based on the 8 risk genes, we used the LASSO method to construct Sphingolipid related riskscore model: Riskscore = 1.0392 × S100A9-0.7155 × TRIM47 + 0.2861 × SLC1A7 + 1.2237 × G6PD + 0.4557 × LPCAT1 + 0.8106 × SAPCD2 + 0.4578 × CCNB1 - 0.2411 × CFHR4.
HCC patients were divided into 2 Sphingolipid score groups. Fig. 3A shows that patients with High-Sphingolipid score had a higher survival rate than those with low-sphingolipid score (p < 0.0001). The timeROC curve supported the model’s validity, with AUC values of 0.773 for 1-years, 0.732 for 3-years, and 0.692 for 5-years (Fig. 3B). Survival analysis in the GSE14520 validation set proved that the Low-Sphingolipid score predicted poor prognosis in HCC patients (Fig. 3C, p = 0.000243). In the mortality statistics of TCGA, the number of deaths in the Low-Sphingolipid score group was higher than in the High- (Fig. 3D). The analysis of the above results confirmed that a high Sphingolipid score predicted a good prognosis for HCC patients.
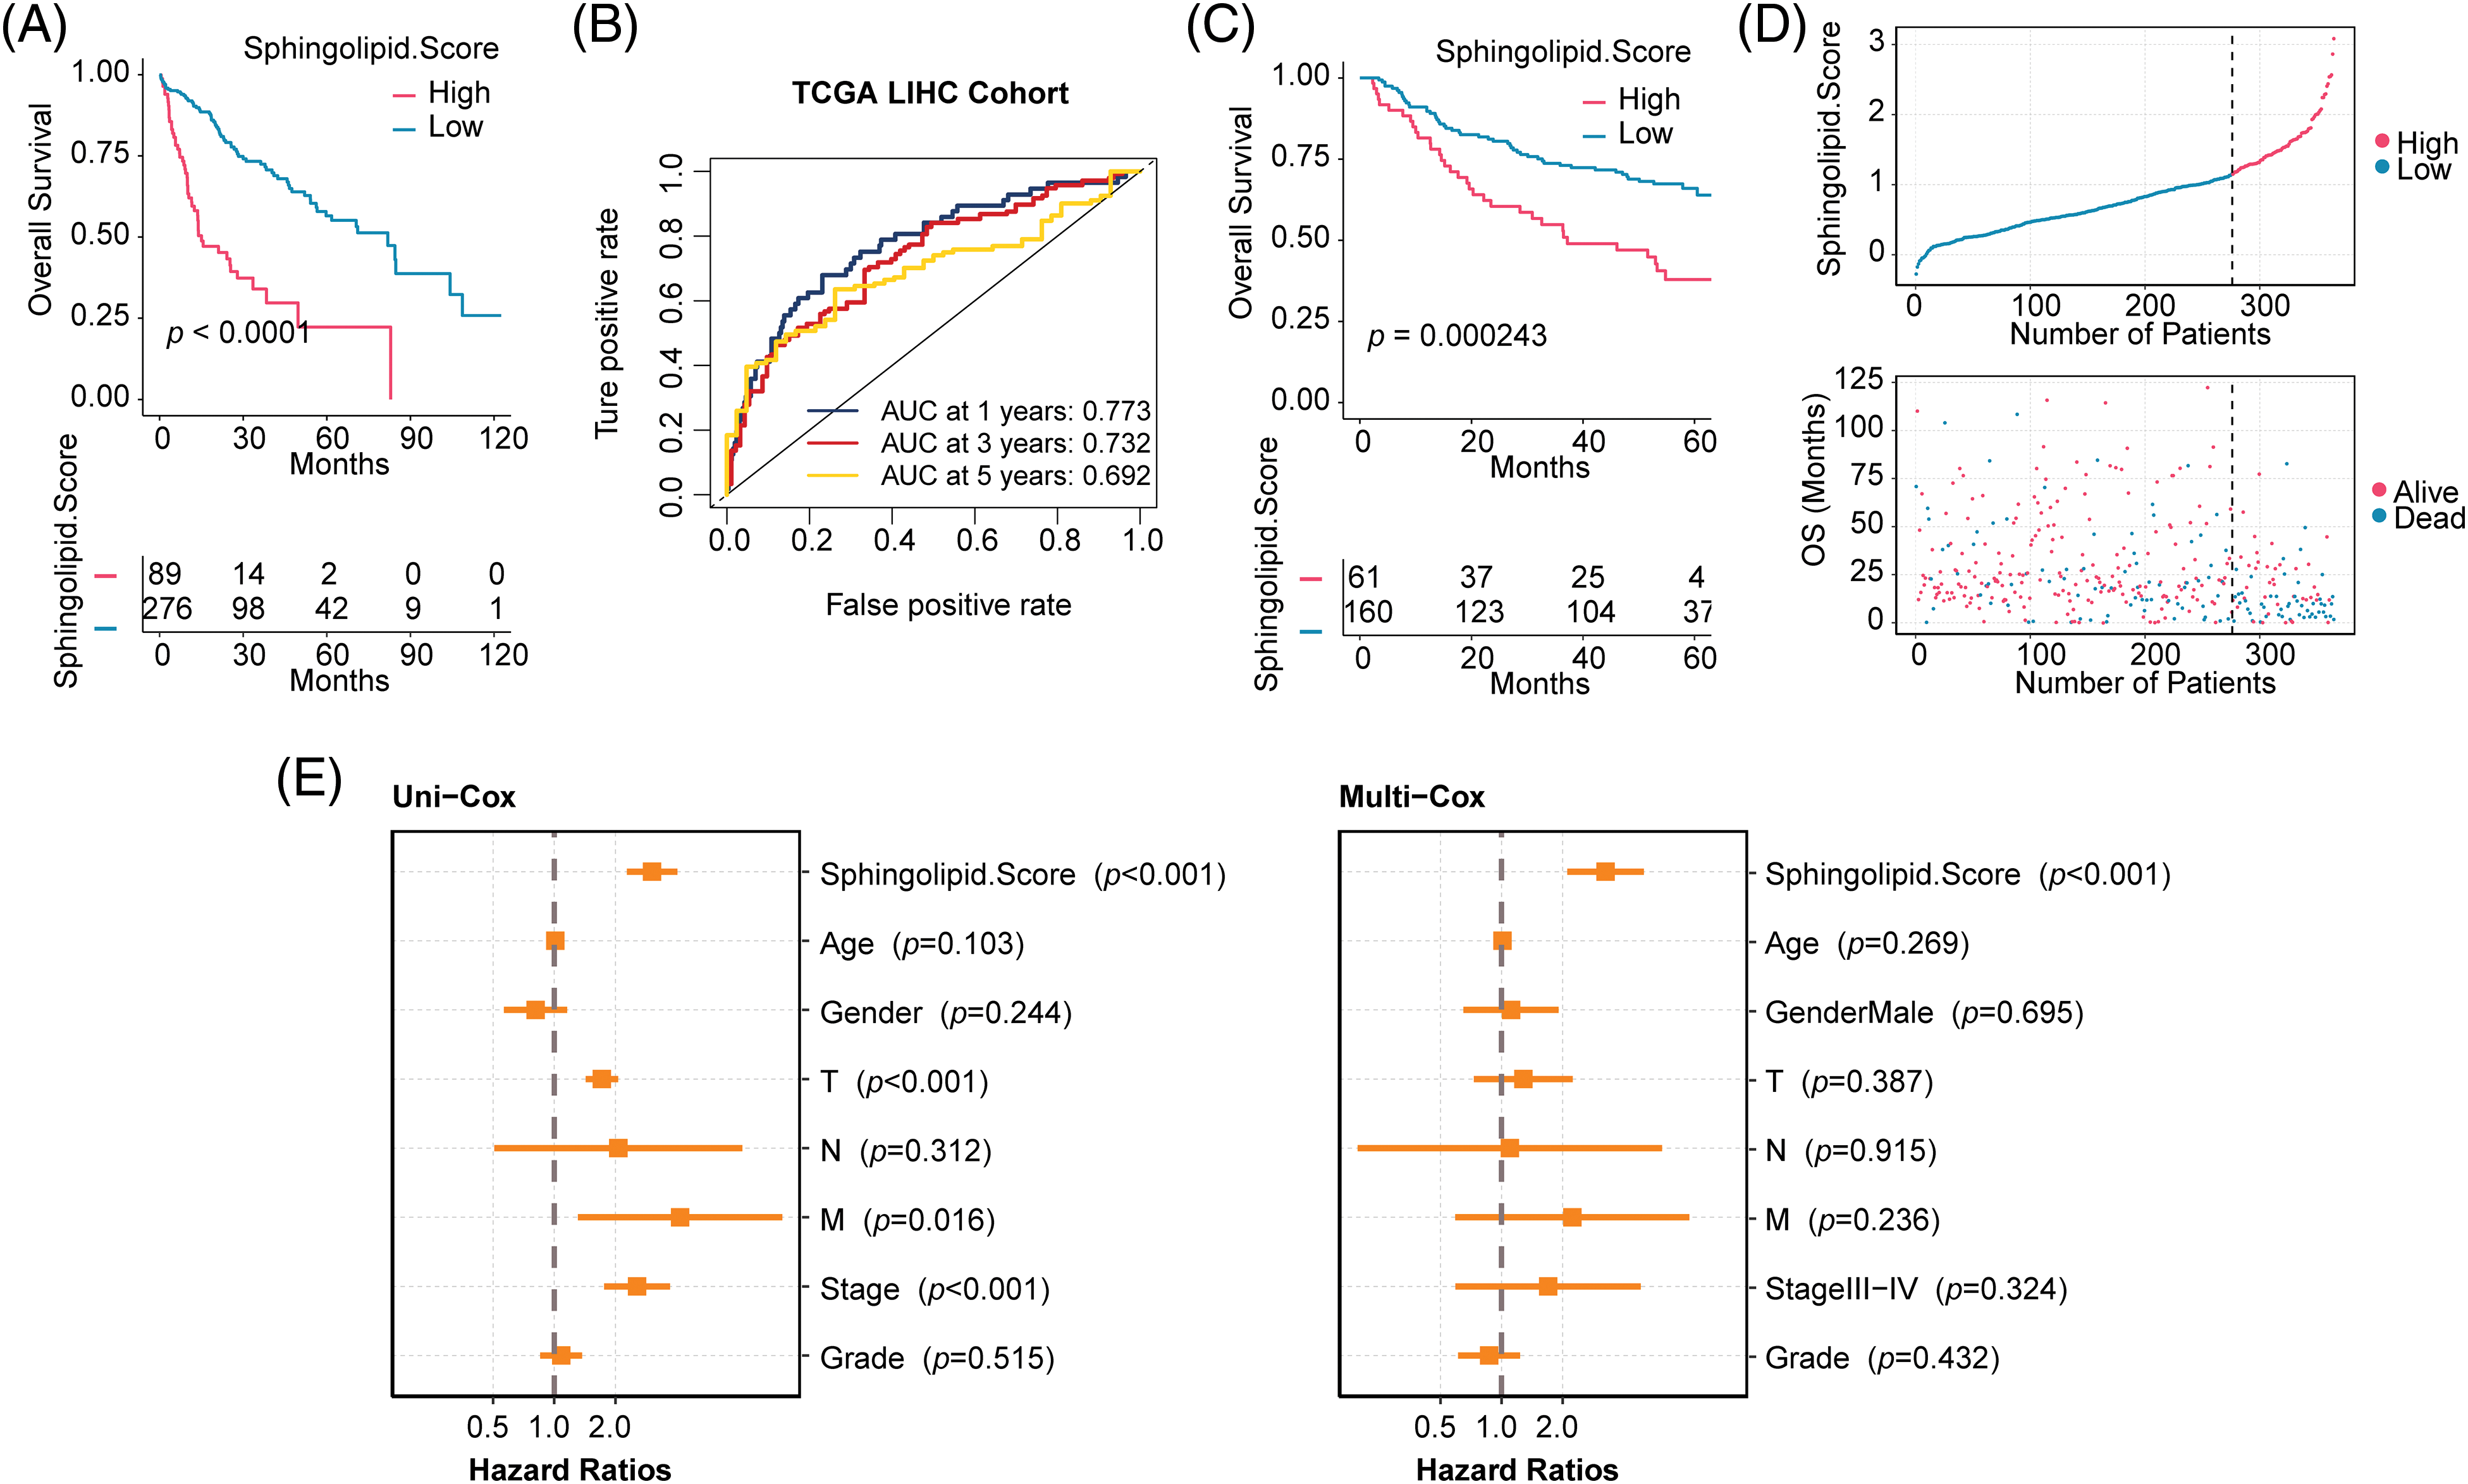
Figure 3: Evaluation of clinicopathological characteristics of HCC patients. (A) Survival analysis of the training set TCGA-LIHC. (B) The timeROC curve. (C) Validation set GSE14520. (D) Prediction of mortality risk in HCC patients (TCGA-LIHC). (E) Forestplot of clinical features.
The relationship between Sphingolipid score and clinical characteristics (Age, Gender, T, N, M, Stage, and Grade) and prognosis was analyzed by univariate (Uni-cox) and multivariate (Multi-cox) analysis. Sphingolipid score was an independent prognostic factor for HCC (Fig. 3E, Uni-cox: p < 0.001; Multi-cox: p < 0.001). Combined with the above analysis, the Sphingolipid score could predict the prognosis of HCC patients.
Association between Sphingolipid score and gene mutations
The maftools R package analyzed somatic mutations between 2 Sphingolipid score groups. In the Low-Sphingolipid score group, 237 of 267 patients had gene mutations, accounting for 88.76%. Among them, CTNNB1 (27%) had the highest mutation rate. However, in the High-Sphingolipid score group, the proportion of HCC with mutations was higher (95.24%), and the proportion of patients with TP53 (p53) mutations was significantly higher (56%) (Fig. 4A). Missense Mutation was the type of mutation that might occur. In the 2 Sphingolipid score groups, the proportion of patients with gene mutations was further compared (Fig. 4B). The mutation rates of p53, KPRP, ZNF98, TG, DNAH17, PLEKHM1, NOS3, NFATC2, NFASC, CPAMD8, TDRD5, and BSN in the High-sphingolipid score group were higher than those in the Low-Sphingolipid score group. The mutation rate of DYNC2H1 in the High-sphingolipid score group decreased.
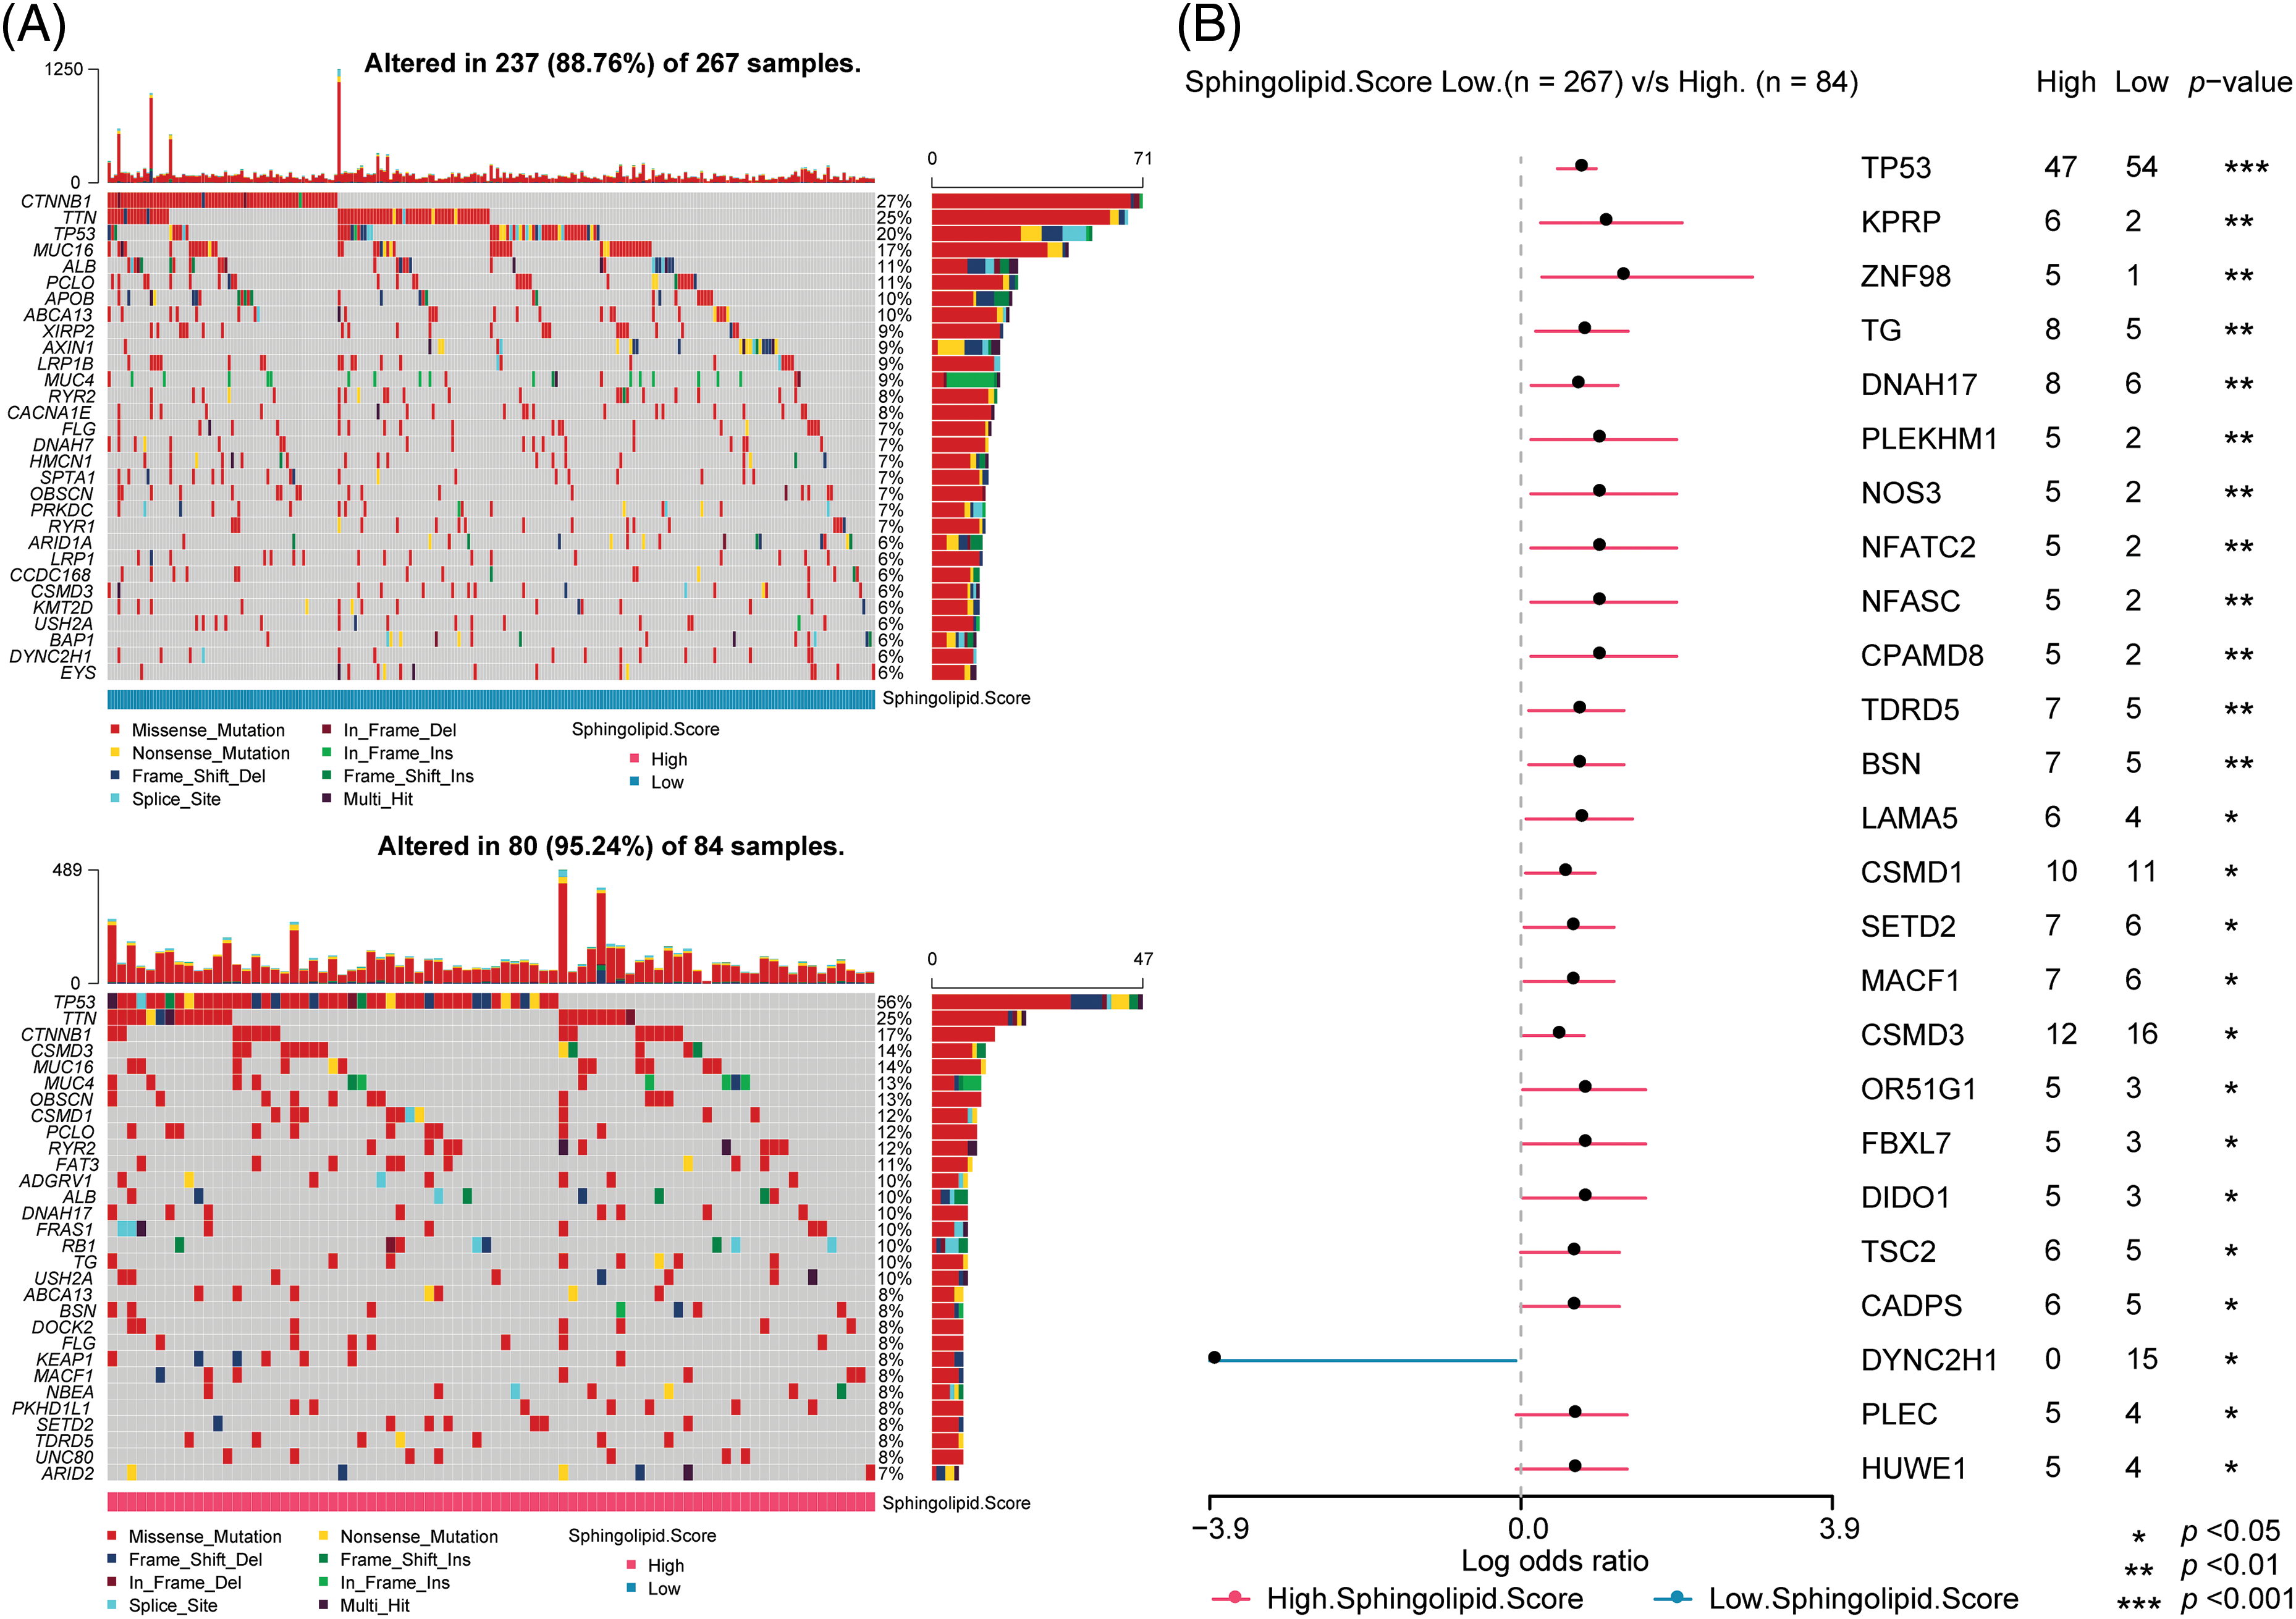
Figure 4: Prediction of somatic mutations in HCC patients based on Sphingolipid score. (A) Oncoplot visualization of top 30 mutant genes in the 2 sore groups. (B) The ratio of gene mutations in High- and Low-sore. *p < 0.05, **p < 0.01, ***p < 0.001.
Predictive analysis of drug susceptibility in HCC patients
Furthermore, the drug sensitivity of HCC patients was predicted. As shown in Fig. 5, patients in the High-Sphingolipid score group were more sensitive to UMI-77, ULK1, Temozolomide, Taselisib, OTX015, Obatoclax Mesylate, MN-64, Leflunomide, IGF1R, Ibrutinib, I-BET-762, GDC0810, Alpelisib, BPD-00008900, BMS-345541, Alisertib, Staurosporine, PAK, Eg5, Dasatinib, JAK, IRAK4, AZD5153, and AZ960. The results suggested that these chemotherapeutic agents might have a good therapeutic effect on HCC patients with a high-Sphingolipid score.
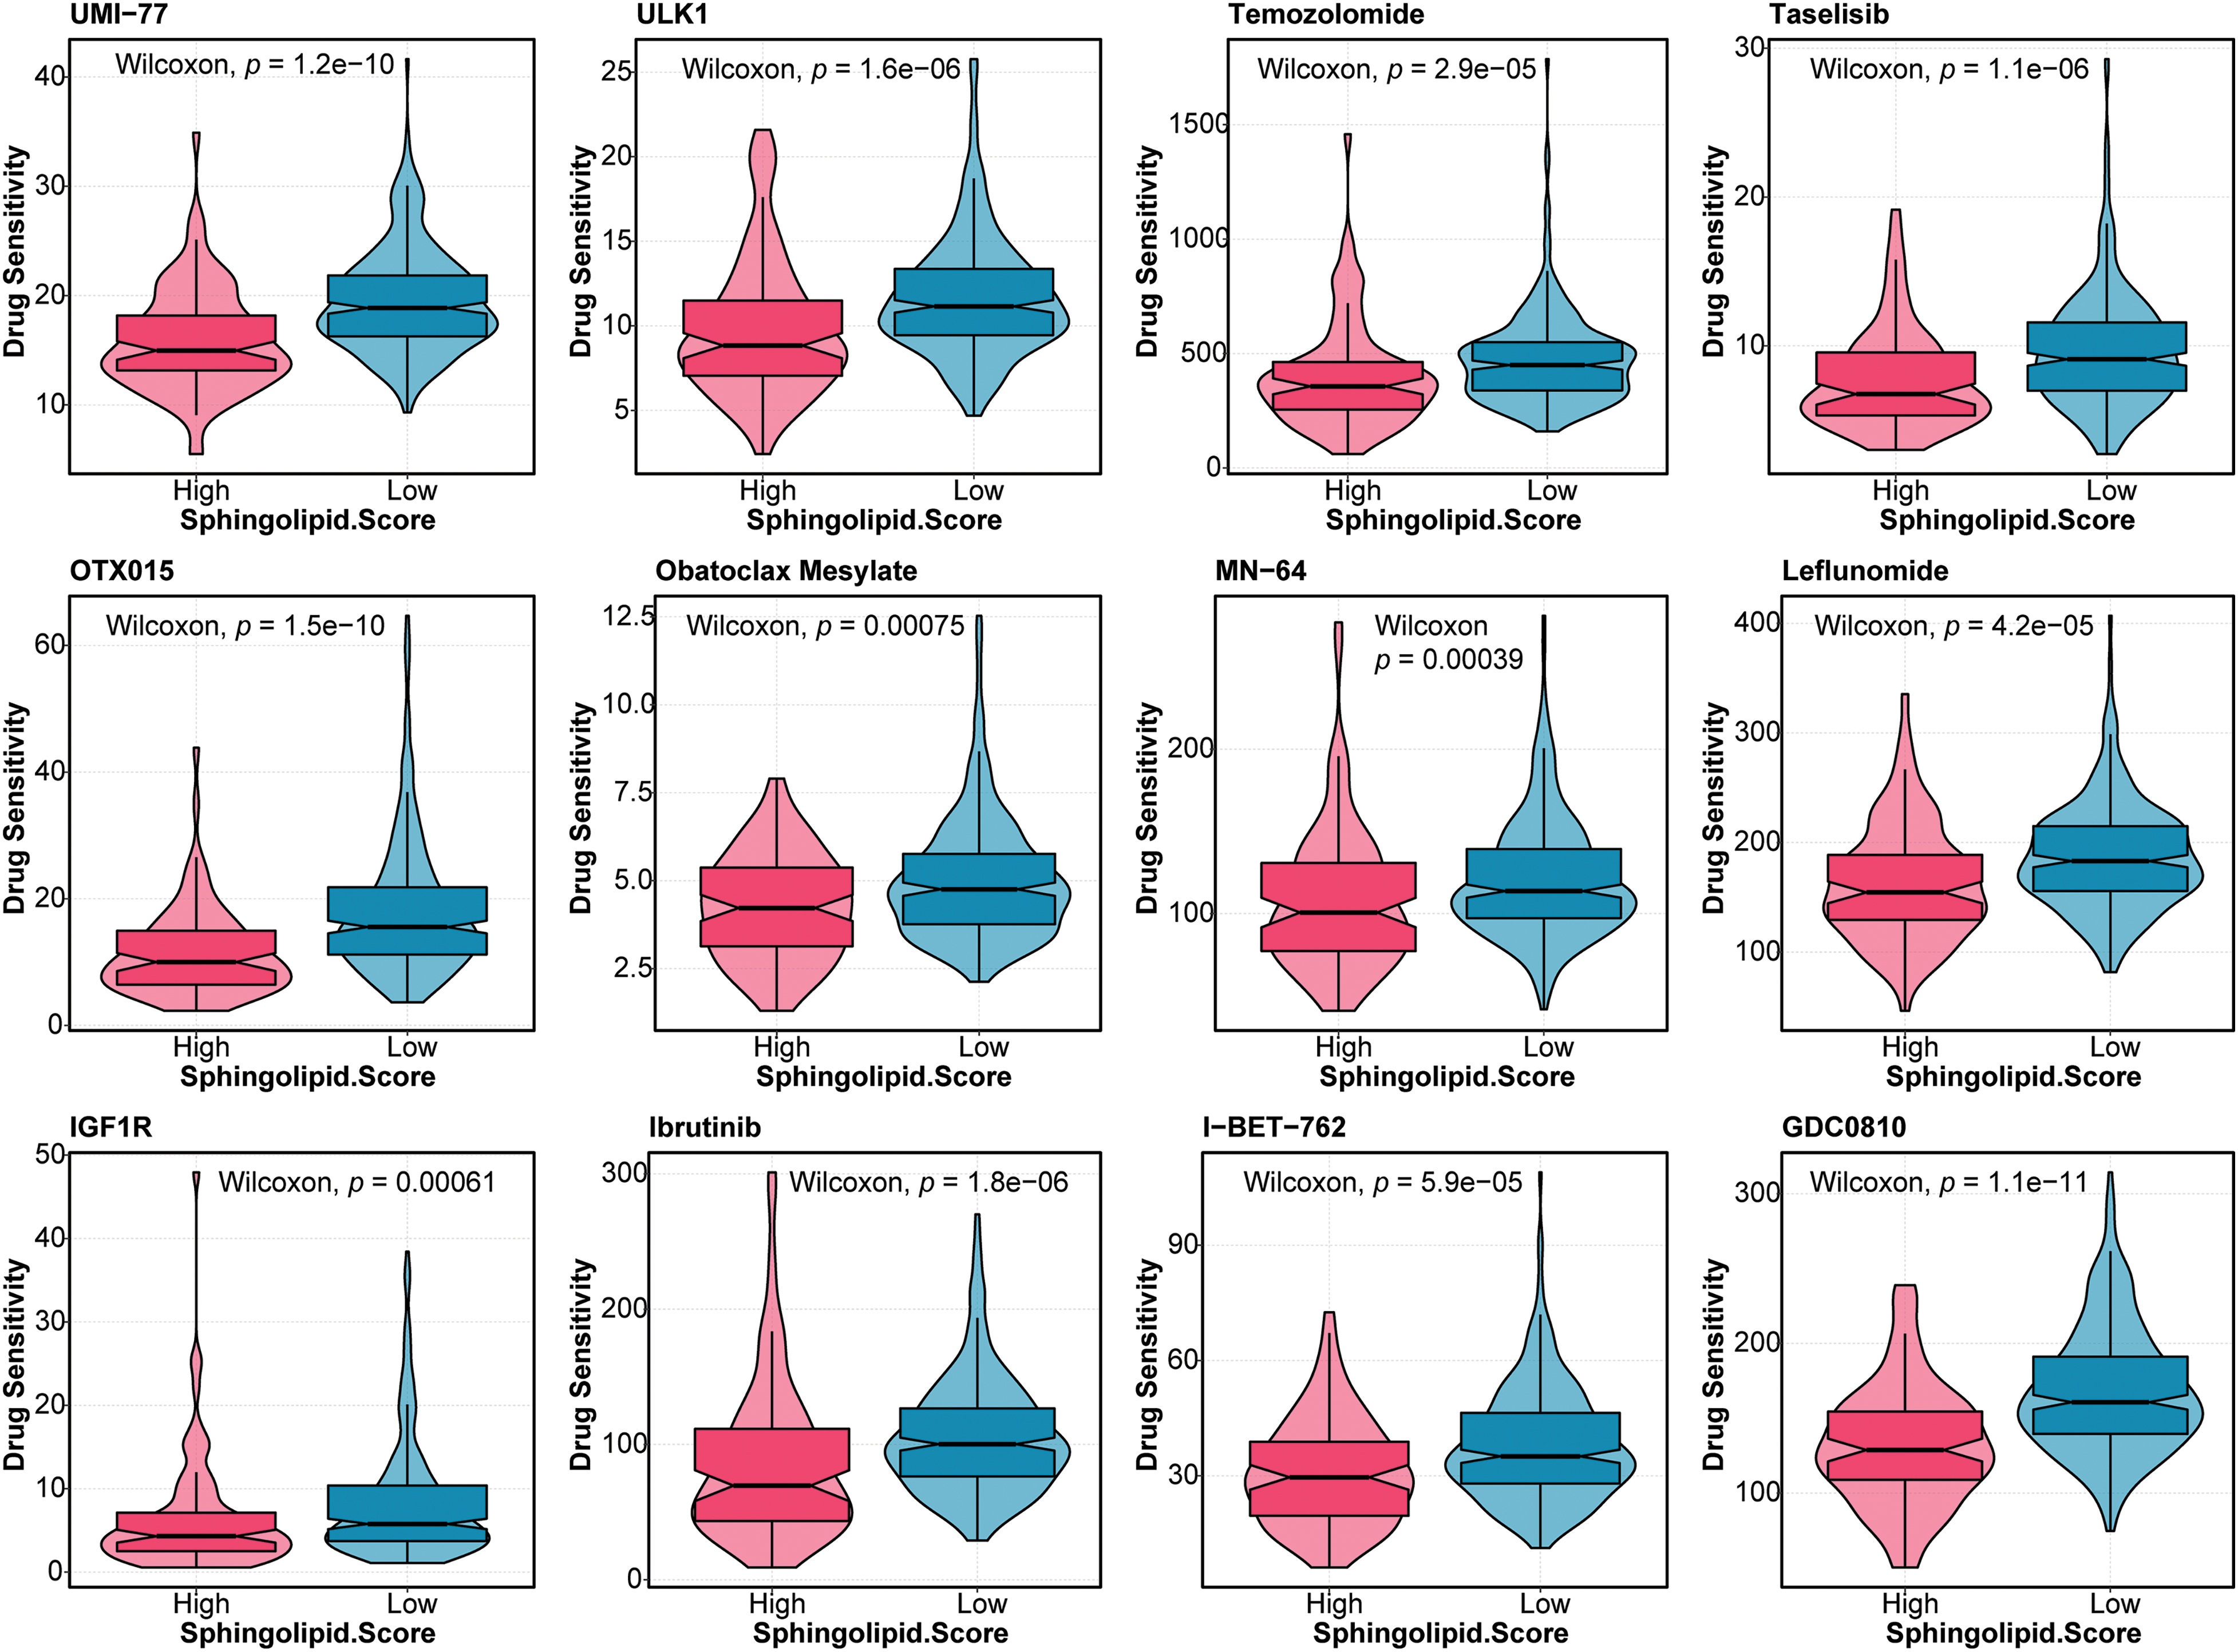
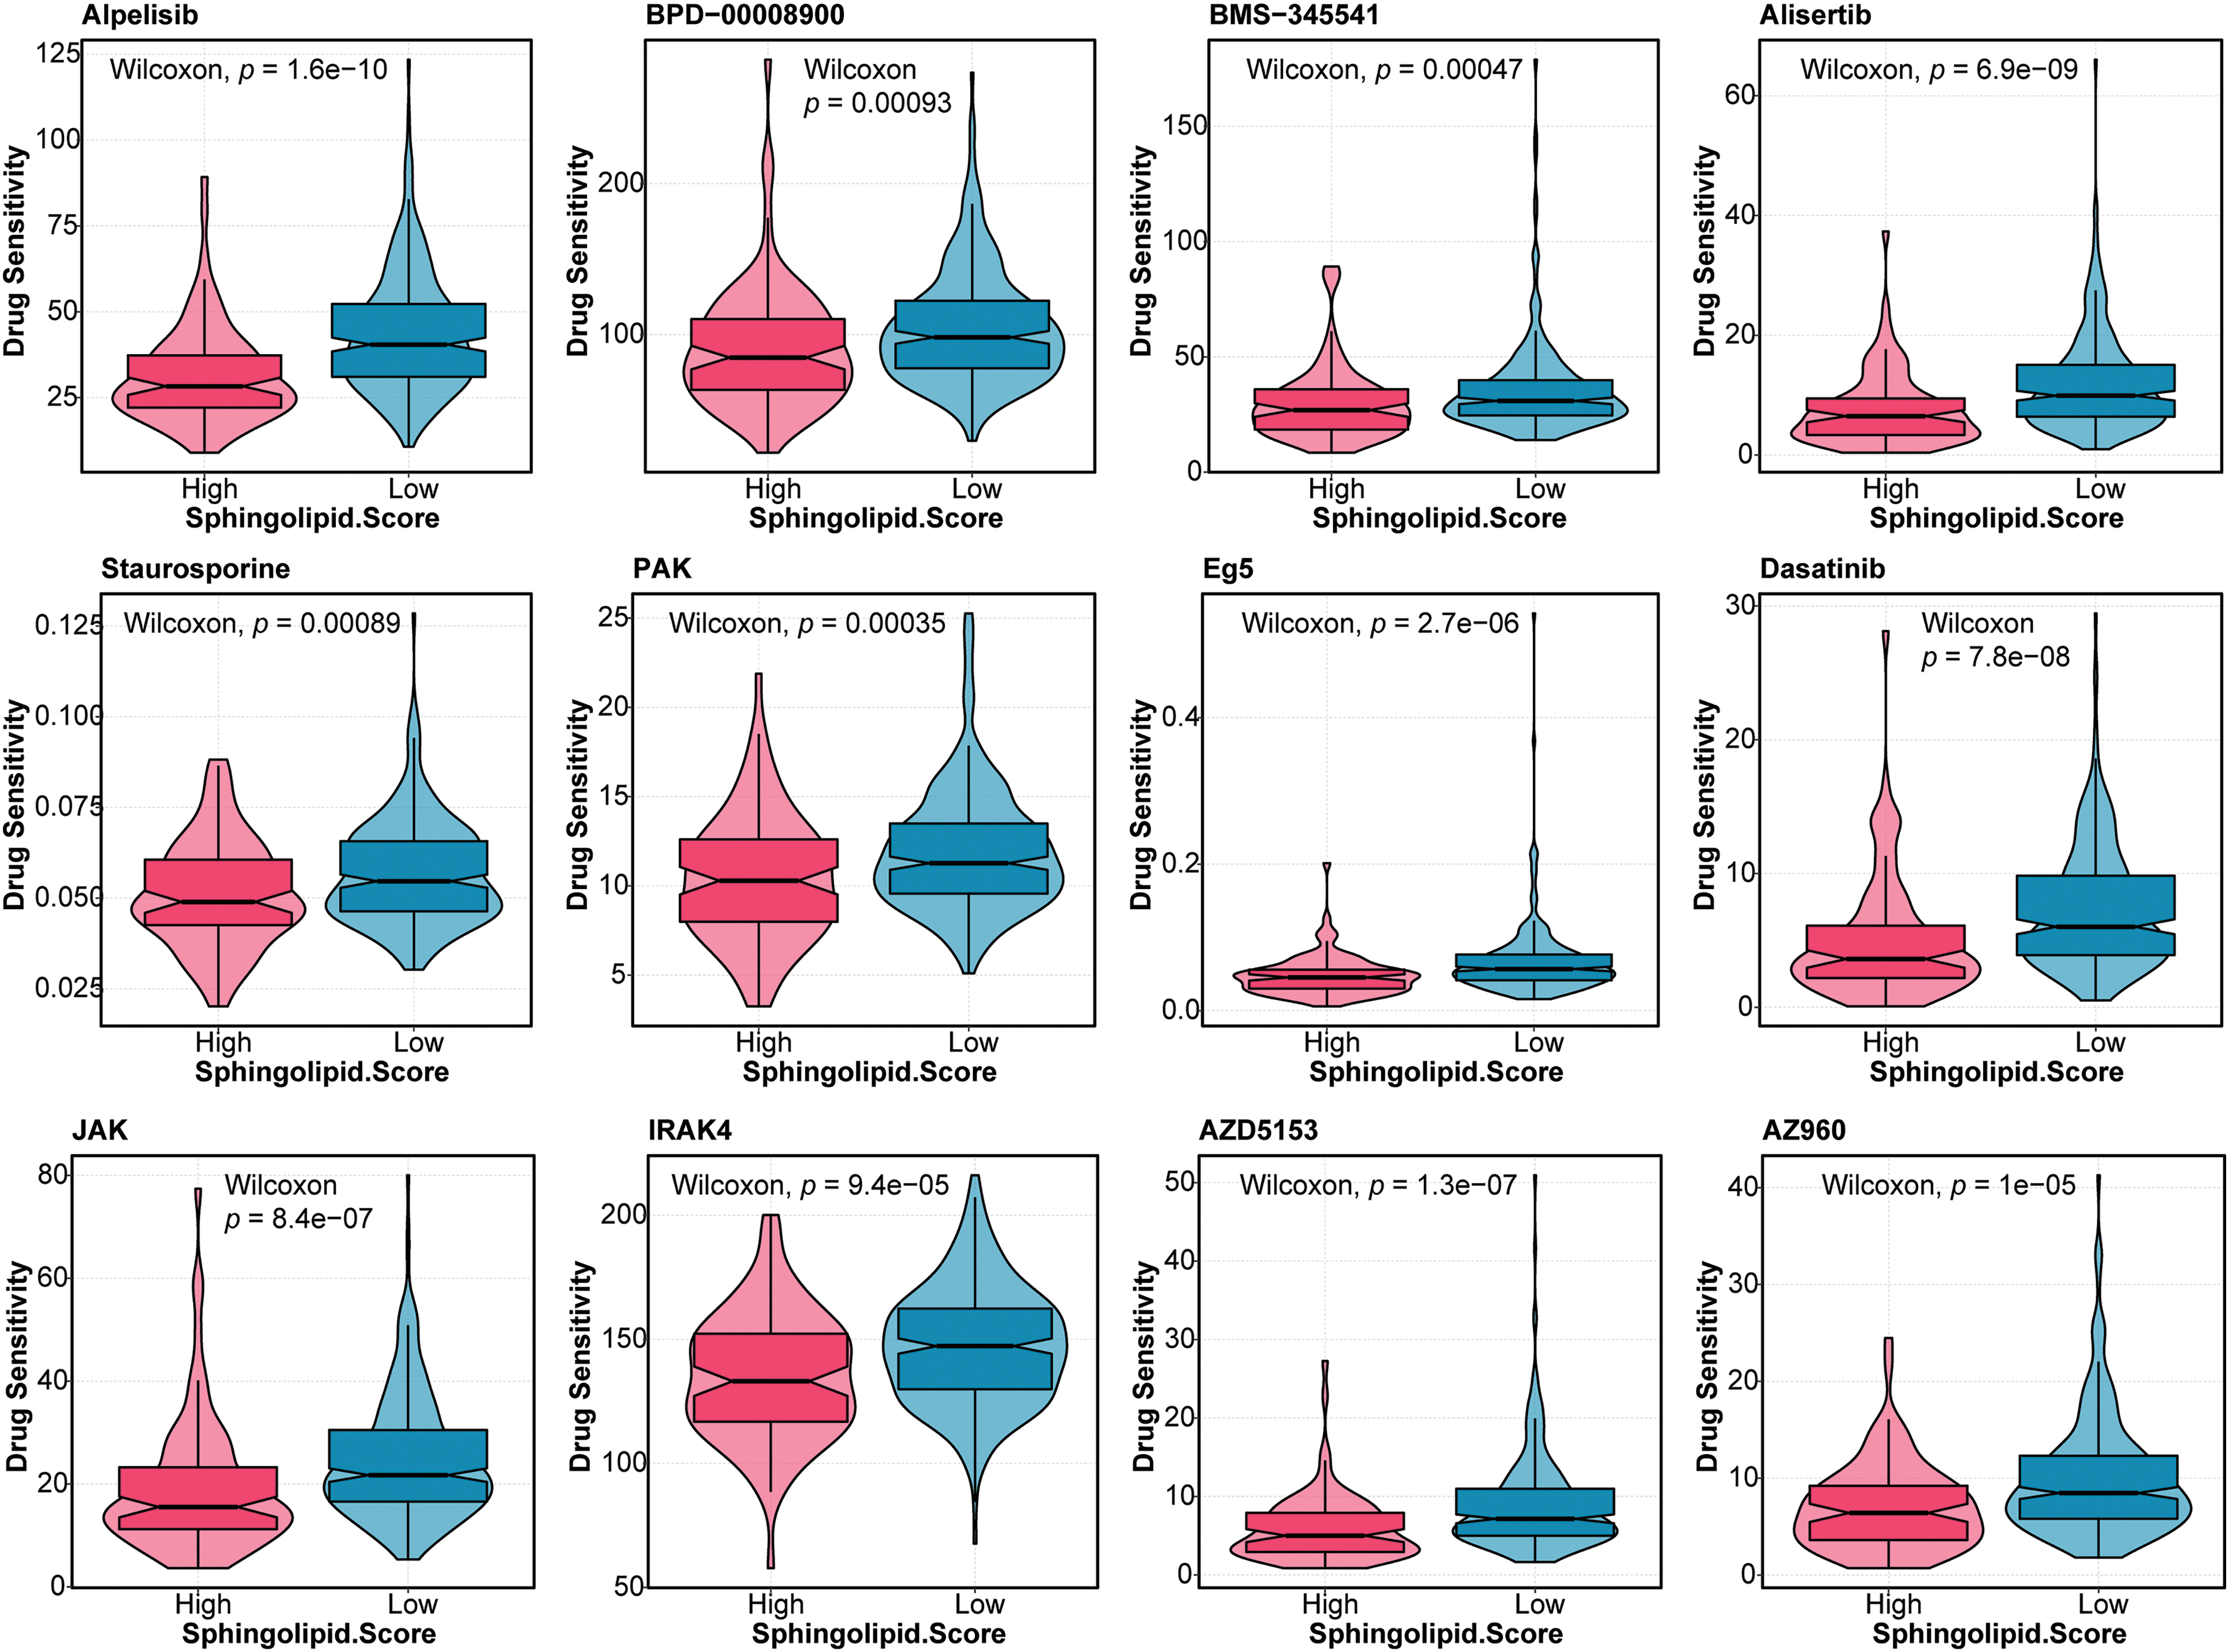
Figure 5: Drug sensitivity analysis in HCC patients Based on the Sphingolipid score, the drug sensitivity of HCC patients was predicted.
Immune microenvironment prediction and functional enrichment analysis
The immune microenvironment was predicted based on clinical characteristics (Grade, Stage, M, N, T, Gender, and Age) and Sphingolipid score. Clinical characteristics Grade, Stage, M, N, T, Gender, and Age were not clearly correlated with the immune checkpoint and immune cell infiltration in HCC. Sphingolipid score correlated with the immune checkpoint (Fig. 6A). With the increase of the Sphingolipid score, immune checkpoints IL-1B, TLR4, TGFB1, and IL-10 levels increased in HCC. To analyze HCC immune cell infiltration, MCPcounter (10 cells), ssGSEA (28 cells), and TIMER (6 cells) data were acquired. The Sphingolipid score showed a positive correlation with Th2 cells, Treg, MDSC, neutrophils, fibroblasts, and macrophages (Fig. 6B). In addition, ESTIMATE analysis found that HCC patients in the High-Sphingolipid score group had significantly higher tumor cell purity (p = 0.0031), immune cells (p = 0.0021), and stromal cells (p = 0.0026) abundance than those in the low-group (Fig. 6C).
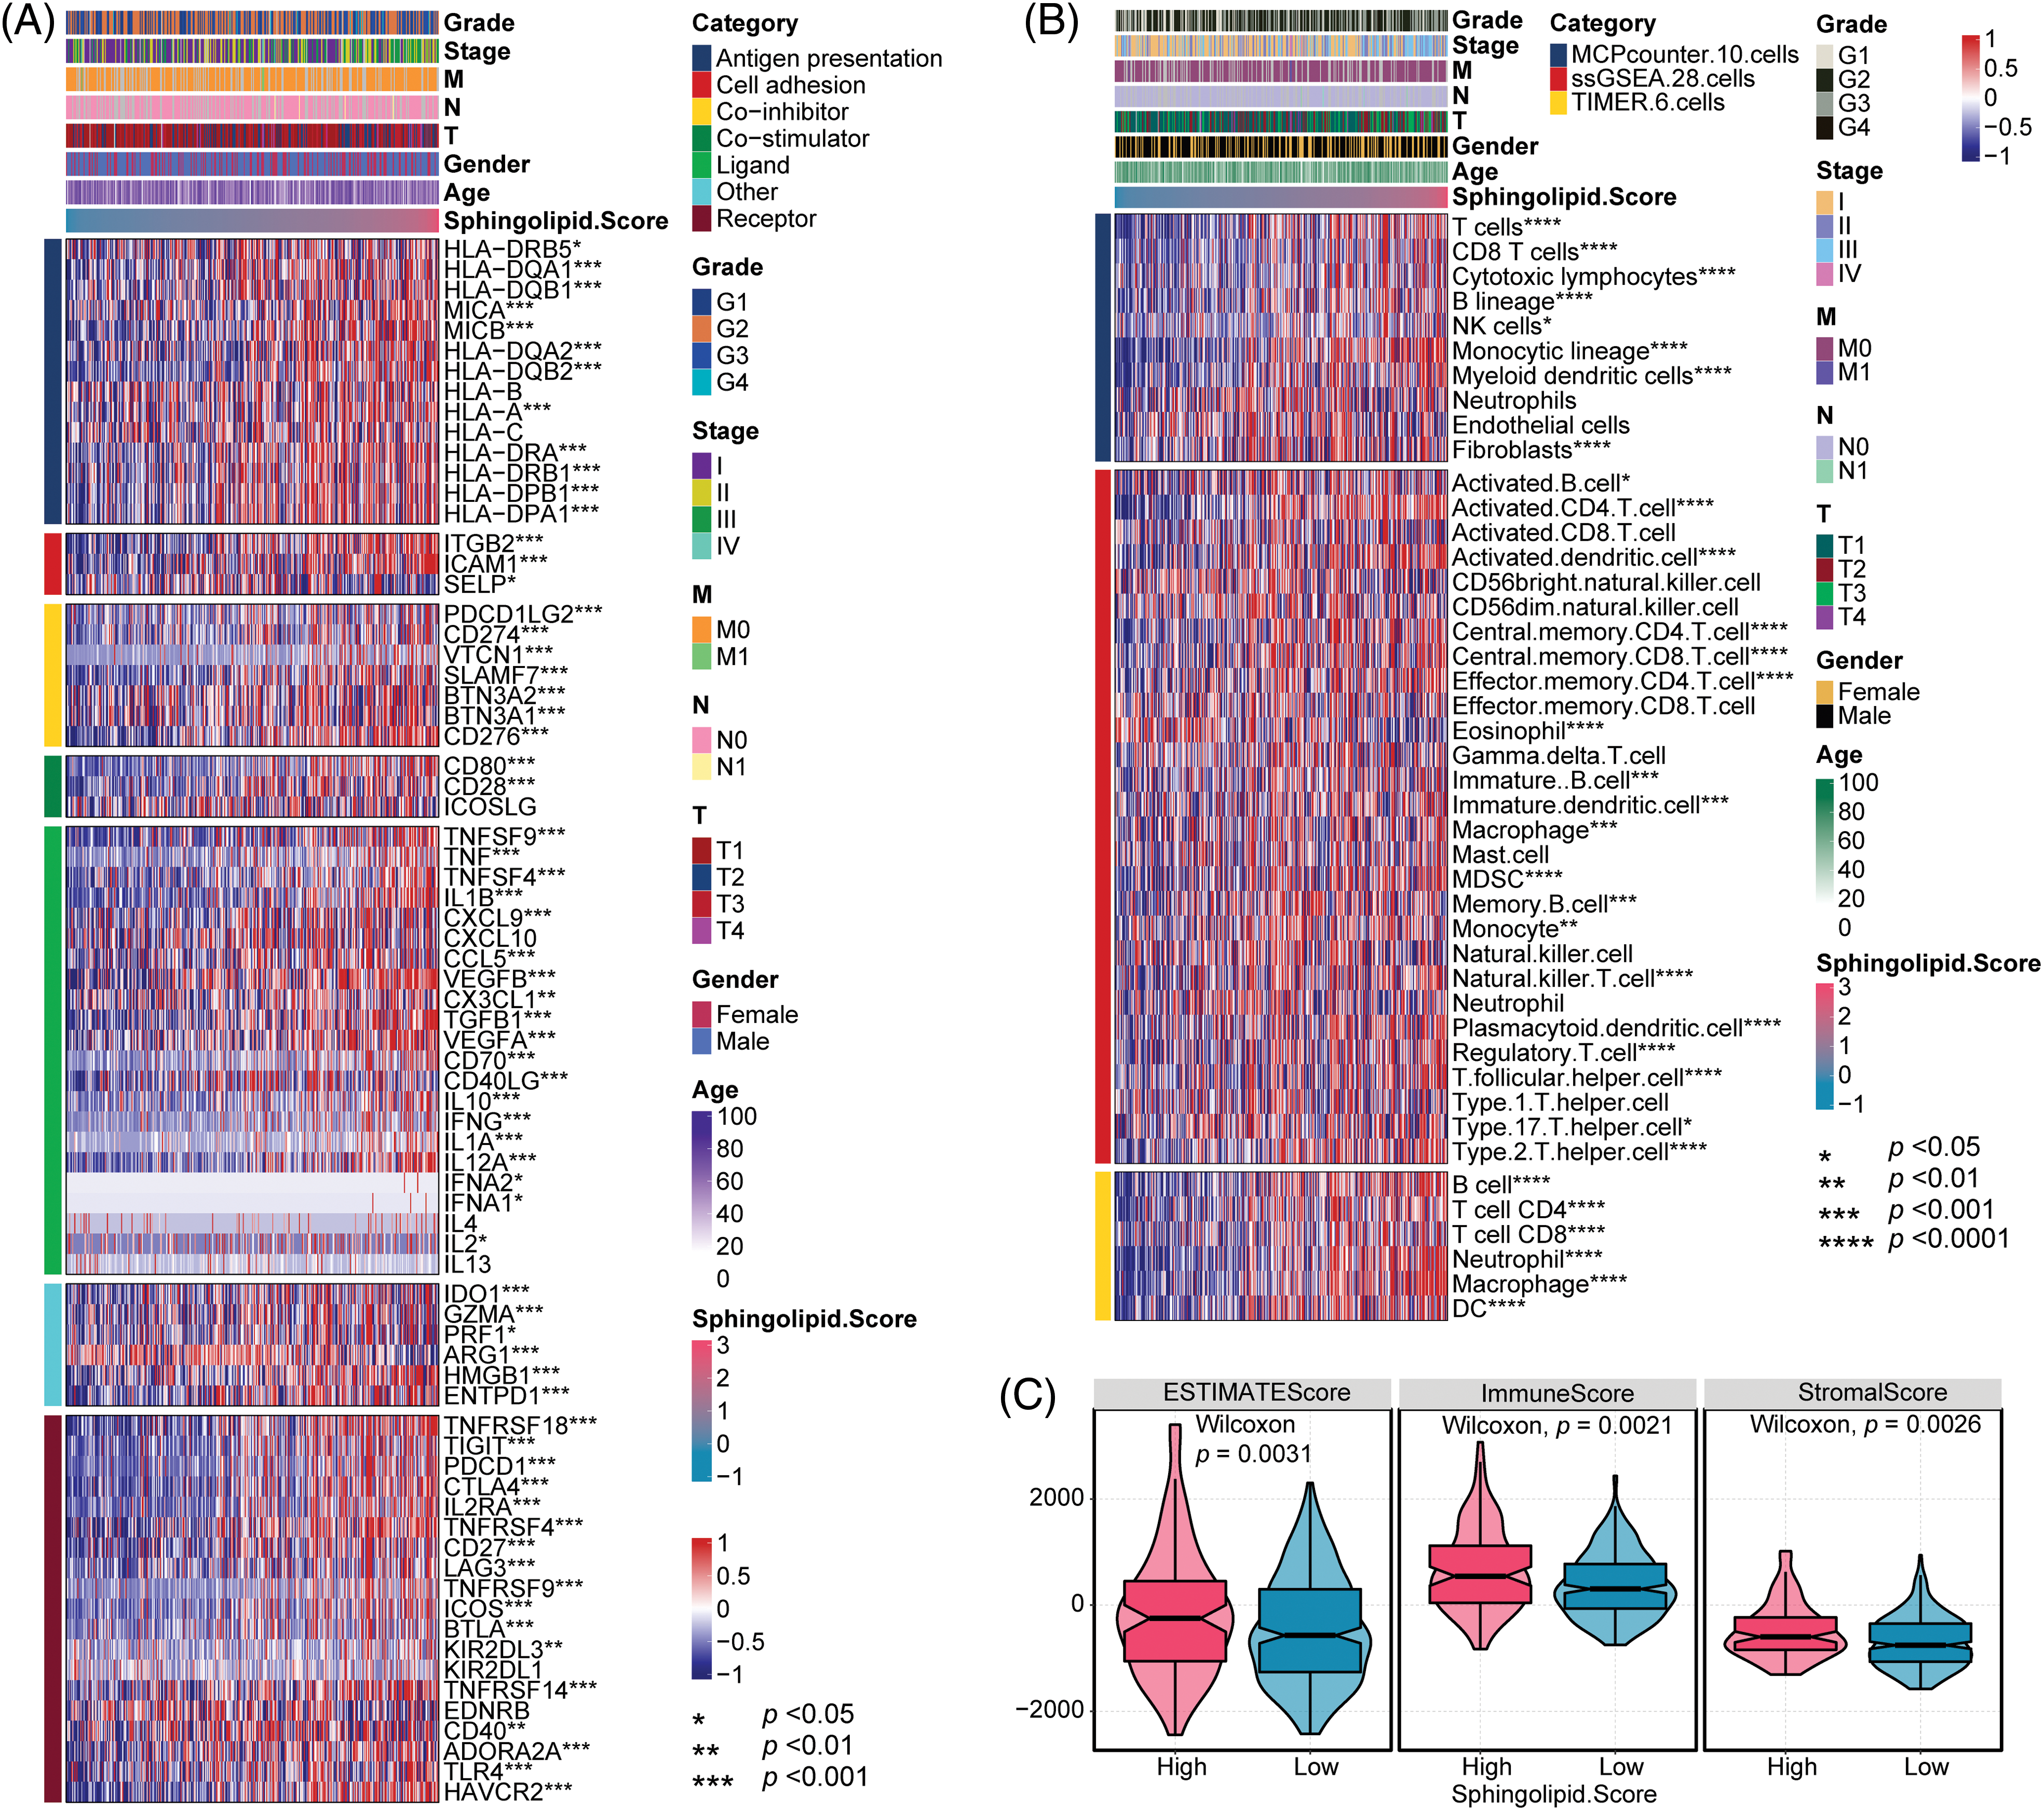
Figure 6: Immune checkpoint and immune cell infiltration analysis. (A) Analysis of immune cell infiltration. (B) Immune checkpoint analysis. (C) Tumor cell purity, immunity, and matrix scores. *p < 0.05, **p < 0.01, ***p < 0.001, ****p < 0.0001.
GSEA functional enrichment analysis showed that Sphingolipid score was associated with immune response, T cell activation, Mapk cascade, cytokine−mediated signaling pathway, Cell proliferation, and cell cycle (Fig. 7).
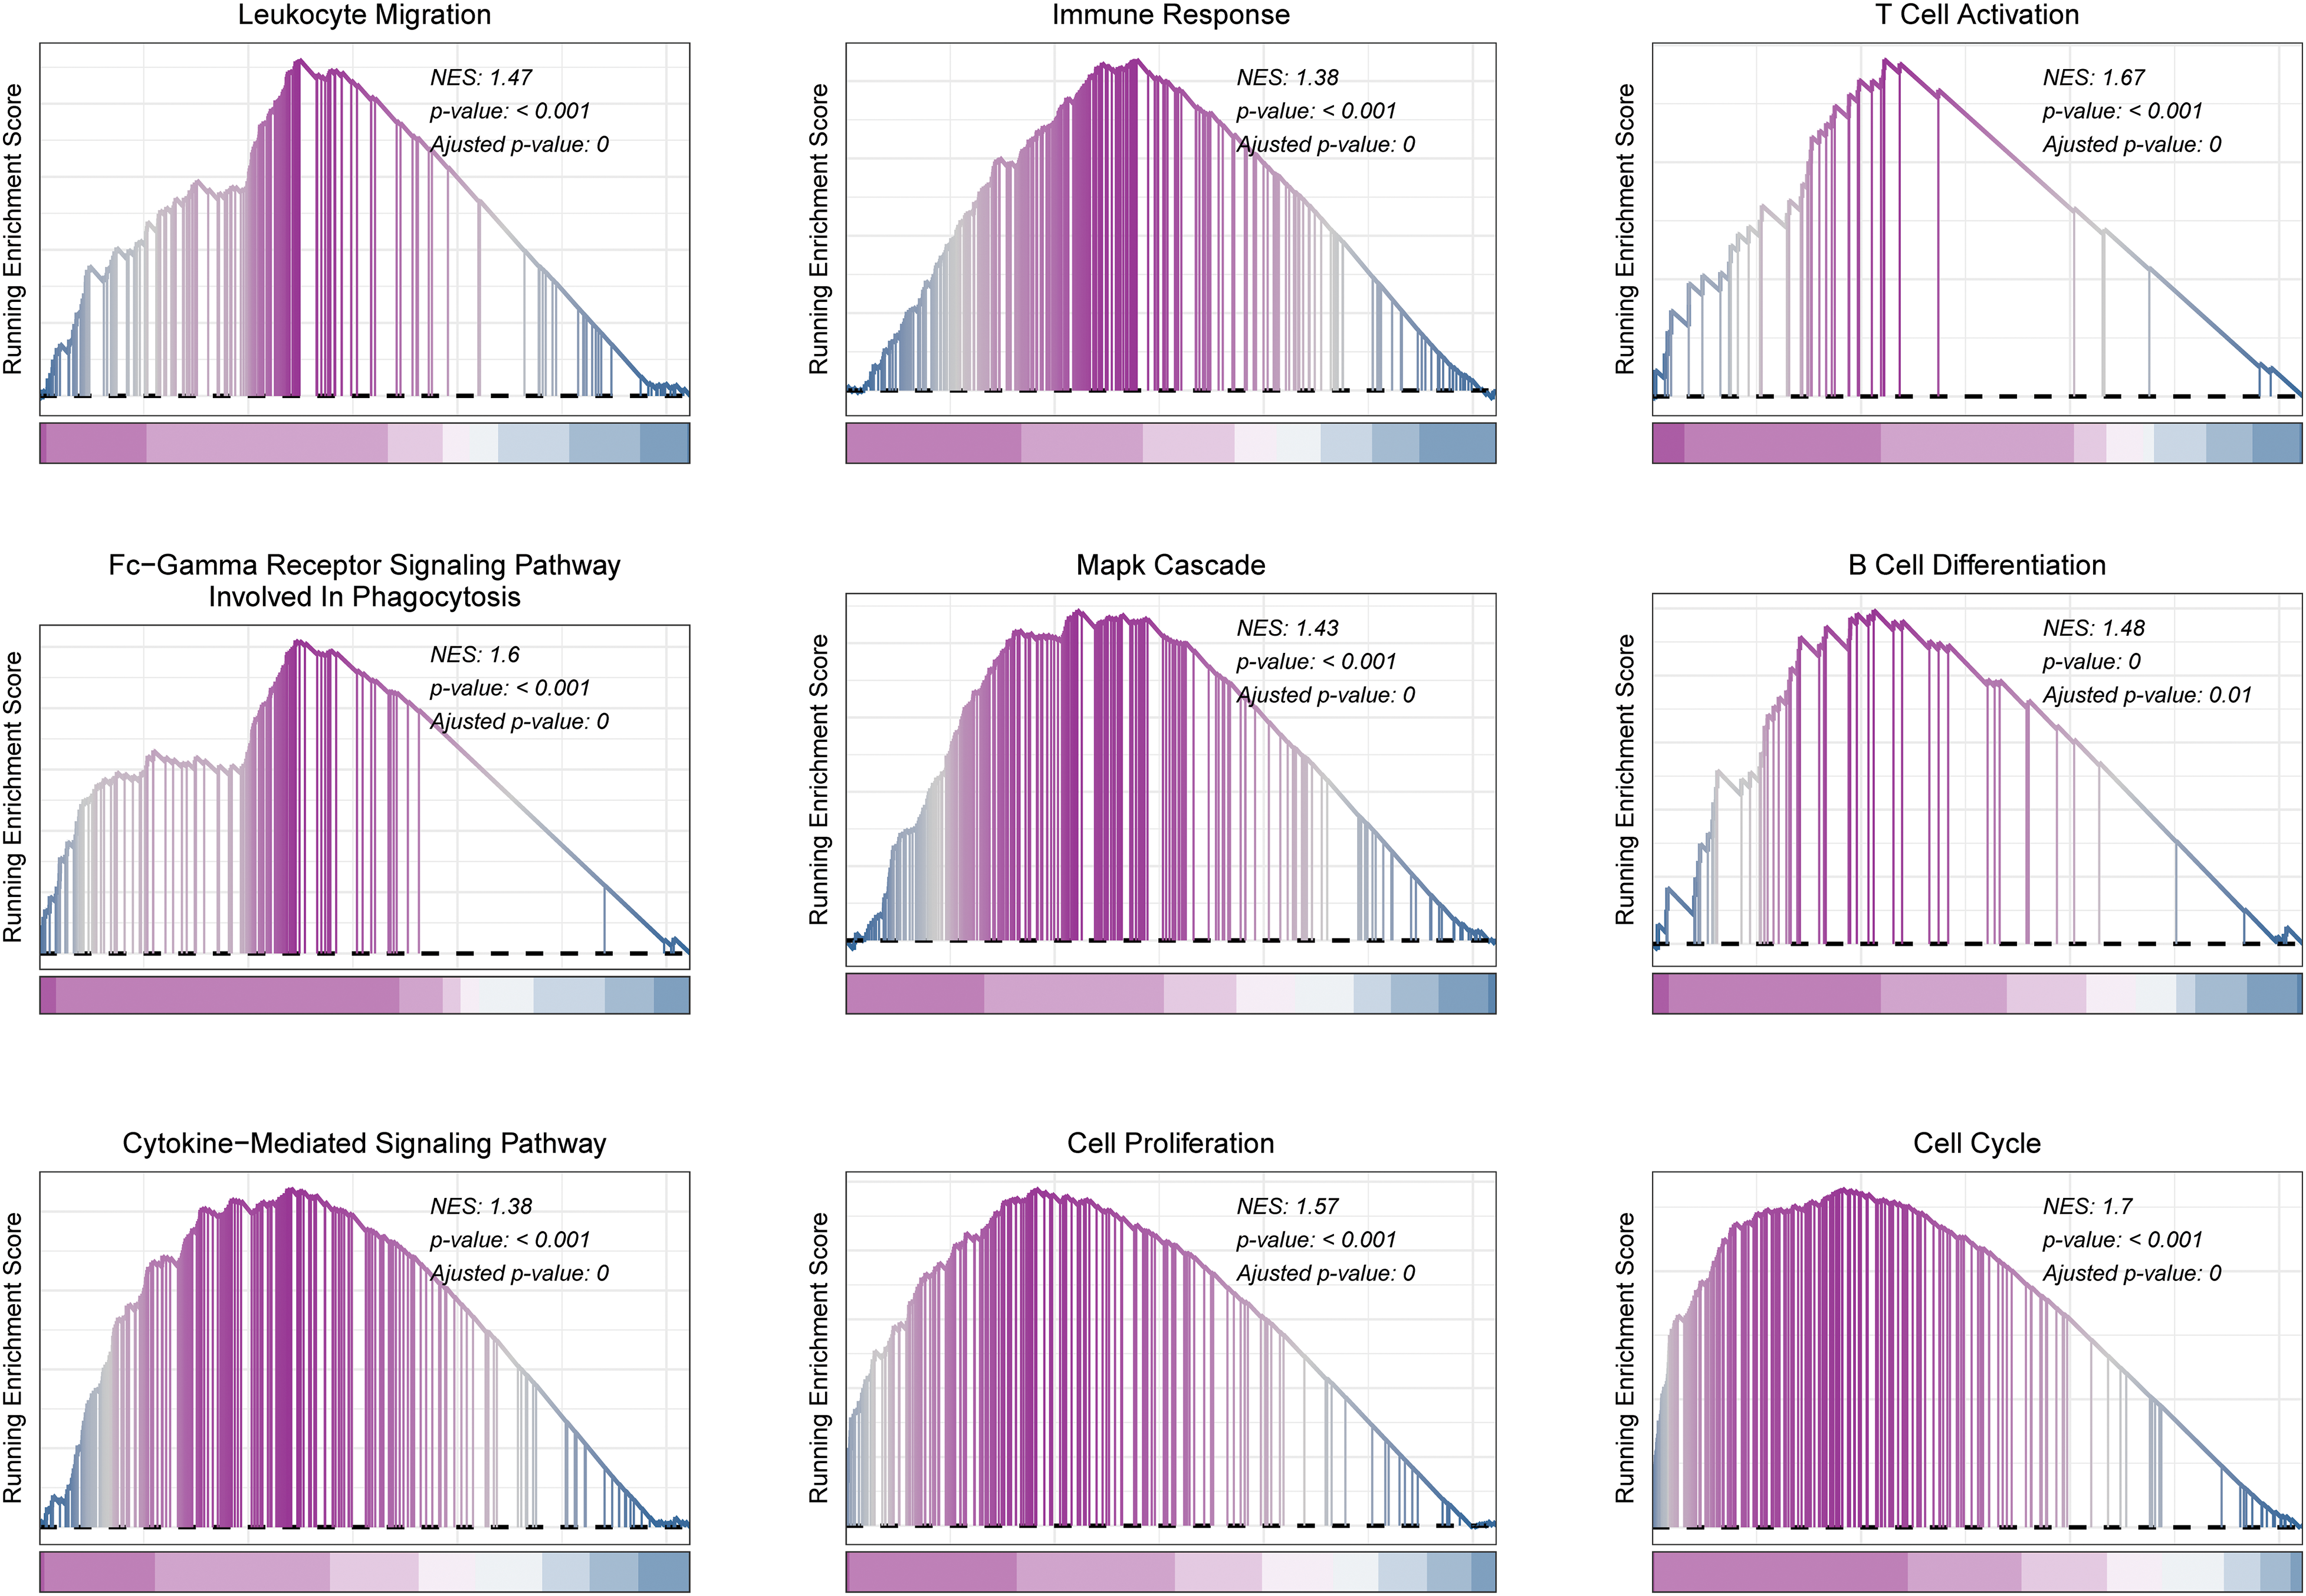
Figure 7: GSEA analysis in HCC. Functional pathways associated with Sphingolipid score were analyzed by GSEA.
Expression of 8 risk genes for the construction of the Sphingolipid score was verified in vitro
Next, mRNA and protein levels of 8 risk genes were verified in normal liver cells (LX2) and liver cancer cells (Hep G2, MHCC-97H, and Hep3B2.1-7) (Figs. 8A, 8B and Suppl. Fig. S1A). Compared to normal liver cells LX-2, the levels of TRIM47 and S100A9 increased in liver cancer cells Hep G2, MHCC-97H, and Hep3B2.1-7. On the other hand, SLC1A7, LPCAT1, and CFHR4 levels decreased in these liver cancer cells. G6PD expression was significantly in Hep G2 lower than in LX-2. CCNB1 levels were significantly decreased in MHCC-97H and Hep3B2.1-7 cells.
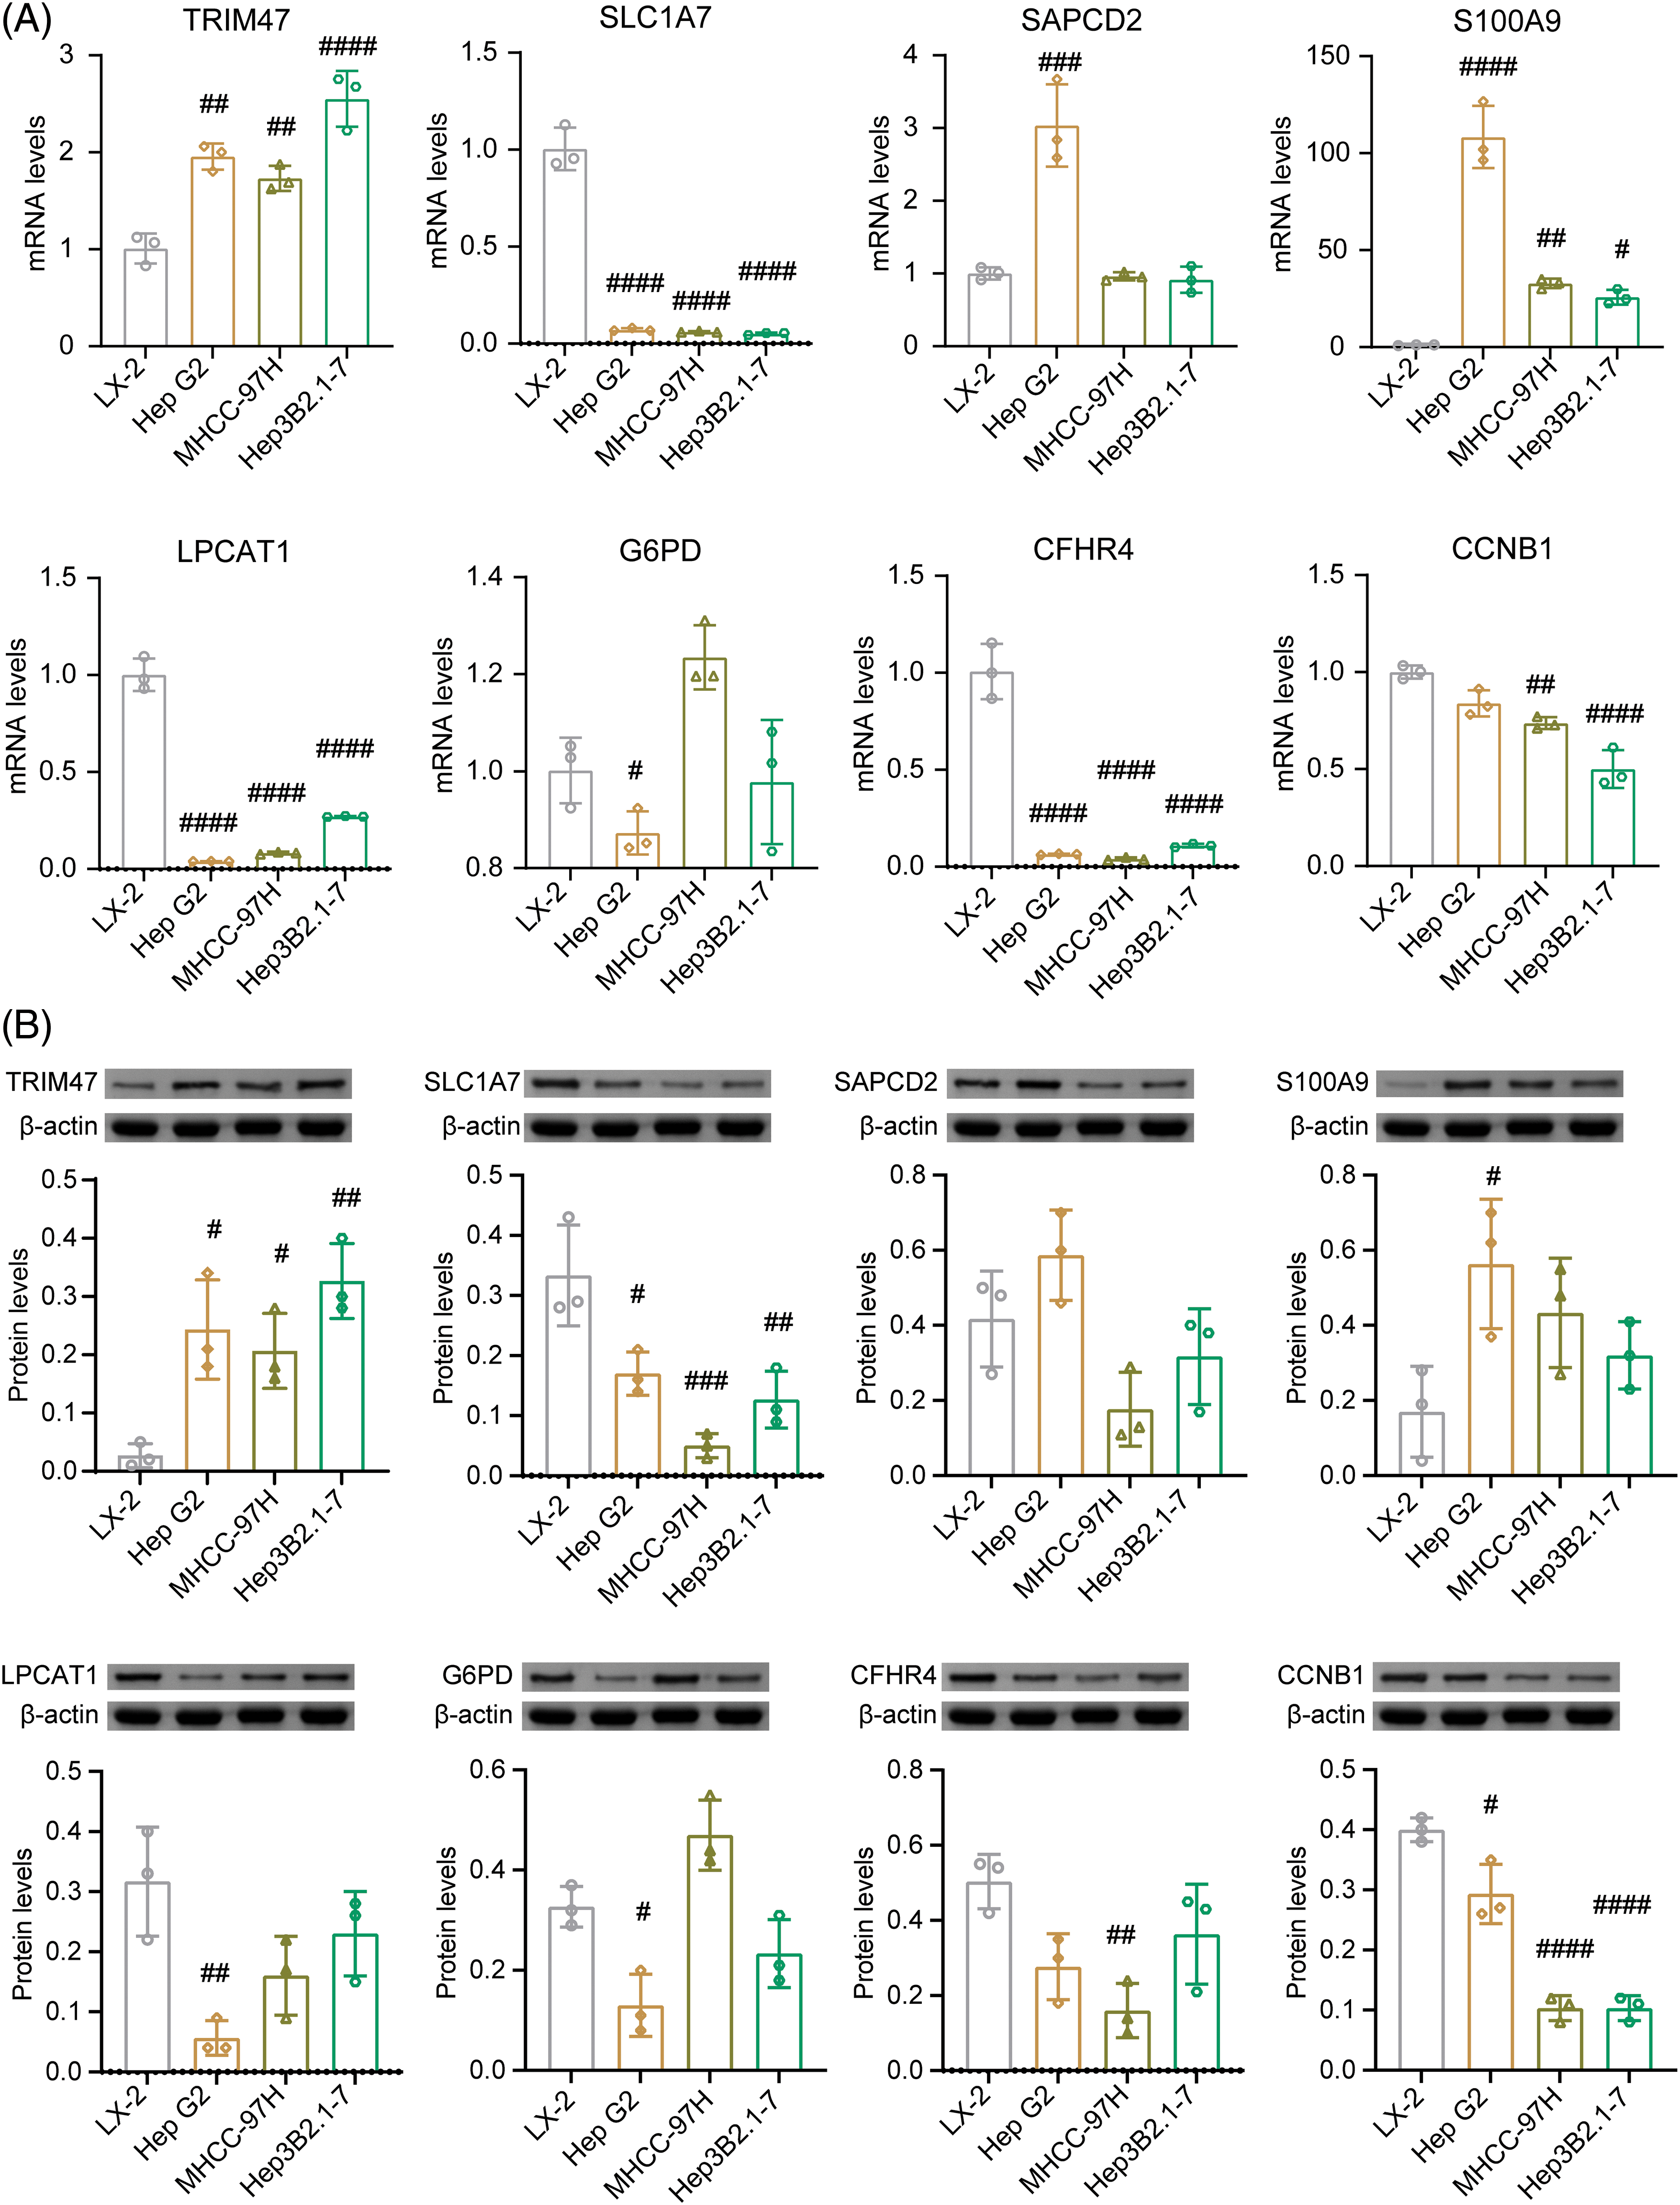
Figure 8: Identification of 8 risk gene expression in vitro. In normal liver cells (LX2) and liver cancer cells (Hep G2, MHCC-97H, Hep3B2.1-7), the mRNA (A) and protein levels (B) of TRIM47, SLC1A7, SAPCD2, S100A9, LPCAT1, G6PD, CFHR4, and CCNB1 were validated. #p < 0.05, ##p < 0.01, ###p < 0.001, and ####p < 0.0001 vs. LX-2, one-way ANOVA, n = 3.
Inhibition of TRIM47 promoted ceramide biosynthesis
In combination with the previous survival analysis and validation results, we identified TRIM47, S100A9, and CFHR4 as potential candidates. The expression levels of TRIM47 and S100A9 were observed to be high in liver cancer cell lines, while CFHR4 was found to be lowly expressed. High TRIM47 levels were related to a poor survival in HCC patients [17]. The role of sphingolipid metabolism in TRIM47 regulation of HCC development remains unclear. Therefore, liver cancer cell Hep G2 and highly metastatic cell line MHCC-97H were selected for further analysis. After silencing TRIM47, proliferation of Hep G2 and MHCC-97H inhibited (Figs. 9A, 9B, and Suppl. Fig. S1B). The apoptosis rate increased (Figs. 9E and 9F).
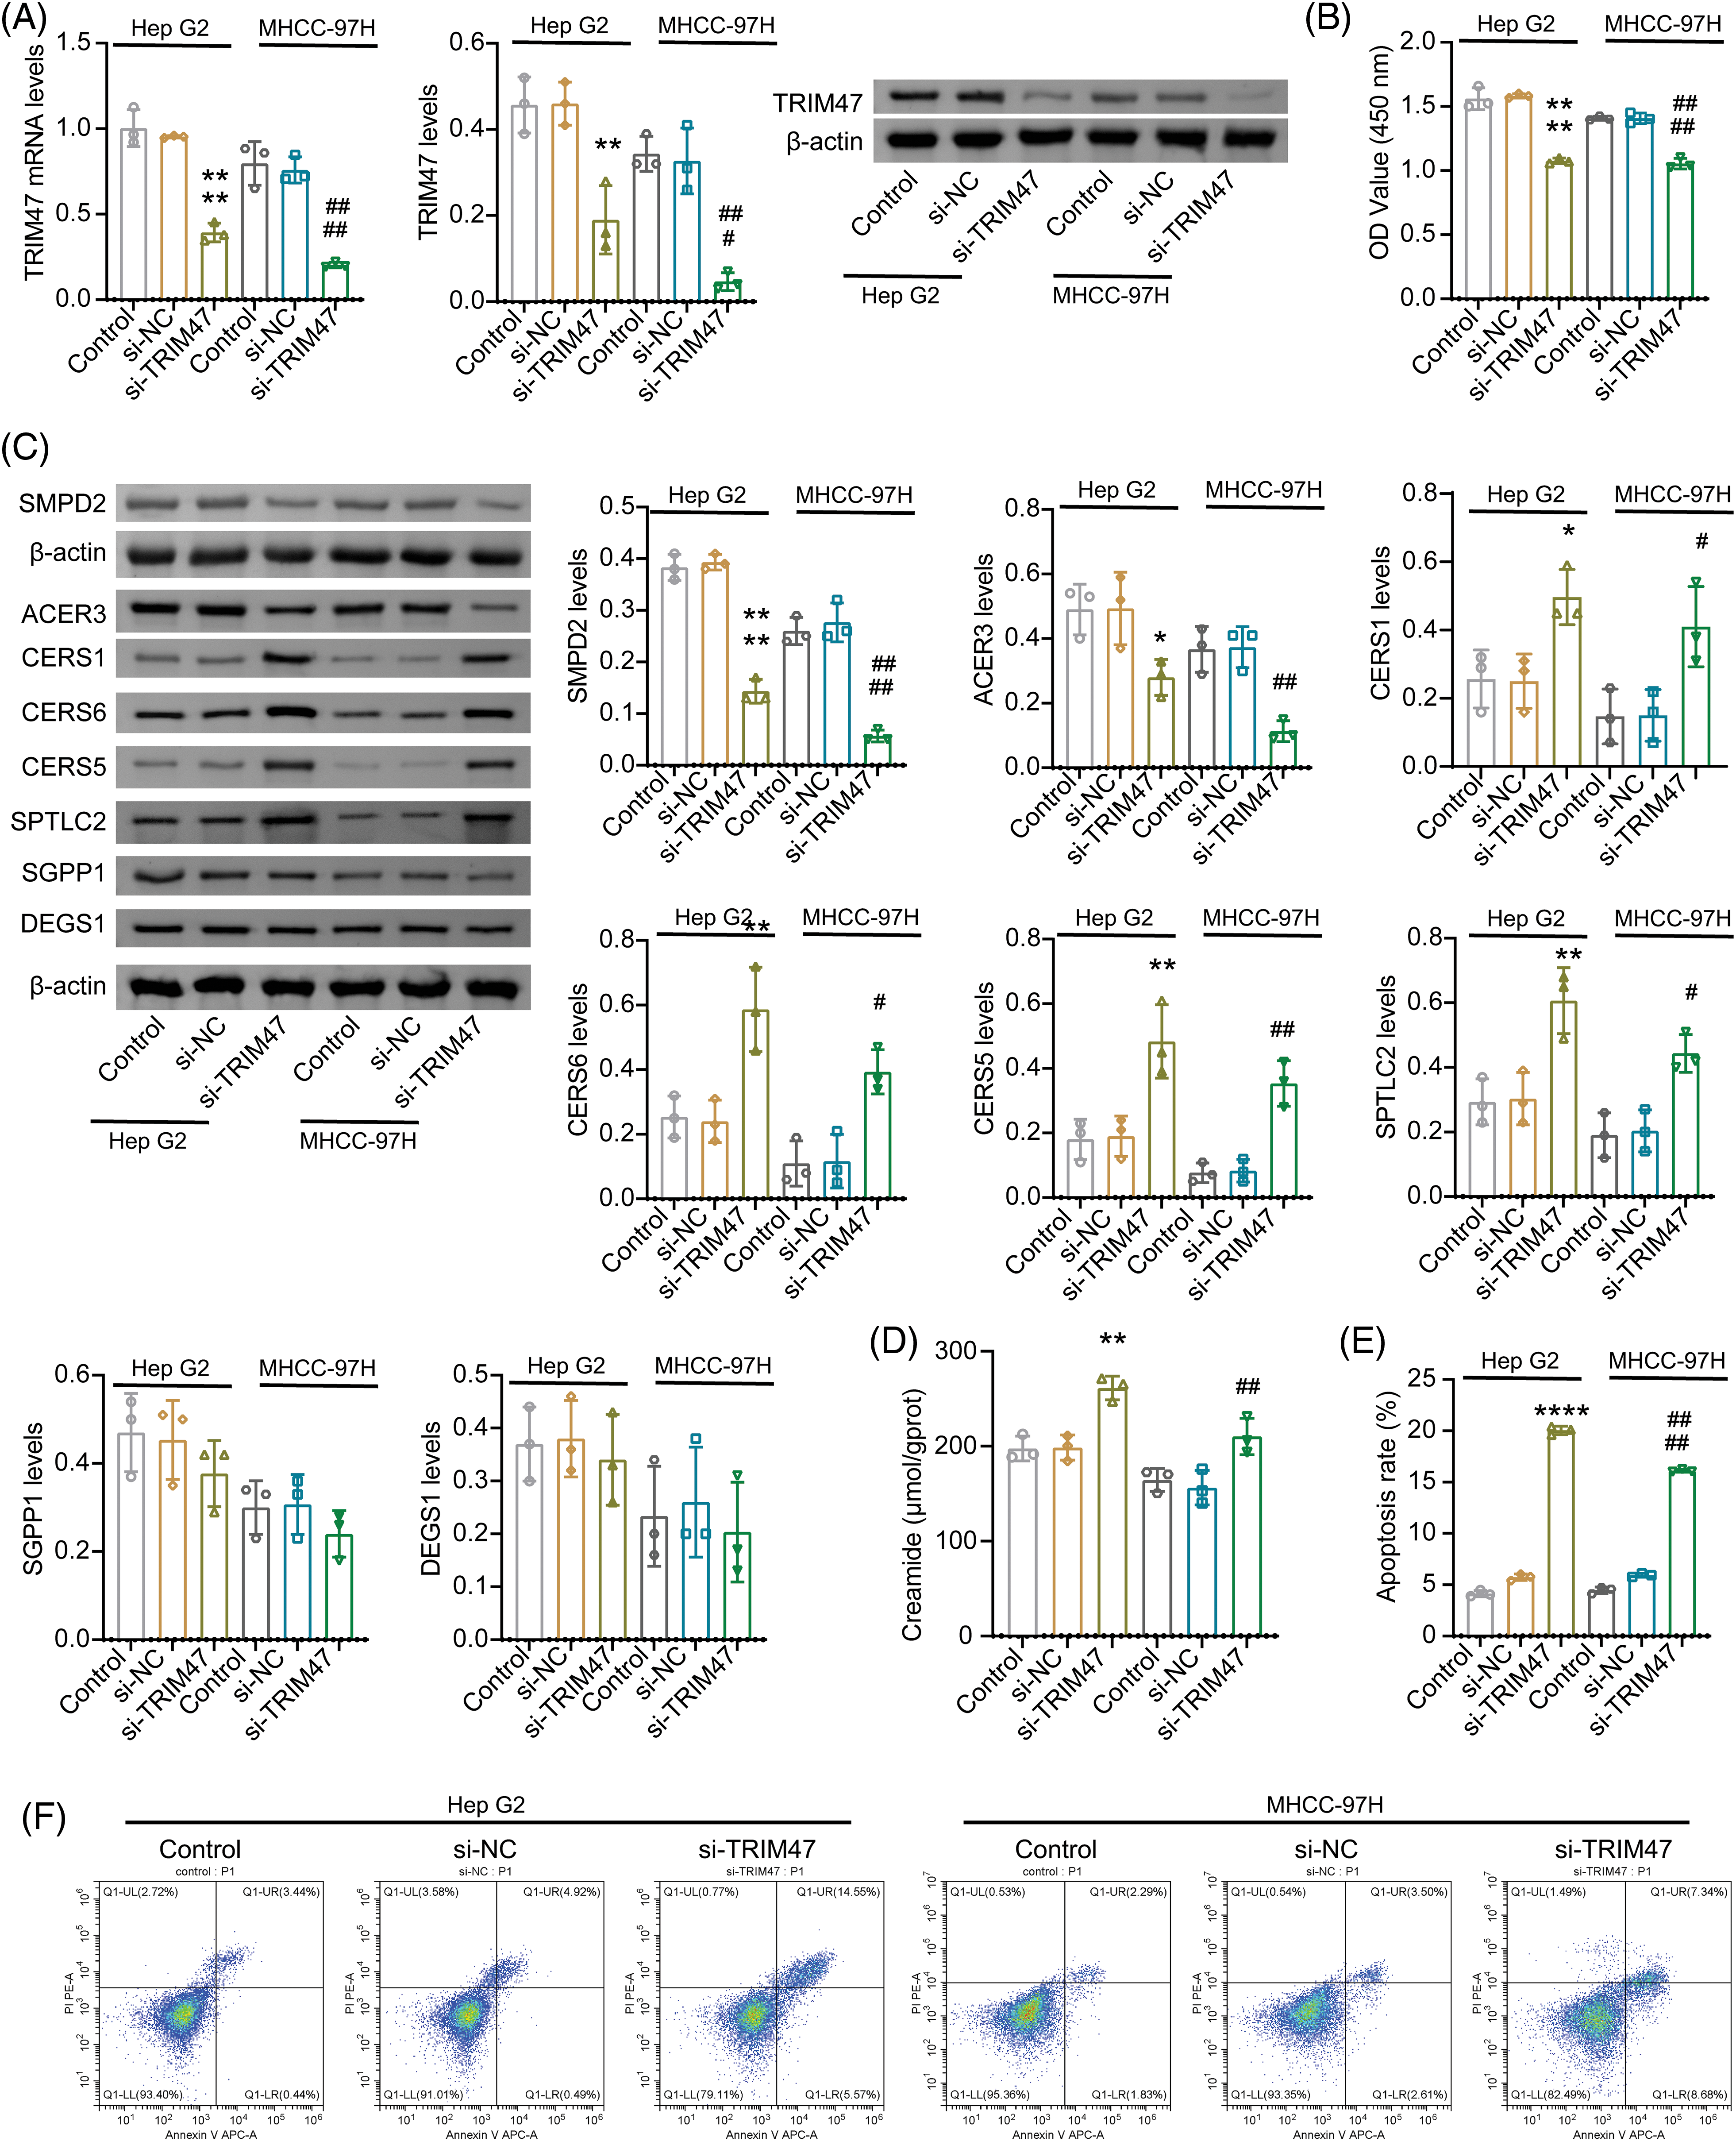
Figure 9: Effect of TRIM47 silencing on sphingolipid metabolism. (A) The expression of TRIM47 was verified in Hep G2 and MHCC-97H cells. (B) Cell proliferation was analyzed. (C) Protein levels were detected to detect the expression of genes related to sphingolipid metabolism, including ACER3, SMPD2, CERS1, CERS6, CERS5, SPTLC2, SGPP1, and DEGS1. (D) Creamide levels. (E and F) Cell apoptosis rate. *p < 0.05, **p < 0.01, and ****p < 0.0001 vs. si-NC (Hep G2); #p < 0.05, ##p < 0.01, ###p < 0.001, and ####p < 0.0001 vs. si-NC (MHCC-97H), one-way ANOVA, n = 3.
Sphingolipid score was related to cell cycle and proliferation. Ceramide, a central molecule in sphingolipid metabolism, can induce cell cycle arrest and apoptosis [18]. After inhibiting TRIM47, the molecular examinations of ceramide biosynthesis (including CERS1, CERS6, SGPP1, DEGS1, CERS5, and SPTLC2) [19,20], catalytic hydrolysis ACER3 [21] and neutral sphingolipase SMPD2 [22] were detected. Among them, the expression of ACER3 and SMPD2 decreased after TRIM47 silencing. The expressions of CERS1, CERS6, CERS5, and SPTLC2 increased. SGPP1 and DEGS1 showed no significant difference (Fig. 9C and Suppl. Fig. S1C). These data suggest that inhibition of TRIM47 can promote ceramide biosynthesis and inhibit hydrolysis. Ceramide was significantly incerased after TRIM47 silencing (Fig. 9D). Combined with the previous results, we speculated that TRIM47, which is related to sphingolipid metabolism, may regulate the proliferation and apoptosis of hepatoma cells by participating in ceramide synthesis and hydrolysis.
Imbalances in sphingolipid metabolism can affect cancer development [23,24]. In HCC, 8 risk genes were screened and used to construct a sphingolipid metabolism-related risk model. Our data suggested that patients in the High-score group were predicted to have a poor prognosis. Genes used to construct the Sphingolipid score included TRIM47, S100A9, LPCAT1, G6PD, and CFHR4. High expression of TRIM47 is associated with poorer overall survival in HCC patients [17]. High G6PD and LPCAT levels suggested a poor prognosis for HCC patients [25–27], while CFHR4 was the opposite [28]. This is consistent with our results. The risk genes TRIM47, S100A9, LPCAT1, and G6PD were related to poor prognosis in HCC patients, while the protective gene CFHR4 indicated a good prognosis. We further verified the effects of TRIM47 silencing on cell proliferation, apoptosis, and sphingolipid metabolism in liver cancer cell lines. TRIM47 inhibition promoted the increase of apoptosis rate of cancer cells and the expression of related indicators of ceramide synthesis (CERS1, CERS6, CERS5, and SPTLC2), and was accompanied by the decrease of ACER3 expression related to catalytic hydrolysis. Therefore, TRIM47 may affect cell proliferation and apoptosis by regulating ceramide synthesis.
GSEA analysis demonstrated that sphingolipid metabolism positively regulated the Immune Response and MAPK Cascade. The p38 MAPK signaling pathway is involved in regulating G6PD and S100A9 in immune cells [29,30]. TRIM47 promotes inflammation by activating the MAPK signaling pathway [31]. Our data found that the immune checkpoints IL-1B, TLR4, TGFB1, and IL-10 were clearly correlated with the Sphingolipid score. G6PD can mediate crosstalk between cancer cells and M2 macrophages through the CCL2/TGF-β1/IL-10 signaling axis to promote tumor progression [32]. Sphingolipid metabolism is involved in the malignant progression of tumors and the regulation of immunosuppressive microenvironment [33]. Patients in the High-Sphingolipid score group had higher immune sores. With increased Sphingolipid score, immune cell Th2, Treg, MDSC, neutrophils, fibroblasts, and macrophages were significantly enriched. A previous study has found that immunosuppressive cells (Th2, Treg) cells, MDSC, neutrophils, and cancer-associated fibroblasts) may be positively correlated with S100A9 and G6PD [34]. As a DAMP molecule, S100A9 can amplify inflammation in the tumor microenvironment and lead to malignant tumor progression [35]. MDSCs are recognized as contributing factors to inflammation-related cancers. The pro-inflammatory molecule S100A9 can stimulate the chemotaxis and activation of MDSC [30]. The differentiation of Treg cells requires binding the S100A8/S100A9 complex to the leukocyte-activating receptor CD69 [36]. G6PD activation can induce macrophage recruitment and M2 polarization [32]. Thus, genes related to sphingolipid metabolism may contribute to immune cell enrichment in HCC. Combined with the above analysis, the immune checkpoint and MAPK signaling pathway may mediate sphingolipid metabolism to regulate immune cell infiltration.
Mutation analysis found that HCC patients with high scores had a significantly increased chance of p53 mutation. In malignant cells, there is a crosstalk between signals related to sphingolipid metabolism and the p53 pathway [37]. The two major sphingolipid metabolic enzymes regulated by p53 are sphingomyelinase (Smase) and ceramide synthase (CerS), of which mammals contain CerS1-6 [38]. CerS6 promotes p53-mutant tumorigenesis by producing excess C16-ceramide [39]. The High-Sphingolipid score group had a higher probability of p53 mutation. In cells containing p53 mutations, exogenous C2-ceramide can induce cancer cell apoptosis by down-regulating p53 expression. However, in wild-type p53, C2-ceramide causes a transient increase in the expression of p53, p21 and retinoblastoma protein (RB), which induces growth arrest and senescence of tumor cells [40]. It was further shown that excess ceramide modulates p53 to inhibit tumor development, albeit through a different mechanism of action.
Sphingolipid metabolism is involved in the drug-resistance process of cancer cells [41]. Ceramide/S1P rheostat is involved in cell survival, carcinogenesis, and drug sensitivity [42]. Ceramide accumulation is thought to contribute to the effects of anti-cancer therapies [43]. For example, glucosylceramide synthase inhibitors induce ceramide accumulation and sensitize H3K27-mutated diffuse midline gliomas to radiation [44]. Combining sphingosine kinase inhibitors and temozolomide can inhibit temozolomide resistance and induce glioblastoma cell death [45]. HCC patients in the High-Sphingolipid score group had good drug sensitivity, including Temozolomide and Dasatinib. Depletion of acid ceramidase sensitizes cells to the Dasatinib [46]. High levels of ceramide can promote the drug sensitivity of cancer cells.
In conclusion, we constructed a sphingolipid metabolism-related prognostic signature based on 8 risk genes (S100A9, TRIM47, SLC1A7, G6PD, LPCAT1, SAPCD2, CCNB1, and CFHR4). TRIM47 may affect the development of liver cancer by regulating the expression of ceramide synthesis and catalytic hydrolysis relevant indicators. HCC patients with a high-Sphingolipid score were predicted to have a high chance of p53 mutation and drug sensitivity. Immune checkpoint and MAPK signaling pathways may be potential pathways for sphingolipid metabolism to regulate immune cell enrichment.
Acknowledgement: None.
Funding Statement: The work was supported by funds from The Science and Technology Project of Hangzhou City (Agriculture and Social Development, No. 2016007) & (Agriculture and Social Development, No. 20201231Y131) & (Social Development, No. 20140633B57), The Science and Technology Project of Yuhang District, Hangzhou City (Nos. 2017002 & 2014003), The Health Science and Technology Project of Hangzhou City (No. 2015B32), Zhejiang Provincial Natural Science Foundation of China under Grant (No. LTGY23H160006) and The Health Science and Technology Project of Zhejiang Province (No. 2023XY009).
Author Contributions: The authors confirm contribution to the paper as follows: study conception and design: Minghua Xie (Corresponding author), Jian Tang; data collection: Jian Tang, Chenqiang Zhu, Yun Che, Yunlong Wu, Ming He, Yi Zhou; analysis and interpretation of results: Jian Tang, Chenqiang Zhu, Yunlong Wu; draft manuscript preparation: Jian Tang. All authors, Jian Tang, Chenqiang Zhu, Yun Che, Yunlong Wu, Ming He, Yi Zhou and Minghua Xie, reviewed the results and approved the final version of the manuscript.
Availability of Data and Materials: The datasets generated during and analysed during the current study are available from the corresponding author on reasonable request.
Ethics Approval: Not applicable.
Conflicts of Interest: The authors declare that they have no conflicts of interest to report regarding the present study.
Supplementary Materials: The supplementary material is available online at https://doi.org/10.32604/biocell.2024.047562.
References
1. Sung H, Ferlay J, Siegel RL, Laversanne M, Soerjomataram I, Jemal A, et al. Global cancer statistics 2020: GLOBOCAN estimates of incidence and mortality worldwide for 36 cancers in 185 countries. CA Cancer J Clin. 2021;71(3):209–49. [Google Scholar] [PubMed]
2. Liu D, Song T. Changes in and challenges regarding the surgical treatment of hepatocellular carcinoma in China. Biosci Trends. 2021;15(3):142–7. [Google Scholar] [PubMed]
3. Pillai A, Ahn J, Kulik L. Integrating genomics into clinical practice in hepatocellular carcinoma: the challenges ahead. Am J Gastroenterol. 2020;115(12):1960–9. [Google Scholar] [PubMed]
4. Green CD, Maceyka M, Cowart LA, Spiegel S. Sphingolipids in metabolic disease: the good, the bad, and the unknown. Cell Metab. 2021;33(7):1293–306. [Google Scholar] [PubMed]
5. Levin MC, Andersson L, Borén J. Cardiomyocytes, sphingolipids and cardio myotoxicity. Curr Opin Lipidol. 2023;34(4):180–8. [Google Scholar] [PubMed]
6. Sattar RSA, Sumi MP, Nimisha, Apurva, Kumar A, Sharma AK, et al. S1P signaling, its interactions and cross-talks with other partners and therapeutic importance in colorectal cancer. Cell Signal. 2021;86(21):110080. [Google Scholar] [PubMed]
7. Castell AL, Vivoli A, Tippetts TS, Frayne IR, Angeles ZE, Moullé VS, et al. Very-long-chain unsaturated sphingolipids mediate oleate-induced rat β-cell proliferation. Diabetes. 2022;71(6):1218–32. [Google Scholar] [PubMed]
8. Simón MV, Vera MS, Tenconi PE, Soto T, Prado Spalm FH, Torlaschi C, et al. Sphingosine-1-phosphate and ceramide-1-phosphate promote migration, pro-inflammatory and pro-fibrotic responses in retinal pigment epithelium cells. Exp Eye Res. 2022;224:109222. [Google Scholar]
9. Wang X, Qiu Z, Dong W, Yang Z, Wang J, Xu H, et al. S1PR1 induces metabolic reprogramming of ceramide in vascular endothelial cells, affecting hepatocellular carcinoma angiogenesis and progression. Cell Death Dis. 2022;13(9):768. [Google Scholar] [PubMed]
10. Do SI, Kim HS, Kim K, Lee H, Do IG, Kim DH, et al. Predictive value of sphingosine kinase 1 expression in papillary thyroid carcinoma. Anticancer Res. 2017;37(10):5399–405. [Google Scholar] [PubMed]
11. Takanashi Y, Funai K, Eto F, Mizuno K, Kawase A, Tao H, et al. Decreased sphingomyelin (t34:1) is a candidate predictor for lung squamous cell carcinoma recurrence after radical surgery: a case-control study. BMC Cancer. 2021;21(1):1232. [Google Scholar] [PubMed]
12. Banaras S, Paracha RZ, Nisar M, Arif A, Ahmad J, Tariq Saeed M, et al. System level modeling and analysis of TNF-α mediated sphingolipid signaling pathway in neurological disorders for the prediction of therapeutic targets. Front Physiol. 2022;13:872421. [Google Scholar] [PubMed]
13. Chi H, Peng G, Yang J, Zhang J, Song G, Xie X, et al. Machine learning to construct sphingolipid metabolism genes signature to characterize the immune landscape and prognosis of patients with uveal melanoma. Front Endocrinol. 2022;13:1056310. [Google Scholar]
14. Yan C, Niu Y, Ma L, Tian L, Ma J. System analysis based on the cuproptosis-related genes identifies LIPT1 as a novel therapy target for liver hepatocellular carcinoma. J Transl Med. 2022;20(1):452. [Google Scholar] [PubMed]
15. Zhao N, Dang H, Ma L, Martin SP, Forgues M, Ylaya K, et al. Intratumoral γδ T-cell infiltrates, chemokine (C-C Motif) ligand 4/chemokine (C-C Motif) ligand 5 protein expression and survival in patients with hepatocellular carcinoma. Hepatol. 2021;73(3):1045–60. [Google Scholar]
16. Chen DL, Cai JH, Wang CCN. Identification of key prognostic genes of triple negative breast cancer by LASSO-based machine learning and bioinformatics analysis. Genes. 2022;13(5):902. [Google Scholar] [PubMed]
17. Dai W, Wang J, Wang Z, Xiao Y, Li J, Hong L, et al. Comprehensive analysis of the prognostic values of the TRIM family in hepatocellular carcinoma. Front Oncol. 2021;11:767644. [Google Scholar] [PubMed]
18. Arora S, Singh P, Tabassum G, Dohare R, Syed MA. miR-495-3p regulates sphingolipid metabolic reprogramming to induce Sphk1/ceramide mediated mitophagy and apoptosis in NSCLC. Free Radic Biol Med. 2022;189:71–84. [Google Scholar] [PubMed]
19. Turathum B, Gao EM, Grataitong K, Liu YB, Wang L, Dai X, et al. Dysregulated sphingolipid metabolism and autophagy in granulosa cells of women with endometriosis. Front Endocrinol. 2022;13:906570. [Google Scholar]
20. Gruzdeva O, Dyleva Y, Belik E, Uchasova E, Ponasenko A, Ivanov S, et al. Expression of ceramide-metabolizing enzymes in the heart adipose tissue of cardiovascular disease patients. Int J Mol Sci. 2023;24(11):9494. [Google Scholar] [PubMed]
21. Hu W, Xu R, Sun W, Szulc ZM, Bielawski J, Obeid LM, et al. Alkaline ceramidase 3 (ACER3) hydrolyzes unsaturated long-chain ceramides, and its down-regulation inhibits both cell proliferation and apoptosis. J Biol Chem. 2010;285(11):7964–76. [Google Scholar] [PubMed]
22. Yabu T, Shiba H, Shibasaki Y, Nakanishi T, Imamura S, Touhata K, et al. Stress-induced ceramide generation and apoptosis via the phosphorylation and activation of nSMase1 by JNK signaling. Cell Death Differ. 2015;22(2):258–73. [Google Scholar] [PubMed]
23. Li R, Hao Y, Wang Q, Meng Y, Wu K, Liu C, et al. ECHS1, an interacting protein of LASP1, induces sphingolipid-metabolism imbalance to promote colorectal cancer progression by regulating ceramide glycosylation. Cell Death Dis. 2021;12(10):911. [Google Scholar] [PubMed]
24. Meng Q, Hu X, Zhao X, Kong X, Meng YM, Chen Y, et al. A circular network of coregulated sphingolipids dictates lung cancer growth and progression. EBioMed. 2021;66:103301. [Google Scholar]
25. Liu B, Fu X, Du Y, Feng Z, Chen R, Liu X, et al. Pan-cancer analysis of G6PD carcinogenesis in human tumors. Carcinogenesis. 2023;44:525–34. doi:10.1093/carcin/bgad043. [Google Scholar] [PubMed] [CrossRef]
26. Song D, Zhou Z, Zhang D, Wu J, Hao Q, Zhao L, et al. Identification of an endoplasmic reticulum stress-related gene signature to evaluate the immune status and predict the prognosis of hepatocellular carcinoma. Front Genet. 2022;13:850200. [Google Scholar] [PubMed]
27. Sun Q, Liu X, Peng Q, Hu L, Jiang X. ncRNA-mediated high expression of LPCAT1 correlates with poor prognosis and tumor immune infiltration of liver hepatocellular carcinoma. J Immunol Res. 2022;2022:1584397. [Google Scholar] [PubMed]
28. Ding Q, Li H, Xu Z, Hu K, Ye Q. Identification of CFHR4 associated with poor prognosis of hepatocellular carcinoma. Front Oncol. 2022;12:812663. [Google Scholar] [PubMed]
29. Yen WC, Wu YH, Wu CC, Lin HR, Stern A, Chen SH, et al. Impaired inflammasome activation and bacterial clearance in G6PD deficiency due to defective NOX/p38 MAPK/AP-1 redox signaling. Redox Biol. 2020;28:101363. [Google Scholar] [PubMed]
30. Huang M, Wu R, Chen L, Peng Q, Li S, Zhang Y, et al. S100A9 regulates MDSCs-mediated immune suppression via the RAGE and TLR4 signaling pathways in colorectal carcinoma. Front Immunol. 2019;10:2243. [Google Scholar] [PubMed]
31. Qian Y, Wang Z, Lin H, Lei T, Zhou Z, Huang W, et al. TRIM47 is a novel endothelial activation factor that aggravates lipopolysaccharide-induced acute lung injury in mice via K63-linked ubiquitination of TRAF2. Signal Transduct Target Ther. 2022;7(1):148. [Google Scholar] [PubMed]
32. Li Y, Han X, Lin Z, Wang C, Fu Z, Sun Q, et al. G6PD activation in TNBC cells induces macrophage recruitment and M2 polarization to promote tumor progression. Cell Mol Life Sci. 2023;80(6):165. [Google Scholar] [PubMed]
33. Zhong Y, Zhang Y, Wei S, Chen J, Zhong C, Cai W, et al. Dissecting the effect of sphingolipid metabolism gene in progression and microenvironment of osteosarcoma to develop a prognostic signature. Front Endocrinol. 2022;13:1030655. [Google Scholar]
34. Chen J, Wang H, Zhou L, Liu Z, Chen H, Tan X. A necroptosis-related gene signature for predicting prognosis, immune landscape, and drug sensitivity in hepatocellular carcinoma. Cancer Med. 2022;11(24):5079–96. [Google Scholar] [PubMed]
35. Li J, Shu X, Xu J, Su SM, Chan UI, Mo L, et al. S100A9-CXCL12 activation in BRCA1-mutant breast cancer promotes an immunosuppressive microenvironment associated with resistance to immunotherapy. Nat Commun. 2022;13(1):1481. [Google Scholar] [PubMed]
36. Lin CR, Wei TY, Tsai HY, Wu YT, Wu PY, Chen ST. Glycosylation-dependent interaction between CD69 and S100A8/S100A9 complex is required for regulatory T-cell differentiation. FASEB J. 2015;29(12):5006–17. [Google Scholar] [PubMed]
37. Lee SC, Lin KH, Balogh A, Norman DD, Bavaria M, Kuo B, et al. Dysregulation of lysophospholipid signaling by p53 in malignant cells and the tumor microenvironment. Cell Signal. 2021;78:109850. [Google Scholar] [PubMed]
38. Park JW, Park WJ, Futerman AH. Ceramide synthases as potential targets for therapeutic intervention in human diseases. Biochim Biophys Acta. 2014;1841(5):671–81. [Google Scholar] [PubMed]
39. Qi D, Song X, Xue C, Yao W, Shen P, Yu H, et al. AKT1/FOXP3 axis-mediated expression of CerS6 promotes p53 mutant pancreatic tumorigenesis. Cancer Lett. 2021;522:105–18. [Google Scholar] [PubMed]
40. Chang WT, Wu CY, Lin YC, Wu MT, Su KL, Yuan SS, et al. C2-ceramide-induced Rb-dominant senescence-like phenotype leads to human breast cancer MCF-7 escape from p53-dependent cell death. Int J Mol Sci. 2019;20(17):4292. [Google Scholar] [PubMed]
41. Petrusca DN, Lee KP, Galson DL. Role of sphingolipids in multiple myeloma progression, drug resistance, and their potential as therapeutic targets. Front Oncol. 2022;12:925807. [Google Scholar] [PubMed]
42. Newton J, Lima S, Maceyka M, Spiegel S. Revisiting the sphingolipid rheostat: evolving concepts in cancer therapy. Exp Cell Res. 2015;333(2):195–200. [Google Scholar] [PubMed]
43. Kumar S, Das S, Sun J, Huang Y, Singh SK, Srivastava P, et al. Mixed lineage kinase 3 and CD70 cooperation sensitize trastuzumab-resistant HER2+ breast cancer by ceramide-loaded nanoparticles. Proc Natl Acad Sci USA. 2022;119(38):e2205454119. [Google Scholar] [PubMed]
44. El Malki K, Wehling P, Alt F, Sandhoff R, Zahnreich S, Ustjanzew A, et al. Glucosylceramide synthase inhibitors induce ceramide accumulation and sensitize H3K27 mutant diffuse midline glioma to irradiation. Int J Mol Sci. 2023;24:9905. [Google Scholar] [PubMed]
45. Noack J, Choi J, Richter K, Kopp-Schneider A, Régnier-Vigouroux A. A sphingosine kinase inhibitor combined with temozolomide induces glioblastoma cell death through accumulation of dihydrosphingosine and dihydroceramide, endoplasmic reticulum stress and autophagy. Cell Death Dis. 2014;5(9):e1425. [Google Scholar] [PubMed]
46. Munk R, Anerillas C, Rossi M, Tsitsipatis D, Martindale JL, Herman AB, et al. Acid ceramidase promotes senescent cell survival. Aging. 2021;13(12):15750–69. [Google Scholar] [PubMed]
Cite This Article
 Copyright © 2024 The Author(s). Published by Tech Science Press.
This work is licensed under a Creative Commons Attribution 4.0 International License , which permits unrestricted use, distribution, and reproduction in any medium, provided the original work is properly cited.
 Downloads
 Citation Tools