
 Submit a Paper
 Propose a Special lssue
 Open Access
ARTICLE
Strain-Specific Trajectories of Behavioural, Neuroinflammatory, and Microbiota Changes under Chronic Stress in Rats with Contrast Levels of Nervous System Excitability
1 High School of the Living Systems, Institute of Medicine and Life Sciences, Immanuel Kant Baltic Federal University, Kaliningrad, 236016, Russia
2 Pavlov Institute of Physiology, Russian Academy of Sciences, St. Petersburg, 199034, Russia
3 Institute of Experimental Medicine, St. Petersburg, 197376, Russia
* Corresponding Author: Irina Shalaginova. Email:
(This article belongs to the Special Issue: Cellular and Molecular Mechanisms Underlying Complex Behaviors and Neuropsychiatric Disorders)
BIOCELL 2025, 49(10), 2007-2031. https://doi.org/10.32604/biocell.2025.071198
Received 02 August 2025; Accepted 12 September 2025; Issue published 22 October 2025
 View Full Text
 Download PDF
Abstract
Objectives: Chronic stress can trigger neuroinflammation and gut microbiota alterations, contributing to post-stress disorders. Individual differences in stress responses, shaped by genetic and physiological factors, require better characterization. We aimed to investigate the long-term effects of chronic stress in rats selectively bred for high and low nervous system excitability. Methods: Adult male rats from two strains selectively bred for high (HT) and low (LT) excitability thresholds of the nervous system underwent a 15-day chronic emotional-pain stress protocol. Behavioral assessments (elevated plus maze), cytokine levels (TNF, IL-1β, IL-6, IL-10) in the hippocampus and amygdala measured by ELISA, glial fibrillary acidic protein (GFAP+) cell counts obtained via immunohistochemistry in the prefrontal cortex, hippocampus, and amygdala, and gut microbiota profiling (16S rRNA sequencing) were conducted on days 7 and 24 post-stress. Results: By day 24, LT rats exhibited reduced exploratory behavior, elevated proinflammatory cytokines, and decreased GFAP+ cells across multiple brain regions. In contrast, HT rats exhibited an anxiety-like phenotype even in controls but showed increased exploratory activity after stress, without signs of brain inflammation; GFAP+ reduction was limited to the hippocampus. Microbiota composition remained stable in LT rats but changed transiently in HT rats. Conclusion: Two distinct stress response patterns emerged: delayed neuroinflammatory and behavioral dysregulation with rigid microbiota in LT rats, vs. primarily behavioral changes with transient microbiota shifts in HT rats. These findings highlight the need to consider genetic excitability traits when modeling stress-related disorders and exploring potential therapeutic strategies.Keywords
Supplementary Material
Supplementary Material FileChronic stress induces complex behavioural and neuroimmune changes and affects the gut–brain–microbiota axis—key mechanisms implicated in the development of stress-related disorders. Chronic stress or elevated glucocorticoid (GC) circulation exerts a pro-inflammatory effect and increases the expression of pro-inflammatory cytokines interleukin-1β (IL1β) and tumor necrosis factor (TNF) in the prefrontal cortex (PFC) [1]. Prolonged stress elevates mRNA and protein levels of TNF, IL1β, and inducible nitric oxide synthase (iNOS) in the hippocampus and cerebral cortex of rodents [2,3].
Post-stress neuroinflammation has been implicated in the development of psychiatric disorders such as depression and anxiety disorders [4]. In depression, increased numbers of leukocytes, monocytes, and neutrophils have been demonstrated in patients’ peripheral blood, along with elevated levels of circulating pro-inflammatory cytokines and acute-phase proteins [5]. Peripheral inflammation can be “transmitted” to the central nervous system, leading to activation of microglia and astrocytes as a result of monocyte infiltration or due to the passage of pro-inflammatory signals through a compromised blood–brain barrier [4,6].
Post-stress neuroinflammation is closely linked to alterations in gut microbiota, as stress induces dysbiosis that increases intestinal permeability and facilitates the transfer of pro-inflammatory molecules into the bloodstream. These molecules and bacterial metabolites can cross the compromised blood–brain barrier and activate microglia and astrocytes, thereby promoting neuroinflammation and exacerbating behavioral impairments [7]. Importantly, microbial metabolites, such as short-chain fatty acids (SCFAs), are known to modulate host physiology not only through immune signaling but also via epigenetic mechanisms, influencing metabolic homeostasis, blood-brain barrier function, and gene expression in neural circuits [8]. Thus, the gut microbiota acts as a critical regulator of post-stress neuroinflammation and contributes to the pathogenesis of stress-related disorders.
The question that remains to be clarified is how the neuroimmune and microbiota-gut-brain interactions can be triggered in the brain in the absence of overt inflammation or infection, and which genetic factors make the organism more vulnerable to severe neuroinflammation trajectories and, consequently, to more pronounced behavioral impairments.
Animal models, particularly rat strains selectively bred for differing nervous system excitability thresholds, provide valuable insights into these mechanisms. These strains exhibit marked differences in behavioral, biochemical, physiological, and microbiological responses to stress. High-excitability (low-threshold, LT) rats exhibit more complex behavioral changes and distinct hippocampal neuronal density dynamics under chronic stress compared to low-excitability (high-threshold, HT) rats [9–11]. They also differ in post-stress inflammation severity across brain regions [10].
Preliminary microbiome studies reveal strain-specific gut microbial shifts after stress and interstrain differences in intact rats [12]. The aim of the present study was to investigate the behavioral, neuroimmune, and gut microbiota responses to chronic stress in two rat strains selectively bred for high and low nervous system excitability.
Specifically, we aimed to characterize the distinct trajectories of stress-induced alterations in behavior, cytokine expression, astroglial changes, and microbial composition, in order to elucidate how genetic traits of rat strains with contrast excitability threshold shape individual adaptive trajectories to chronic stress.
The study used adult male rats (5 months old, 300–350 g) from two selectively bred strains with contrasting thresholds of nervous system excitability: high-threshold (HT, low-exitability) and low-threshold (LT, high-exitability) strains. These strains were derived from Wistar rats originally obtained from the Stolbovaya breeding facility (Moscow region, Russia), and have been maintained as closed in-house colonies at the I.P. Pavlov Institute of Physiology for over 70 generations under controlled breeding protocols. Selection was based on the threshold of neuromuscular excitability, determined via stimulation of the tibial nerve (n. tibialis) with 2 ms rectangular electrical pulses. These are not commercially available strains.
Animals of a given strain were obtained from 5–6 different cages, which substantially reduces the risk that microbiological features of individual cages influenced the results. All animals were housed in the same animal facility under standard controlled conditions in cages of six animals each, with ad libitum access to food and clean water. The feed contained 18%–24% protein, 40%–70% carbohydrates, and 4%–9% fat, as well as essential vitamins and minerals. Lighting conditions were automatically controlled with a 12-h light/12-h dark cycle; the light period began at 8:00 a.m.
The total number of animals in the study was 48 (control n = 24, experimental n = 24). The number of animals in the group (n = 6) was selected in accordance with previous studies using these selectively bred strains, where comparable group sizes were sufficient to identify behavioral and neuroimmune effects specific to the strain. This design reflects both the ethical considerations of reducing the use of animals and the practical constraints associated with maintaining long-term breeding strains of rats.
Animals were randomly assigned to experimental and control groups. Behavioral testing and subsequent data analysis were conducted by experimenters blinded to group identity. Sample size was determined based on prior studies using these strains, which demonstrated consistent group differences in behavioral and molecular stress responses. Animal welfare was monitored daily. No signs of distress or health deterioration were observed, and no animals required removal from the study.
Animal experiments were conducted in accordance with the guidelines set forth in Council Directive 86/609/EEC of the European Community on the protection of animals used for experimental purposes. The protocol was approved by the Bioethics Commission of the I.P. Pavlov Institute of Physiology of the Russian Academy of Sciences (Protocol number 09/16 dated 16 September 2021).
The experimental animals were subjected to prolonged emotional-pain stress according to the protocol of Hecht [9]. For 15 consecutive days, each animal received a daily series of twelve light signals: six unreinforced (10 s each) and six paired with an electrical current (2.5 mA, 2 ms). The order of conditioned and unconditioned stimuli alternated with a probability of 0.5, preventing the development of a stable conditioned reflex.
Behavioral assessments were conducted between 10:00 a.m. and 2:00 p.m. As a disinfectant, 70% ethanol was used to clean the behavioral apparatus. In the Elevated Plus Maze (EPM) test, the following parameters were evaluated: time spent in the open and closed arms, number of entries into the center, time spent in the center, freezing time, number of head dips, and number of unsupported rears.
Tests involved video recording of the animal’s free behavior in the apparatus for 5 min. Behavioral data were analyzed by the same operator, who counted behavioral parameters from pre-coded video recordings, ensuring blinding to the animals’ group (strain) assignments.
2.3 Enzyme-Linked Immunosorbent Assay (ELISA)
Animals were decapitated and perfused 7 (n = 24) and 24 (n = 24) days after the end of prolonged emotional-pain stress for immunohistochemical staining. The rats were transferred from the cage into a desiccator containing cotton soaked with isoflurane (ZVS-01-33647, IsoNic, Chemical Iberica, Salamanca, Spain) to induce anesthesia. After anesthesia took effect (loss of consciousness, muscle relaxation, absence of reflex responses), the animal was placed on a metal tray, and incisions were made through the chest and diaphragm. Then bilateral cuts were made along the chest to the clavicles, and excess tissues were clamped to expose the heart. Next, a careful incision was made in the left ventricle, and a perfusion needle was inserted halfway towards the aorta. A cut was then made in the right atrium to allow blood outflow. Through the perfusion needle, a 0.9% NaCl solution at room temperature was infused for several minutes until the liver and eyes began to lighten. After the perfusion, decapitation was performed, and the brain was extracted for further analysis.
For the analysis of Iba1 (Ionized calcium-binding adapter molecule 1), TNF (Tumor necrosis factor), IL-6 (Interleukin-6), IL-10 (Interleukin-10), and IL-1β (Interleukin-1 beta) protein levels, brain samples (hippocampus and amygdala) were homogenized in 10 volumes of PBS (phosphate-buffered saline, pH 7.4). The homogenized samples were centrifuged for 5 min at 1500× g. The collected supernatants were stored at –80°C until protein analysis.
Protein concentrations in the supernatants were measured using ELISA kits (Cloud-Clone Corp., SEA133Ra, SEA563Ra, SEC288Ra, SEA056Ra, SEA079Ra, Wuhan, China). Optical density was measured using a Synergy 2 microplate reader (PMT 49984, Bio Tek Instruments, Winooski, VT, USA) after the completion of the reaction. ELISA procedures were performed according to the manufacturer’s instructions.
Levels of all proteins were normalized to total protein concentration. Total protein was determined by the Bradford method using the Bio-Rad Protein Assay Kit 1 (5000201, Bio-Rad Laboratories, CA, USA).
2.4 Immunohistochemical Staining
Brain was placed in ice-cold PBS (phosphate-buffered saline, pH 7.4) and fixed in 4% paraformaldehyde (PFA) for two days at +4°C for subsequent immunohistochemical staining. The brain was then washed in PBS containing 0.01% sodium azide (NaN3) and transferred to a 30% sucrose solution (170764, LenReaktiv, St. Peterburg, Russia) for cryoprotection for at least two days, until the brain sank to the bottom of the cylindrical tube. Next, the brain was mounted on a cryostat chuck and embedded in freezing medium (Tissue-Tek O.C.T. Compound, Sakura Finetek, Japan). Whole brains were frozen in a cryostat (Cryostat Microtome KD-3000, KEDEE, Jinhua, China) at –20°C for 30 min prior to sectioning. Brain sections were cut at 50 µm thickness and placed into a 12-well plate containing PBS with 0.01% sodium azide (NaN3). Each well with sections was washed 3 times for 10 min in PBS and incubated for one hour in blocking solution containing 3% fetal bovine serum and 0.3% Triton X-100 (cat. T8787-50ML, Sigma-Aldrich, St. Louis, MO, USA). Primary antibodies used were Polyclonal Antibody to Glial Fibrillary Acidic Protein (GFAP) (PAA068Ra02, Cloud-Clone Corp.). Sections were incubated with primary antibodies (1:2000 dilution) for 24 h at +4°C, then washed in PBS and incubated with secondary antibodies, Donkey anti-Rabbit IgG (H + L) Highly Cross-Adsorbed Secondary Antibody, Alexa Fluor 594 (A-21207, Thermo Fisher Scientific, Cleveland, OH, USA) (1:1000 dilution) for 4 h at room temperature. After staining, all sections were washed 4 times for 10 min in PBS, mounted on glass slides, and coverslipped using Mowiol mounting medium. Visualization was performed using a Leica DM4000 B LED fluorescent microscope (LEICA Microsystems GmbH, Wetzlar, Germany) with LAS V.4.3 software.
GFAP+ cells were counted at 20× magnification. Three regions of interest were analyzed in the prefrontal cortex (IL, PrL, Cg1) at +2.70, +2.20, and +1.70 mm from bregma, and in the hippocampus (CA1, CA2/3, and DG) at –2.30, –3.30, and –4.80 mm from bregma. In the amygdala, cells were counted without subdivision into specific areas at levels from –2.12 to –2.56 mm from bregma. Cell counts were performed on 3 sections per animal for each region of interest, and three fields of view were analyzed per section using ImageJ analysis software (v.1.54 g, National Institute of Health, Bethesda, MD, USA).
DNA extraction was performed using the “Q INRA” method from the International Human Microbiome Standards Consortium with slight modifications to the protocol. After slow thawing at +4°C, 150–200 mg of each fecal sample was taken. The material was then placed into 2 mL tubes prefilled with a mixture of 0.1 mm glass beads in a 3:1 ratio. Samples supplemented with ASL lysis buffer were homogenized in a Minilys personal homogenizer for 180 s at 3000 rpm. The following steps were consistently performed: protein removal using 10 M ammonium acetate, nucleic acid precipitation with isopropanol, RNase treatment, and DNA extract purification using a silica column from the QIAamp DNA Stool Mini Kit (51504, QIAGEN, Hilden, Germany). DNA integrity was assessed by electrophoresis on 1% agarose gel, and nucleic acid concentration measurements were conducted using a Qubit 2.0 fluorimeter with the Qubit dsDNA HS Assay Kit (Q32854, Thermo Fisher Scientific Inc., USA).
Amplicon library preparation involved a two-step PCR protocol using the qPCRmix-HS SYBR reaction mix on a CFX96 Real-Time PCR system. The first PCR was performed with primers targeting the degenerate hypervariable V4 region of the 16S rRNA gene: F515 (5′-GTGBCAGCMGCCGCGGGTAA-3′) and 806R (5′-GGACTACHVGGGTWTCTAAT-3′), modified to include a “heterogeneity spacer” of 0–5 bp and a barcode linker sequence. The second PCR incorporated barcode and adapter sequences compatible with Illumina sequencing. PCR product quality and size were checked by 1.5% agarose gel electrophoresis. Amplicons were then purified using the QIAquick Gel Extraction Kit (28704, QIAGEN, Germany), and final purification and concentration were performed with AMPureXP magnetic beads.
Paired-end sequencing was performed on the Illumina MiSeq platform using the MiSeq 500-cycle PE Reagent Kit V2 (MS-103-1003, Illumina, San Diego, CA, USA) and a Nano flow cell, according to manufacturer instructions. Raw read quality was assessed using FastQC. Reads were filtered and demultiplexed based on unique barcodes using deML. Taxonomic classification of amplicon sequence variants (ASVs) was performed using the SILVA reference database, allowing assignment to taxonomic levels down to genus. Raw 16S rRNA sequencing data generated in this study are available in the NCBI Sequence Read Archive under BioProject accession number PRJNA1314734.
Statistical analysis of behavioral data was conducted in Python 3.12.11 (Python Software Foundation), using the following packages: pandas 2.2.2, numpy 2.0.2, scikit-learn 1.6.1, statsmodels 0.14.5, factor_analyzer 0.5.1, matplotlib 3.10.0, and seaborn 0.13.2. Prior to dimensionality reduction, all behavioral variables were z-transformed using the StandardScaler from scikit-learn [13] to ensure comparability across features. Principal component analysis (PCA) was performed to visualize variation in the behavioral dataset; loadings were then subjected to varimax rotation using the Rotator class from the factor_analyzer package to facilitate interpretability. Loadings with absolute values above 0.20 were visualized using bar plots. PCA-derived component scores distributions were verified for normality (Shapiro–Wilk) and homogeneity of variance (Levene’s test); as these assumptions were satisfied, ANOVA was applied.
Statistical analysis of cytokine concentrations and astrocyte cell counts was performed using Prism 7 (GraphPad Software, San Diego, CA, USA). Data were first tested for normality using the Shapiro–Wilk test. As most variables were not normally distributed (Shapiro–Wilk test), Mann–Whitney U tests were used to assess between-group differences at each time point. Statistical significance was set at p < 0.05.
Analysis of gut microbiota composition was conducted in R 4.4.1 (14 June 2024) using RStudio 2024.04.2 Build 764. Beta-diversity differences between HT and LT groups were assessed using Permutational Multivariate Analysis of Variance (PERMANOVA) via the adonis2 function from the vegan package, based on Bray–Curtis dissimilarity. Differential abundance of taxa was evaluated using the DESeq2 package.
3.1 Chronic Stress Induces a Delayed Increase in Both Pro- and Anti-Inflammatory Markers in the Amygdala of LT Rats
On day 24 after stress exposure, LT rats showed a significant increase in IL-1β levels in the amygdala compared to controls (Fig. 1). No significant changes in IL-1β levels were observed in any of the analyzed brain regions in HT rats in response to chronic stress.
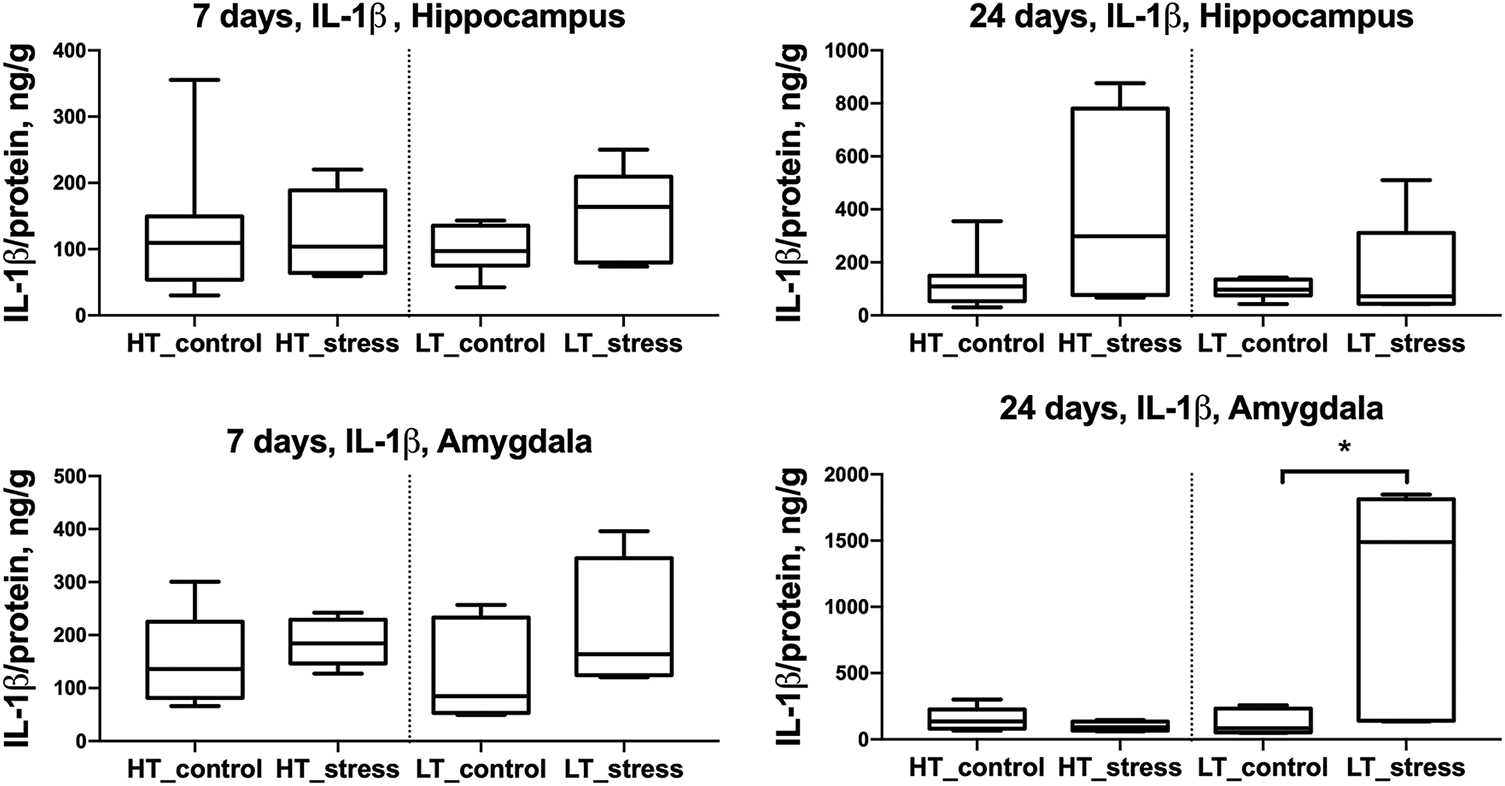
Figure 1: IL-1β levels in the hippocampus and amygdala of HT and LT rats on days 7 and 24 after stress exposure. Boxplots show IL-1β concentrations (ng/g protein) in the hippocampus (top row) and amygdala (bottom row) of HT and LT rats. Data are presented for control and stress groups at two time points: day 7 and day 24 after chronic stress exposure. Each boxplot displays the median, 25th and 75th percentiles, and minimum and maximum values. *p < 0.05, Mann–Whitney U test
IL-6 levels in the hippocampus and amygdala did not differ significantly between control and stress groups in either HT or LT rats on days 7 and 24 following chronic stress exposure (Fig. 2).
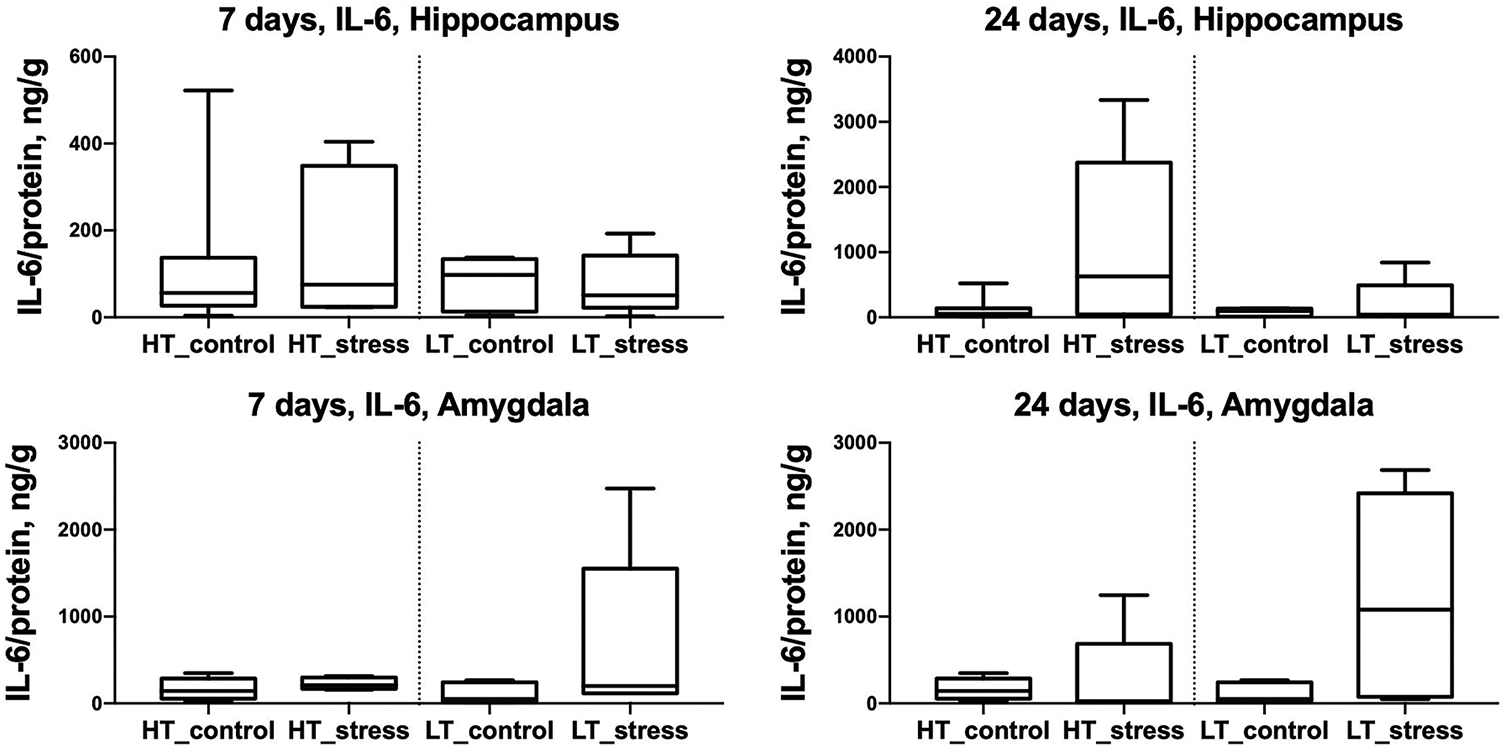
Figure 2: IL-6 levels in the hippocampus and amygdala of HT and LT rats on days 7 and 24 after stress exposure. Boxplots show IL-6 concentrations (ng/g protein) in the hippocampus (top row) and amygdala (bottom row) of HT and LT rats. Data are presented for control and stress groups at two time points: day 7 and day 24 after chronic stress exposure. Each boxplot displays the median, 25th and 75th percentiles, and minimum and maximum values. p > 0.05, Mann–Whitney U test
Fig. 3 shows that the concentration of the pro-inflammatory cytokine TNF increases—similarly to IL-1β—only in the amygdala of LT rats on day 24 after stress exposure.
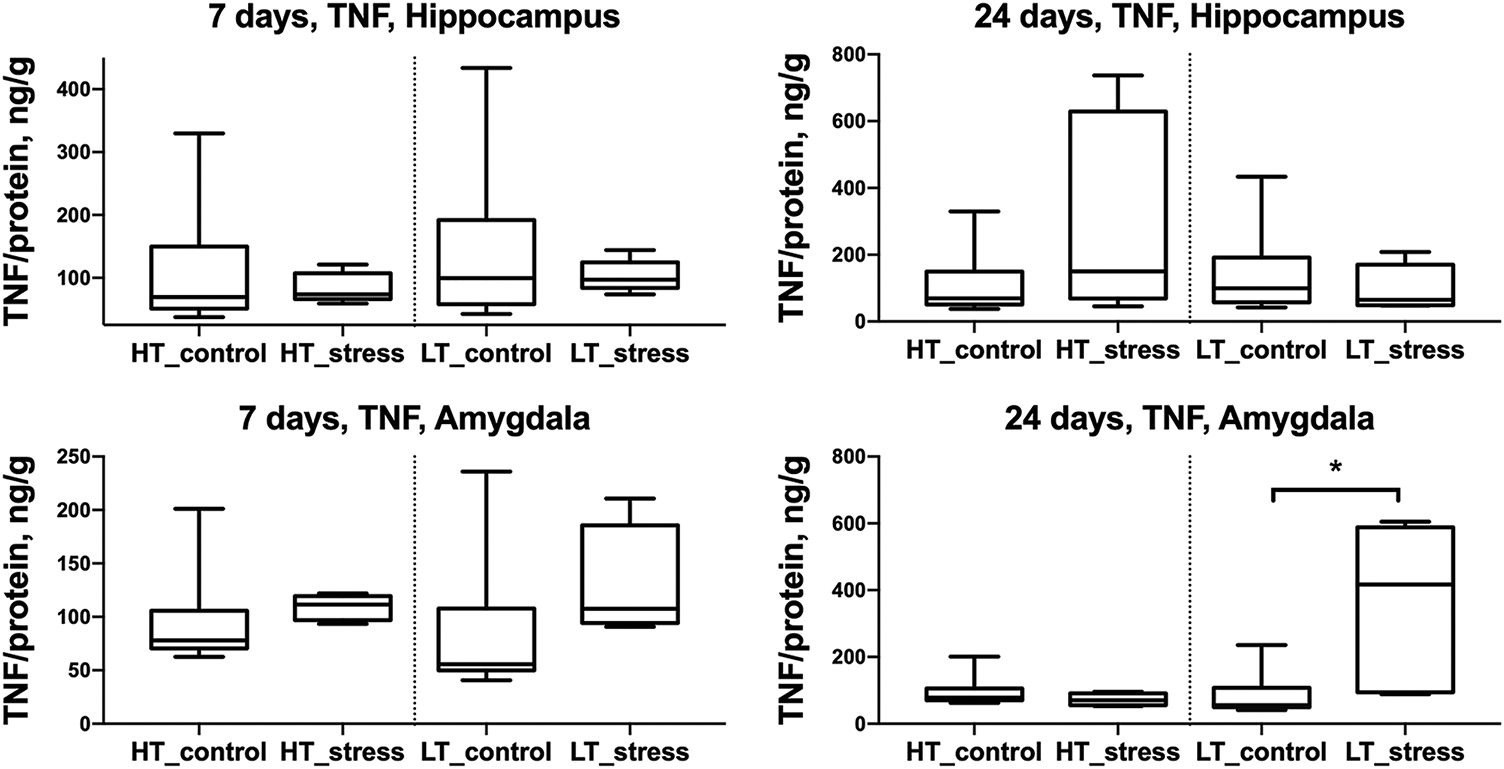
Figure 3: TNF levels in the hippocampus and amygdala of HT and LT rats on days 7 and 24 after stress exposure. Boxplots show TNF concentrations (ng/g protein) in the hippocampus (top row) and amygdala (bottom row) of HT and LT rats. Data are presented for control and stress groups at two time points: day 7 and day 24 after chronic stress exposure. Each boxplot displays the median, 25th and 75th percentiles, and minimum and maximum values. *p < 0.05, Mann–Whitney U test
No differences in Iba1 protein levels were found in any of the analyzed brain regions, regardless of excitability level or time point after stress exposure (Fig. 4).
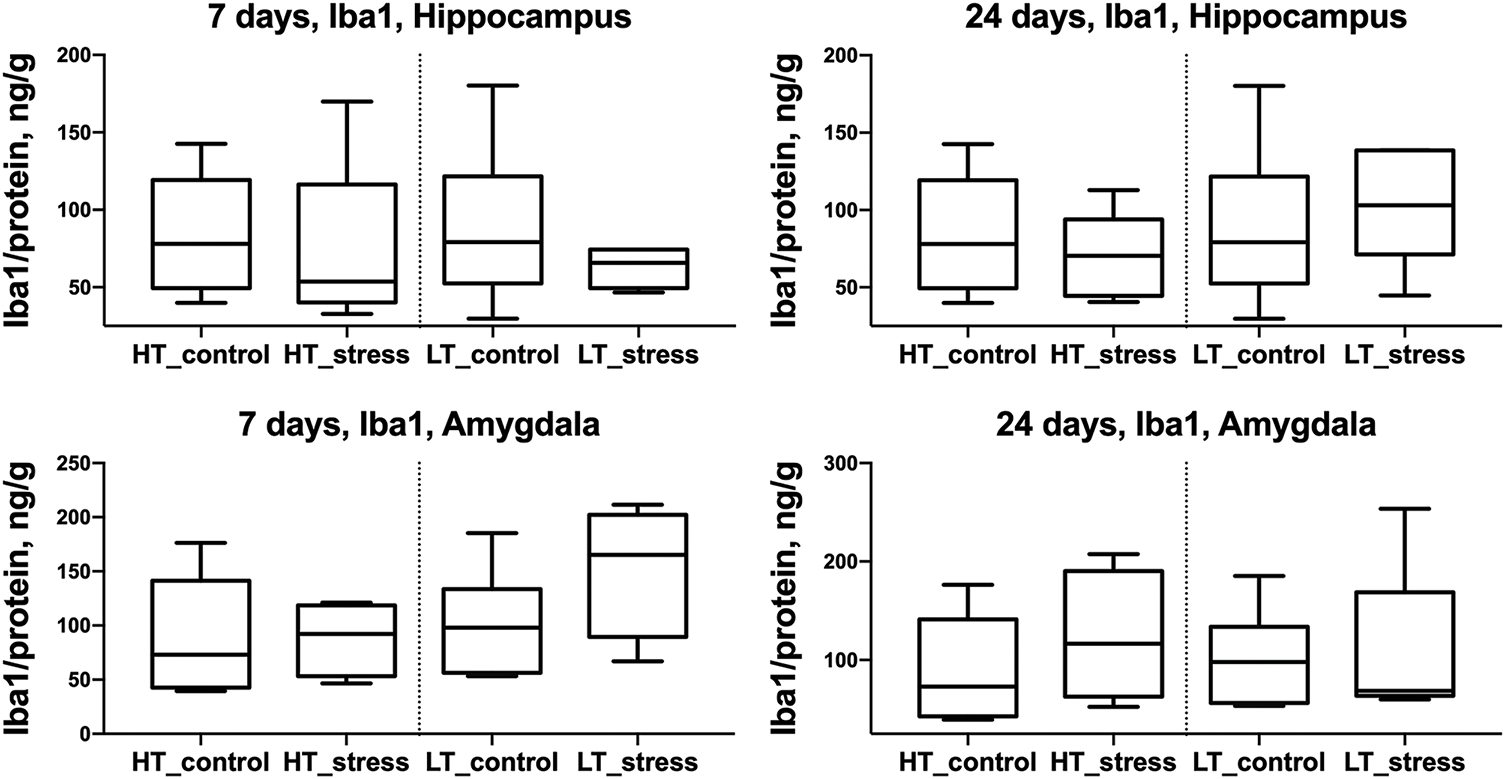
Figure 4: Iba1 levels in the hippocampus and amygdala of HT and LT rats on days 7 and 24 after stress exposure. Boxplots show Iba1 concentrations (ng/g protein) in the hippocampus (top row) and amygdala (bottom row) of HT and LT rats. Data are presented for control and stress groups at two time points: day 7 and day 24 after chronic stress exposure. Each boxplot displays the median, 25th and 75th percentiles, and minimum and maximum values. p > 0.05, Mann–Whitney U test
In the amygdala of LT rats, the level of the anti-inflammatory cytokine IL-10 significantly increased in the stress group compared to controls on both day 7 and day 24 after stress exposure (Fig. 5). In HT rats, no differences were observed between the stress and control groups. Likewise, IL-10 levels in the hippocampus did not differ between groups in either strain at any time point.
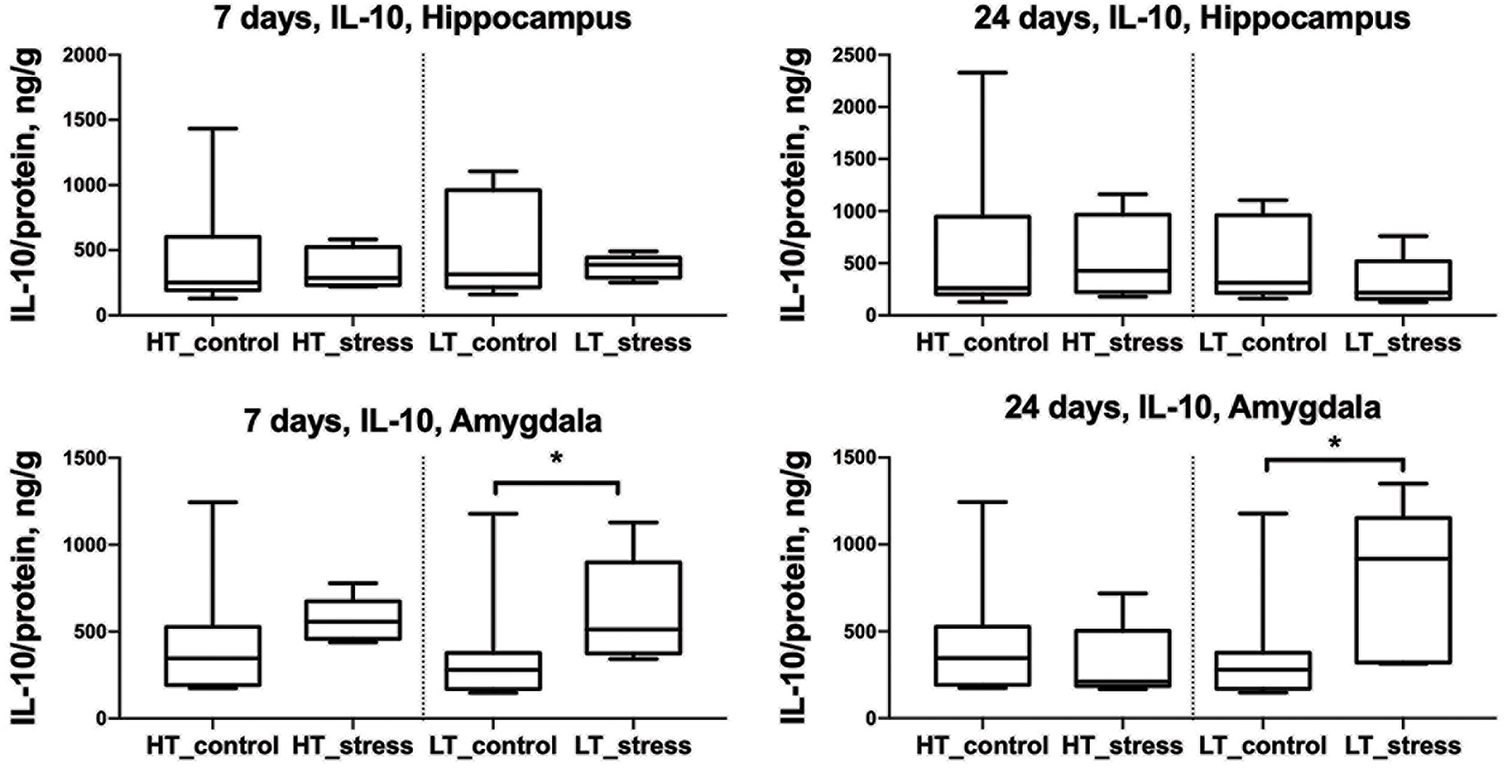
Figure 5: IL-10 levels in the hippocampus and amygdala of HT and LT rats on days 7 and 24 after stress exposure. Boxplots show IL-10 concentrations (ng/g protein) in the hippocampus (top row) and amygdala (bottom row) of HT and LT rats. Data are presented for control and stress groups at two time points: day 7 and day 24 after chronic stress exposure. Each boxplot displays the median, 25th and 75th percentiles, and minimum and maximum values. *p < 0.05, Mann–Whitney U test
3.2 Chronic Stress Leads to Decreases in GFAP+ Cells in PFC, Hippocampus, and Amygdala in LT Rats
On day 7 after chronic stress, LT rats showed a significant reduction in the number of GFAP-positive cells in the prefrontal cortex as a whole (combined across all analyzed subregions; p < 0.05, Mann–Whitney U test), as well as specifically in the prelimbic area (PrL; p < 0.05). In other subregions of the prefrontal cortex—namely, the infralimbic (IL) and cingulate (Cg1) areas—no significant differences were observed between the stress and control groups in LT rats. In HT rats, no significant stress-induced changes in GFAP+ cell counts were detected in any of the analyzed regions (Fig. 6).
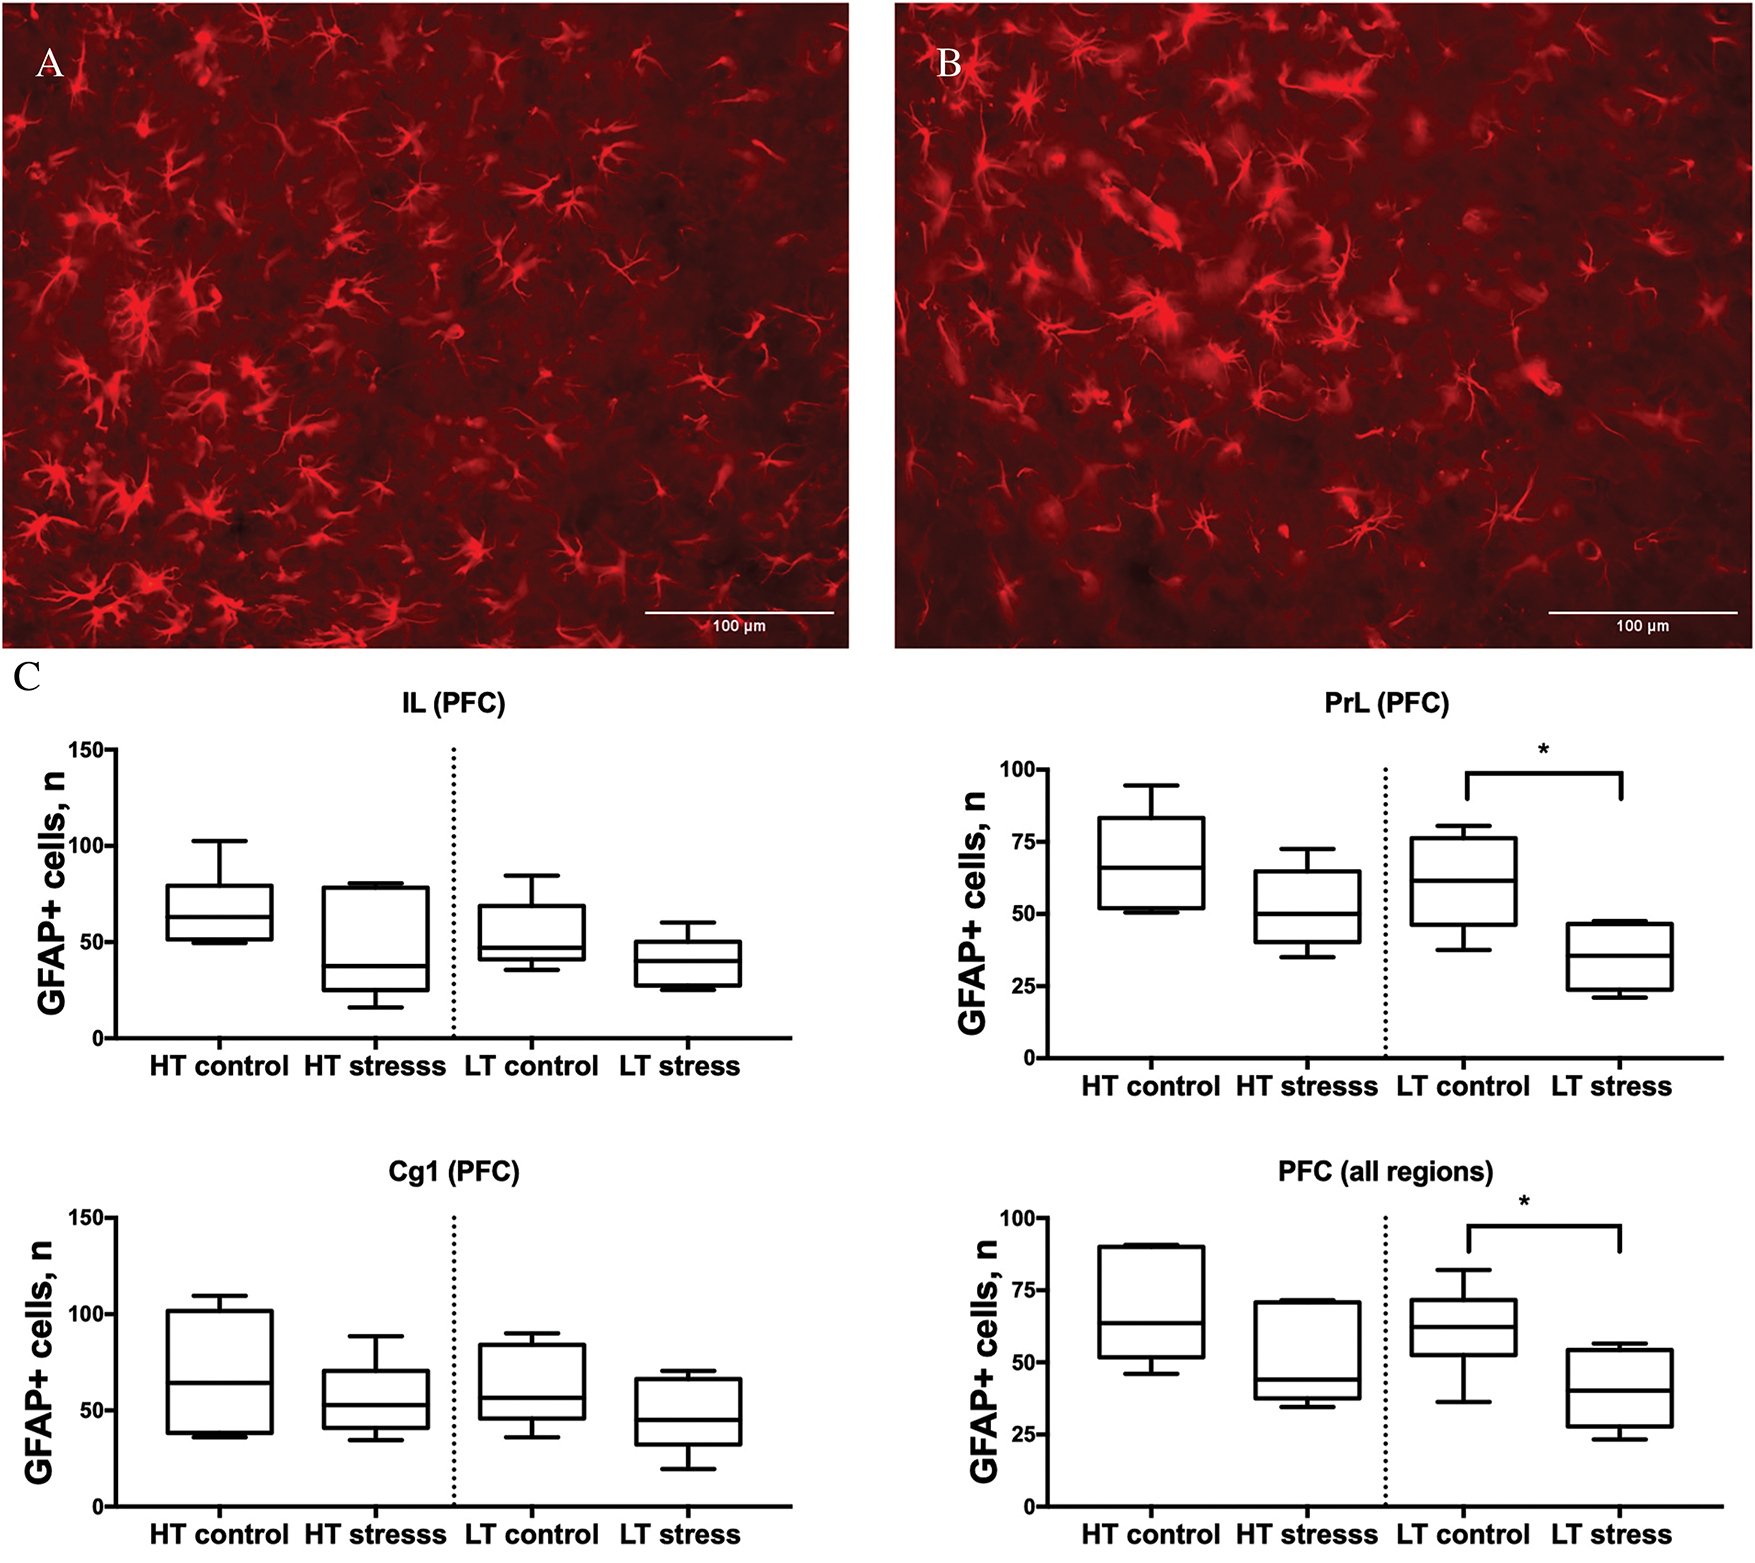
Figure 6: Number of GFAP-positive cells in subregions of the prefrontal cortex in HT and LT rats on day 7 after chronic stress. (A) Microphotograph GFAP+ cells, 20× magnification, PFC, LT control group. (B) LT stress group; (C) Boxplots show the number of GFAP-positive cells in three subregions of the prefrontal cortex—infralimbic (IL), prelimbic (PrL), and cingulate (Cg1)—as well as combined values across all subregions (PFC total) in rats selectively bred for high (LT) and low (HT) nervous system excitability. Data are presented for control and stress groups on day 7 after chronic stress exposure. Each boxplot displays the median, 25th and 75th percentiles, and minimum and maximum values. *p < 0.05—Mann–Whitney U test
On day 7 after chronic stress, LT rats showed a significant reduction in the number of GFAP-positive cells in the CA1 and CA2/3 subregions of the hippocampus, as well as across all hippocampal regions combined. In HT rats, a decrease in GFAP+ cell count was observed in the CA1 subregion and in the total hippocampal region. No significant differences were found in the dentate gyrus (DG) in either strain (Fig. 7).
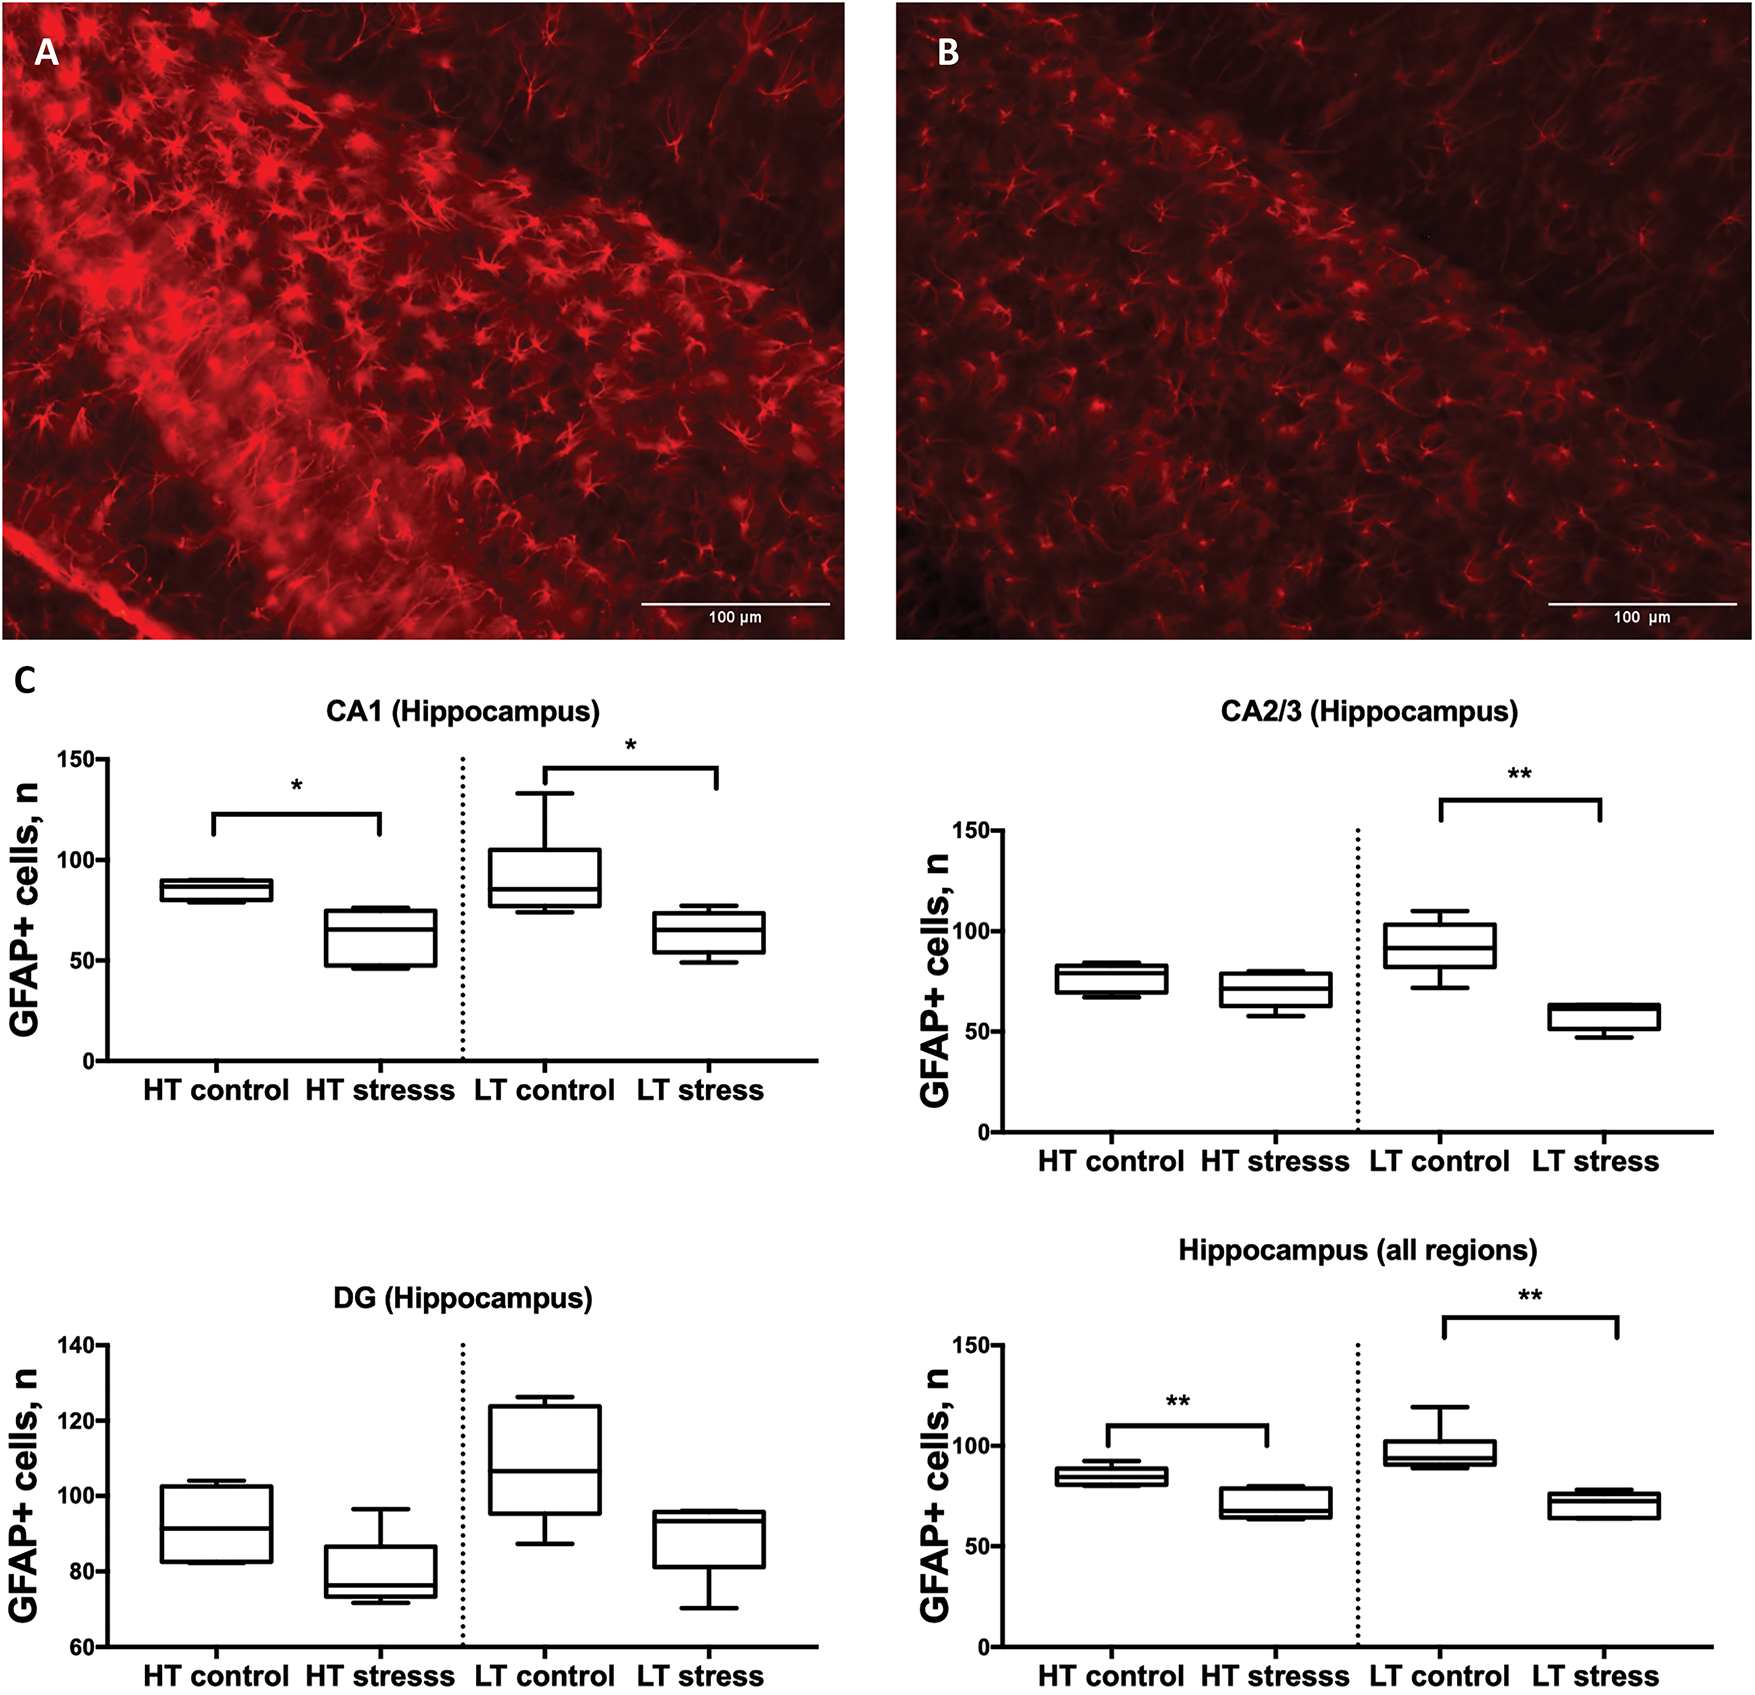
Figure 7: Number of GFAP-positive cells in the hippocampus in HT and LT rats on day 7 after chronic stress. (A) Microphotograph GFAP+ cells, 20× magnification, Hippocampus (DG), LT control and (B) stressed group; (C) Boxplots show the number of GFAP-positive cells in the hippocampal subregions CA1, CA2/3, and dentate gyrus (DG), as well as combined values across all regions (hippocampus total). Data are presented for control and stress groups on day 7 after chronic stress exposure. Each boxplot displays the median, 25th and 75th percentiles, and minimum and maximum values. **p < 0.01, *p < 0.05—Mann–Whitney U test
LT rats also showed a significant reduction in the number of GFAP-positive cells 7 days after stress in the amygdala compared to controls (Fig. 8). No differences were observed between control and stress groups in HT rats. No significant differences in the number of GFAP+ cells were detected 24 days after stress in any of the experimental groups compared to controls, regardless of excitability level or brain region studied.
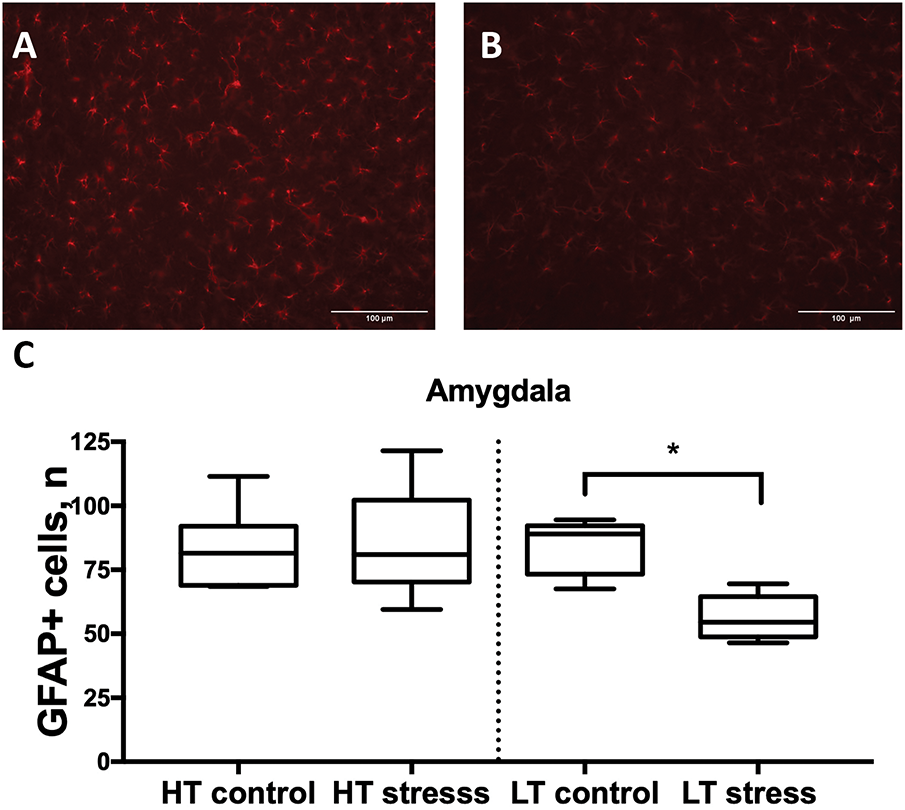
Figure 8: Number of GFAP-positive cells in the amygdala in HT and LT rats on day 7 after chronic stress. (A) Microphotograph GFAP+ cells, 20× magnification, Amygdala, LT control, and (B) stressed roup; (C) Boxplots show the number of GFAP-positive cells. Data are presented for control and stress groups on day 7 after chronic stress exposure. Each boxplot displays the median, 25th and 75th percentiles, and minimum and maximum values. *p < 0.05—Mann–Whitney U test
3.3 Stability of Gut Microbial Composition in Controls
On day 7 (Fig. 9B), but not on day 24 (Fig. 9A), the HT control group showed a slight shift in microbial community structure: PCoA and PERMANOVA analyses revealed a statistically significant but moderate difference in beta diversity compared to baseline. According to DESeq2 analysis, a significant decrease was detected for only one genus—Streptococcus—on day 7 relative to day 0 (Fig. 9C). By day 24, none of the analytical methods identified significant changes in the microbiota of HT animals. The microbiota of intact LT rats remained stable and showed no changes at any of the observed time points.
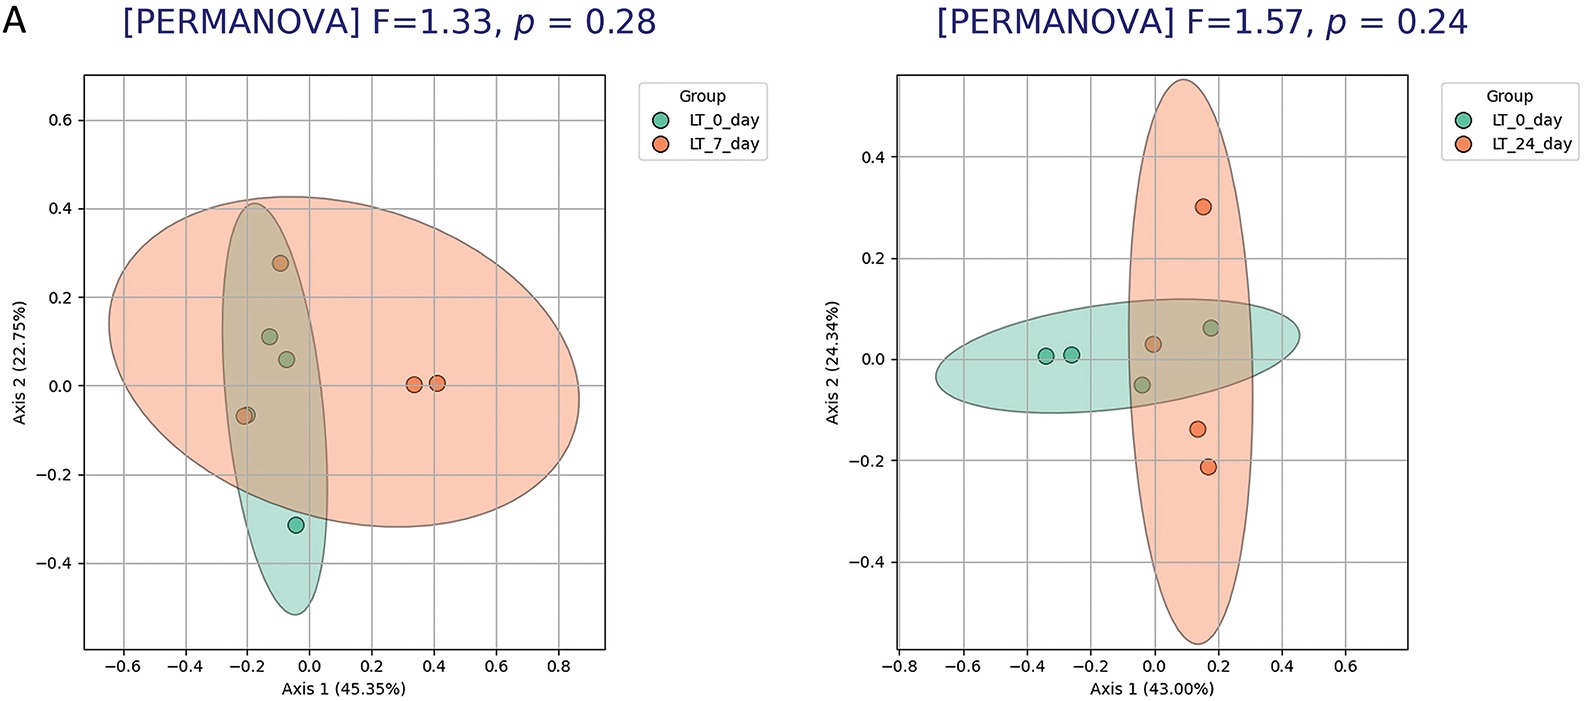
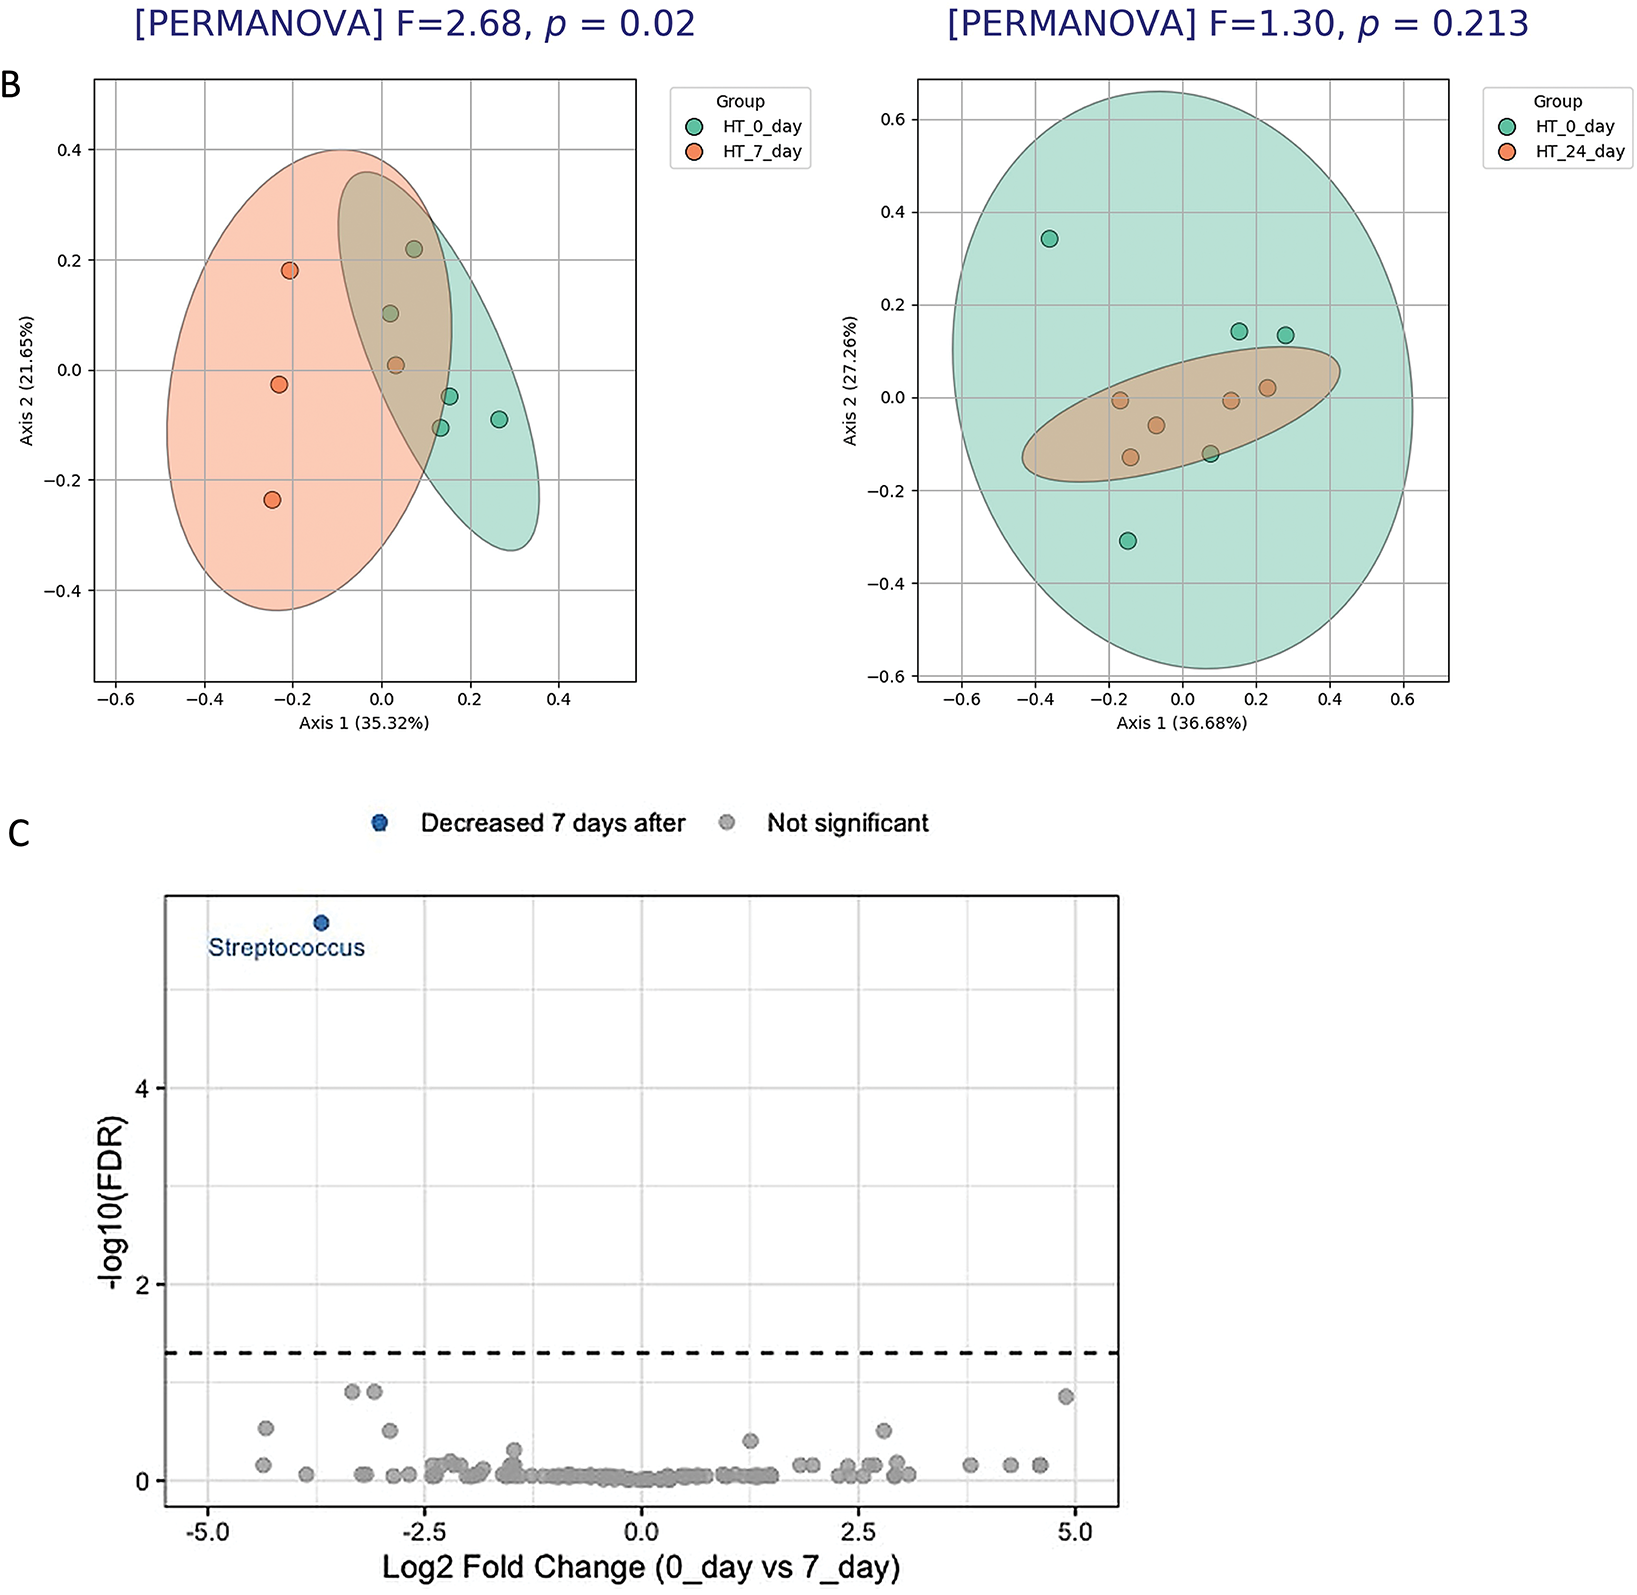
Figure 9: Temporal stability of microbiota composition in control groups of HT and LT rats days 0–7–24. (A) PCoA analysis of beta diversity (Bray–Curtis distances) and PERMANOVA in LT rats shows no significant differences in microbial community structure between day 0 and 7 or 0 and day 24. (B) In HT rats, a small but significant shift in beta diversity is observed between day 0 and day 7, while no difference is detected between day 0 and day 24 (PERMANOVA). (C) Volcano plot showing results of DESeq2 differential abundance analysis for HT rats (day 7 vs. day 0). A significant decrease in the relative abundance of g. Streptococcus is observed; no other taxa differ significantly. Each point represents an individual animal (panels A, B) or a bacterial genus (panel C). Significance threshold: adjusted p-value < 0.05 (FDR correction)
3.4 Dynamics of Microbiome in Stressed Groups
In HT (Fig. 10A), but not in LT (Fig. 10B) rats, the structure of the gut microbiota on day 7 after stress differed significantly from that on day 0 (PERMANOVA, p = 0.004), indicating that the microbial community in this strain is sensitive to stress exposure. Differential abundance analysis (Fig. 10C) revealed significant changes in the microbiota composition of HT rats on day 7 after stress. An increased abundance was observed for taxa belonging to Prevotellaceae, Muribaculaceae, and Roseburia, while Streptococcus, Adlercreutzia, Faecalibaculum, and several other taxa showed a decrease. These findings confirm a stress-induced shift in the microbial profile of HT rats.
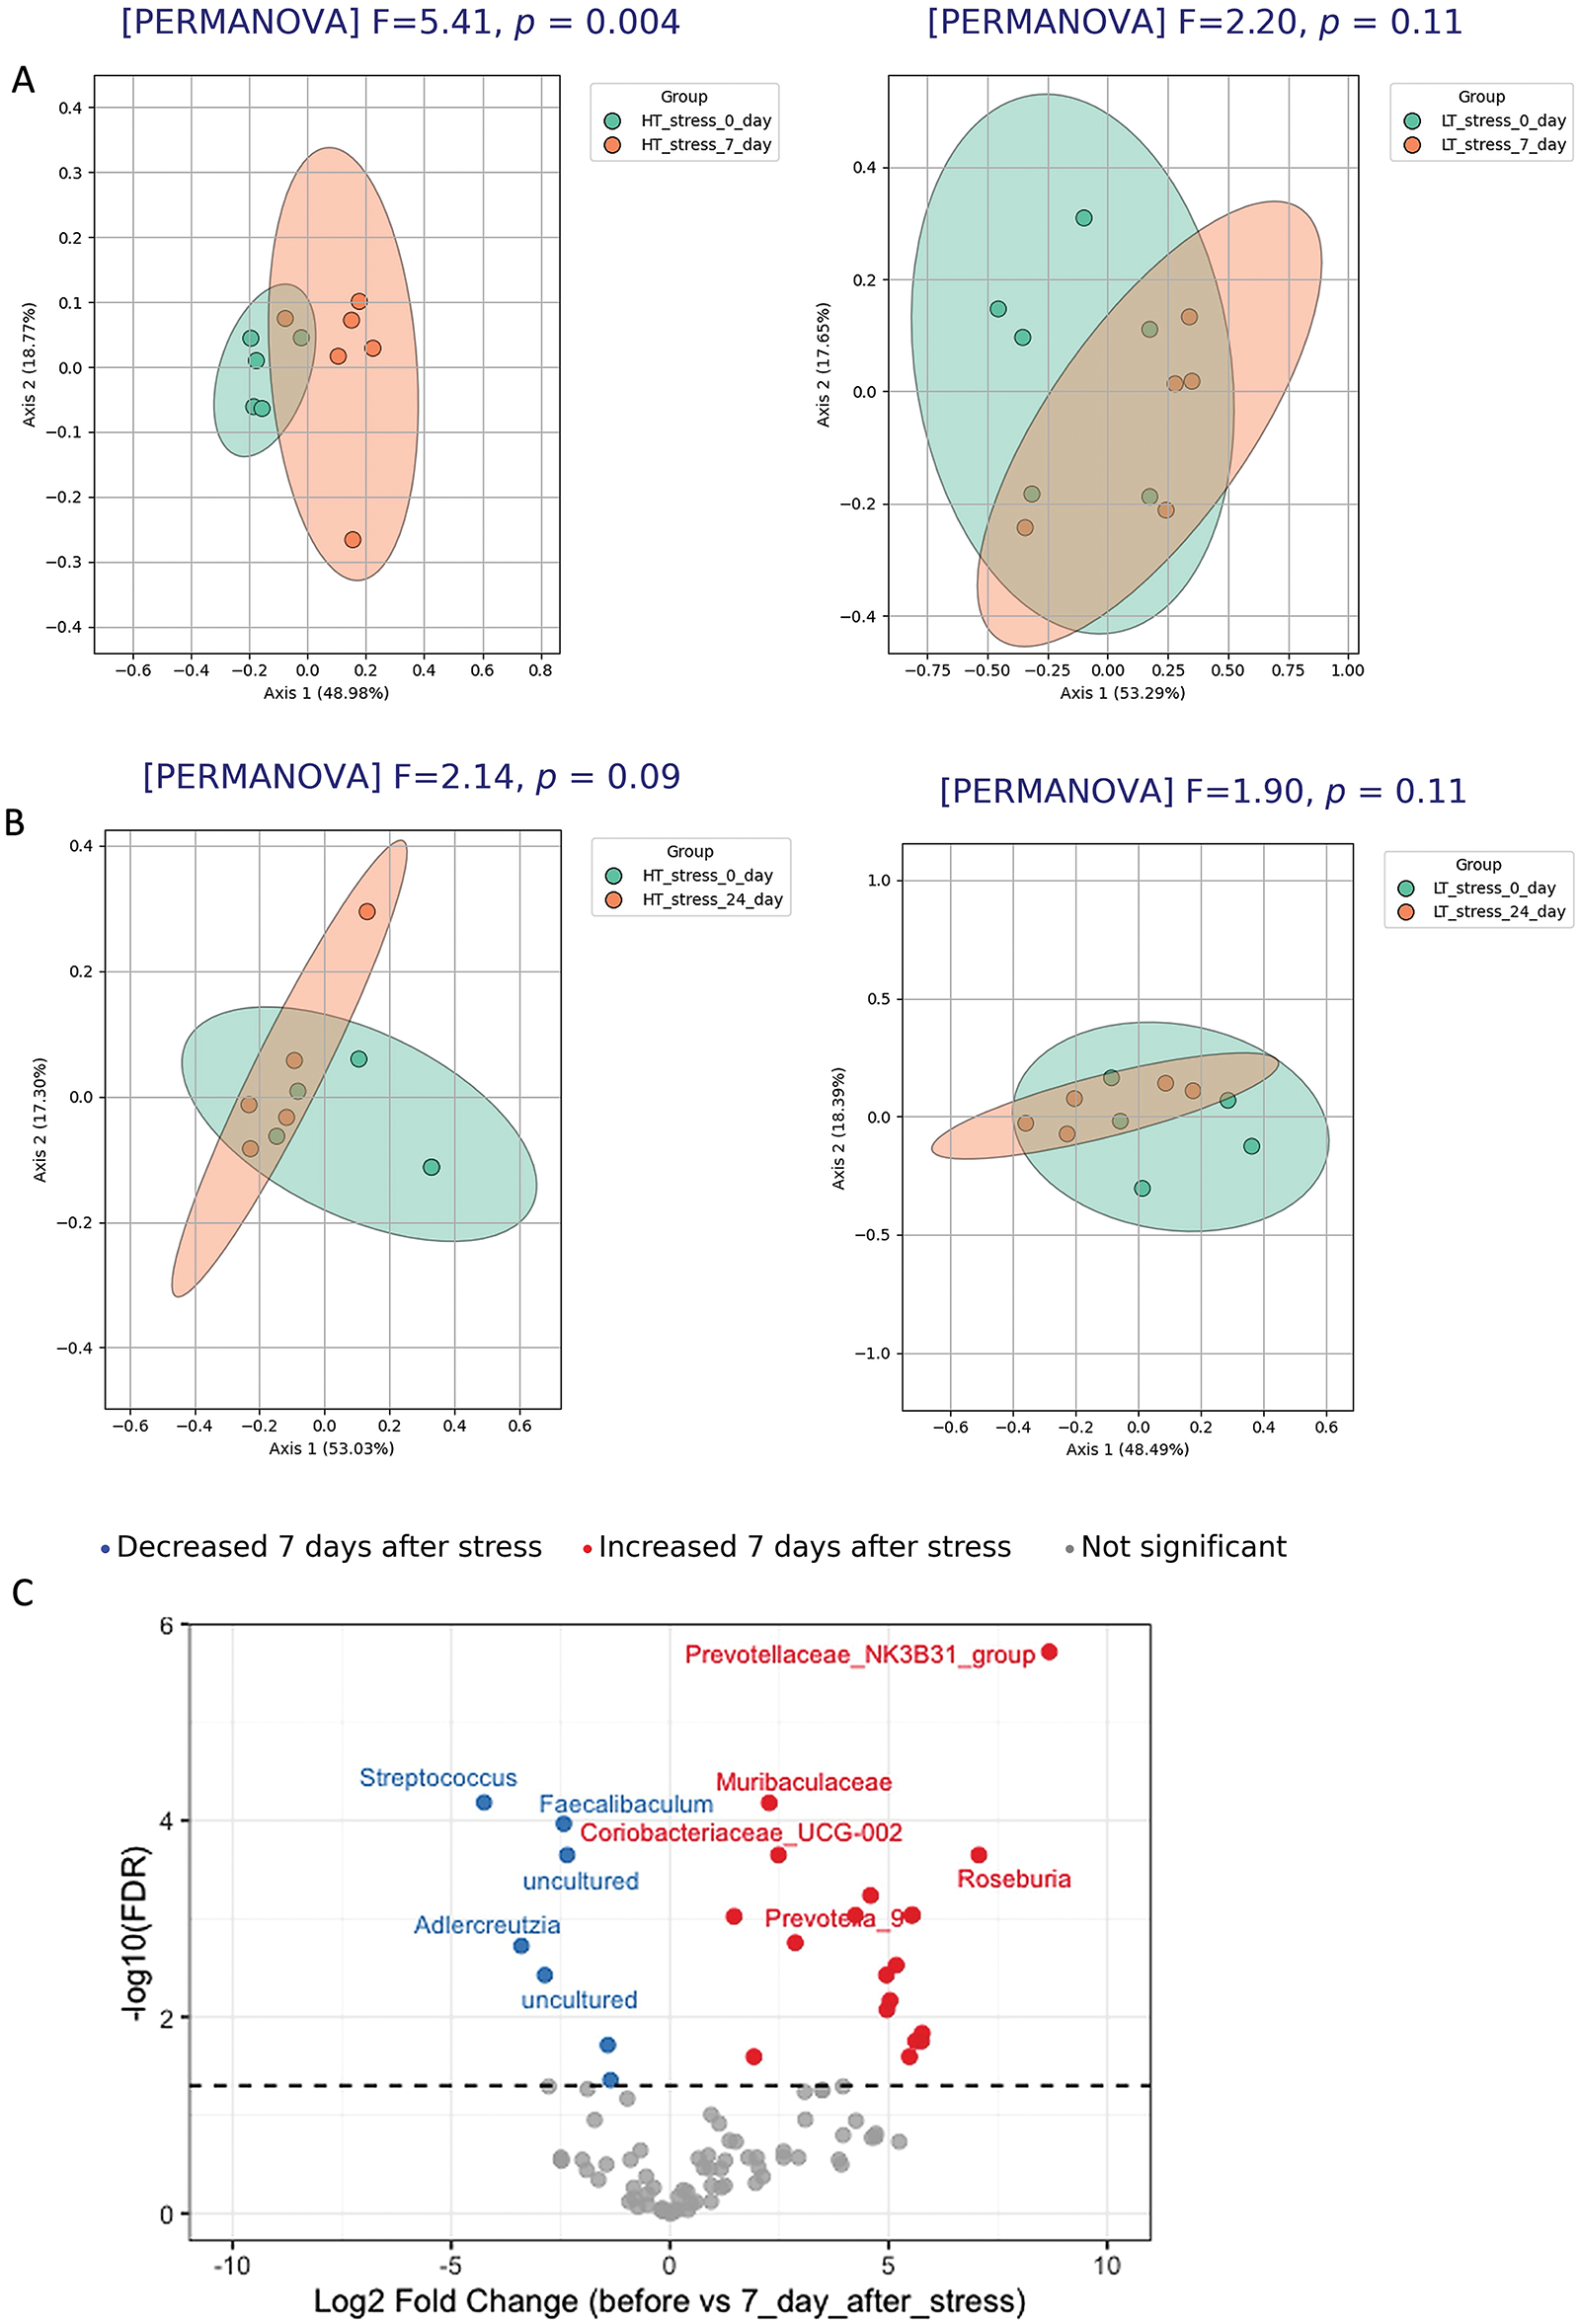
Figure 10: Temporal dynamics of gut microbiota composition in stressed groups of HT and LT rats. PCoA analysis (Bray–Curtis distances) and PERMANOVA results of microbiota structure in HT and LT rats between day 0 and day 7 (A) and day 0 and day 24 (B) following stress exposure. (C) Volcano plot based on DESeq2 analysis shows significantly altered taxa in HT rats on day 7 compared to day 0. Each point represents an individual animal (panels A, B) or a bacterial genus (panel C), оnly the top 5 significantly altered taxa (based on adjusted p-values) are labeled on the volcano plot. Significance threshold: adjusted p-values < 0.05 (FDR correction)
3.5 Comparison of Microbiota between Stressed and Control Groups
In HT rats exposed to stress, gut microbiota composition on both day 7 and day 24 differed significantly from that of the corresponding control groups (Fig. 11A,B). Beta diversity analysis revealed clear separation between control and stress groups on day 7 (PERMANOVA, p = 0.008) and day 24 (PERMANOVA, p = 0.017), indicating a sustained stress-induced shift in the microbial community in low-excitability animals.
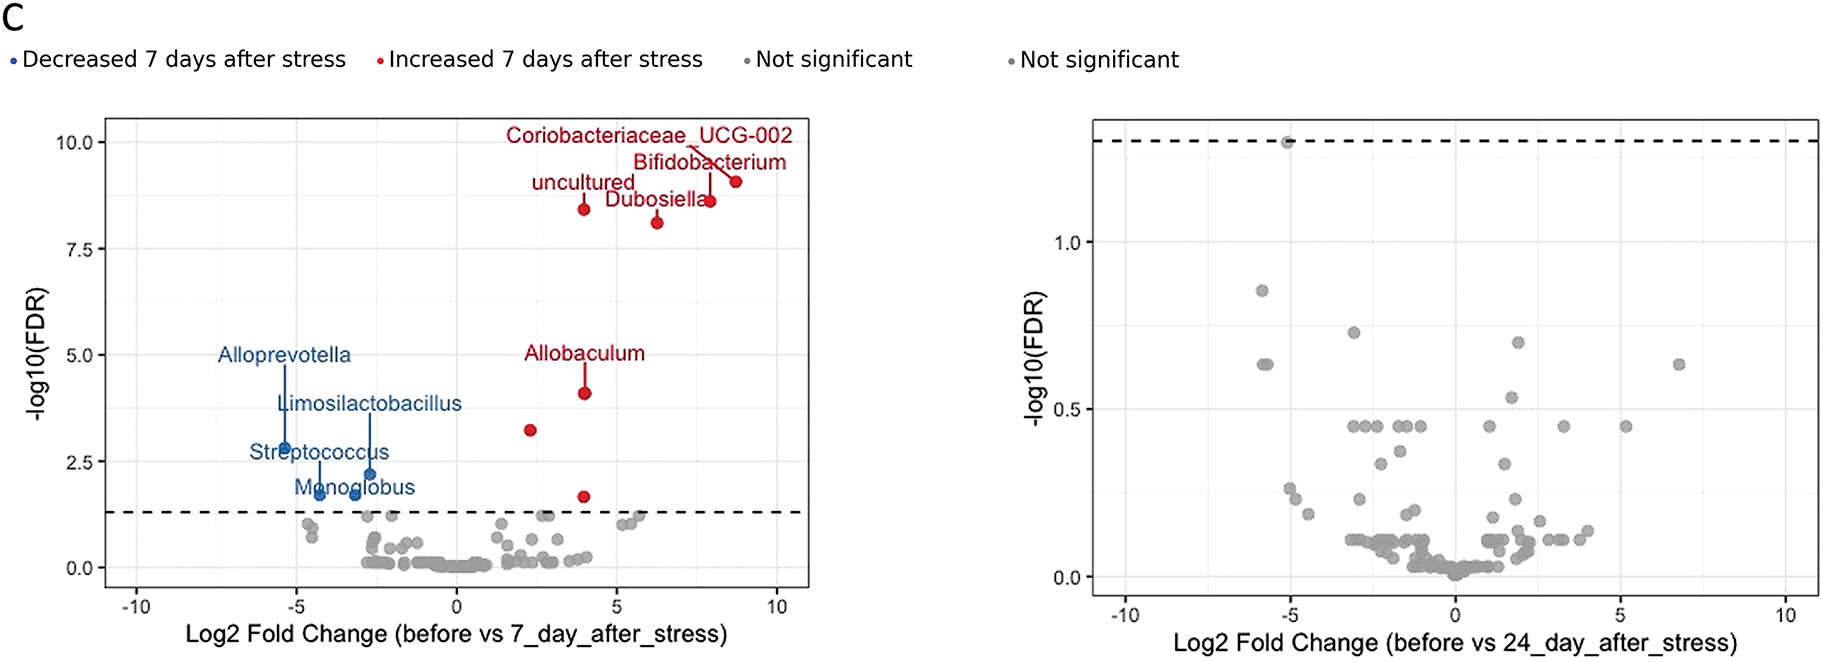
Figure 11: Gut microbiota composition in stressed and control groups of HT and LT rats. PCoA analysis (Bray–Curtis distances) and PERMANOVA results of microbiota structure in HT and LT rats between day 0 and day 7 (A) and day 0 and day 24 (B) following stress exposure. (C) Volcano plot based on DESeq2 analysis shows significantly altered taxa in HT rats on day 7 compared to day 0. Each point represents an individual animal (panels A, B) or a bacterial genus (panel C), оnly the top 5 significantly altered taxa (based on adjusted p-values) are labeled on the volcano plot. Significance threshold: adjusted p-values < 0.05 (FDR correction)
DESeq2 analysis (Fig. 11C) revealed multiple changes in the microbiota composition of LT rats on day 7 after stress compared to the control group. A significant increase was observed in the abundance of taxa such as Bifidobacterium, Dubosiella, Coriobacteriaceae_UCG-002, and others. At the same time, the relative abundance of Streptococcus, Limosilactobacillus, Alloprevotella, and several other taxa was significantly reduced. On day 24, DESeq2 analysis did not detect any significant differences in microbial composition compared to controls.
3.6 Consistently Altered Microbial Taxa in Stressed HT Rats
At the Fig. 12 to identify key taxa involved in stress-induced microbiota changes, we selected those that showed consistent shifts both in the within-line comparison (HT stressed 0 day vs. HT stress 7 day after stress) and in the between-group comparison (HT stress vs. HT control on day 7). These included Oscillospiraceae_NK4A214_group and Anaerovibrio (increased abundance), as well as Limosilactobacillus (decreased abundance). Such taxa may represent reliable microbial markers of stress exposure in low-excitability animals.
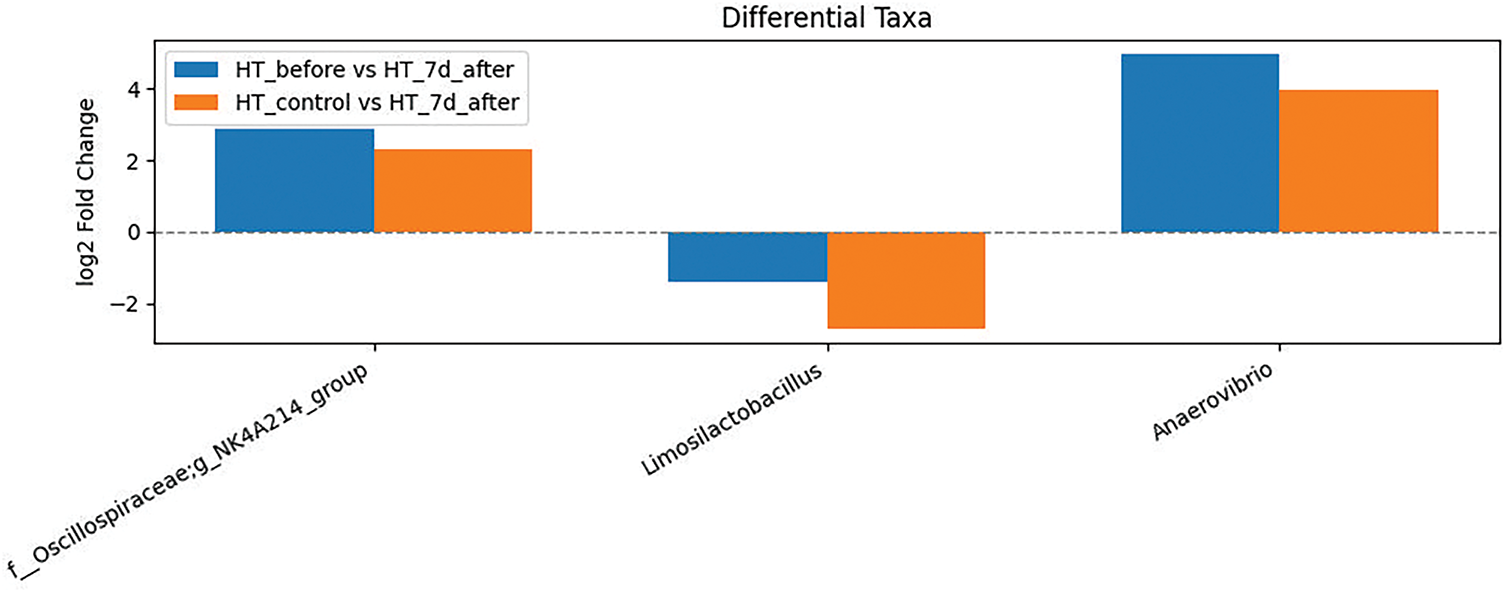
Figure 12: Taxa differentially abundant in HT rats in both within-group and between-group comparisons. Barplot shows the log2 fold change in the relative abundance of selected bacterial taxa that were significantly altered in both comparisons: within the HT stress group over time (HT_0 vs. HT_7d_after) and between the stressed and control HT groups on day 7 (HT_control vs. HT_7d_after). Only taxa showing consistent directional changes across both contrasts are included. Positive values indicate increased abundance after stress; negative values indicate decreased abundance. Significance was determined using DESeq2 (adjusted p-value < 0.05, FDR correction)
To assess multidimensional behavioral differences between experimental groups, principal component analysis (Fig. 13A) was performed based on parameters from the elevated plus maze test. On the two-dimensional projection (PC1 and PC2), the control groups of the two strains (HT and LT) are clearly separated, while the stress and control groups within each strain show overlap. This suggests that behavioral differences are primarily driven by genetic background, with no distinct effect of chronic stress detectable at the level of principal components 7 days after stress exposure.
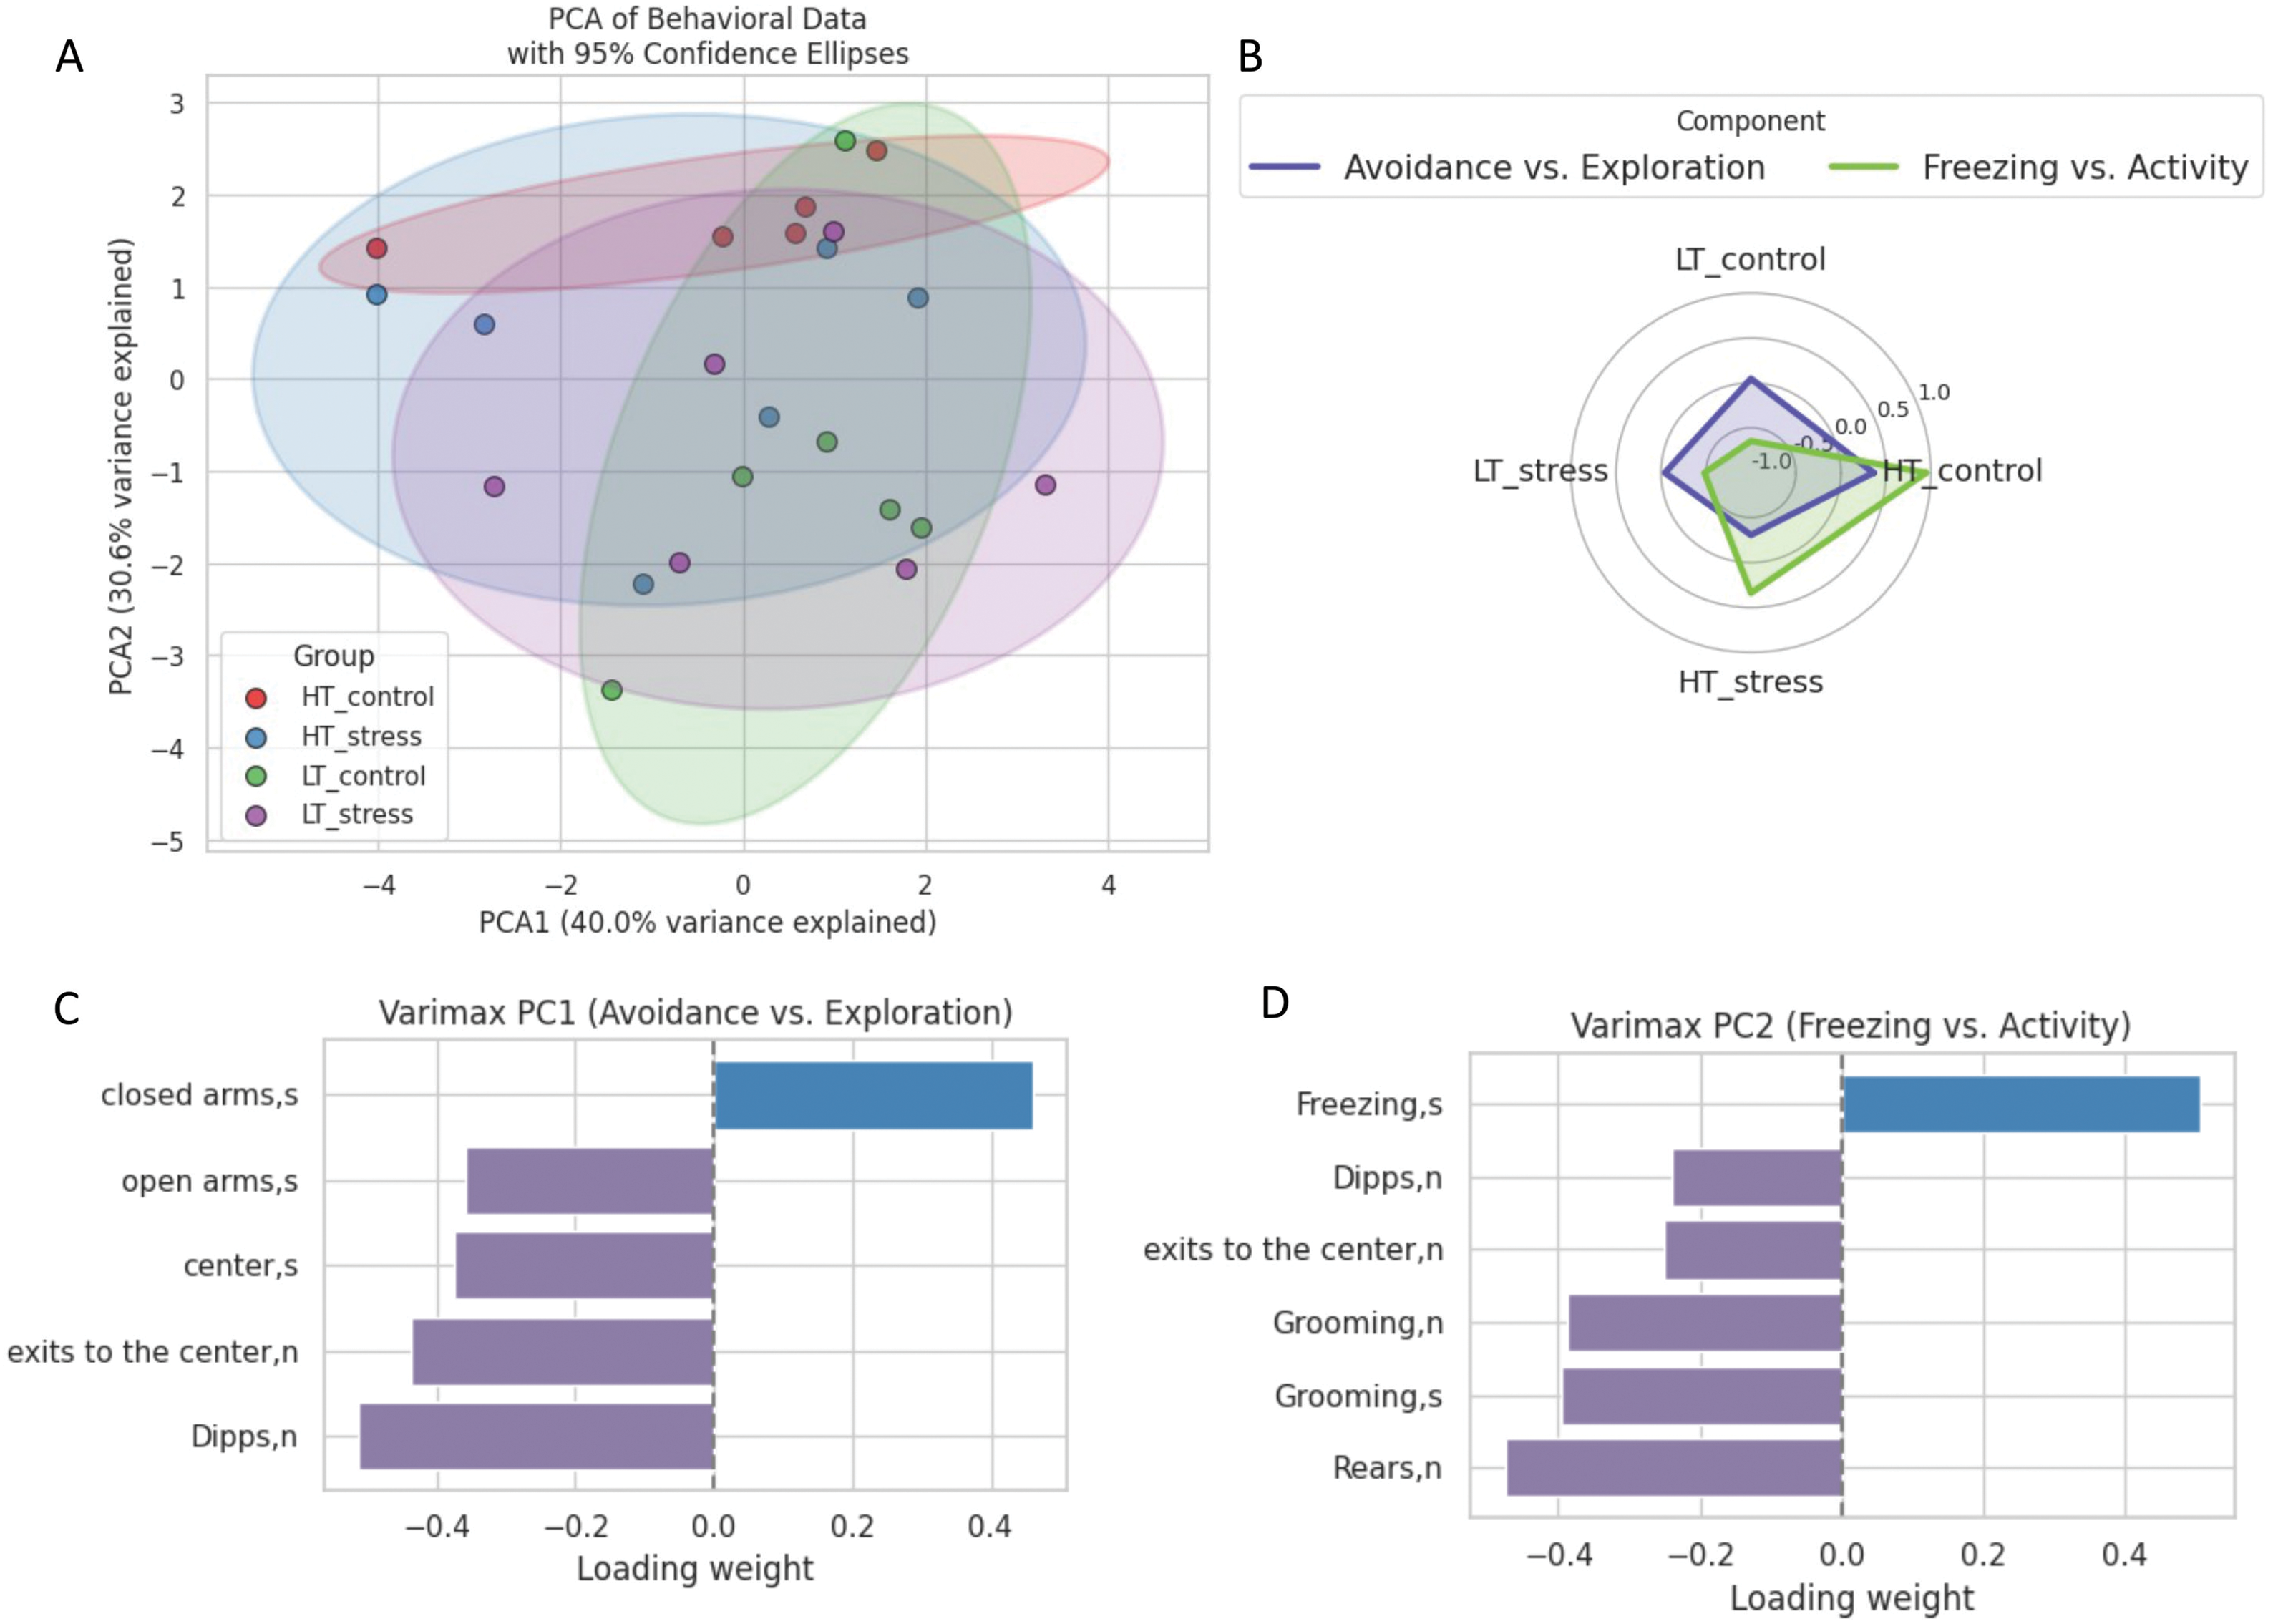
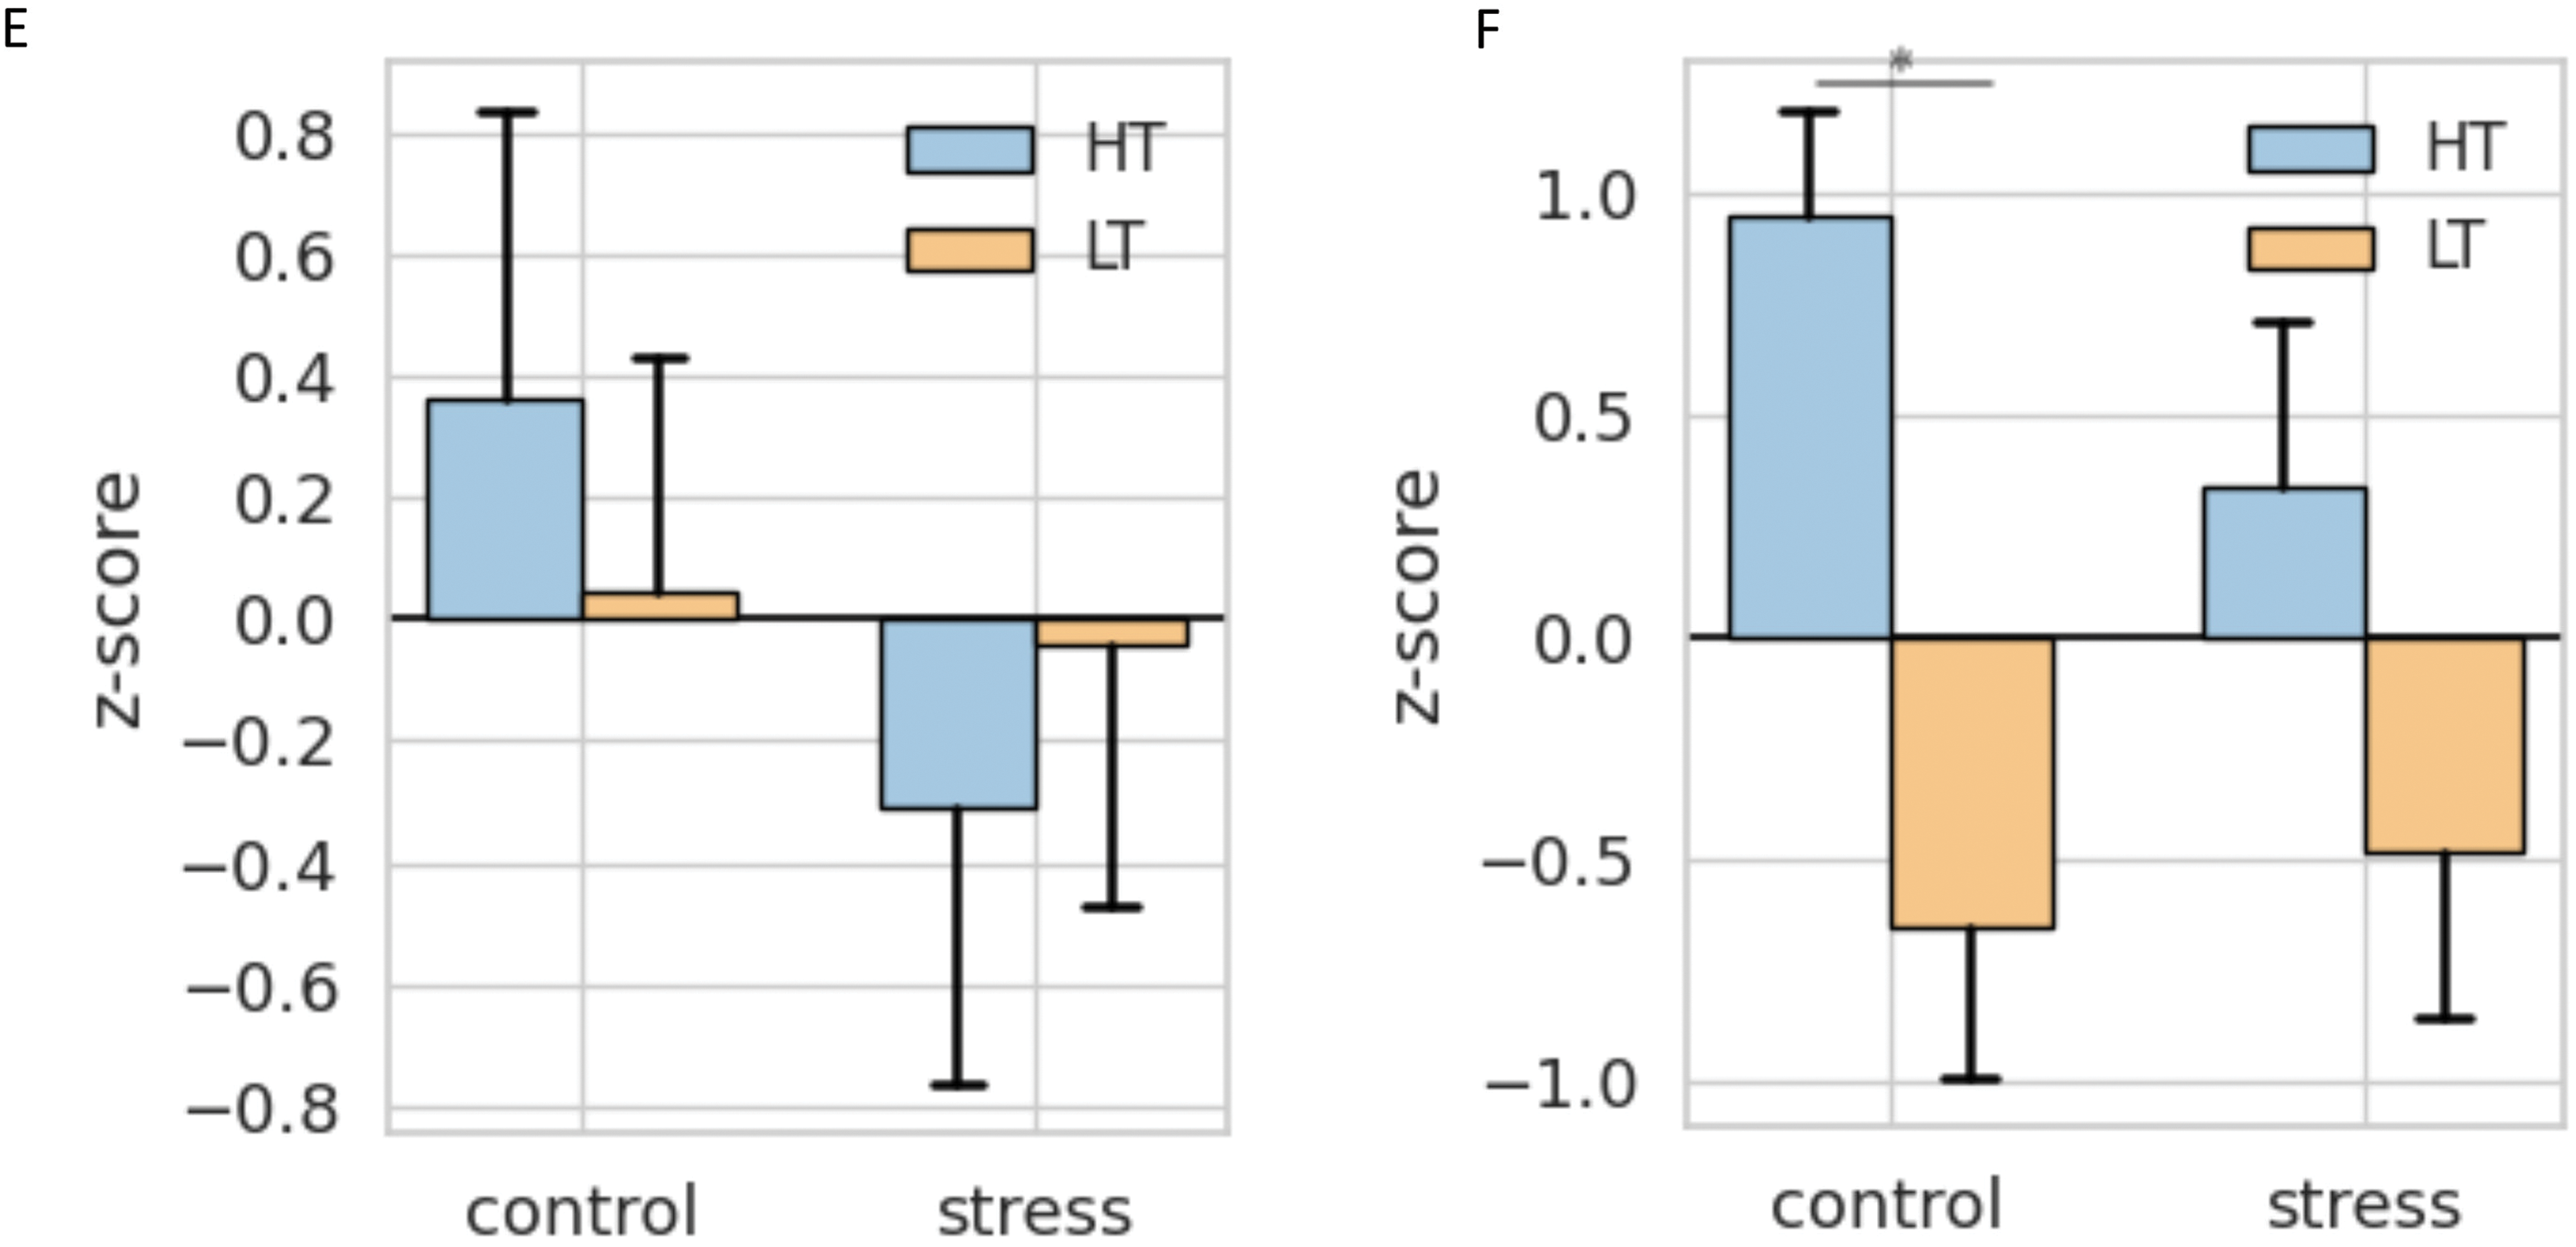
Figure 13: Multivariate analysis of behavioral data in HT and LT rat strains 7 days after stress. (A) Distribution of rats in PC space; (B) Spider web plot of the z-scores for the experimental groups and principal components. The colored lines represent group means for each experimental group (LT_control, LT_stress, HT_control, HT_stress) along the selected principal components. The shaded areas correspond to the two main behavioral dimensions derived from PC1,2; (С) Variable loadings on PC1 (Avoidance vs. Exploration); (D) Variable loadings on PC2 (Freezing vs. Activity); (E) Group z-scores for PC1, (F) Group z-scores for PC2 (*p < 0.05, ANOVA, post-hoc Tukey)
HT rats under control conditions are characterized by high levels of both avoidance behavior and passive coping. In contrast, LT control rats display a more exploratory profile with low freezing (Fig. 13B). Following stress exposure, both strains show a reduction in exploration-related scores; however, the “Freezing vs. Activity” component remains elevated only in HT rats, indicating persistence of passive coping strategies.
PC1 (Fig. 13C) reflects an “Avoidance vs. Exploration” axis, with positive loadings for anxiety-like behaviors (time in closed arms) and negative loadings for exploratory activity (center entries, head dips, open-arm time). Higher scores indicate avoidance, lower scores indicate exploration. PC2 (Fig. 13D) represents a “Freezing vs. Activity” axis, with freezing loading positively and active coping behaviors (rearing, grooming, locomotion) loading negatively. High PC2 scores correspond to passive coping, while low scores reflect active exploration.
HT rats showed significantly higher scores on the “Freezing vs. Activity” component (Fig. 13F) but did not differ from LT rats on the “Avoidance vs. Exploration” axis (Fig. 13E). Stress had no significant effect within strains, indicating a predominance of passive coping in HT rats even without stress exposure.
Fig. 14A shows the result of PCA performed on behavioral data from rats on day 24 after stress exposure. The main part of the between-group variance is explained by the first principal component (PC1, 52.2% of the variance), while the second component (PC2) accounts for an additional 20.1%. Along PC1, there is a clear separation between the control groups of the two strains. This indicates that the genetic background remains the main factor shaping the behavioral profile. At the same time, 24 days after stress exposure, the behavioral profile in both strains had changed. In HT, stress leads to a shift to the right along PC1, making the HT_stress profile more similar to that of LT_control. In LT rats, stress induces a shift to the left—toward the opposite direction from their intact profile—bringing LT_stress closer to HT_control.
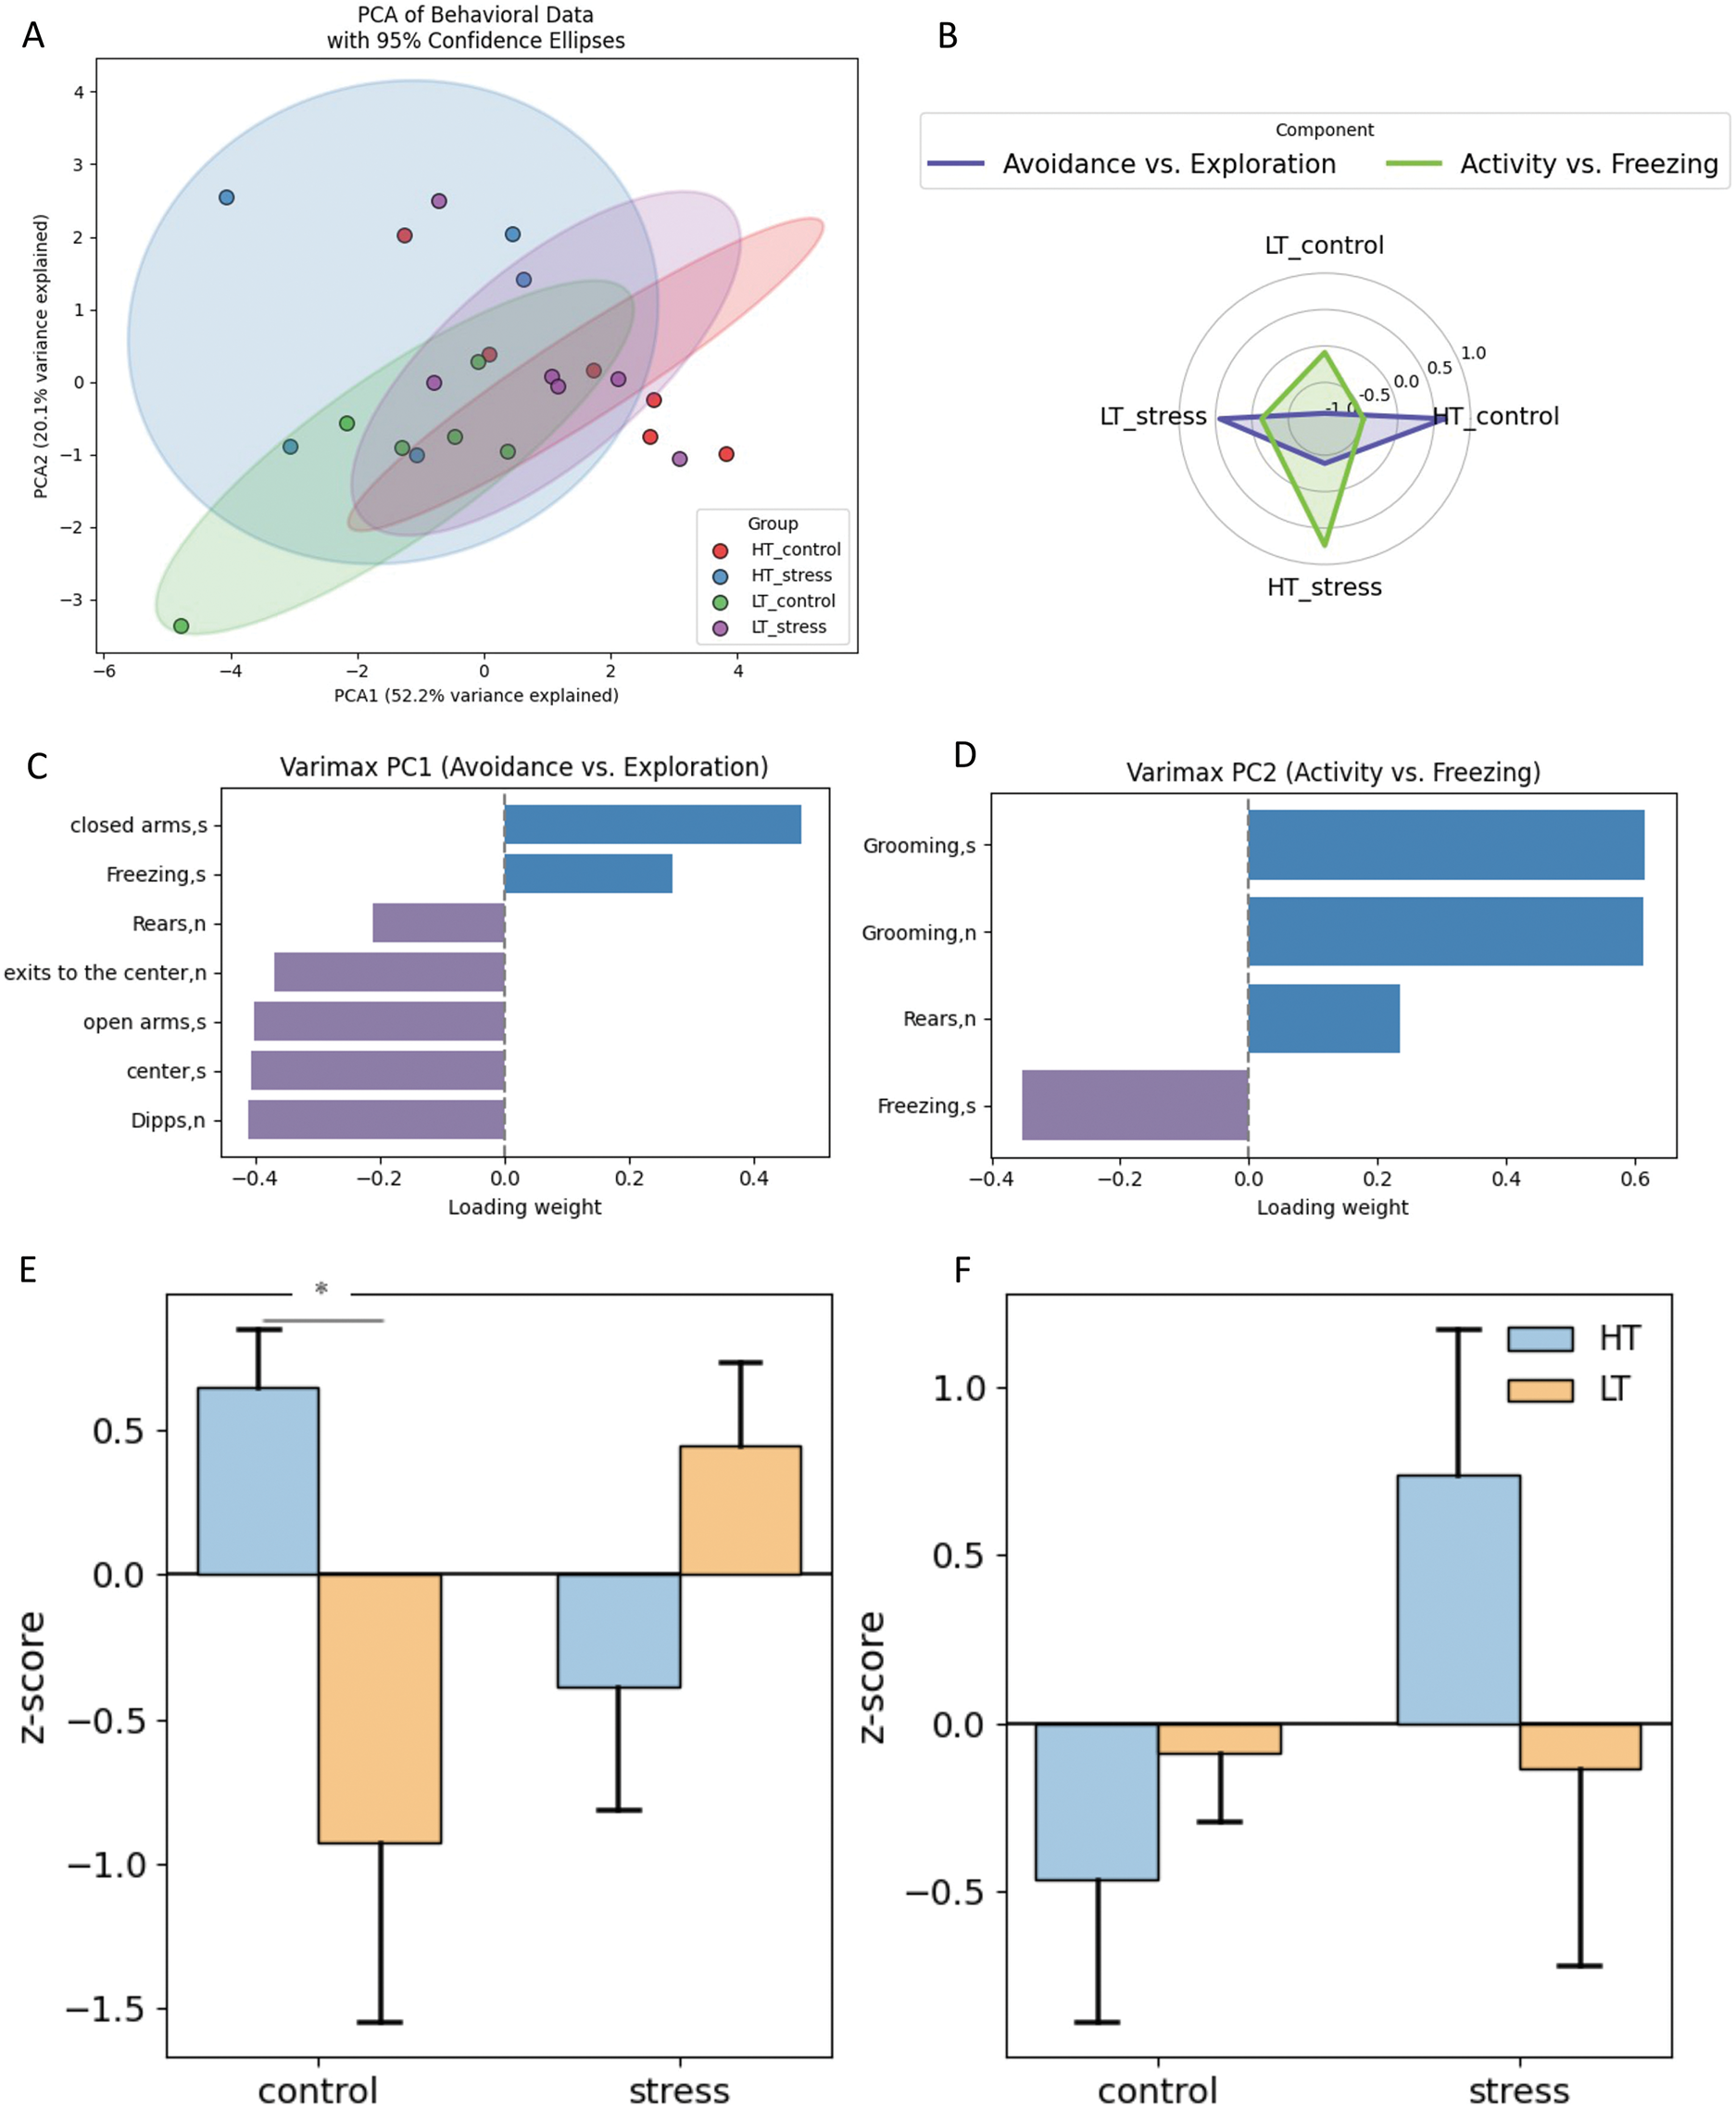
Figure 14: Multivariate analysis of behavioral data in HT and LT rat strains 24 days after stress. (A) Distribution of rats in PC space; (B) Spider web plot of the z-scores for the experimental groups and principal components. The colored lines represent group means for each experimental group (LT_control, LT_stress, HT_control, HT_stress) along the selected principal components. The shaded areas correspond to the two main behavioral dimensions derived from PC1,2; (С) Variable loadings on PC1 (Avoidance vs. Exploration); (D) Variable loadings on PC2 (Activity vs. Freezing); (E) Group z-scores for PC1, (F) Group z-scores for PC2 (*p < 0.05, ANOVA, post-hoc Tukey)
The first component (Fig. 14C) reflects a behavioral gradient from avoidance to exploration. Positive values are associated with increased avoidance (time spent in closed arms, freezing), while negative values correspond to active exploration (time and movement in open areas, number of rears and head dips). The second component (Fig. 14D) reflects a behavioral continuum from locomotor activity to freezing. Positive values correspond to activity (e.g., grooming, rearing), while negative values indicate predominant freezing behavior. Fig. 14F shows that HT rats tend to display increased activity after stress compared to their control group, whereas LT rats maintain near-zero scores under both conditions. However, these group differences did not reach statistical significance.
Fig. 14E shows that HT rats exhibit more pronounced avoidance behavior compared to LT rats (Tukey HSD, p = 0.049). After stress exposure, the behavioral profiles of both strains shift in opposite directions: avoidance decreases in HT and increases in LT. ANOVA revealed a significant interaction between strain and condition (p = 0.0079), indicating distinct patterns of stress response in the two strains despite the absence of significant pairwise effects.
The behavioral profiles of the groups shift (Fig. 14B): HT_stress rats exhibit increased activity and reduced avoidance, resembling the profile of LT_control animals. In contrast, LT_stress rats display a profile similar to that of HT_control rats, characterized by pronounced avoidance and reduced activity. This suggests opposite trajectories of stress response in the two strains: in HT rats, a shift toward a more active behavioral style; in LT rats, an increase in anxiety-like features and a decline in exploratory behavior.
In response to chronic stress, rats from the LT strain (high-excitability) exhibit a delayed increase in the expression of pro-inflammatory cytokines in the amygdala: by day 24, levels of TNF and IL-1β are significantly elevated, while no changes are observed on day 7. This delayed neuroinflammatory response may reflect a gradual accumulation of molecular alterations leading to activation of the inflammatory cascade. These results are consistent with our previous transcriptomic analysis of the amygdala [14], which revealed increased expression of genes related to immune responses in intact LT rats in comparison with HT rats, along with enrichment of pathways associated with complement activation, interferon signaling, and cytokine interactions. This suggests an elevated baseline expression of neuroinflammation-related genes in the LT amygdala, potentially predisposing these animals to a delayed inflammatory activation following chronic stress.
On the molecular level, IL-1β is activated via the nuclear factor kappa-light-chain-enhancer of activated B cells (NF-κB) pathway and, under physiological conditions, supports long-term potentiation and memory consolidation [15]. However, under chronic stress, IL-1β levels rise and exert neurotoxic effects, disrupting synaptic transmission, exacerbating monoaminergic and glutamatergic dysregulation, and reducing hippocampal neurogenesis, see review by [16]. In the chronic unpredictable mild stress (CUMS) paradigm, IL-1β is elevated after 3–4 weeks of stress exposure, and its blockade—e.g., in IL-1 receptor knockout mice—prevents stress-induced behavioral impairments [17].
Chronically elevated IL-1β also affects regulation of the hypothalamic-pituitary-adrenal (HPA) axis by stimulating the release of corticotropin releasing hormone (CRH) and adrenocorticotropic hormone (ACTH) and reducing sensitivity to glucocorticoids [18], which together may contribute to disrupted adaptation and pathological stress responses.
We also observed increased TNF expression in the amygdala of LT rats 24 days after stress exposure, consistent with previous findings in both rodent models of chronic stress and in patients with anxiety and affective disorders [19,20]. Some studies have shown that TNF can cross the blood-brain barrier via receptor-mediated transport, especially when barrier integrity is compromised. This is accompanied by elevated TNF expression in the hippocampus, prefrontal cortex, and striatum [21].
Thus, the delayed increase in pro-inflammatory cytokine expression in the amygdala observed in our study may reflect a persistent inflammatory process that supports or amplifies anxiety-related behavior. These findings highlight the importance of the temporal dynamics of neuroinflammatory responses and underscore the role of the amygdala as a potential target for interventions aimed at interrupting stress-induced pathophysiological conditions.
At the same time, LT rats also exhibited a sustained increase in the anti-inflammatory cytokine IL-10, starting as early as day 7 and persisting through day 24 after stress. This pattern may reflect an attempt by the immune system to limit local inflammation. In the context of chronic stress, the regulation of anti-inflammatory pathways may play an equally important role as the activation of pro-inflammatory cascades. IL-10, produced by macrophages, Th2 cells, and CD8+ T cells, can inhibit the synthesis of key inflammatory mediators such as interferon-γ (IFN-γ), IL-6, and TNF [22].
Nevertheless, existing literature presents conflicting data on IL-10 dynamics under chronic stress. Some studies report a decrease in IL-10 levels in the hippocampus and cortex of mice stress model [23], while measurements of serum IL-10 levels have shown both increases [24] and decreases [25] following stress. These inconsistencies likely reflect differences in neuroimmune sensitivity to stress across animal models, as well as variations in the dynamics of local vs. systemic inflammatory responses. They emphasize the need for further studies that account for genetic background.
Together, our findings suggest that LT rats develop a distinct neuroinflammatory profile in response to chronic stress, marked by delayed activation of pro-inflammatory pathways (IL-1β and TNF in the amygdala) and simultaneous sustained elevation of anti-inflammatory IL-10. This dual dynamic may represent a specific adaptation trajectory in which active inflammation is coupled with endogenous regulatory attempts to contain it.
In contrast, in HT rats (low-excitability), cytokine levels remained unchanged after stress exposure in all brain regions studied.
GFAP expression has traditionally been associated with reactive astroglia; however, numerous studies show that a decrease or absence of GFAP does not necessarily indicate a lack of reactivity or death of astrocytes. GFAP reflects only a part of the phenotypic spectrum of astroglia, and its expression is subject to both temporal and regional fluctuations [26].
In the GFAP-IL-10Tg transgenic mouse model, where astrocytes express IL-10, there is no increase in GFAP reactivity, despite high IL-10 production; at the same time, microglial activation increases and neuron death decreases [27]. This is consistent with our data: a decrease in the number of GFAP+ astrocytes on day 7 is accompanied by a peak in IL-10, which may reflect the transition of astrocytes to a less reactive but functionally active state.
It is important that it was at this time that we previously recorded a significant increase in microglia in all areas of the hippocampus in LT rats, whereas in HT rats, such changes were noted only in one zone [10]. This may indicate a link between a decrease in astrocytic reactivity and an IL-10 and microglial activity increase at day 7 after stress exposure, which, in turn, may contribute to the hyperproduction of proinflammatory cytokines at a later stage.
It is known that the microbial community of laboratory animals is very dynamic, and its composition can change in response not only to experimental influences but also to uncontrolled factors [28]. We did not observe any changes in gut microbiota composition over time in the control group of LT rats. In contrast, a transient shift in beta diversity was detected in the intact HT strain on day 7, which resolved by day 24. Since all animals were housed under identical standard conditions (diet, cage placement, and room environment), these transient microbiota changes may reflect strain-specific features rather than uncontrolled environmental variation. It also reproduces our previous research on this rat strain, where spontaneous shifts in microbiota composition, particularly involving Prevotella, were more pronounced in HT rats even under strictly controlled conditions [12]. This observation is consistent with other studies in rodents, which also demonstrate that host genetics substantially influence microbiota composition and variability [29].
In our study, the decrease in Streptococcus abundance was observed in the control group of low-excitability rats (HT). Although the genus Streptococcus is one of the dominant representatives of the microbiota in the upper intestine, such as the stomach and small intestine, where these bacteria are involved in lactate production and maintenance of microbial balance [30], the presence of Streptococcus in faeces may reflect their transient passage or spread from the upper gastrointestinal tract. Interestingly, after 7 days, low-excitable rats showed a decrease in Streptococcus in faeces, which corresponds to the natural dynamics of the microbiota and may be related to environmental changes or competition with other bacteria in the lower intestine.
This genetic influence on the gut microbiome has important implications for interpreting microbiome data, emphasizing the need to consider host genotype when assessing microbial dynamics and responses to stressors. It also suggests that interventions targeting the microbiome might require customization based on genetic background to be effective.
The spontaneous change in the gut microbiota of low-excitable rats that we observed indicates the need to take into account the possibility of such dynamics in experiments evaluating the effects on the microbiome of laboratory animals.
When assessing the effect of stress, we also observed changes in the gut microbiota composition only in the HT rat strain. Perhaps the rigidity of the microbiota does not lead to a decrease in the basic production of SCFA in rats with LT, but rather reflects a limited ability to regulate the production of SCFA in response to physiological stress-related problems. This lack of dynamic changes in the representation of taxa may prevent a compensatory increase in the content of metabolites such as butyrate or propionate, which are known to maintain barrier integrity and have anti-inflammatory effects. Thus, despite its stability, the LT microbiota may become maladaptive in conditions requiring dynamic metabolic adaptation.
These changes were evident both when comparing samples within the stressed group over time and when comparing the control and stressed groups. Notably, there are three taxa whose relative abundances consistently changed on the 7th day after stress exposure: Oscillospiraceae_NK4A214_group and Anaerovibrio (increased abundance), as well as Limosilactobacillus (decreased abundance).
In support of our findings, a recent study modeling chronic inflammation in mice through intranasal administration of Lipopolysaccharides (LPS) demonstrated a significant increase in the relative abundance of the taxon Oscillospiraceae_NK4A214_group in males at 10 weeks of age compared to controls [31].
Another study examining gut microbiome-behavior interactions in rats found that Oscillospiraceae relative abundance increased following social stress in rats [32]. Additionally, a comprehensive review on Oscillospira (a genus within Oscillospiraceae) discusses its presence and modulation in rodent guts, including rats. This review notes that Oscillospira abundance can be influenced by diet, probiotics, exercise, and environmental factors. It is considered a candidate for next-generation probiotics due to its associations with metabolic health and fat reduction [33].
It was shown that the relative abundance of the taxon Oscillospiraceae NK4A214 group is decreased in patients with depression compared to controls [34]. Considering that this taxon is involved in the anti-inflammatory response and production of SCFAs [35], it can be suggested that its increase in chronic stress models reflects a compensatory response of the organism, which is already impaired in patients diagnosed with depression.
Direct evidence of significant changes in the genus Anaerovibrio in response to stress in rodents has not yet been reported in the literature. However, it is known that this taxon plays an important role in lipid metabolism and fermentation in the gut. For example, studies in pigs have associated Anaerovibrio with improved fat utilization and energy metabolism in the intestine, which contributes to maintaining animal health and productivity [36]. Thus, the observed increase in Anaerovibrio in response to stress in our study may reflect an adaptive or compensatory response of the microbiota aimed at maintaining metabolic homeostasis and energy balance under stressful conditions.
In our study, a decrease in the abundance of the genus Limosilactobacillus was observed in response to stress in HT rats. This genus of lactic acid bacteria is widely recognized for its important role in maintaining gut health, strengthening the mucosal barrier function, modulating the immune response, and suppressing pathogenic microbiota. For example, Limosilactobacillus reuteri has been shown to reduce anxiety and improve cognitive functions in chronic stress models by restoring the balance of neurotransmitters (γ-aminobutyric acid (GABA), serotonin) and increasing the production of SCFAs, as demonstrated in experiments with mice subjected to chronic mild stress [37].
In our study, rat strains with high (LT) and low (HT) nervous system excitability exhibit distinct behavioral profiles and stress responses (Comparative table in Supplementary Materials). LT rats initially display high locomotor activity and exploratory behavior, which decrease under stress. In contrast, HT rats are initially less active and show reduced exploratory behavior; however, in response to stress, their behavior shifts toward a profile more characteristic of control LT rats—showing a relative increase in activity and exploratory behavior. Thus, HT rats demonstrate a unique behavioral profile in which stress leads to increased activity, differing from the classical stress-reactive pattern observed in LT rats.
This aligns with findings from studies on behavioral heterogeneity in outbred rat populations, such as Sprague-Dawley [38] and Wistar rats [39,40], which have been shown to exhibit diverse anxiety-related traits and coping styles.
This study has a number of limitations. Firstly, microbiota analysis was limited to 16S rRNA sequencing, which does not allow direct prediction of the functional activity of microorganisms. Although we have discussed the potential role of the identified key taxa based on the published literature, future research should use metagenomic approaches to provide a more comprehensive functional perspective. The temporal resolution was restricted to two post-stress time points (7 and 24 days), which may overlook earlier acute responses and longer-term outcomes. Behavioral assessment was limited to the elevated plus maze, providing only a partial view of stress-induced behavioral phenotypes.
The different behavioral profiles observed in LT and HT rats are accompanied by differences in neuroinflammatory reactions and changes in the intestinal microbiota, which indicates complex interactions between the nervous system, immune activation, and microbial communities in response to stress. In particular, LT rats, which exhibit classical suppression of exploratory behavior in response to stress accompanied by neuroinflammation, showed relatively stable microbiota profiles. This stability may reflect a “rigid microbiota”, which, despite its apparent resilience, may limit the body’s ability to adapt to physiological changes caused by stress, potentially increasing vulnerability to neuroinflammatory processes.
On the contrary, the behavior of HT rats is characterized by increased activity after stress, while they have no signs of neuroinflammation and significant changes in the composition of the intestinal microbiota are observed compared with the control. This flexibility of microbes can promote adaptive response or reflect it, supporting behavioral resistance to stress.
Our results show that different stress reaction strategies are determined by the genetic characteristics of selectively bred strains. This expands the possibilities of modeling post-stress disorders: models must take into account the complex genetic background of strains and their ability to influence neuroimmune and microbiological flexibility. Compared to outbred populations such as Wistar rats, in which heterogeneous post-stress changes trajectories are mixed and difficult to separate, the use of selectively bred strains provides a more systematic way to compare contrasting strategies, making strain-specific models a powerful tool for analyzing mechanisms of vulnerability and resistance to stress.
Acknowledgement: Not applicable.
Funding Statement: The work was supported by the Priority 2030 Federal Academic Leadership Program at Immanuel Kant Baltic Federal University and ongoing federal budget funding to Pavlov Institute of Physiology of the Russian Academy of Sciences (No. 1021062411629-7-3.1.4).
Author Contributions: Irina Shalaginova and Natalia Dyuzhikova conceived and designed the study. Marina Pavlova performed animal perfusion, brain extraction, and dissection; Anastasia Vylegzhanina, Dana Korolevich, Dmitry Katserov, Alexandra Semenova, Maria Sidorova, Sergey Eresko, Marat Airapetov, and Anna Levina conducted animal experiments and collected experimental data. Irina Shalaginova and Anastasia Vylegzhanina were responsible for data statistics and analysis of results. Irina Shalaginova wrote the paper. Natalia Dyuzhikova reviewed the manuscript. All authors reviewed the results and approved the final version of the manuscript.
Availability of Data and Materials: Raw 16s RNAseq data are available in the NCBI Sequence Read Archive under BioProject accession number PRJNA1314734.
Ethics Approval: The protocol was approved by the Bioethics Commission of the I.P. Pavlov Institute of Physiology of the Russian Academy of Sciences (Protocol number 09/16 dated 16 September 2021).
Conflicts of Interest: The authors declare no conflicts of interest to report regarding the present study.
Supplementary Materials: The supplementary material is available online at https://www.techscience.com/doi/10.32604/biocell.2025.071198/s1.
References
1. de Pablos RM, Villarán RF, Argüelles S, Herrera AJ, Venero JL, Ayala A, et al. Stress increases vulnerability to inflammation in the rat prefrontal cortex. J Neurosci. 2006;26(21):5709–19. doi:10.1523/JNEUROSCI.0802-06.2006. [Google Scholar] [PubMed] [CrossRef]
2. Dinkel K, MacPherson A, Sapolsky RM. Novel glucocorticoid effects on acute inflammation in the CNS. J Neurochem. 2003;84(4):705–16. doi:10.1046/j.1471-4159.2003.01604.x. [Google Scholar] [PubMed] [CrossRef]
3. Munhoz CD, Lepsch LB, Kawamoto EM, Malta MB, deS Lima L, Avellar MCW, et al. Chronic unpredictable stress exacerbates lipopolysaccharide-induced activation of nuclear factor-κB in the frontal cortex and hippocampus via glucocorticoid secretion. J Neurosci. 2006;26(14):3813–20. doi:10.1523/JNEUROSCI.4398-05.2006. [Google Scholar] [PubMed] [CrossRef]
4. Miller AH, Raison CL. The role of inflammation in depression: from evolutionary imperative to modern treatment target. Nat Rev Immunol. 2016;16(1):22–34. doi:10.1038/nri.2015.5. [Google Scholar] [PubMed] [CrossRef]
5. Toben C, Baune BT. Chapter 7—the roles of T cells in clinical depression. In: Baune BT, editor. Inflammation and immunity in depression. Cambridge, MA, USA: Academic Press; 2018. p. 115–33. doi:10.1016/B978-0-12-811073-7.00007-6. [Google Scholar] [CrossRef]
6. Wohleb ES, Delpech JC. Dynamic cross-talk between microglia and peripheral monocytes underlies stress-induced neuroinflammation and behavioral consequences. Prog Neuropsychopharmacol Biol Psychiatry. 2017;79(Pt A):40–8. doi:10.1016/j.pnpbp.2016.04.013. [Google Scholar] [PubMed] [CrossRef]
7. Konjevod M, Nikolac Perkovic M, Sáiz J, Svob Strac D, Barbas C, Rojo D. Metabolomics analysis of microbiota-gut-brain axis in neurodegenerative and psychiatric diseases. J Pharm Biomed Anal. 2021;194:113681. doi:10.1016/j.jpba.2020.113681. [Google Scholar] [PubMed] [CrossRef]
8. O’Riordan KJ, Collins MK, Moloney GM, Knox EG, Aburto MR, Fülling C, et al. Short chain fatty acids: microbial metabolites for gut-brain axis signalling. Mol Cell Endocrinol. 2022;546:111572. doi:10.1016/j.mce.2022.111572. [Google Scholar] [PubMed] [CrossRef]
9. Vaido A, Shiryaeva N, Pavlova M, Levina A, Khlebaeva D, Lyubashina O, et al. Selected rat strains ht, lt as a model for the study of dysadaptation states dependent on the level of excitability of the nervous system. Lab Anim Sci Rus. 2018;1(3):12–22. (In Russian). doi:10.29296/2618723x-2018-03-02. [Google Scholar] [CrossRef]
10. Shalaginova IG, Tuchina OP, Sidorova MV, Levina AS, Khlebaeva DA, Vaido AI, et al. Effects of psychogenic stress on some peripheral and central inflammatory markers in rats with the different level of excitability of the nervous system. PLoS One. 2021;16(7):e0255380. doi:10.1371/journal.pone.0255380. [Google Scholar] [PubMed] [CrossRef]
11. Shiryaeva NV, Vshivtseva VV, Mal’tsev NA, Sukhorukov VN, Vaido AI. Neuron density in the hippocampus in rat strains with contrasting nervous system excitability after prolonged emotional-pain stress. Neurosci Behav Physiol. 2008;38(4):355–7. doi:10.1007/s11055-008-0049-4. [Google Scholar] [PubMed] [CrossRef]
12. Shevchenko A, Shalaginova I, Katserov D, Matskova L, Shiryaeva N, Dyuzhikova N. Post-stress changes in the gut microbiome composition in rats with different levels of nervous system excitability. PLoS One. 2023;18(12):e0295709. doi:10.1371/journal.pone.0295709. [Google Scholar] [PubMed] [CrossRef]
13. Pedregosa F, Varoquaux G, Gramfort A, Michel V, Thirion B, Grisel O, et al. Scikit-learn: machine learning in Python. J Mach Learn Res. 2011;12(85):2825–30. [Google Scholar]
14. Shalaginova I, Pavlova M, Dyuzhikova N. Аmygdala DEGs are associated with the immune system function: a comparative transcriptomic study of high- and low-excitability rat strains. PLoS One. 2025;20(5):e0323325. doi:10.1371/journal.pone.0323325. [Google Scholar] [PubMed] [CrossRef]
15. Nemeth DP, Quan N. Modulation of neural networks by interleukin-1. Brain Plast. 2021;7(1):17–32. doi:10.3233/BPL-200109. [Google Scholar] [PubMed] [CrossRef]
16. White AG, Elias E, Orozco A, Robinson SA, Manners MT. Chronic stress-induced neuroinflammation: relevance of rodent models to human disease. Int J Mol Sci. 2024;25(10):5085. doi:10.3390/ijms25105085. [Google Scholar] [PubMed] [CrossRef]
17. Goshen I, Kreisel T, Ben-Menachem-Zidon O, Licht T, Weidenfeld J, Ben-Hur T, et al. Brain interleukin-1 mediates chronic stress-induced depression in mice via adrenocortical activation and hippocampal neurogenesis suppression. Mol Psychiatry. 2008;13(7):717–28. doi:10.1038/sj.mp.4002055. [Google Scholar] [PubMed] [CrossRef]
18. Koo JW, Duman RS. IL-1beta is an essential mediator of the antineurogenic and anhedonic effects of stress. Proc Natl Acad Sci U S A. 2008;105(2):751–6. doi:10.1073/pnas.0708092105. [Google Scholar] [PubMed] [CrossRef]
19. Zhao X, Cao F, Liu Q, Li X, Xu G, Liu G, et al. Behavioral, inflammatory and neurochemical disturbances in LPS and UCMS-induced mouse models of depression. Behav Brain Res. 2019;364:494–502. doi:10.1016/j.bbr.2017.05.064. [Google Scholar] [PubMed] [CrossRef]
20. Pandey GN, Rizavi HS, Zhang H, Bhaumik R, Ren X. Abnormal protein and mRNA expression of inflammatory cytokines in the prefrontal cortex of depressed individuals who died by suicide. J Psychiatry Neurosci. 2018;43(6):376–85. doi:10.1503/jpn.170192. [Google Scholar] [PubMed] [CrossRef]
21. Cheng Y, Desse S, Martinez A, Worthen RJ, Jope RS, Beurel E. TNFα disrupts blood brain barrier integrity to maintain prolonged depressive-like behavior in mice. Brain Behav Immun. 2018;69:556–67. doi:10.1016/j.bbi.2018.02.003. [Google Scholar] [PubMed] [CrossRef]
22. Porro C, Cianciulli A, Panaro MA. The regulatory role of IL-10 in neurodegenerative diseases. Biomolecules. 2020;10(7):1017. doi:10.3390/biom10071017. [Google Scholar] [PubMed] [CrossRef]
23. Voorhees JL, Tarr AJ, Wohleb ES, Godbout JP, Mo X, Sheridan JF, et al. Prolonged restraint stress increases IL-6, reduces IL-10, and causes persistent depressive-like behavior that is reversed by recombinant IL-10. PLoS One. 2013;8(3):e58488. doi:10.1371/journal.pone.0058488. [Google Scholar] [PubMed] [CrossRef]
24. Hu D, Wan L, Chen M, Caudle Y, LeSage G, Li Q, et al. Essential role of IL-10/STAT3 in chronic stress-induced immune suppression. Brain Behav Immun. 2014;36:118–27. doi:10.1016/j.bbi.2013.10.016. [Google Scholar] [PubMed] [CrossRef]
25. Zhang C, Liu B, Pawluski J, Steinbusch HWM, Kunikullaya UK, Song C. The effect of chronic stress on behaviors, inflammation and lymphocyte subtypes in male and female rats. Behav Brain Res. 2023;439:114220. doi:10.1016/j.bbr.2022.114220. [Google Scholar] [PubMed] [CrossRef]
26. Jurga AM, Paleczna M, Kadluczka J, Kuter KZ. Beyond the GFAP-astrocyte protein markers in the brain. Biomolecules. 2021;11(9):1361. doi:10.3390/biom11091361. [Google Scholar] [PubMed] [CrossRef]
27. Almolda B, de Labra C, Barrera I, Gruart A, Delgado-Garcia JM, Villacampa N, et al. Alterations in microglial phenotype and hippocampal neuronal function in transgenic mice with astrocyte-targeted production of interleukin-10. Brain Behav Immun. 2015;45:80–97. doi:10.1016/j.bbi.2014.10.015. [Google Scholar] [PubMed] [CrossRef]
28. Hildebrand F, Nguyen TL, Brinkman B, Yunta RG, Cauwe B, Vandenabeele P, et al. Inflammation-associated enterotypes, host genotype, cage and inter-individual effects drive gut microbiota variation in common laboratory mice. Genome Biol. 2013;14(1):R4. doi:10.1186/gb-2013-14-1-r4. [Google Scholar] [PubMed] [CrossRef]
29. Van averbeke V, Berkell M, Mysara M, Rodriguez-Ruiz JP, Xavier BB, De Winter FHR, et al. Host immunity influences the composition of murine gut microbiota. Front Immunol. 2022;13:828016. doi:10.3389/fimmu.2022.828016. [Google Scholar] [PubMed] [CrossRef]
30. Li D, Chen H, Mao B, Yang Q, Zhao J, Gu Z, et al. Microbial biogeography and core microbiota of the rat digestive tract. Sci Rep. 2017;8:45840. doi:10.1038/srep45840. [Google Scholar] [PubMed] [CrossRef]
31. Hasegawa-Ishii S, Komaki S, Asano H, Imai R, Osaki T. Chronic nasal inflammation early in life induces transient and long-term dysbiosis of gut microbiota in mice. Brain Behav Immun Health. 2024;41:100848. doi:10.1016/j.bbih.2024.100848. [Google Scholar] [PubMed] [CrossRef]
32. Voulgari-Kokota A, Falcao Salles J, Schoemaker RG. Aggression shapes the gut microbiome; a study in rats. PLoS One. 2024;19(10):e0312423. doi:10.1371/journal.pone.0312423. [Google Scholar] [PubMed] [CrossRef]
33. Yang J, Li Y, Wen Z, Liu W, Meng L, Huang H. Oscillospira—a candidate for the next-generation probiotics. Gut Microbes. 2021;13(1):1987783. doi:10.1080/19490976.2021.1987783. [Google Scholar] [PubMed] [CrossRef]
34. Hernández-Cacho A, García-Gavilán JF, Atzeni A, Konstanti P, Belzer C, Vioque J, et al. Multi-omics approach identifies gut microbiota variations associated with depression. npj Biofilms Microbiomes. 2025;11(1):68. doi:10.1038/s41522-025-00707-9. [Google Scholar] [PubMed] [CrossRef]
35. Chen YJ, Ho HJ, Tseng CH, Chen YF, Wang ST, Shieh JJ, et al. Short-chain fatty acids ameliorate imiquimod-induced skin thickening and IL-17 levels and alter gut microbiota in mice: a metagenomic association analysis. Sci Rep. 2024;14(1):17495. doi:10.1038/s41598-024-67325-x. [Google Scholar] [PubMed] [CrossRef]
36. Bergamaschi M, Tiezzi F, Howard J, Huang YJ, Gray KA, Schillebeeckx C, et al. Gut microbiome composition differences among breeds impact feed efficiency in swine. Microbiome. 2020;8(1):110. doi:10.1186/s40168-020-00888-9. [Google Scholar] [PubMed] [CrossRef]
37. Tyagi A, Choi YY, Shan L, Vinothkanna A, Lee ES, Chelliah R, et al. Limosilactobacillus reuteri fermented brown rice alleviates anxiety improves cognition and modulates gut microbiota in stressed mice. npj Sci Food. 2025;9(1):5. doi:10.1038/s41538-025-00369-z. [Google Scholar] [PubMed] [CrossRef]
38. Curé M, Rolinat JP. Behavioral heterogeneity in sprague-dawley rats. Physiol Behav. 1992;51(4):771–4. doi:10.1016/0031-9384(92)90114-H. [Google Scholar] [PubMed] [CrossRef]
39. Liebsch G, Montkowski A, Holsboer F, Landgraf R. Behavioural profiles of two Wistar rat lines selectively bred for high or low anxiety-related behaviour. Behav Brain Res. 1998;94(2):301–10. doi:10.1016/s0166-4328(97)00198-8. [Google Scholar] [PubMed] [CrossRef]
40. Radhakrishnan A, Gulia KK. Categories of wistar rats based on anxiety traits: a study using factor and cluster method. Ann Neurosci. 2018;25(4):234–40. doi:10.1159/000492268. [Google Scholar] [PubMed] [CrossRef]
Cite This Article
 Copyright © 2025 The Author(s). Published by Tech Science Press.
This work is licensed under a Creative Commons Attribution 4.0 International License , which permits unrestricted use, distribution, and reproduction in any medium, provided the original work is properly cited.
 Downloads
 Citation Tools