
 Submit a Paper
 Propose a Special lssue
 Open Access
ARTICLE
Characterization of Transcription Factor Krüppel-Like Factor 3 Expression in Splenic T Lymphocytes and Association with Immune Status in Septic Mice
1 Departments of Critical Care Medicine, Peking University First Hospital, Beijing, 100034, China
2 Departments of Pediatrics, Peking University First Hospital, Beijing, 100034, China
3 Laboratory of Electron Microscopy, Pathological Center, Peking University First Hospital, Beijing, 100034, China
4 Experiment Center, Peking University First Hospital, Beijing, 100034, China
* Corresponding Author: SHUANGLING LI. Email:
(This article belongs to the Special Issue: Cellular and Molecular Mechanisms Underlying Inflammation and Immune Regulation: From Genotoxicity to Apoptosis)
BIOCELL 2025, 49(5), 893-906. https://doi.org/10.32604/biocell.2025.063622
Received 19 January 2025; Accepted 14 April 2025; Issue published 27 May 2025
 View Full Text
 Download PDF
Abstract
Background: Transcription factor Krüppel-like factor 3 (KLF3) may be involved in regulating inflammation and lymphocyte function. Immune dysfunction in sepsis involves both hyper-inflammation and immunosuppression. However, studies on T-lymphocyte KLF3 expression in sepsis are lacking. Methods: We induced sepsis in mice via cecal ligation and puncture (CLP), and their survival rate over 7 days was evaluated. To identify the immune status of these mice, we assessed their cytokine levels, organ damage scores, and splenic T-lymphocyte phenotype. Finally, T-lymphocyte KLF3 expression was detected through flow cytometry. Results: Over the 7 days of observation, septic mice demonstrated 64.7% mortality. In the early stages after CLP, the proinflammatory and anti-inflammatory cytokine levels increased rapidly, multiple organ damage occurred, and splenic T lymphocytes became activated. However, the proportion of KLF3+ T lymphocytes decreased. Subsequently, cytokine levels and lymphocyte activation decreased. An increase in cell apoptosis led to a substantial loss of T lymphocytes. Combined with the continual elevations in serum interleukin levels and worsening severe organ damage, septic mice may have entered a state of persistent inflammation and immunosuppression, with a simultaneous increase in KLF3 expression in T lymphocytes. Notably, KLF3 expression was negatively correlated with T-lymphocyte activation and apoptosis. Conclusions: In our septic mice, splenic T-lymphocyte KLF3 expression decreased in the early stage when the mice exhibited a systemic inflammatory response and T-lymphocyte activation. In contrast, it increased in the later stage, when persistent inflammation and immunosuppression occurred. Dynamic monitoring of KLF3 expression levels may provide aid in identifying the immune status of sepsis.Keywords
Supplementary Material
Supplementary Material FileThe transcription factor Krüppel-like factor (KLF) 3 (KLF3), a member of the KLF family, is characterized by the presence of three highly conserved C-terminal C2H2 zinc fingers, which allow for their sequence-specific binding onto CACCC boxes and GC-rich motifs in the promoters and control regions of its target genes [1,2]. KLF3 has been implicated in numerous biological roles, spanning from the regulation of B-lymphocyte development and erythropoiesis to that of adipogenesis and muscle cell biology [3–6]. Moreover, in a study on the gene expression profiles of mouse primary T lymphocytes, stimulation greatly compromised the expression of KLF family genes, with the strongest repressive effect being on KLF3 [7]. A human clinical study reported that KLF3 expression is also repressed in lymphocytic leukemia cells [8]. KLF3 is required for widespread repression of the inflammatory modulator galectin-3, and Lgals3 is a direct target for KLF3 binding and repression [9]. In addition, KLF3 can directly bind and repress nuclear factor-kappa B (NF-κB) expression via a simple feedback inhibition mechanism [10]. As such, KLF3 is a potential factor related to regulating T-lymphocyte function and inflammatory responses.
Sepsis is life-threatening organ dysfunction caused by a dysregulated host response to infection [11]. During sepsis occurrence and development, immune dysfunction may present with both hyper-inflammatory and immunosuppressive responses [12]. In sepsis-induced immunosuppression, lymphopenia is a hallmark of impairments in acquired immune responses [13–15], involving mechanisms that include enhanced apoptosis and dysfunction of acquired immune cells, as evidenced by decreases in the number of T lymphocytes and abnormal distribution of T-lymphocyte subsets [12,16]. This, in addition to the relationship of KLF3 with the regulation of inflammation and lymphocyte function, suggests potential involvement of KLF3 in sepsis occurrence and development. Research on KLF3 expression in T lymphocytes involved in sepsis is currently lacking.
Elucidating the expression patterns and functional roles of KLF3 during the pathogenesis of sepsis may reveal novel immunoregulatory strategies. In this study, we assessed the expression characteristics of KLF3 in splenic T lymphocytes in septic mice and provided a basis for further exploration of its role in septic immune monitoring and regulation.
All the animal experiments and procedures were approved by the Laboratory Animal Ethics Committee of Peking University First Hospital (approval number: J2022041, 20 May 2022). Male C57BL/6 J mice (age, 8–12 weeks) were purchased from SPF (Beijing, China) Biotechnology Corporation Ltd. [License No. SCXK(Jing) 2019-0010]. The mice were randomly assigned to the sham group (n = 3–5) and the septic group (n = 3–5 at each time point) for the detection of cytokine levels, organ damage scores, and splenic T-lymphocyte phenotype. They were housed in the specific pathogen-free environment of our laboratory animal facility (12-h day/night cycle at 25°C) with free access to food and water. Before use, the animals were allowed to acclimate to laboratory conditions for at least 1 week.
2.2 Cecal Ligation and Puncture
Sepsis was induced through cecal ligation and puncture (CLP), as described previously [17]. In brief, the mice were anesthetized with 0.5% pentobarbital sodium (50–60 mg/kg) intraperitoneally. Each mouse was placed in the supine position on an operating pad; then, its abdomen was shaved and sterilized with 75% alcohol. A 0.5–1.0-cm vertical midline incision was created through the abdominal wall, and the cecum was externalized. Next, 75% of the cecum was ligated (via distal ligation) with a 4-0 silk suture and penetrated completely with a 21-gauge needle. Two drops of feces were gently squeezed from penetration holes, and the cecum was re-placed into the peritoneal cavity. The abdominal incision was closed in two layers with 5-0 silk sutures and sterilized with iodine. Sham-operated mice underwent the aforementioned procedure but without cecum ligation or puncture. Finally, 1.0 mL of prewarmed saline was injected subcutaneously to resuscitate each mouse. The survival rate was assessed every 6–8 h, and all mice were observed until the end of post-CLP day 7.
2.3 Enzyme-Linked Immunosorbent Assay
A whole blood sample was collected via cardiac puncture and placed at room temperature for 4 h. Serum was separated from the blood through centrifugation at 4000 rpm at 4°C for 20 min (Centrifuge 5425 R, Eppendorf, Hamburg, Germany). Serum interleukin-6 (IL-6) and interleukin-10 (IL-10) levels were then determined using an enzyme-linked immunosorbent assay (ELISA) kits (Elabscience, E-EL-M0044c and E-MSEL-M0031, Wuhan, China), according to the manufacturer’s instructions.
2.4 Quantitative Reverse Transcription Polymerase Chain Reaction
Total RNA was extracted using TRIzol reagent (Invitrogen, 15596018, Waltham, MA, USA) and subjected to purity and concentration measurement using a Nanodrop2000 (Thermo Fisher Scientific, ND-1000 spectrophotometer, Wilmington, DE, USA). An A260/A280 ratio between 1.8–2.0 was considered qualified for purity. Complementary DNA was synthesized from 2 μg of total RNA using FastKing RT Enzyme (Tiangen Biotech, KR118, Beijing, China). Quantitative reverse transcription polymerase chain reaction (qRT-PCR) reagents were prepared using the PowerUp SYBR Green Master Mix (Thermo, A25742, Waltham, MA, USA). qRT-PCRs were performed on an ABI ViiA7 system (Applied Biosystems, CA, USA). The results were normalized to the glyceraldehyde-3-phosphate dehydrogenase (Gapdh). All qRT-PCR primer sequences are listed in Supplementary Table S1. Relative mRNA expression was analyzed using the 2−ΔΔCt method on Excel 2019MS0 (version 2501Build 16.0.18429.20132, Microsoft, Washington, DC, USA).
2.5 Hematoxylin and Eosin Staining
Kidney, liver, heart, and lung tissues were fixed in 10% formaldehyde (Leagene, DF0118, Beijing, China) for at least 24 h. After dehydration in a series of ascending concentrations of ethanol (Mreda, M042753-500 mL, Beijing, China), samples were embedded in paraffin (Leica, 39601006, Wetzlar, Germany). The tissue blocks were then sectioned at 4-μm thickness using a microtome (Leica, RM2235), and the slices were stained with hematoxylin and eosin (H&E) (Solarbio, G1120, Beijing, China) for observation under a light microscope (Eclipse Ci-L, Nikon, Japan) in a high-power field (magnification, 400×). The degree of histopathological damage was scored by a pathologist blind to experimental groupings on a 0–4 scale (Supplementary Table S2) [18,19]. For each mouse, six randomly selected nonoverlapping fields were scored, and a mean score was calculated for each group.
Spleens were harvested from all mice after they were sacrificed. The spleens were then placed in a 10-mL culture dish containing 5 mL PBS and broken down using the rubber end of a sterile 3-mL syringe. Cells were passed through a 70-μm mesh filter (Biosharp, BS-70-CS, Anhui, China), and the single-cell suspensions were centrifuged and resuspended in PBS. After red cell lysis (Tiangen Biotech, RT122-01), each splenocyte suspension was adjusted to a concentration of 1 × 10⁷ cells/mL, and live cells were counted using trypan blue (Solarbio, C0040-50 mL) exclusion staining. The suspensions were preincubated with monoclonal antibodies (mAbs) against CD16/CD32 (1:200, Biolegend, 156603, San Diego, CA, USA) for 10 min on ice for Fc receptor blocking. This was followed by incubation for 20 min with the fluorochrome-conjugated mAbs against the following antigens: CD3 (AF700) (1:250, Biolegend, 100216), CD8 (BV421) (1:200, Biolegend, 100737), CD69 (APC) (1:100, Biolegend, 104513), and CD71 (PE) (1:250, Biolegend, 113807). Apoptosis was assessed using 7AAD (Percp) (1:20, Biolegend, 420403) and Apotracker Green (FITC) (1:200, Biolegend, 427401).
Next, we stained the splenocytes for KLF3. In brief, the splenocytes were fixed and permeabilized with a fixation/permeability working buffer (Invitrogen, 00-5523-00). They were incubated with anti-KLF3 goat primary antibody (10 μg/mL, Invitrogen, PA5-18030) for 45 min and then with Alexa Fluor 488-conjugated donkey anti-goat immunoglobulin G (1 μg/mL, Invitrogen, A-11055). Goat immunoglobulin G (Beyotime, A7007, Beijing, China) was used as the isotype control for the primary antibody. Flow cytometry was performed on a BD LSRFortessa X-20 (BD Biosciences, CA, USA). Finally, flow cytometric data were analyzed using FlowJo (version 10.8.1, Becton Dickinson, USA). Fig. 1 illustrates the gating strategy used for flow cytometry.
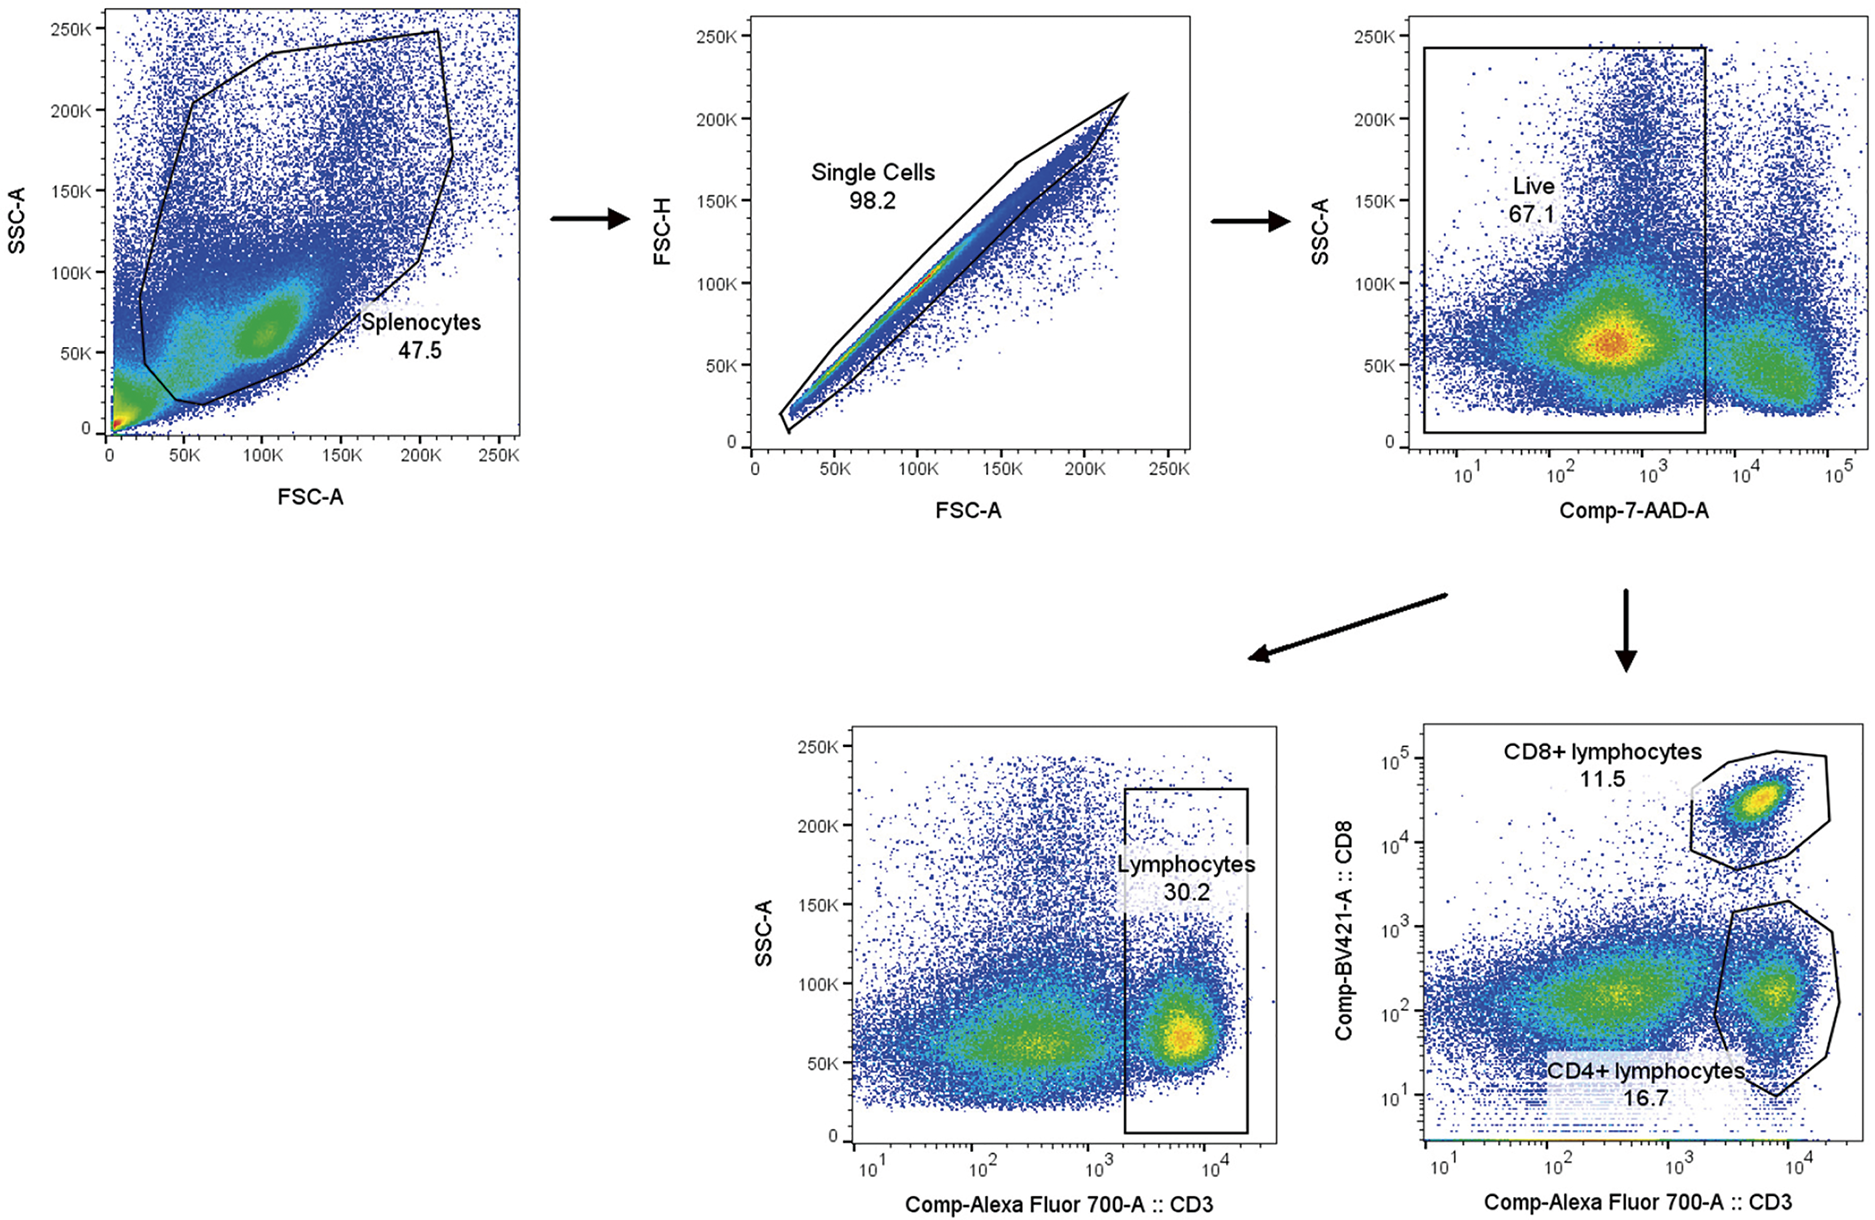
Figure 1: Gating method for flow cytometry
All data are presented as means ± standard deviations. Data from three or more groups were compared using one-way analysis of variance. Differences between CD4+ and CD8+ T-lymphocyte subpopulations were evaluated using Student’s t test. Correlation between independent data was assessed with Spearman’s correlation test. Survival rates in each group, presented using Kaplan-Meier curves, were evaluated using the log-rank test. GraphPad Prism (version 9.5; GraphPad, San Diego, CA, USA) was used for graphic and statistical analyses. A p-value of <0.05 was considered to indicate statistical significance.
3.1 Whole-Body Status Scores and Survival Rates of Septic Mice
CLP in rodents has become the most widely used model for experimental sepsis [17]. Here, we induced severe sepsis in our mice by ligating 75% of the cecum. To mimic the natural progression of sepsis, we did not administer any antimicrobials to the mice.
At around 12 h after CLP, all operated mice began demonstrating signs including malaise, chills, piloerection, generalized weakness, and reduced gross motor activity. Using our scoring system (Supplementary Table S3), we scored the whole-body status of septic mice at 18 h after CLP in terms of their mental state, autonomous motor activity, and myodynamia. As shown in Fig. 2A, the septic mice demonstrated a significantly lower whole-body status score than the sham-operated mice. Lethality was noted beginning at 24 h after CLP, and the 7-day mortality rate was 64.7% (Fig. 2B).
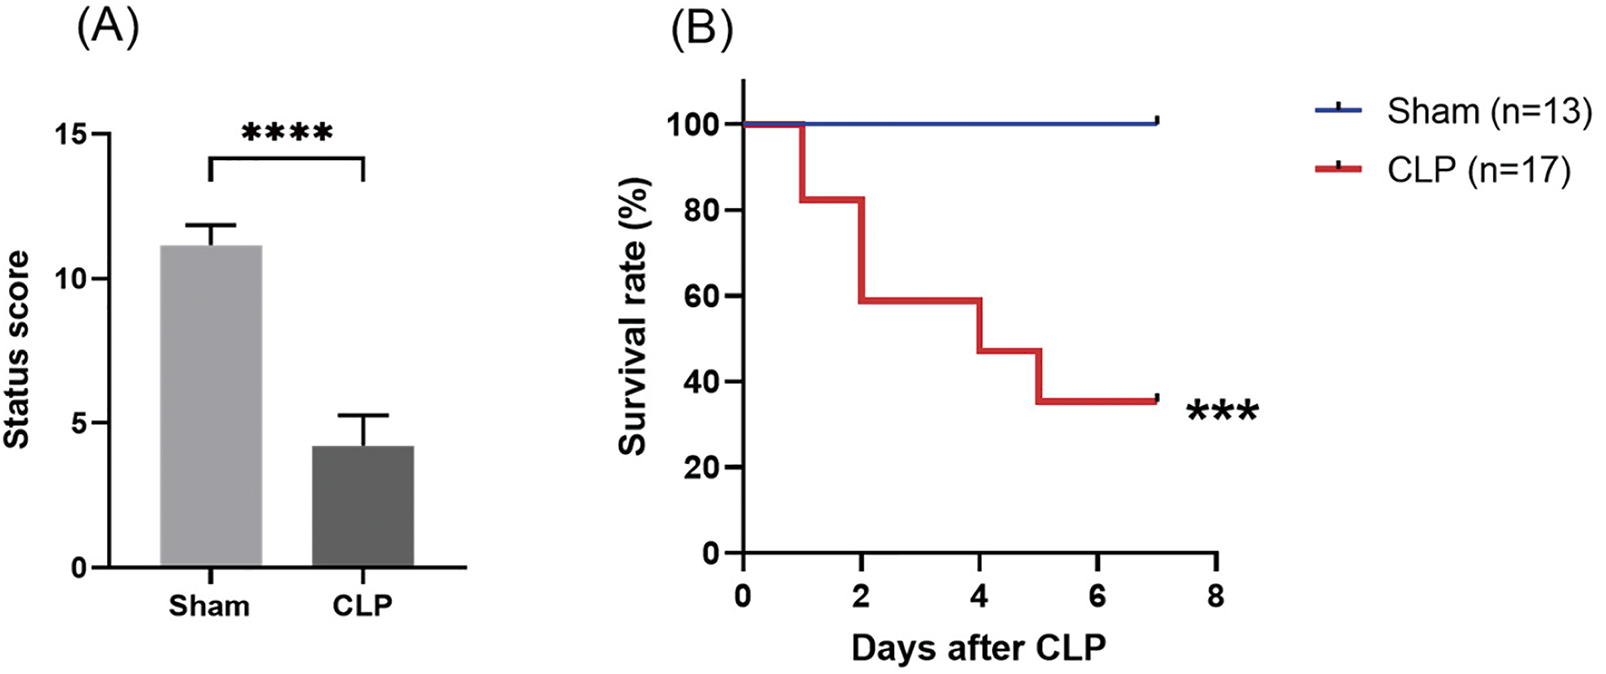
Figure 2: Establishment of the CLP-induced sepsis mouse model. (A) Assessment of mouse status scores at 18 h after CLP. (B) Survival rate after sepsis induction through CLP in mice. Differences between groups are significant: ***p < 0.001, ****p < 0.0001 vs. sham mice. CLP, cecal ligation and puncture
3.2 Systemic Inflammatory Response and Organ Injury in Septic Mice
In the early stage after CLP, the septic mice demonstrated considerable increases in spleen Il10, Il6, Il1b, Ifng, and Tnfa mRNA levels (Fig. 3A) and serum IL-10 and IL-6 levels (Fig. 3B), which suggested that their systemic inflammatory responses had increased significantly. In contrast, spleen Klf3 mRNA levels decreased, and they were the lowest on post-CLP day 3 (Fig. 3C). Over the 7 days after CLP, the expression of the aforementioned proinflammatory and anti-inflammatory mediators in the spleen and serum decreased gradually, but serum IL-10 and IL-6 levels remained higher in the septic mice than in the sham-operated mice until the post-CLP day 7 (Fig. 3B). These results indicated that inflammatory response remained persistent in the septic mice. In the late stage after CLP, Klf3 mRNA expression increased gradually (Fig. 3C). Furthermore, significant negative correlations were observed in mRNA relative expression levels between Klf3 and cytokines Il10 (r = −0.7523, p = 0.0003) and Il6 (r = −0.7765, p < 0.0001) (Fig. 3D). Therefore, in the septic mice, changes in KLF3 expression demonstrated a trend opposite to changes in the systemic inflammatory response.
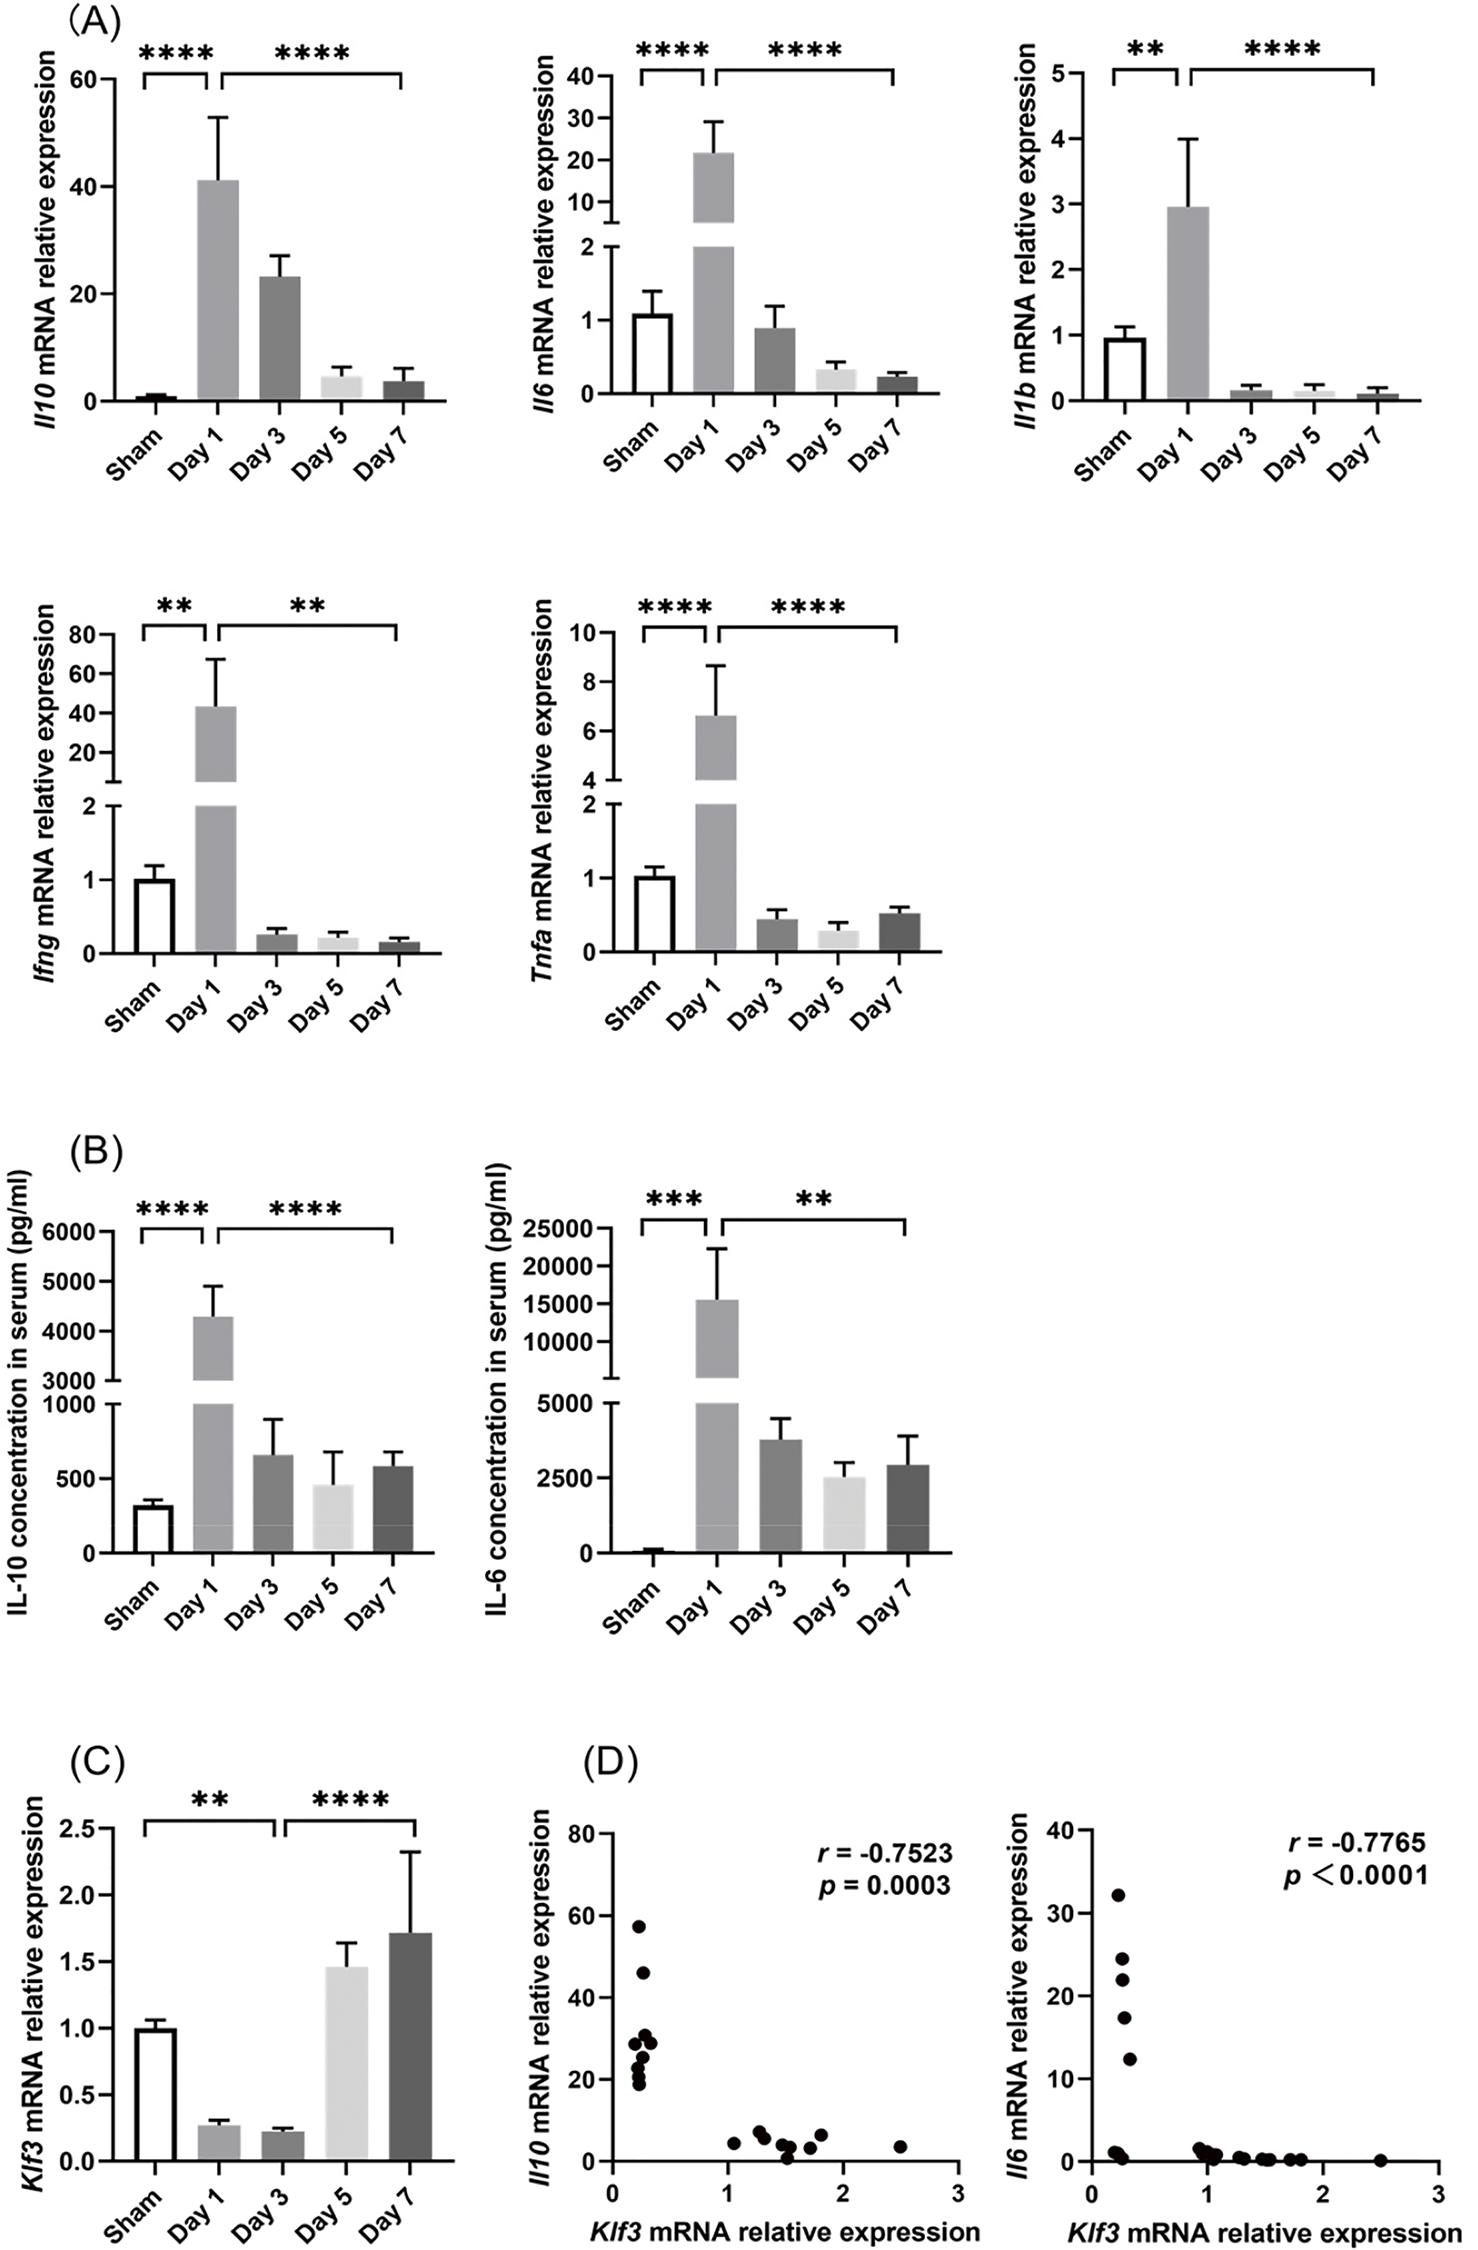
Figure 3: Changes in inflammation indicators and KLF3 in mice after CLP. (A) Inflammatory mediator mRNA expression in the spleen (n = 5 per group on days 1–5; n = 4 per group on day 7). (B) Serum IL-6 and IL-10 levels (n = 5 in sham mice; n = 4 on days 1–5 in septic mice; n = 3 on day 7 in septic mice). (C) Klf3 mRNA expression in the spleen (n = 5 per group on days 1–5; n = 4 per group on day 7). (D) Correlation analysis of mRNA expression between Klf3 and cytokines. Differences between groups are significant: **p < 0.01, ***p < 0.001, ****p < 0.0001. IL-10, interleukin-10; IL-6, interleukin-6; IL-1β, interleukin-1β; IFN-γ, interferon-γ; TNF-α, tumor necrosis factor-α; KLF3, Krüppel-like factor 3
The severity of CLP-induced organ damage was also determined through histological analysis (Fig. 4). The H&E staining results demonstrated that severe kidney damage, including Bowman’s capsule expansion, tubular epithelial vacuolization, and brush border loss, occurred in the early stage after CLP surgery. The histological analysis also revealed that liver, heart, and lung injury became increasingly severe over the course of sepsis development.
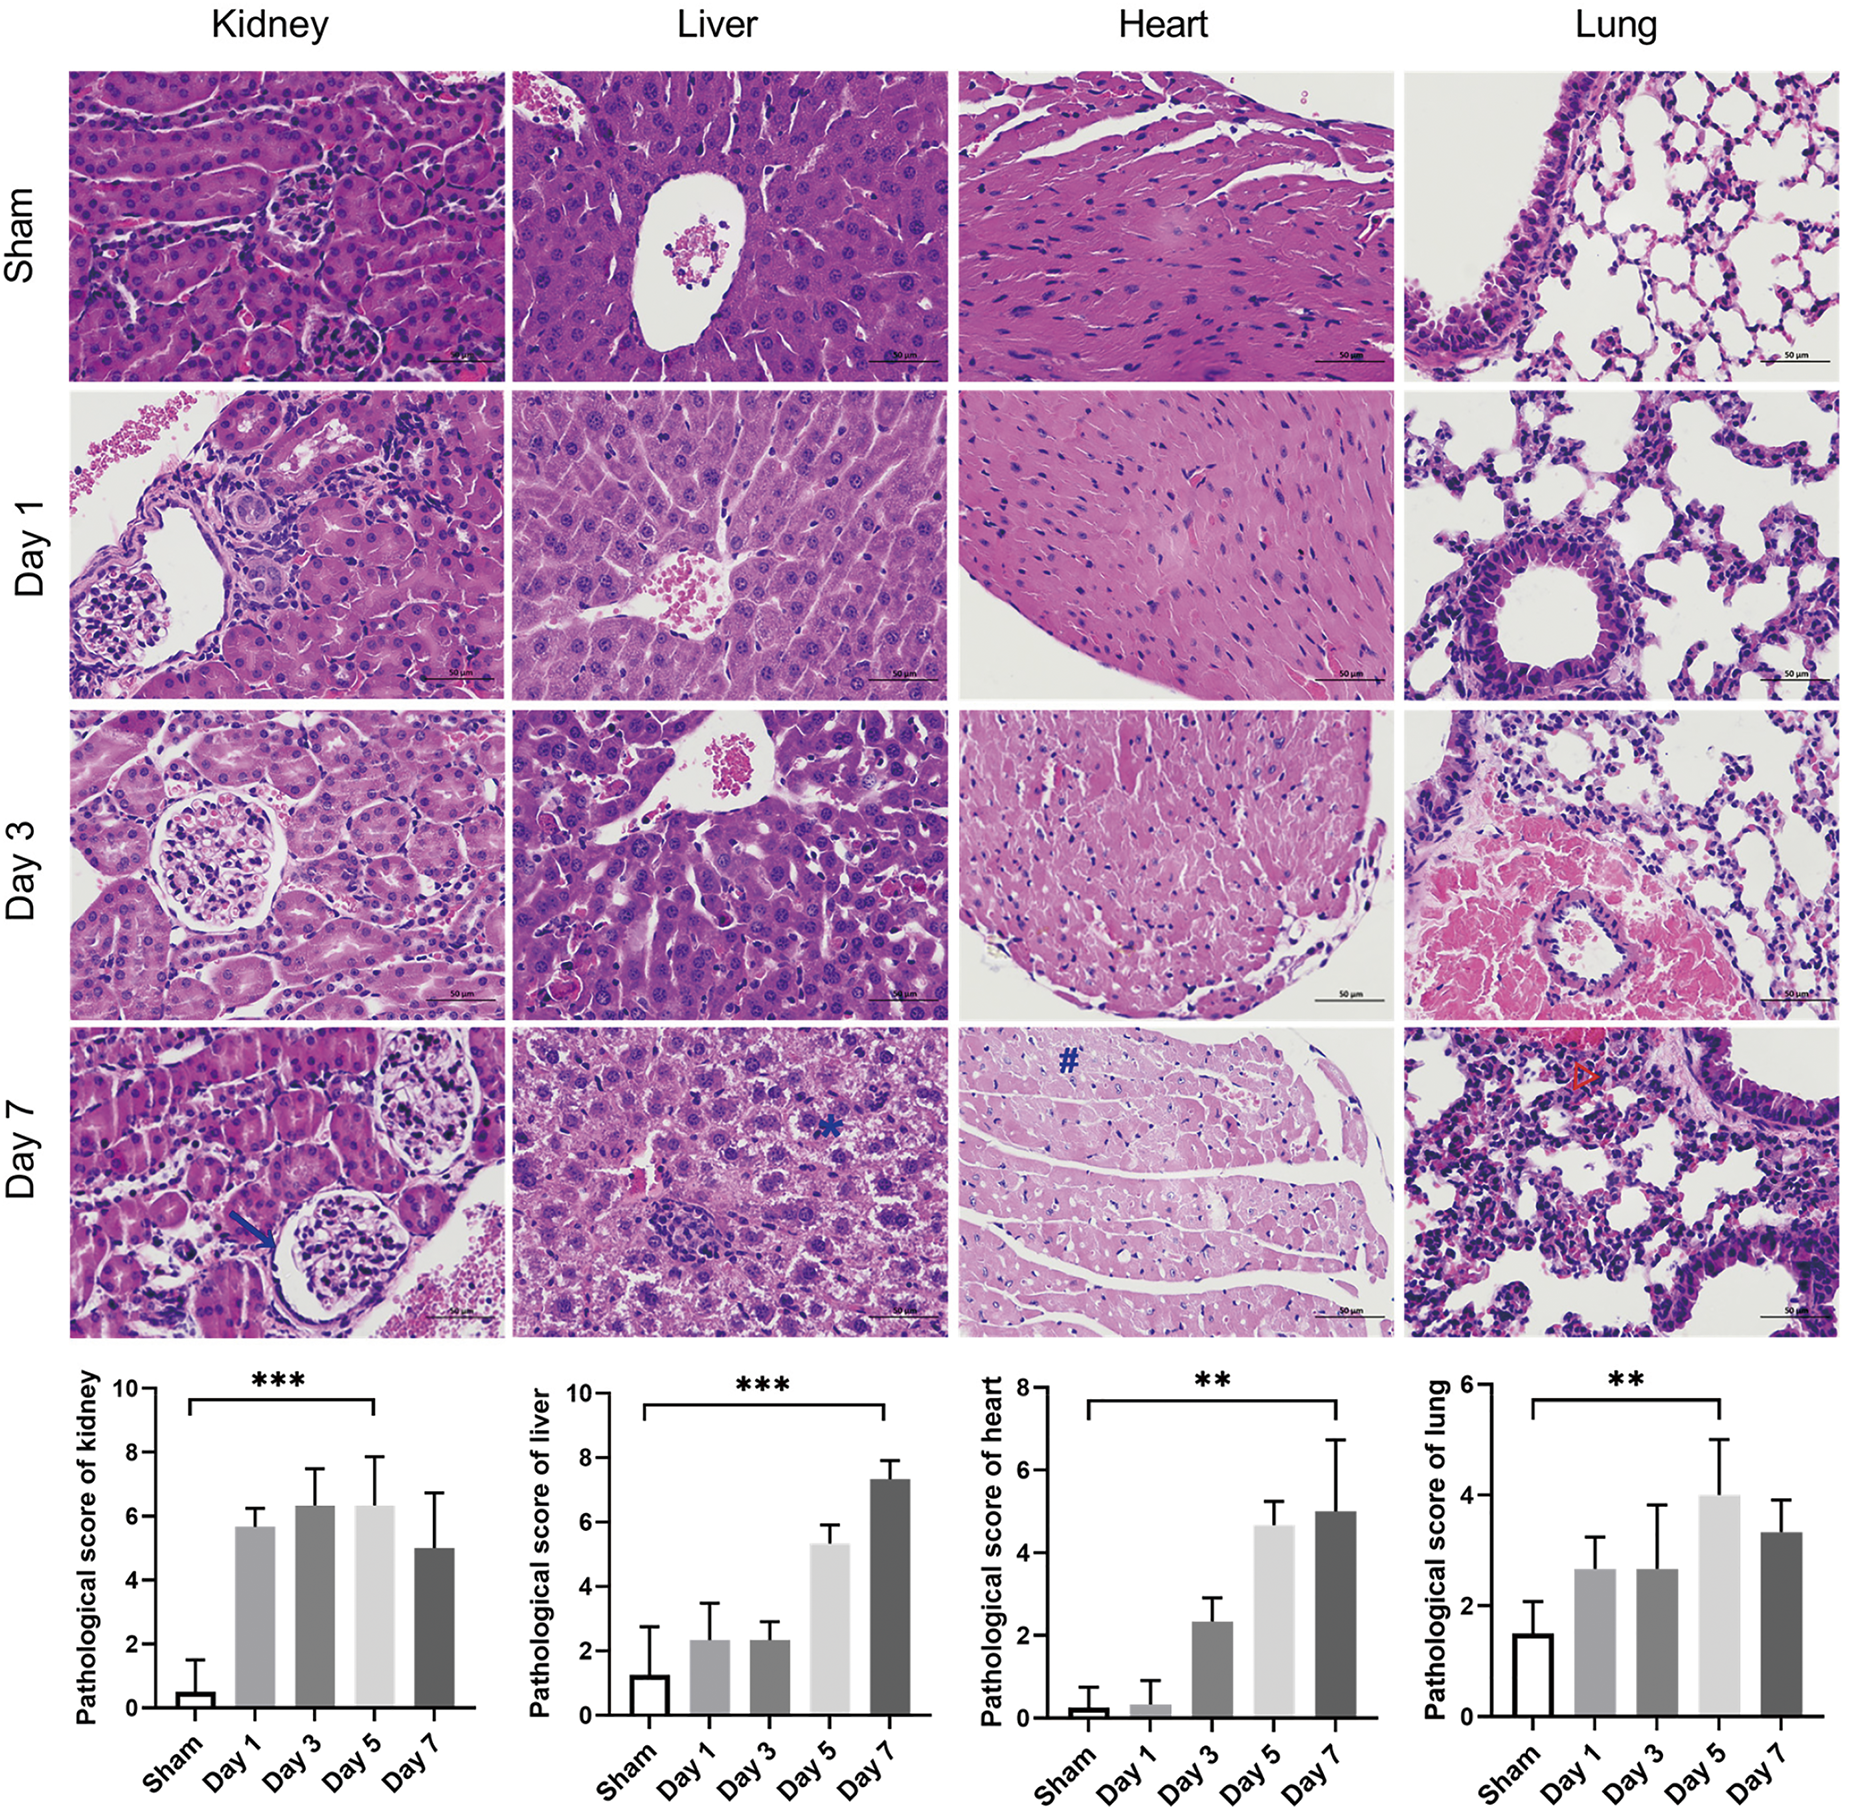
Figure 4: Evaluation of the histopathology damage in the kidney, liver, heart, and lung tissues of septic mice. Representative micrographs from each group are shown; the blue arrowhead indicates Bowman’s capsule expansion, the blue asterisk the vacuolization of hepatocyte cytoplasm, the blue octothorpe the edema and vacuolization of myocardial cells, and the red triangle the alveolar congestion and hemorrhage. Tissue damage scores represent the degree of lesion damage at each time point after CLP (n = 4 in sham mice; n = 3 on days 1–7 in septic mice). Scale bar = 50 μm. Differences between groups are significant: **p < 0.01, ***p < 0.001. CLP, cecal ligation and puncture
3.3 Splenic T-Lymphocyte Phenotypes and Numbers
Next, we employed flow cytometry to evaluate the phenotypes and proportions of splenic T lymphocytes. We identified CD3+ cells as T lymphocytes and then used CD8 to differentiate CD4+ and CD8+ T-lymphocyte subpopulations (Fig. 1).
As illustrated in Fig. 5A, in the early stage, CLP increased the proportion of CD69+ cells and the mean fluorescence intensity (MFI) of the transferrin receptor CD71 considerably, suggesting that CLP induced the activation of T lymphocytes. Subsequently, these indicators gradually decreased in the later stage. CD4+ and CD8+ cell subpopulations exhibited a temporal behavior similar to the overall T lymphocytes. Moreover, the changes in CD8+ cell activation were more pronounced than those in CD4+ cell activation, whereas cellular metabolism levels were higher in CD4+ cells than in CD8+ cells on post-CLP day 3 (Fig. 5B).
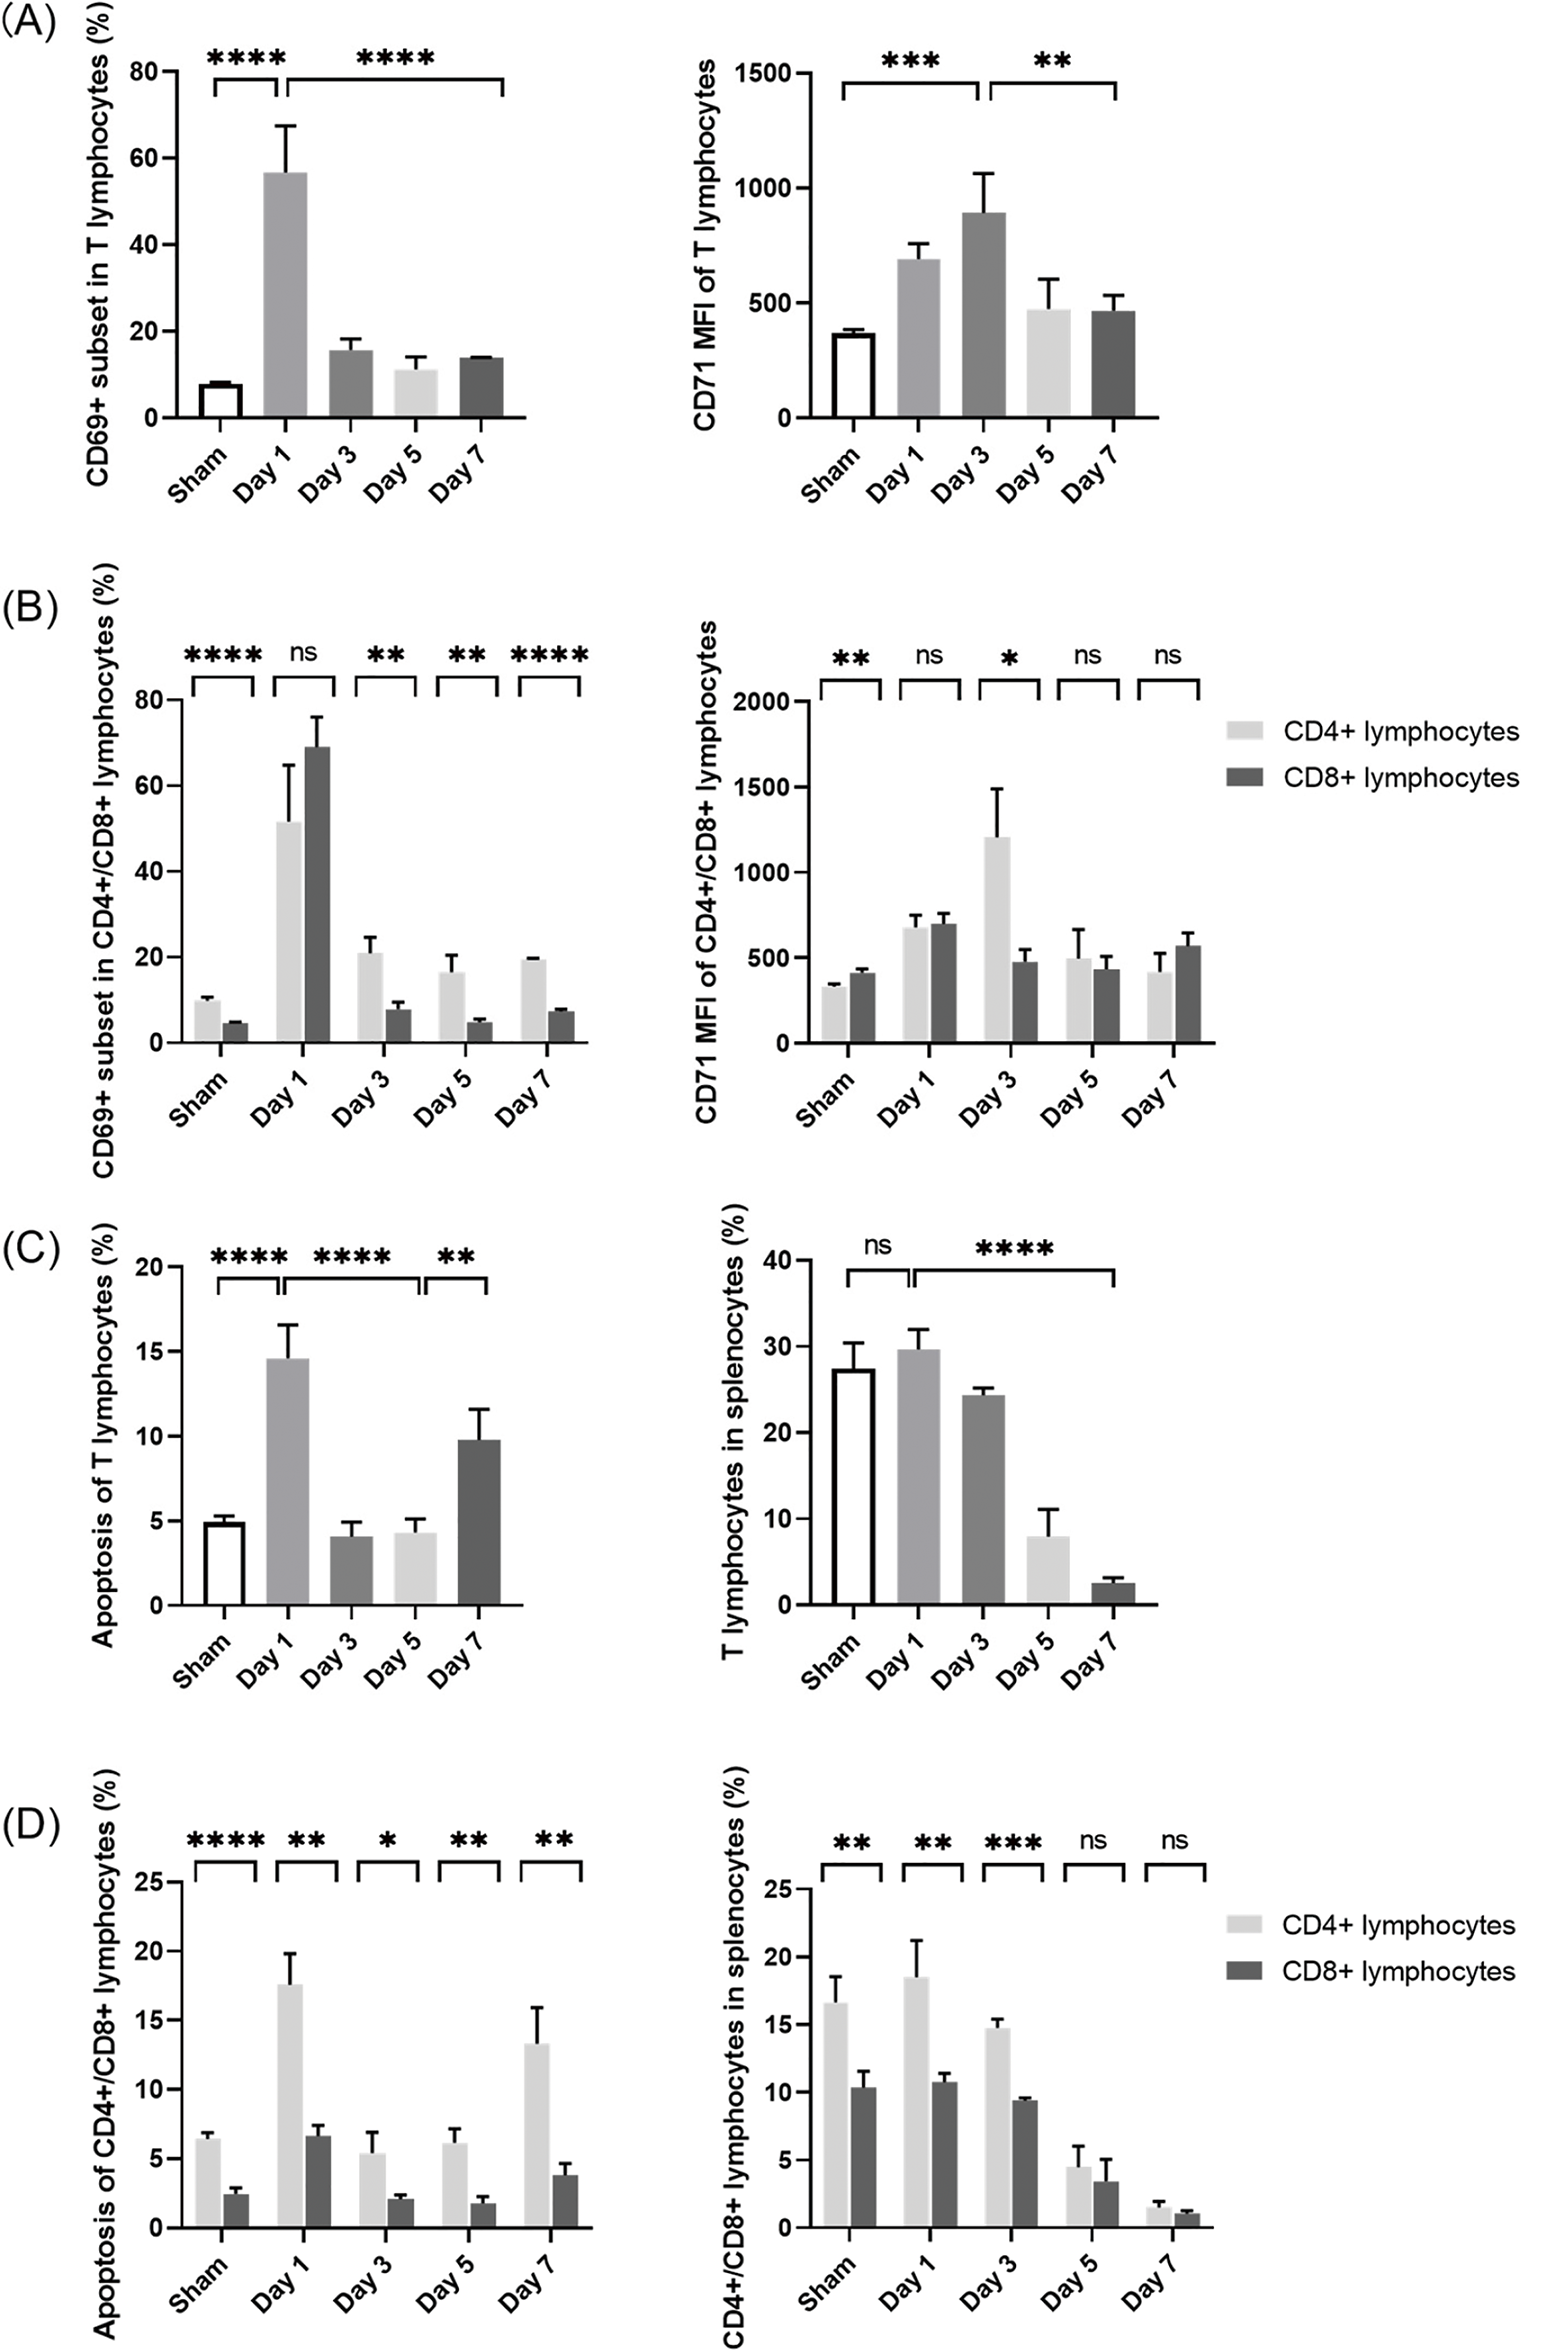
Figure 5: Changes in splenic T-lymphocyte phenotypes and numbers in septic mice. (A, B) Proportions of CD69+ cells and MFI of CD71 in T lymphocytes in the spleen. (C) Proportions of apoptotic T lymphocytes and proportions of T lymphocytes in the spleen. (D) Proportions of apoptotic T-lymphocyte subpopulations and CD4+/CD8+ ratio changes. (n = 4 in sham-operated group; n = 3 on days 1–7 in septic group). Differences between groups are significant: *p < 0.05, **p < 0.01, ***p < 0.001, ****p < 0.0001. MFI, mean fluorescence intensity; ns, not significant
In immune responses, the activation and apoptosis of T lymphocytes are tightly regulated processes [20,21]. Sustained activation induces activation-induced cell death (AICD), thereby balancing effector function with immune homeostasis [22]. Moreover, stimulation via the T-cell receptor can activate apoptotic pathways [23]. In the current study, while CLP led to splenic T-lymphocyte activation (Fig. 5A), it significantly increased the proportion of apoptotic cells on post-CLP day 1 (Fig. 5C). Subsequently, apoptosis was downregulated in parallel to the significant decrease in T-lymphocyte activation on post-CLP days 3–5 (Fig. 5A). Finally, apoptosis increased again on post-CLP day 7, indicating a shift toward immunosuppression. These findings highlight the dynamic regulation of T-lymphocyte activation and apoptosis in response to sepsis induced by CLP, underscoring the complex interplay between these processes in modulating immune responses.
In T lymphocytes, apoptosis was accompanied by a gradual decrease in the proportion of splenic T lymphocytes to less than one-tenth of that in the sham-operated mice on post-CLP day 7 (Fig. 5C). Combined with the continual increases in serum inflammatory cytokine levels and sustained organ damage until the late stage after CLP (Figs. 3B and 4), a state of persistent inflammation and immunosuppression was supposed to be induced in the septic mice. In addition, over the 7-day period, the apoptosis proportions of CD4+ cells remained higher than those of CD8+ cells, resulting in an imbalance of the CD4+/CD8+ ratio (Fig. 5D)—another indicator of an acquired immune disorder associated with sepsis [16].
Supplementary Figs. S1 and S2 present all representative dot-plot data for the aforementioned analyses.
3.4 KLF3 Expression in T Lymphocytes of the Spleen
Flow cytometry was used to assess KLF3 expression in splenic T lymphocytes. Fig. 6A exhibits the histogram of isotype control in flow cytometry. As shown in Fig. 6B,C, in the sham group, the proportion of KLF3+ subset in T lymphocytes was 92.73 ± 1.27%. Concomitant with a considerable increase in systemic inflammatory response and T-lymphocyte activation on post-CLP day 1, the proportion of KLF3+ subset decreased to 78.03 ± 3.29%. When the CLP mice entered the persistent inflammation and immunosuppression stage, as illustrated in Figs. 3–5, the proportion of KLF3+ subset gradually increased to 96.27 ± 1.61% on post-CLP day 5. The relative decrease in KLF3 expression observed on post-CLP day 7 may be attributed to the excessive decrease in T lymphocyte count, however, the trend of increasing KLF3 expression on post-CLP days 3–5 was significant. Finally, while CD4+ and CD8+ lymphocytes exhibited differential expression of CD69 and CD71 (Fig. 5B), no significant differences in KLF3 expression levels were observed between these two subpopulations (Fig. 6D).
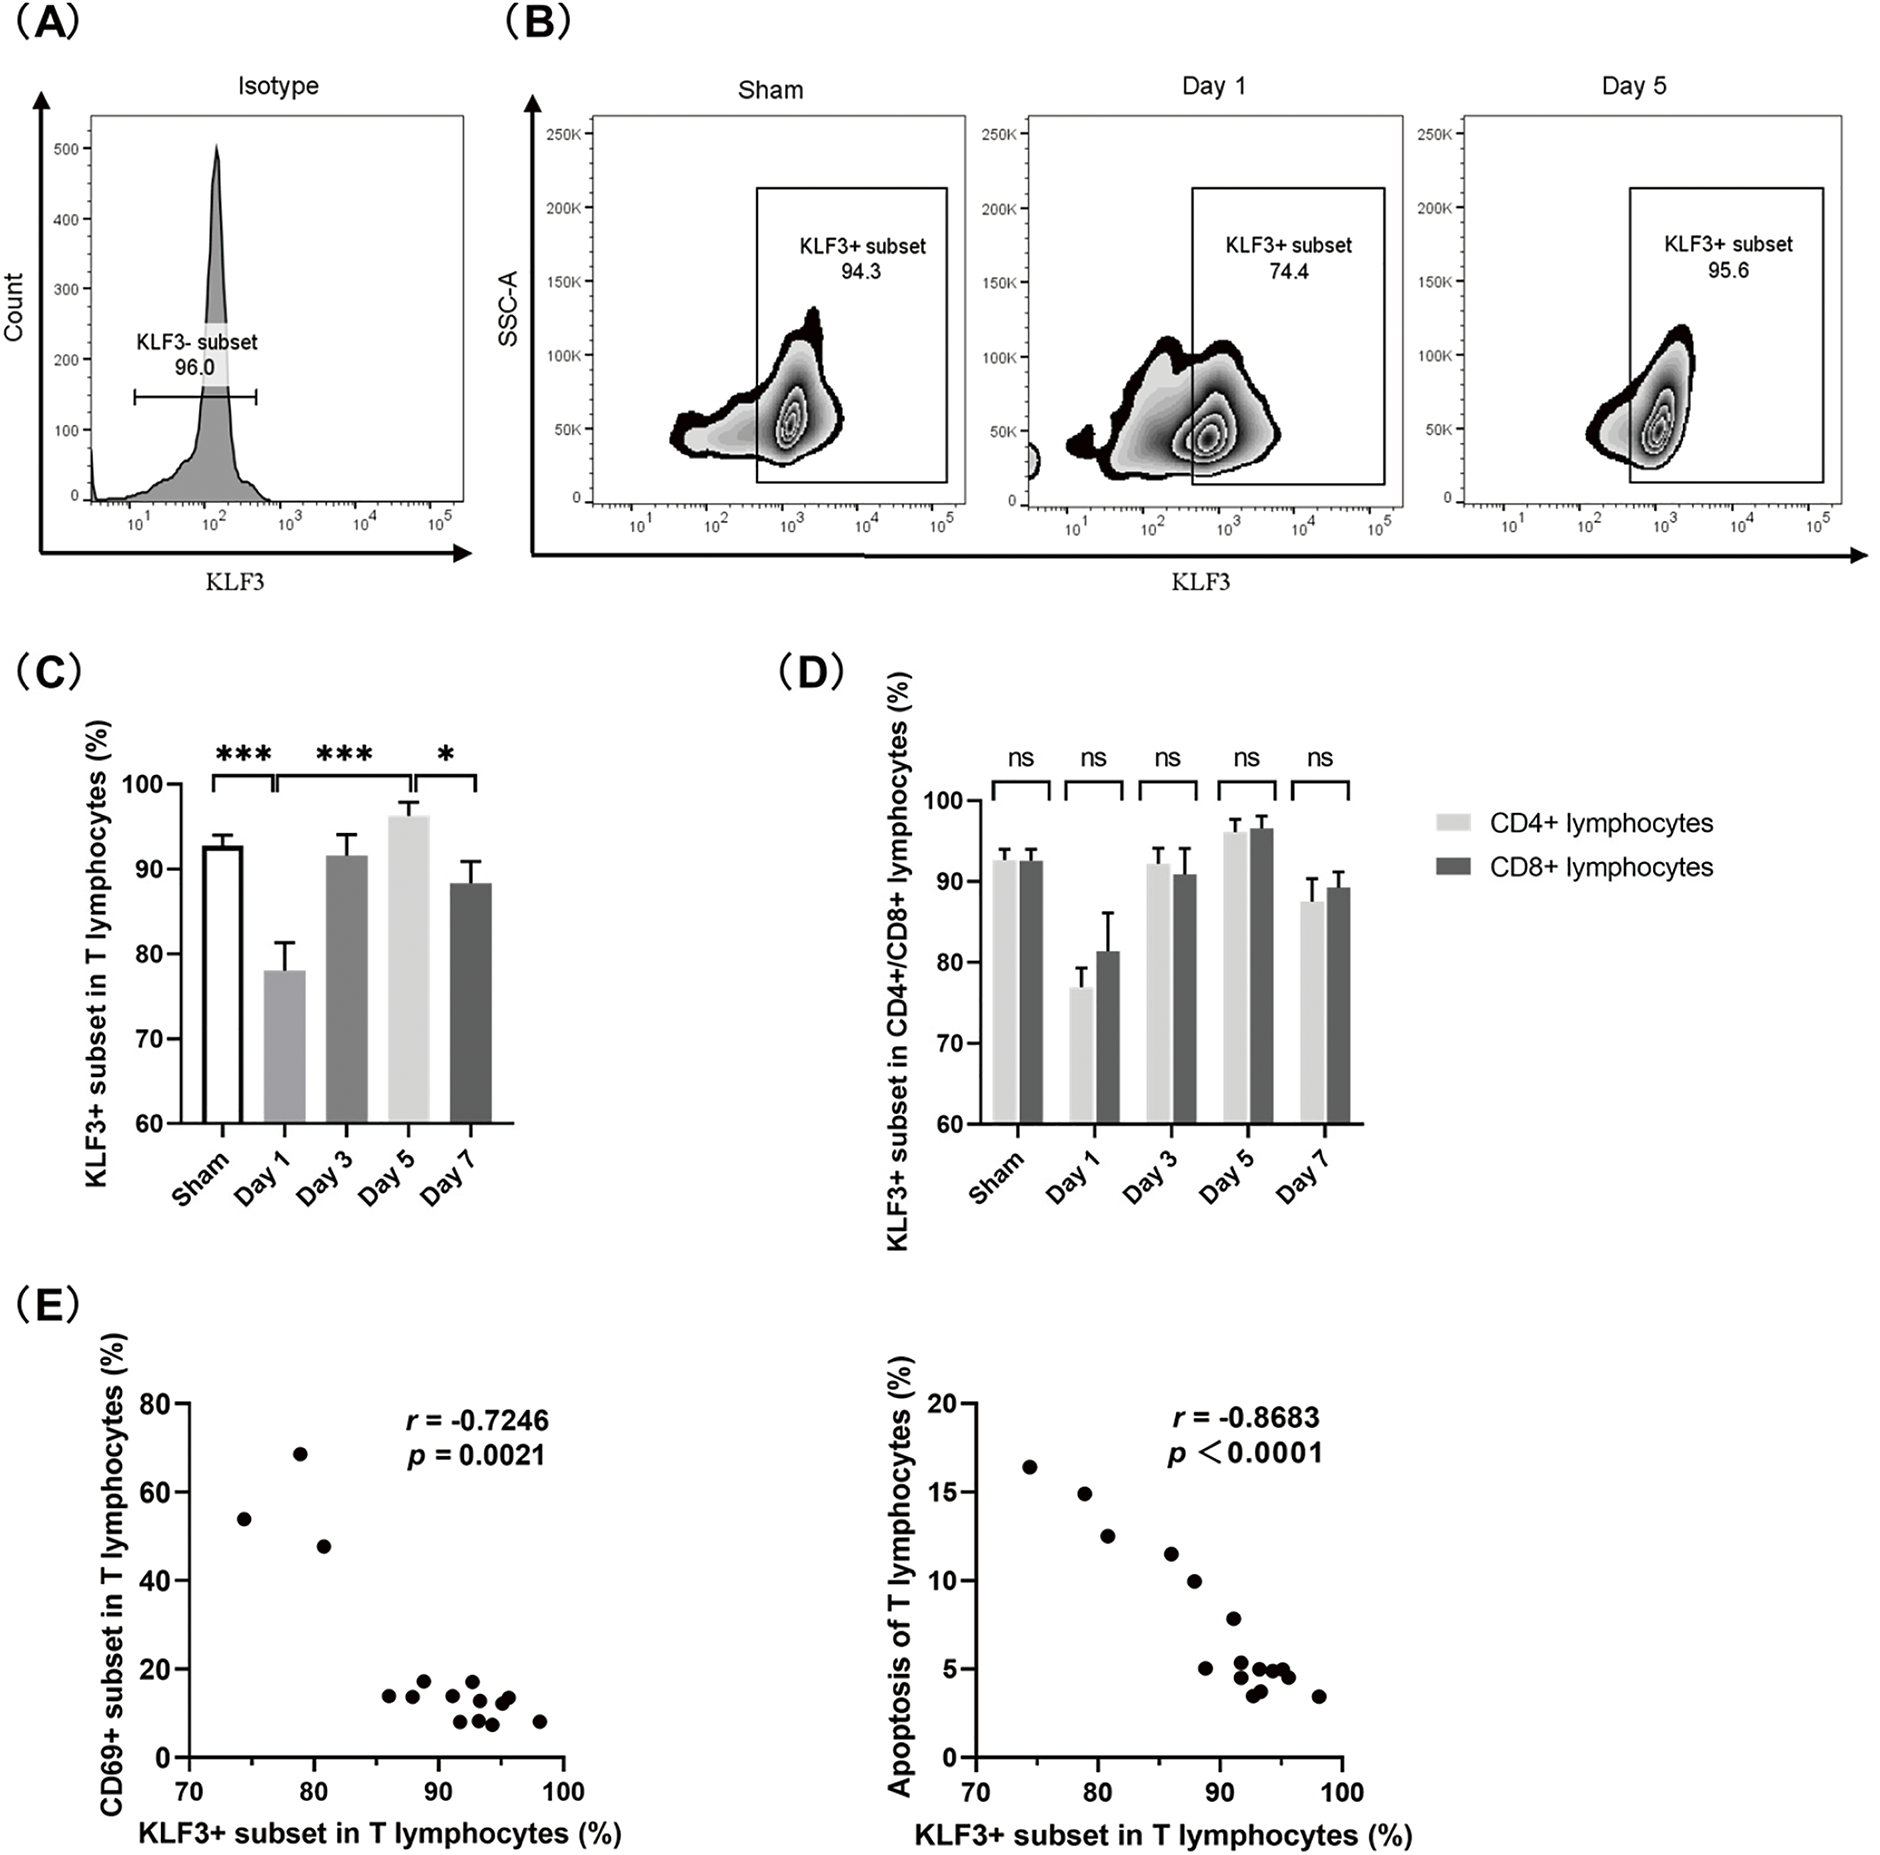
Figure 6: KLF3 in splenic T lymphocytes in septic mice. (A) Histogram of isotype control in flow cytometry. (B) Representative zebra plot of KLF3 expression in T lymphocytes. (C) Proportions of KLF3+ subset in T lymphocytes. (D) Proportions of KLF3+ subsets in CD4+ and CD8+ cells. (E) Correlation analyses showing the relationship between the proportion of KLF3+ subset and the proportion of CD69+ subset (left), as well as between the proportion of KLF3+ subset and the proportion of apoptotic T lymphocytes (right). (n = 4 in sham mice; n = 3 on days 1–7 in septic mice) Differences between groups are significant: *p < 0.05, ***p < 0.001. KLF3, Krüppel-like factor 3; ns, not significant
Notably, as detailed in Fig. 6E, an inverse correlation was observed in the proportions between the KLF3+ and CD69+ subsets of T lymphocytes (r = −0.7246, p = 0.0021) during the dynamic immune alterations. Moreover, KLF3 expression was negatively correlated with the proportion of apoptosis (r = −0.8683, p < 0.0001). Thus, KLF3 might be a suppressor of early T-lymphocyte hyperactivation and a prosurvival regulator in lymphocyte homeostasis.
In this study, a CLP-induced sepsis mouse model was established, and the immune status of sepsis from the perspectives of both inflammatory responses and cellular immunity was investigated. To the best of our knowledge, this is the first study investigating sepsis-related KLF3 expression in splenic T lymphocytes.
The inability to eliminate pathogens in the early stages of infection could result in an immune regulation imbalance. Excessive release of proinflammatory and anti-inflammatory molecules may lead to organ failure, tissue damage, and immunodeficiency [16]. CLP is currently considered the gold standard for sepsis induction [17]. In CLP, cecum perforation results in bacterial peritonitis, followed by translocation of mixed enteric bacteria into the blood compartment, and triggers systemic activation of the inflammatory response and multiorgan dysfunction [17]. In the current study, the mice demonstrated signs of sepsis in the early stage after CLP, which was accompanied by an abrupt release of proinflammatory and anti-inflammatory factors in massive amounts. In addition to the systemic inflammatory response, the mice also demonstrated multiple organ damage. Because the kidneys are more susceptible to changes in pressure and perfusion than other organs [24], kidney damage occurred in the early stage after CLP and persisted thereafter; in contrast, liver, heart, and lung damage gradually intensified as sepsis progressed after CLP.
In our septic mice, changes in KLF3 expression and those in overall cytokine levels demonstrated inversely related trends. Similar results were noted in studies using lipopolysaccharide (LPS)-treated bone marrow-derived macrophages and Klf3−/− mice [10]. The Klf3−/− mice demonstrated a heightened, prolonged inflammatory response to LPS treatment; KLF3, in turn, was found to directly repress expression of the NF-κB family member RelA/p65, which plays a key role in driving the inflammatory response under physiological and pathophysiological conditions [10]. Notably, in a study on the programming of marginal zone B-lymphocyte fates, KLF3 was suggested to act as a downstream target of NF-κB signaling [4]. In another study, KLF3 was also a specific target isolated in microarray screening of NF-κB target genes in pre-B lymphocytes [25]. Taken together, these results revealed that KLF3 is possibly a fundamental suppressor of inflammation, which cooperates with NF-κB signaling.
When sepsis occurs, the functions and numbers of immune cells demonstrate dynamic alterations. In a persistent state of sepsis, irreversible immunosuppression occurs systemically. During sepsis development, increases in apoptosis and inhibitory immune checkpoint molecule expression lead to significant reductions in T-lymphocyte numbers, which is particularly noteworthy because it occurs during life-threatening infection when clonal expansion of lymphocytes should be occurring [26]. Despite the administration of broad-spectrum antibiotics and implementation of aggressive source control measures, invading pathogens cannot be eradicated in many patients with sepsis, making them more susceptible to nosocomial organisms [27]. In this study, an immunosuppressive state was induced in CLP mice, characterized by a severe depletion of T lymphocytes and an imbalance in the CD4+/CD8+ ratio. Moreover, the mice demonstrated downregulation of cellular activation and cytokine secretion. Similar results were reported by a clinical study of rapid postmortem. LPS-stimulated splenocytes demonstrated severely suppressed cytokine production in patients who died of sepsis than in patients without sepsis. The patient’s spleens displayed upregulation of selected inhibitory receptors with concomitant downregulation of activation pathways [28]. This is possibly a state of T-lymphocyte exhaustion occurring with chronic antigenic stimulation [20,26]. KLF3 was previously believed to be a regulator of lymphocyte quiescence [7,29]. Both T-lymphocyte exhaustion and quiescence indicate decreased T-lymphocyte activation; however, quiescence is distinct from anergy in that quiescent cells are responsive to activating stimuli [29]. Notably, in the current study, KLF3 expression increased gradually during the immunosuppression phase, and it was negatively correlated with T-lymphocyte apoptosis; thus, KLF3 may mitigate sepsis-induced T-lymphocyte exhaustion primarily through anti-apoptotic mechanisms. As such, the potential role of KLF3 in the regulation of T-lymphocyte function appears to vary depending on the pathophysiological context. Further research on the roles of KLF3 and underlying mechanisms is warranted. Nevertheless, alterations in KLF3 expression may provide information for dynamic immune status monitoring in sepsis, thereby guiding individualized immunomodulatory therapy.
Although the overall trend of Klf3 mRNA in splenocytes (Fig. 3C) and KLF3+ subset in splenic T lymphocytes (Figs. 6B,C) was consistent, there were differences in the results on post-CLP days 3–7. The discrepancy may have arisen from post-transcriptional and translational regulation [30,31]. It may have also been associated with alterations in splenic cellular composition during sepsis [32,33]. In the current study, the progressive decrease in T-lymphocyte proportion within the spleens may have resulted in discordance between total splenic KLF3 and T-lymphocyte-specific KLF3 levels. As such, future studies should focus on KLF3 expression in splenocyte subpopulations.
This study has several limitations. First, we primarily characterized KLF3 expression during the progression of sepsis in mice; however, the roles of KLF3 in sepsis pathogenesis and development, as well as the underlying mechanisms, were not clarified, warranting further investigation. Second, we did not monitor KLF3 expression in peripheral blood; additional studies detecting analogous KLF3 dynamics in circulation may aid in comprehensively evaluating the immune status of sepsis. Finally, because of the constraints of the current experimental design, time-course data of the sham-operated group were not collected beyond the baseline, which resulted in a lack of sufficient covariates to perform a complete multivariate analysis.
The current results provided unique insights into the immune status during sepsis and the potential roles of KLF3 in sepsis development. Detecting KLF3 expression changes may provide clues for dynamic monitoring of the immune status in sepsis.
Acknowledgement: Not applicable.
Funding Statement: This work was supported by grants from the National Key Specialty Construction Project of China [grant number 2023-141] and the National High Level Hospital Clinical Research Funding (Scientific Research Feed Fund of Peking University First Hospital) [grant number 2022SF23].
Author Contributions: The authors confirm contribution to the paper as follows: Conception and design: Miao Yan, Dongxuan Chi, Shuangling Li; Administrative support: Shuangling Li; Provision of study materials or patients: Miao Yan, Shuangling Li; Collection and assembly of data: Miao Yan, Dongxuan Chi, Wen Wang, Pei Pei; Data analysis and interpretation: Miao Yan, Min Xie, Shuangling Li; Manuscript writing: Miao Yan, Dongxuan Chi, Wen Wang, Pei Pei, Min Xie, Shuangling Li. All authors reviewed the results and approved the final version of the manuscript.
Availability of Data and Materials: The data that support the findings of this study are available from the corresponding author upon reasonable request.
Ethics Approval: All the animal experiments and procedures were approved by the Laboratory Animal Ethics Committee of Peking University First Hospital (approval number: J2022041, 20 May 2022).
Conflicts of Interest: The authors declare no conflicts of interest to report regarding the present study.
Supplementary Materials: The supplementary material is available online at https://www.techscience.com/doi/10.32604/biocell.2025.063622/s1.
Abbreviations
| KLF3 | Krüppel-Like Factor 3 |
| KLF | Krüppel-Like Factor |
| NF-κB | Nuclear Factor-kappa B |
| CLP | Cecal Ligation and Puncture |
| ELISA | Enzyme-Linked Immunosorbent Assay |
| IL-6 | Interleukin-6 |
| IL-10 | Interleukin-10 |
| H&E | Hematoxylin and Eosin |
| qRT-PCR | Quantitative Reverse Transcription Polymerase Chain Reaction |
| mRNA | Messenger RNA |
| GAPDH | Glyceraldehyde-3-phosphate dehydrogenase |
| mAbs | Monoclonal antibodies |
| IL-1β | Interleukin-1β |
| IFN-γ | Interferon-γ |
| TNF-α | Tumor Necrosis Factor-α |
| MFI | Mean Fluorescence Intensity |
| LPS | Lipopolysaccharide |
| ns | Not significant |
| AICD | Activation-Induced Cell Death |
References
1. Dang DT, Pevsner J, Yang VW. The biology of the mammalian Krüppel-like family of transcription factors. Int J Biochem Cell Biol. 2000;32(11–12):1103–21. doi:10.1016/s1357-2725(00)00059-5. [Google Scholar] [PubMed] [CrossRef]
2. Yuce K, Ozkan AI. The kruppel-like factor (KLF) family, diseases, and physiological events. Gene. 2024;895:148027. doi:10.1016/j.gene.2023.148027. [Google Scholar] [PubMed] [CrossRef]
3. Han JH, Jang KW, Myung CS. Garcinia cambogia attenuates adipogenesis by affecting CEBPB and SQSTM1/p62-mediated selective autophagic degradation of KLF3 through RPS6KA1 and STAT3 suppression. Autophagy. 2022;18(3):518–39. doi:10.1080/15548627.2021.1936356. [Google Scholar] [PubMed] [CrossRef]
4. Turchinovich G, Vu TT, Frommer F, Kranich J, Schmid S, Alles M, et al. Programming of marginal zone B-cell fate by basic Kruppel-like factor (BKLF/KLF3). Blood. 2011;117(14):3780–92. doi:10.1182/blood-2010-09-308742. [Google Scholar] [PubMed] [CrossRef]
5. Funnell APW, Mak KS, Twine NA, Pelka GJ, Norton LJ, Radziewic T, et al. Generation of mice deficient in both KLF3/BKLF and KLF8 reveals a genetic interaction and a role for these factors in embryonic globin gene silencing. Mol Cell Biol. 2013;33(15):2976–87. doi:10.1128/MCB.00074-13. [Google Scholar] [PubMed] [CrossRef]
6. Zhang D, Ran J, Li J, Yu C, Cui Z, Amevor FK, et al. miR-21-5p regulates the proliferation and differentiation of skeletal muscle satellite cells by targeting KLF3 in chicken. Genes. 2021;12(6):814. doi:10.3390/genes12060814. [Google Scholar] [PubMed] [CrossRef]
7. Shu L, Yin W, Zhuang H, Hua Z. Comparison of gene expression profiles in mouse primary T cells under normal and prolonged activation. Blood Cells Mol Dis. 2006;37(1):64–75. doi:10.1016/j.bcmd.2006.04.002. [Google Scholar] [PubMed] [CrossRef]
8. Yan M, Liu H, Xu J, Cen X, Wang Q, Xu W, et al. Expression of human Krüppel-like factor 3 in peripheral blood as a promising biomarker for acute leukemia. Cancer Med. 2020;9(8):2803–11. doi:10.1002/cam4.2911. [Google Scholar] [PubMed] [CrossRef]
9. Knights AJ, Yik JJ, Mat Jusoh H, Norton LJ, Funnell APW, Pearson RCM, et al. Krüppel-like factor 3 (KLF3/BKLF) is required for widespread repression of the inflammatory modulator galectin-3 (Lgals3). J Biol Chem. 2016;291(31):16048–58. doi:10.1074/jbc.M116.715748. [Google Scholar] [PubMed] [CrossRef]
10. Knights AJ, Yang L, Shah M, Norton LJ, Green GS, Stout ES, et al. Krüppel-like factor 3 (KLF3) suppresses NF-κB-driven inflammation in mice. J Biol Chem. 2020;295(18):6080–91. doi:10.1074/jbc.RA120.013114. [Google Scholar] [PubMed] [CrossRef]
11. Singer M, Deutschman CS, Seymour CW, Shankar-Hari M, Annane D, Bauer M, et al. The third international consensus definitions for sepsis and septic shock (sepsis-3). JAMA. 2016;315(8):801–10. doi:10.1001/jama.2016.0287. [Google Scholar] [PubMed] [CrossRef]
12. Pei F, Yao RQ, Ren C, Bahrami S, Billiar TR, Chaudry IH, et al. Expert consensus on the monitoring and treatment of sepsis-induced immunosuppression. Mil Med Res. 2022;9(1):74. doi:10.1186/s40779-022-00430-y. [Google Scholar] [PubMed] [CrossRef]
13. Wang Z, Zhang W, Chen L, Lu X, Tu Y. Lymphopenia in sepsis: a narrative review. Crit Care. 2024;28(1):315. doi:10.1186/s13054-024-05099-4. [Google Scholar] [PubMed] [CrossRef]
14. Finfer S, Venkatesh B, Hotchkiss RS, Sasson SC. Lymphopenia in sepsis-an acquired immunodeficiency? Immunol Cell Biol. 2023;101(6):535–44. doi:10.1111/imcb.12611. [Google Scholar] [PubMed] [CrossRef]
15. Meyer NJ, Prescott HC. Sepsis and septic shock. N Engl J Med. 2024;391(22):2133–46. doi:10.1056/NEJMra2403213. [Google Scholar] [PubMed] [CrossRef]
16. Liu D, Huang SY, Sun JH, Zhang HC, Cai QL, Gao C, et al. Sepsis-induced immunosuppression: mechanisms, diagnosis and current treatment options. Mil Med Res. 2022;9(1):56. doi:10.1186/s40779-022-00422-y. [Google Scholar] [PubMed] [CrossRef]
17. Rittirsch D, Huber-Lang MS, Flierl MA, Ward PA. Immunodesign of experimental sepsis by cecal ligation and puncture. Nat Protoc. 2009;4(1):31–6. doi:10.1038/nprot.2008.214. [Google Scholar] [PubMed] [CrossRef]
18. Chi D, Chen Y, Xiang C, Yao W, Wang H, Zheng X, et al. Human amnion epithelial cells and their derived exosomes alleviate sepsis-associated acute kidney injury via mitigating endothelial dysfunction. Front Med. 2022;9:829606. doi:10.3389/fmed.2022.829606. [Google Scholar] [PubMed] [CrossRef]
19. Doi K, Leelahavanichkul A, Yuen PST, Star RA. Animal models of sepsis and sepsis-induced kidney injury. J Clin Investig. 2009;119(10):2868–78. doi:10.1172/JCI39421. [Google Scholar] [PubMed] [CrossRef]
20. Baessler A, Vignali DAA. T cell exhaustion. Annu Rev Immunol. 2024;42(1):179–206. doi:10.1146/annurev-immunol-090222-110914. [Google Scholar] [PubMed] [CrossRef]
21. Wiersinga WJ, van der Poll T. Immunopathophysiology of human sepsis. eBioMedicine. 2022;86:104363. doi:10.1016/j.ebiom.2022.104363. [Google Scholar] [PubMed] [CrossRef]
22. Janelle V, Delisle JS. T-cell dysfunction as a limitation of adoptive immunotherapy: current concepts and mitigation strategies. Cancers. 2021;13(4):598. doi:10.3390/cancers13040598. [Google Scholar] [PubMed] [CrossRef]
23. Arakaki R, Yamada A, Kudo Y, Hayashi Y, Ishimaru N. Mechanism of activation-induced cell death of T cells and regulation of FasL expression. Crit Rev Immunol. 2014;34(4):301–14. doi:10.1615/critrevimmunol.2014009988. [Google Scholar] [PubMed] [CrossRef]
24. Liu L, Chao Y, Wang X, Chinese Critical Ultrasound Study Group. Shock resuscitation-the necessity and priority of renal blood perfusion assessment. Aging Dis. 2022;13(4):1056–62. doi:10.14336/AD.2022.0105. [Google Scholar] [PubMed] [CrossRef]
25. Li J, Peet GW, Balzarano D, Li X, Massa P, Barton RW, et al. Novel NEMO/IkappaB kinase and NF-kappa B target genes at the pre-B to immature B cell transition. J Biol Chem. 2001;276(21):18579–90. doi:10.1074/jbc.M100846200. [Google Scholar] [PubMed] [CrossRef]
26. Hotchkiss RS, Monneret G, Payen D. Immunosuppression in sepsis: a novel understanding of the disorder and a new therapeutic approach. Lancet Infect Dis. 2013;13(3):260–8. doi:10.1016/S1473-3099(13)70001-X. [Google Scholar] [PubMed] [CrossRef]
27. Evans L, Rhodes A, Alhazzani W, Antonelli M, Coopersmith CM, French C, et al. Surviving sepsis campaign: international guidelines for management of sepsis and septic shock. Intensive Care Med. 2021;47(11):1181–247. doi:10.1007/s00134-021-06506-y. [Google Scholar] [PubMed] [CrossRef]
28. Boomer JS, To K, Chang KC, Takasu O, Osborne DF, Walton AH, et al. Immunosuppression in patients who die of sepsis and multiple organ failure. JAMA. 2011;306(23):2594–605. doi:10.1001/jama.2011.1829. [Google Scholar] [PubMed] [CrossRef]
29. Yusuf I, Fruman DA. Regulation of quiescence in lymphocytes. Trends Immunol. 2003;24(7):380–6. doi:10.1016/S1471-4906(03)00141-8. [Google Scholar] [PubMed] [CrossRef]
30. Oudart M, Avila-Gutierrez K, Moch C, Dossi E, Milior G, Boulay AC, et al. The ribosome-associated protein RACK1 represses Kir4.1 translation in astrocytes and influences neuronal activity. Cell Rep. 2023;42(5):112456. doi:10.1016/j.celrep.2023.112456. [Google Scholar] [PubMed] [CrossRef]
31. Ehinger Y, Zhang Z, Phamluong K, Soneja D, Shokat KM, Ron D. Brain-specific inhibition of mTORC1 eliminates side effects resulting from mTORC1 blockade in the periphery and reduces alcohol intake in mice. Nat Commun. 2021;12(1):4407. doi:10.1038/s41467-021-24567-x. [Google Scholar] [PubMed] [CrossRef]
32. Hensel JA, Khattar V, Ashton R, Ponnazhagan S. Characterization of immune cell subtypes in three commonly used mouse strains reveals gender and strain-specific variations. Lab Invest. 2019;99(1):93–106. doi:10.1038/s41374-018-0137-1. [Google Scholar] [PubMed] [CrossRef]
33. Kashimura M. Blood defense system-Proposal for a new concept of an immune system against blood borne pathogens comprising the liver, spleen and bone marrow. Scand J Immunol. 2024;99(5):e13363. doi:10.1111/sji.13363. [Google Scholar] [PubMed] [CrossRef]
Cite This Article
 Copyright © 2025 The Author(s). Published by Tech Science Press.
This work is licensed under a Creative Commons Attribution 4.0 International License , which permits unrestricted use, distribution, and reproduction in any medium, provided the original work is properly cited.
 Downloads
 Citation Tools