
 Submit a Paper
 Propose a Special lssue
 Open Access
ARTICLE
ScRNA-seq and Experimental Analyses Unveil Lrg1 Regulating the Oxidative Phosphorylation Pathway to Affect Neutrophil Accumulation after Cerebral Ischemia-Reperfusion
1 Neurology Department, The First Affiliated Hospital, Jiangxi Medical College, Nanchang University, Nanchang, 330006, China
2 Department of Pharmacy, The First Affiliated Hospital, Jiangxi Medical College, Nanchang University, Nanchang, 330006, China
3 School of Pharmacy, Jiangxi Medical College, Nanchang University, Nanchang, 330019, China
4 College of Pharmacy, Hubei University of Chinese Medicine, Wuhan, 430065, China
5 Key Laboratory of Rare Neurological Diseases of Jiangxi Provincial Health Commission, The First Affiliated Hospital, Jiangxi Medical College, Nanchang University, Nanchang, 330006, China
6 Jiangxi Key Laboratory of Neurological Diseases, The First Affiliated Hospital, Jiangxi Medical College, Nanchang University, Nanchang, 330006, China
* Corresponding Authors: Jin Chen. Email: ; Yanni LV. Email:
# These authors contributed equally to this work
BIOCELL 2025, 49(9), 1749-1769. https://doi.org/10.32604/biocell.2025.068507
Received 30 May 2025; Accepted 13 August 2025; Issue published 25 September 2025
 View Full Text
 Download PDF
Abstract
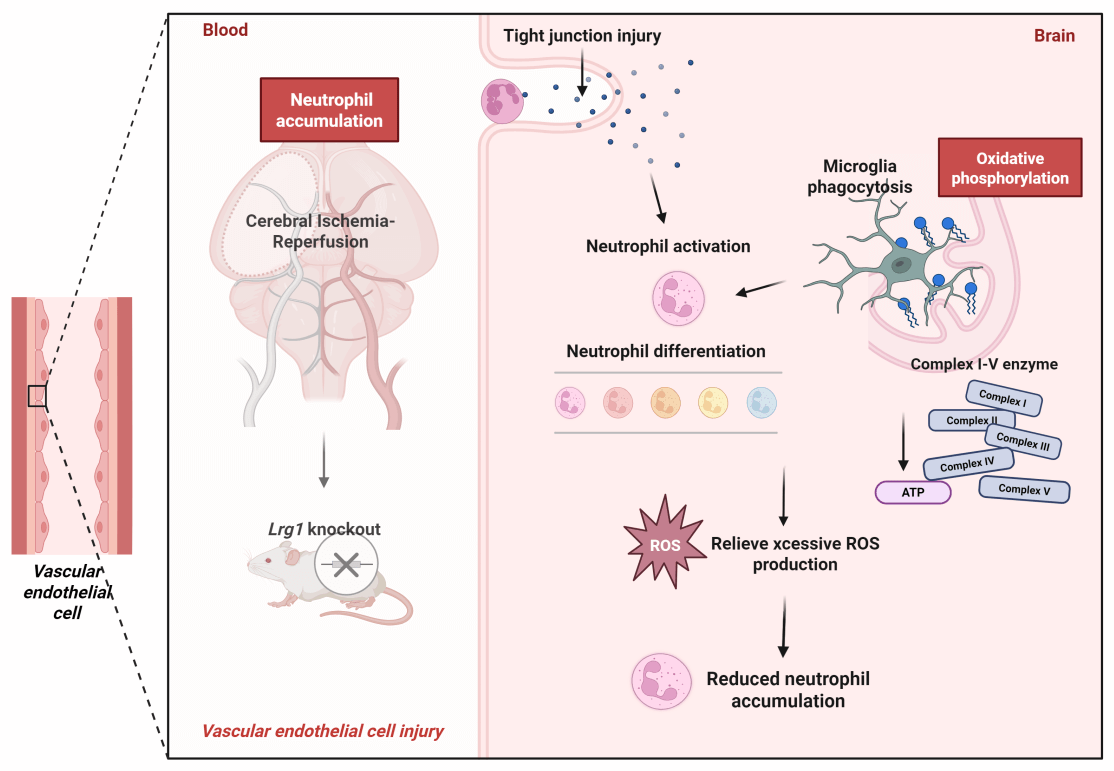
Background: After ischemic stroke, neutrophils hyperactivate, increasing in number and worsening inflammation, causing neural damage. Prior scRNA-seq showed Lrg1 modulates cells subsentence to cerebral ischemia-reperfusion injury, but its mechanism in regulating neutrophil accumulation/differentiation post-injury is unclear. Methods: Lrg1 knockout impact on neutrophil accumulation was assessed via immunofluorescence and western blot. Three-dimensional reconstruction of immunofluorescent staining analyzed cell-cell interactions among neutrophils and microglia. scRNA-seq of WT and Lrg1-/- mice from GSE245386 and GSE279462 was conducted. Each group conducted oxidative phosphorylation scoring via Gene Set Enrichment Analysis (GSEA), while Metascape was employed to perform GO and KEGG enrichment analyses for elucidating functional mechanisms. CellChat exhibited cell-cell communication. Furthermore, alterations in microglial phagocytic activity were evaluated by immunostaining for CD68, a well-established marker of phagolysosomal activity in phagocytic cells. Brain energy metabolism was evaluated via glutamate dehydrogenase activity and ATP levels with ELISA, and enzyme expression was analyzed by immunofluorescence and western blot. Results: Lrg1 knockout decreased neutrophil accumulation and NET formation in mice. 3D immunofluorescence reconstruction confirmed neutrophil co-localization with endothelial cells/microglia. scRNA-seq revealed that the oxidative phosphorylation score was significantly higher in the MCAO/R+WT group compared to both the Sham-operated+WT and Lrg1-/- groups. Notably, the oxidative phosphorylation score was further elevated in the MCAO/R+Lrg1-/- group. Immunostaining showed that Lrg1 knockout elevated CD68+ lysosome expression post-MCAO/R, with TMEM119 colocalizing with these lysosomes. MCAO/R raised CD68 expression in ischemic brains, an effect further intensified by Lrg1 knockout. KEGG analysis linked differential genes to oxidative phosphorylation pathways. Validation in MCAO/R vs. sham groups revealed increased ROS production and reduced expression of complex enzymes I-V (NDUFB8, SDHB, UQCRC1, MTCO2, ATP5A1). Lrg1 intervention increased enzyme expression. Immunofluorescence and western blot in brain tissue showed similar patterns in microglia and enzymes I-V. Conclusions: Lrg1 knockout significantly enhances microglial phagocytic activity towards neutrophils subsequent to cerebral ischemia-reperfusion injury, through its regulatory effect on the oxidative phosphorylation pathway. This finding accentuates Lrg1 as a highly potential therapeutic target for intervening in and modulating post-ischemic inflammatory responses.Graphic Abstract
Keywords
Supplementary Material
Supplementary Material FileNeutrophils are identified as the most active cellular population during the acute phase post-ischemic stroke and represent the initial immune cells infiltrating the brain parenchyma [1]. In the pro-inflammatory environment induced by ischemic stroke, these neutrophils undergo hyperactivation, leading to their rapid exponential proliferation [2]. This exacerbates the inflammatory response and leads to further neural tissue damage. Simultaneously, activated neutrophils consume significantly more oxygen, generating large quantities of oxygen free radicals that harm cells [3]. Microglia, the primary resident immune effectors of the central nervous system (CNS), exhibit rapid chemotactic migration toward sites of injury following activation, thereby initiating neuroinflammatory responses. Notably, these activated microglia actively participate in the phagocytic clearance of neutrophils within the ischemic brain tissue [2]; on the other hand, they secrete inflammatory mediators that exert a “double-edged sword” effect in modulating neuroinflammation [4]. Therefore, enhancing microglial phagocytic capacity represents a potential therapeutic strategy to mitigate inflammatory infiltration following cerebral ischemia-reperfusion injury.
Microglia require substantial energy to sustain diverse functions, with their phagocytic activity primarily relying on oxidative phosphorylation (OXPHOS) for ATP production [5]. OXPHOS-derived ATP is critical for maintaining microglial homeostasis and effector functions [6]. This metabolic pathway occurs within mitochondria and constitutes the principal route for energy generation in homeostatic microglia [7]. In Alzheimer’s disease, metabolic reprogramming of microglia modulates their phagocytic clearance of β-amyloid plaques [8]. The unbiased identification of cellular subclusters via single-cell RNA sequencing (scRNA-seq) enables a deeper understanding of their heterogeneous roles in tissue homeostasis and disease pathology. Additionally, pseudotime analysis and transcription factor analysis derived from scRNA-seq provide innovative tools for unraveling cellular differentiation. For example, researchers have employed scRNA-seq to investigate [9] and have uncovered novel cellular subclusters, elucidating the complex pathophysiological mechanisms underlying cerebral tissue injury during cerebral ischemia-reperfusion. scRNA-seq facilitates a meticulous elucidation of the molecular mechanisms underpinning cerebral ischemia-reperfusion injury and allows for a rigorous assessment of the efficacy of targeted therapeutic interventions.
Lrg1 has been identified as a potential molecule upregulated following cerebral ischemia-reperfusion [10]. A comparative analysis undertaken between Lrg1 knockout mice and their wild-type littermates, with a primary focus on assessing brain infarct volume, the temporal progression of cerebral edema, and neurological impairments induced by ischemia-reperfusion injury, demonstrated that Lrg1 deficiency bestows considerable neuroprotective benefits, thereby effectively preserving brain tissue from injury. Lrg1 has emerged as a critical mediator upregulated in response to cerebral ischemia-reperfusion. Comparative evaluation of Lrg1-/- and wild-type mice following MCAO/R (Middle Cerebral Artery Occlusion/Reperfusion) revealed that Lrg1 knockout significantly attenuated brain infarct volume, reduced edema formation, and improved neurofunctional recovery. These findings establish Lrg1 as a promising therapeutic target whose inhibition confers neuroprotective effects against ischemic brain damage. Our previous scRNA-seq studies demonstrated that Lrg1 orchestrates multiple cellular responses critical to cerebral ischemia-reperfusion injury, including groundbreaking discoveries revealing novel microglia differentiation trajectories [11]. We identified 7 microglia subclusters differentiating along two pathways [11]. Similarly, there is limited literature on single-cell studies of neutrophils. Also, in addition, the clearance mechanism of neutrophils in ischemic brain tissue remains not fully understood. Given the crucial role of neutrophils in diseases, we aim to investigate the therapeutic potential of modulating Lrg1 to clear neutrophils that accumulate after cerebral ischemia-reperfusion.
In this research, using Lrg1 knockout mice, we examined how Lrg1 modulation influences post-ischemic neutrophil clearance in a cerebral ischemia-reperfusion model. We focused particularly on microglia and their metabolic regulatory pathways, employing a variety of techniques, including single-cell RNA sequencing, three-dimensional imaging, immunofluorescence, and western blotting. We aim to characterize the molecular mechanisms underlying Lrg1’s role in the regulation of neutrophils by microglia following cerebral ischemia-reperfusion.
2.1 Data Acquisition and Processing
We conducted an analysis based on the published article database GSE245386 and GSE279462 within our own research group (The Gene Expression Omnibus (GEO) database (https://www.ncbi.nlm.nih.gov/geo/, accessed on 1 July 2025) [11]. A total of 12 samples were retrieved from GSE245386 and GSE279462, comprising 3 samples each of sham-operated wild-type mice (sham+WT), sham-operated Lrg1 knockout mice (sham+Lrg1-/-), wild-type subjected to cerebral ischemia-reperfusion mice (MCAO/R+WT), and Lrg1 knockout subjected to cerebral ischemia-reperfusion mice (MCAO/R+Lrg1-/-).
2.2 Single-Cell Sequencing Analysis
2.2.1 Cell Identification in Single-Cell Data
We employed Seurat’s pipeline (version 4.1.1, accessible at https://github.com/satijalab/seurat/, accessed on 1 July 2025) to analyze the data, ensuring quality control through dimensionality reduction and unsupervised clustering techniques [12]. To address batch effects across groups, we incorporated the BBKNN tool (version 1.5.1, available at https://github.com/immunogenomics/harmony, accessed on 1 July 2025) [13]. Subsequently, we employed universal markers that are distinctive to various cell types to identify the cells. The categorization of cell clusters was grounded in generic markers sourced from authoritative texts and scholarly articles.
2.2.2 Estimating Cellular Composition Preferences among Different Groups Using Ro/e
In this study, we utilized the Ro/e metric as a tool to evaluate the preferences in cellular composition. Ro/e estimates were obtained by evaluating the discrepancy between observed and expected values generated by the chisq.test function. An Ro/e value exceeding 1 denotes an enrichment of the specific cell cluster within a given group, whereas an Ro/e value below 1 suggests a lack of such enrichment. Enrichment profiles across cell clusters and experimental groups were visualized using heatmaps, where rows correspond to distinct cell clusters and columns represent different groups. The color gradient of each cell reflects its Ro/e value, with enrichment categories defined as: Insufficiency (Ro/e ≤ 1), Limited Enrichment (1< Ro/e ≤ 1.5), Intermediate Enrichment (1.5 < Ro/e ≤ 3), and Significant Enrichment (Ro/e > 3).
2.2.3 Inferring Cellular Differentiation Pathways
To investigate cellular differentiation trajectories, we implemented Monocle2 [14] along with other analytical approaches. The Ro/e metric was applied to quantify cellular commitment to specific subclusters. Monocle2-based trajectory inference was used to reconstruct microglial differentiation pathways (analysis performed by Wuhan Servicebio Technology Co., Ltd.). Differential gene expression analysis within Monocle2 identified transcription factors demonstrating significant trajectory-dependent variation.
2.2.4 Inference of Cellular Differentiation Trajectories
A lower CytoTRACE score indicates a less differentiated cell state, reflecting proximity to the initiation of the differentiation process, while a higher score suggests a more differentiated cell approaching the terminal stage of the differentiation trajectory. Monocle2 was employed to map the potential differentiation trajectory for microglial cells (analysis conducted by Wuhan Servicebio Technology Co., Ltd.). Monocle2 filtered differential gene analysis identified transcription factors with trajectory-specific expression dynamics.
2.2.5 Pathway Enrichment Analysis
To dissect the functional mechanisms underpinning cellular diversity across clusters, we leveraged the Metascape platform (http://metascape.org/) for integrated GO and KEGG pathway enrichment analysis. This revealed key biological processes and signaling networks associated with cluster-specific gene expression profiles. This computational strategy enabled systematic identification of biological pathways linked to specific gene expression signatures.
2.3.1 Animal and Ethical Clearance
All animals were housed in a temperature-controlled environment (25 ± 2°C) with a 12-h light/dark cycle and ad libitum access to food and water. Wild-type C57BL/6 male mice, 8–10 weeks old, weighing 18–22 g) were procured from the College of Veterinary Medicine, Yangzhou University (SCXK 2021-0003). Lrg1−/− mice, boasting a C57BL/6 genetic lineage, were generated and maintained by Cyagen Biosciences Corporation (designated strain: KOCMP-76905-Lrg1-B6N-VA) [11]. All experimental protocols underwent rigorous review and received endorsement from the Institutional Animal Care and Use Committee of the First Affiliated Hospital of Nanchang University (IACUC Approval No. CDYFY-IACUC-202306QR028). The animals were accommodated in a precisely regulated environment (maintained at 25 ± 2°C with a relative humidity of 55% ± 10%) and subjected to a 12-h light/dark cycle. All procedures followed ethical guidelines, with rigorous protocols minimizing animal distress.
2.3.2 Middle Cerebral Artery Occlusion/Reperfusion (MCAO/R) Model
The MCAO/R model was created by inserting a blunt 6-0 nylon suture into the proximal external carotid artery and advancing it 9–10 mm into the internal carotid artery. This technique initiated a 1-h occlusion period, succeeded by a 24-h reperfusion phase, to replicate the murine MCAO/R condition [11]. Anesthesia was administered to the C57BL/6 mice using 1.2% isoflurane. Subsequently, only mice demonstrating a blood flow reduction to less than 30% of pre-ischemic levels—a diminishment in middle cerebral artery blood flow verified by a laser Doppler flow meter (LDF, FLPI2, Moor, UK)—were chosen for the ensuing experimental investigations.
2.3.3 Random Allocation and Blinding in Animal Studies
Unique identifiers were randomly assigned to the animals using Excel. To ensure impartiality, the experimenters were blinded to the pre-treatment groups and were excluded from the data analysis phase.
2.3.4 Immunofluorescence Staining Protocol
Coronal brain sections, each measuring 5 μm in thickness, were meticulously prepared from the ischemic region. These tissue sections were thoroughly rinsed with PBS (pH 7.4) and then promptly fixed in ice-cold ethanol for exactly 10 min. Subsequently, they underwent a blocking and permeabilization procedure, employing a solution comprising 10% normal goat serum (Gibco, 16210064, Waltham, MA, USA), 3% bovine serum albumin (HYclone, GCC070103, Waltham, MA, USA), and 0.1% Triton X-100 dissolved in PBS, with an incubation period lasting 1 h. After this, primary antibodies, specifically targeting CD31 (Abcam, ab9498, Cambridge, England, 1:100), Ly6G (CST, 87048, Danvers, MA, USA, 1:1000), DAPI (Abcam, ab104139, Cambridge, England, 1:100), MPO (Myeloperoxidase, Abcam, EPR20257, Cambridge, England, 1:100), NE (Neutrophil Elastase, Abcam, ab131260, Cambridge, England, 1:250), H3cit (Abcam, ab219407, Cambridge, England, 1:100), were applied, and the sections were incubated at 4°C for a duration of 48 h. TMEM119 (Abcam, ab306583, Cambridge, England, 1:2000), CD68 (Abcam, ab283654, Cambridge, England, 1:50), ATP5A1 (Abcam, ab14748, Cambridge, England, 1:100), NDUFB8 (Abcam, ab192878, Cambridge, England, 1:50). Following this step, the brain tissues were incubated overnight at 4°C with an Alexa Fluor®488-conjugated donkey anti-goat IgG H&L secondary antibody (Alexa Fluor®488, Abcam, ab150129, Cambridge, England; diluted 1:1000). Subsequently, the cell nuclei were stained with 4′,6-diamidino-2-phenylindole (DAPI, Abcam, ab104139, Cambridge, England; diluted 1:500) for 15 min. Immunostained brain sections were imaged with a confocal microscope (Olympus, FV300, Tokyo, Japan).
Once the MCAO/R model had been successfully established, brain tissues were swiftly harvested for protein extraction. A 40 μg protein sample, taken from the ischemic region, underwent separation via 12.5% SDS-PAGE electrophoresis. Subsequently, the proteins were transferred onto PVDF membranes (Nanjing Jiancheng Bioengineering Institute, W016-1-1, Nanjing, China) utilizing a Tris-glycine transfer buffer (Beyotime, ST774, Shanghai, China), followed by a blocking step with 5% nonfat dry milk for 2 h at ambient room temperature. Thereafter, the membranes were incubated with primary antibodies in an ice-cold environment for a full 24 h: ATP5A1 (Abcam, ab14748, Cambridge, England, 1:1000), SDHB (Abcam, ab175225, Cambridge, England, 1:50000), UQCRC1 (Abcam, ab110252, Cambridge, England, 1:1000), MTCO2 (Abcam, ab79393, Cambridge, England, 1:5000), NDUFB8 (Abcam, ab192878, Cambridge, England, 1:1000), β-actin (Abcam, ab6276, Cambridge, England, 1:5000). Following the previous steps, β-actin was also considered as a loading control. Subsequently, the membranes were incubated with an HRP-conjugated secondary antibody (Abcam, ab205718, Cambridge, England, diluted 1:2000) for 50 min. Bands were visualized by Enhanced chemiluminescence and imaged using an imaging apparatus (cytiva, IQ500, Marlborough, MA, USA).
The t-test or Wilcoxon test is employed to discern differences between two groups of continuous variables, whereas ANOVA or the Kruskal-Wallis test is used to evaluate variations among multiple groups of continuous variables. For p-value adjustment, the Bonferroni method is implemented. All statistical analyses were carried out utilizing GraphPad Prism software (GraphPad Software, Inc., version 9.0, San Diego, CA, USA). Unless explicitly specified otherwise, statistical significance was determined based on a p-value *p < 0.05, **p < 0.01, ***p < 0.001, ****p < 0.0001.
2.4 Evaluation of Oxidative Phosphorylation Parameters
2.4.1 Measurement of ROS Levels
ROS levels in mouse brain tissue samples were quantified using a ROS assay kit (Nanjing Jiancheng Bioengineering Institute, E004-1-1, Nanjing, China) following the manufacturer’s protocol for each experimental group.
2.4.2 Assessment of Glutamate Dehydrogenase Activity
To assess the degree of mitochondrial damage, the Glutamate dehydrogenase activity detection kit from Nanjing Jiancheng Bioengineering Institute, A125-1-1, Nanjing, China, was employed.
2.4.3 Quantification of Intracellular ATP Concentration
ATP levels in microglia were quantified using the enhanced ATP assay from Nanjing Jiancheng Bioengineering Institute, A095-1-1, Nanjing, China.
The t-test or Wilcoxon test was used to identify differences between two separate groups of continuous variables, whereas ANOVA or the Kruskal-Wallis test was chosen to evaluate variations across multiple groups of continuous variables. To address the issue of multiple comparisons, the Bonferroni method was applied for p-value adjustment. All statistical analyses were performed using GraphPad Prism software (GraphPad Software, Inc., CA, USA). Unless specified otherwise, statistical significance was determined according to the following criteria: *p < 0.05, **p < 0.01, ***p < 0.001, ****p < 0.0001.
3.1 Lrg1 Knockout Modulates Neutrophil Accumulation in Cerebral Vasculature during Ischemia-Reperfusion Injury
Endothelial cells within the brain parenchyma reflect the morphological characteristics and distribution patterns of cerebral vasculature. Through three-dimensional imaging (The model was reconstructed by Wuhan Servicebio Technology Co., Ltd. and analyzed via NIS viewer 5.21) based on laser confocal microscopy, we demonstrated the co-localization of immunofluorescent expression of endothelial cells and neutrophil in mouse brain tissue. In mice subjected to ischemic stroke, there was an increased number of neutrophils accompanied by inflammatory factors in the ischemic brain region. Knockout of Lrg1 significantly decreased the neutrophil concentration in the ischemic brain and regulated the parameters linked to the generation of neutrophil extracellular traps (NETs) after MCAO/R (Fig. 1A). Furthermore, Ly6G neutrophils were extensively labeled with specific biomarkers related to NET formation (Fig. 1B,D), including myeloperoxidase (MPO) (Fig. 1C,E), neutrophil elastase (NE) (Fig. S1A,C) (S: supplementary), and citrullinated histone H3 (H3cit) (Fig. S1B,D). These findings confirm that neutrophils accumulate significantly in the ischemic brain, and the knockout of Lrg1 demonstrates its ability to decrease neutrophil accumulation and inhibit the formation of NETs in the ischemic brain tissue.
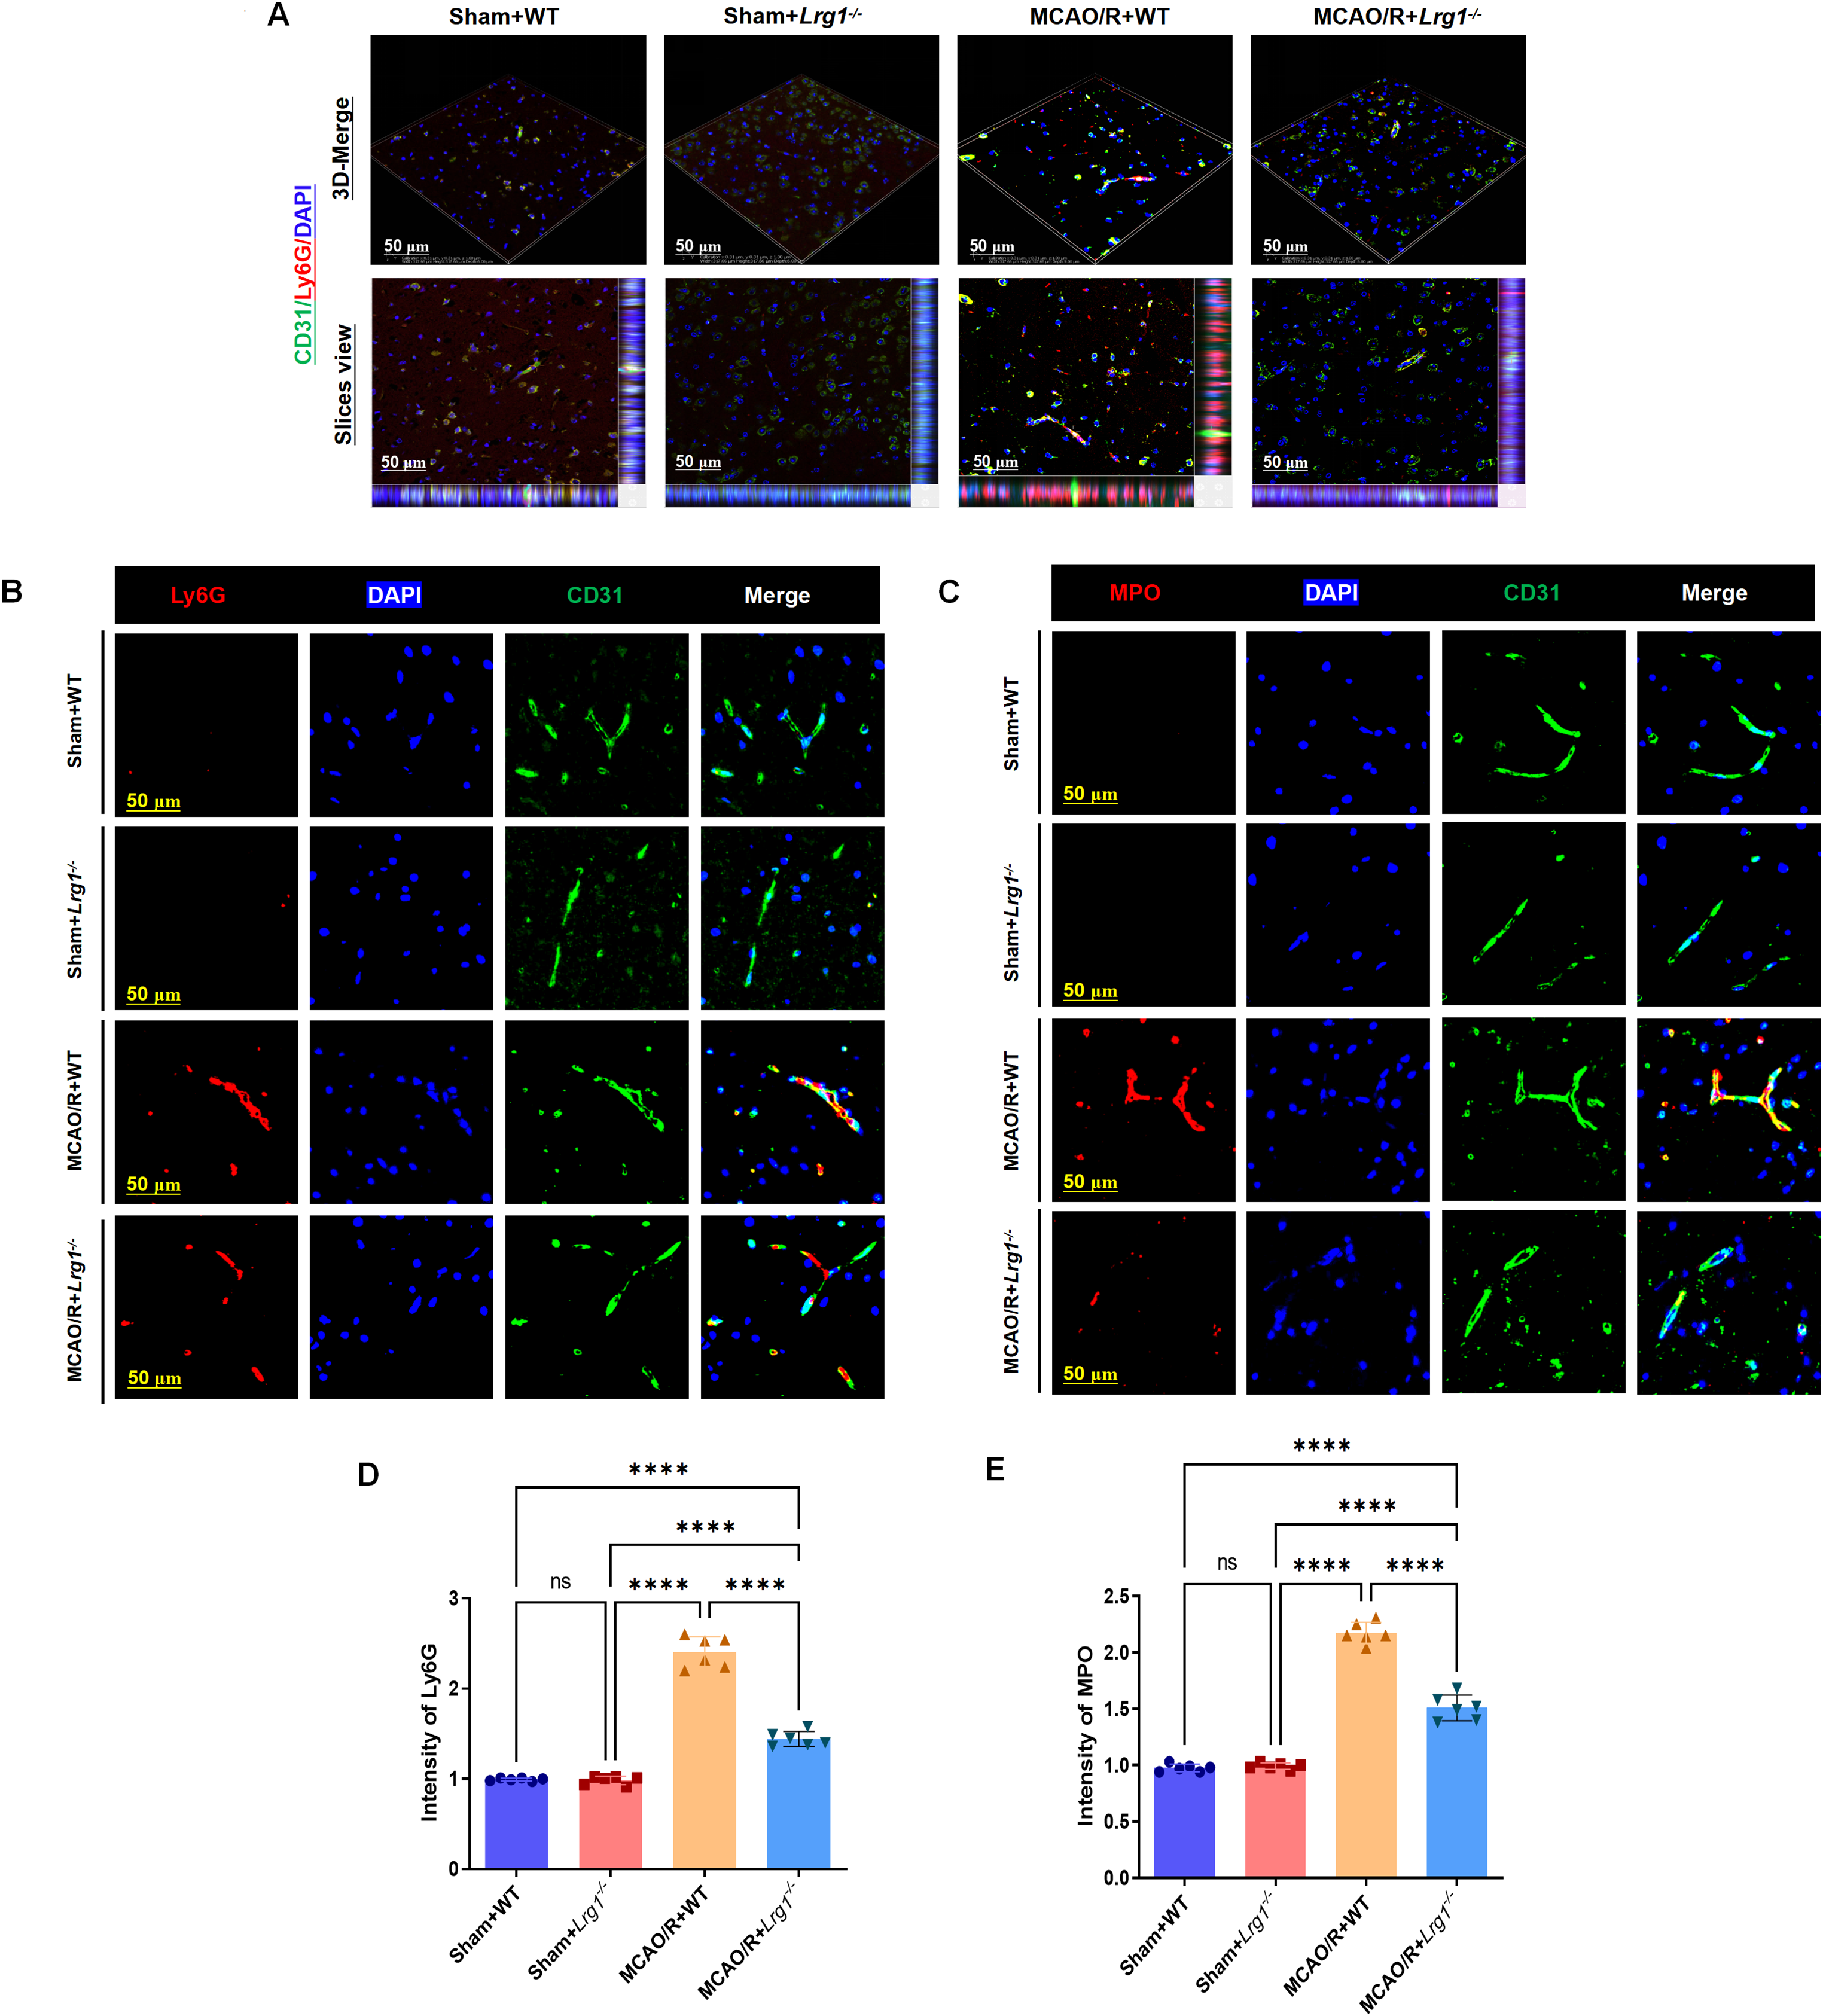
Figure 1: Lrg1 knockout modulates neutrophil accumulation in cerebral vasculature during ischemia-reperfusion injury. (A) Microscopic images and three-dimensional reconstructions show the coexistence of CD31-marked endothelial vessels and Ly6G-stained neutrophils in the ischemic region of the brain. Scale bar = 50 μm. (B) Microscopic images revealing Ly6G-stained neutrophils (red) and CD31-marked endothelial vessels (green) in brain tissues of different groups. Scale bar = 50 μm. (C) Microscopic images presenting MPO-stained neutrophils (red) and CD31-marked endothelial vessels (green) in brain tissues of various groups. Scale bar = 50 μm. (D) Error bar graph depicting Ly6G quantification. Data are presented as mean ± SD. n = 6. n.s.: no significance and ****p < 0.0001. (E) Error bar graph depicting MPO quantification. Data are presented as mean ± SD. n = 6. n.s.: no significance and ****p < 0.0001
3.2 Lrg1 Knockout Alters Neutrophil and Microglial Localization alongside Energy Metabolic Profiling in Post-Ischemic Cerebral Tissue
The accumulation of neutrophils relies on interactions with microglia to maintain balance and clearance. Utilizing three-dimensional imaging with laser confocal microscopy, we demonstrated the co-localization of immunofluorescent expressions of microglia and neutrophils in mice brain tissue. In mice undergoing ischemic stroke, a significant increase in neutrophil infiltration, coupled with elevated concentrations of inflammatory factors, was observed in the ischemic brain region. Remarkably, Lrg1 knockout significantly attenuated neutrophil accumulation in ischemic brain tissue and modulated key molecular pathways governing neutrophil extracellular trap (NET) formation following MCAO/R (Fig. 2A). Moreover, Ly6G-labeled neutrophils were extensively labeled with specific biomarkers associated with NET formation (Fig. 2B,D), including myeloperoxidase (MPO) (Fig. 2C,E), neutrophil elastase (NE) (Fig. S2A,C), and citrullinated histone H3 (H3cit) (Fig. S2B,D). We also observed changes in the morphology of microglia, with an improvement in their amoeboid form following Lrg1 knockout. Microglia were capable of enveloping or gradually phagocytosing neutrophils. Additionally, we conducted reagent kit-based assessments on the glutamate dehydrogenase activity and ATP levels for ischemic brain tissue. Glutamate dehydrogenase activity and ATP levels could reflect the level of energy metabolism in tissues. Following the establishment of the MCAO/R model, a marked reduction in ATP levels was evident, paralleled by a substantial elevation in oxygen glutamate dehydrogenase activity, as illustrated in Fig. 2F,G. Notably, these alterations were subsequently mitigated after the knockout of Lrg1.
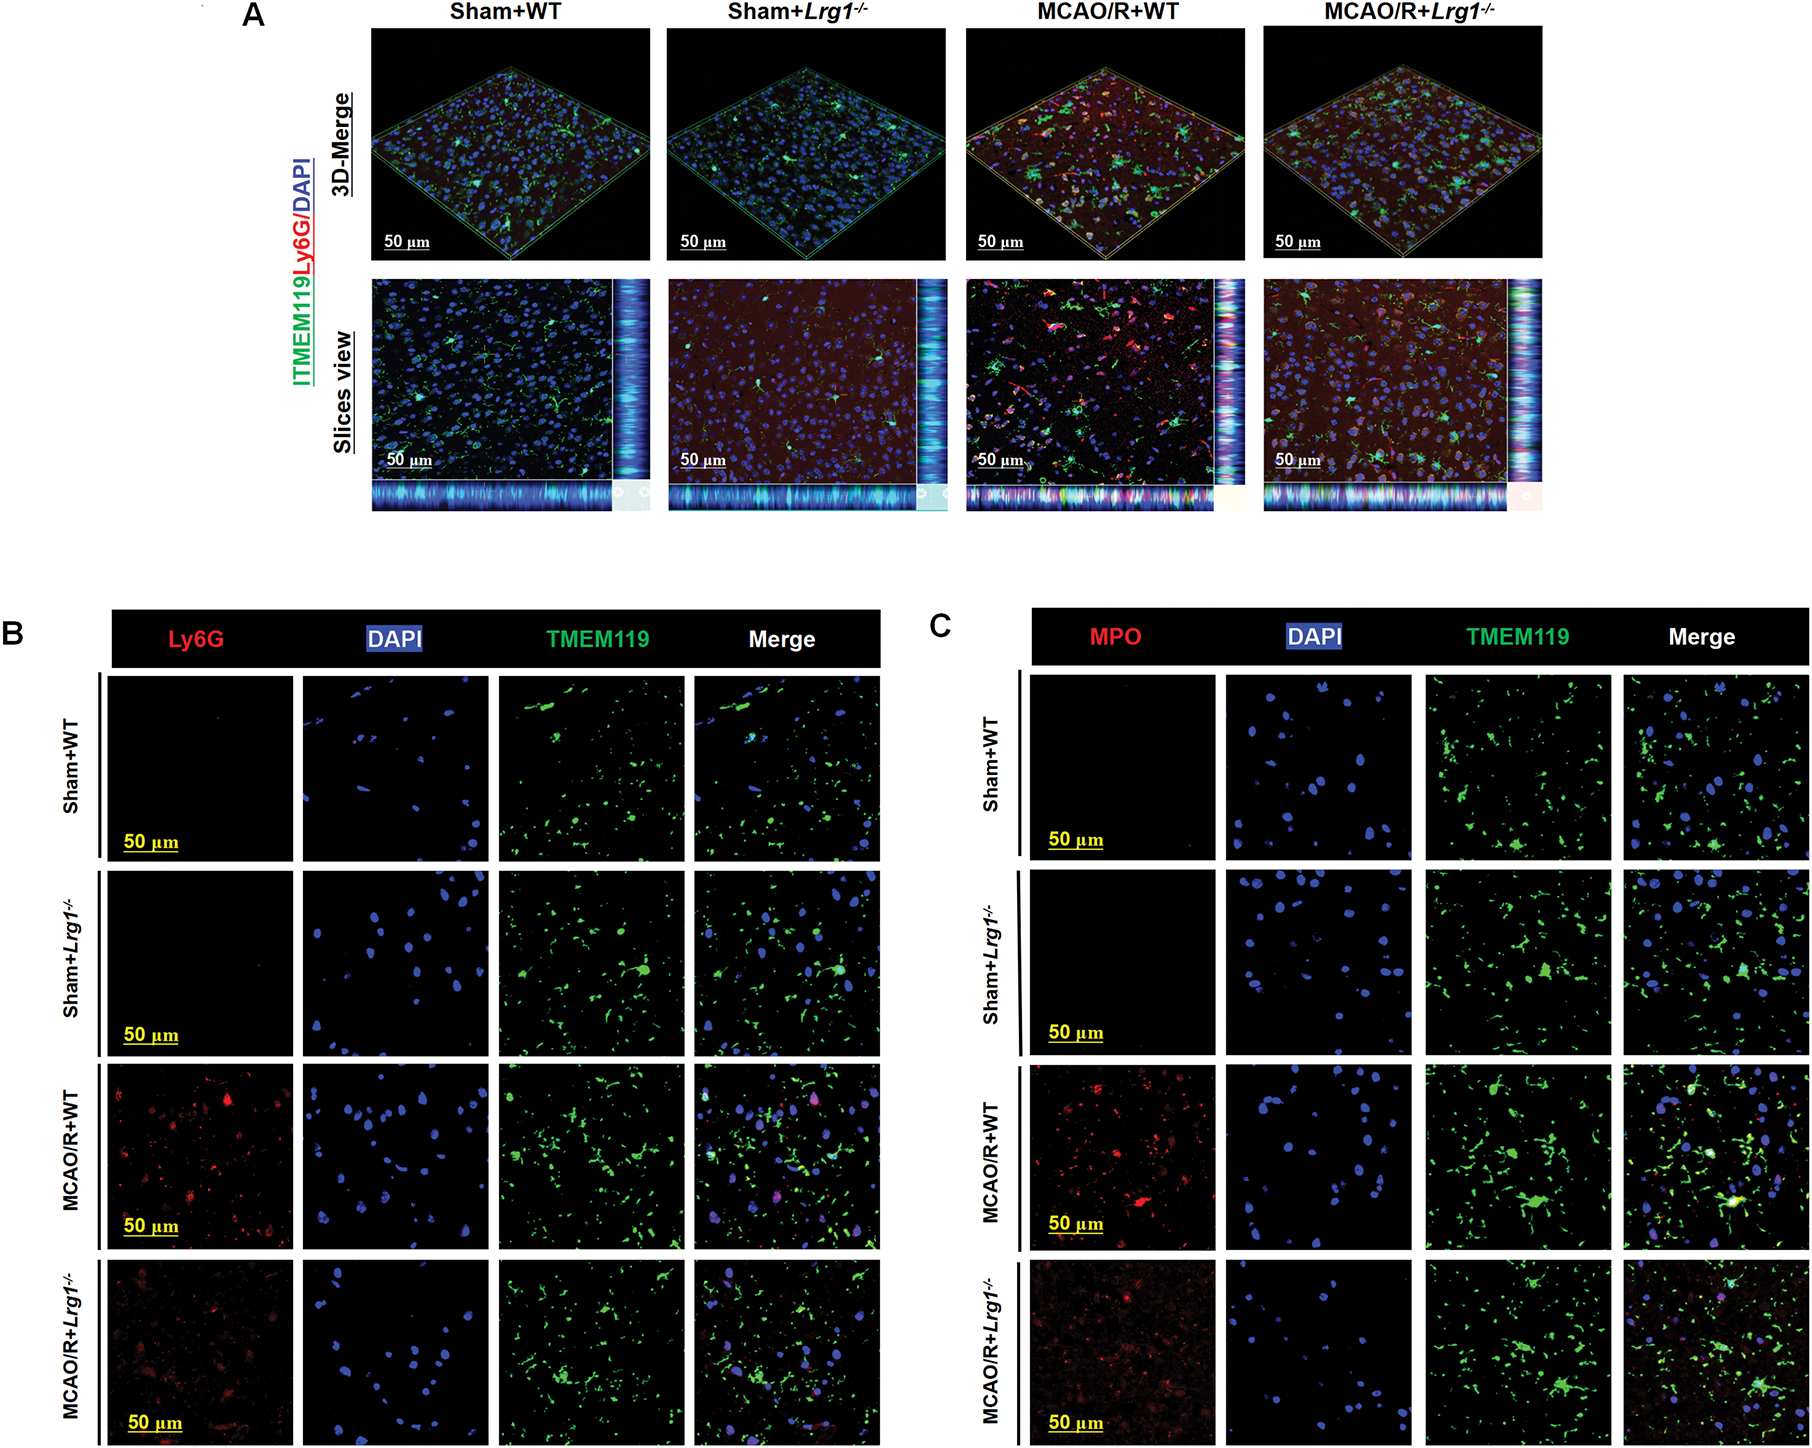
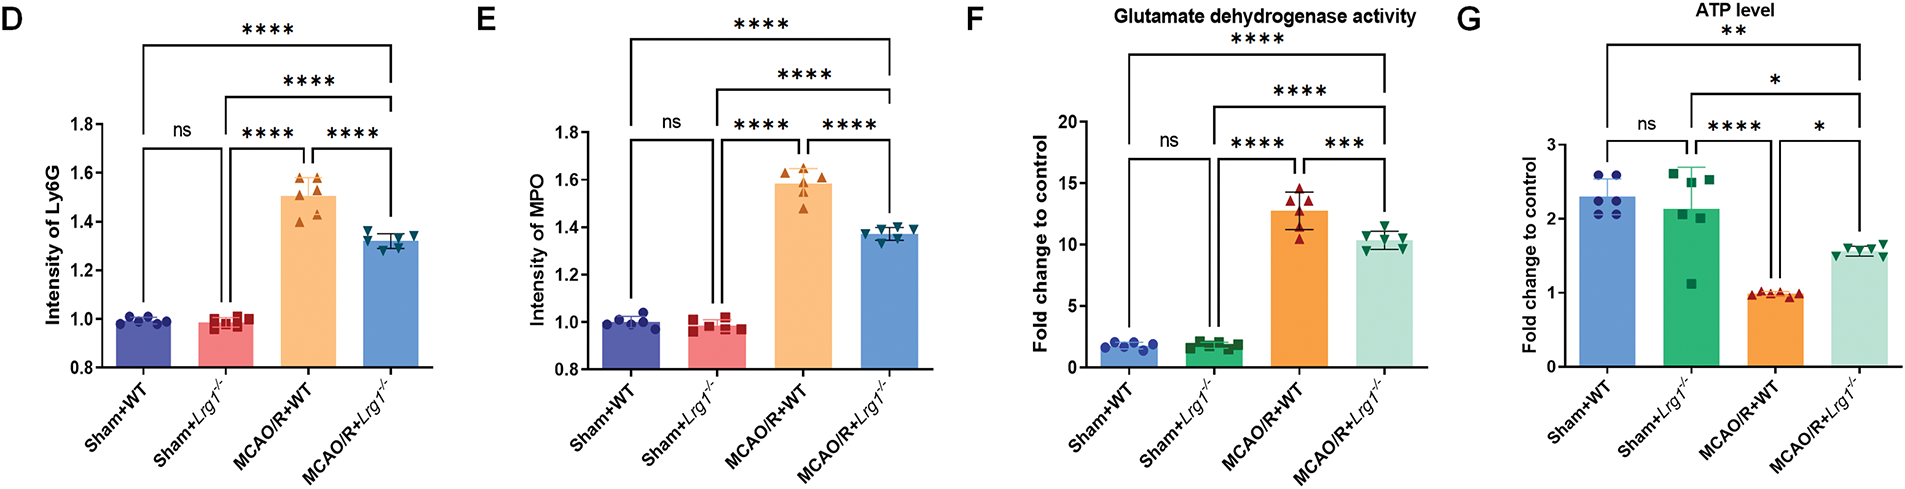
Figure 2: Lrg1 knockout alters neutrophil and microglial localization alongside energy metabolic profiling in post-ischemic cerebral tissue. (A) Microscopic images and three-dimensional reconstruction depicts TMEM119 microglia cells and Ly6G neutrophils coexisting in the ischemic brain area. Scale bar = 50 μm. (B) Microscopic images depicting Ly6G neutrophils (red) and TMEM119 microglia cells (green) in brain tissues of various groups. Scale bar = 50 μm. (C) Microscopic images displaying MPO neutrophils (red) in conjunction with TMEM119 microglia cells (green) in brain tissues from different groups. Scale bar = 50 μm. (D) Error bar graph depicting Ly6G quantification. Data are presented as mean ± SD. n = 6. n.s.: no significance and ****p < 0.0001. (E) Error bar graph depicting MPO quantification. Data are presented as mean ± SD. n = 6. n.s.: no significance and ****p < 0.0001. (F) Measure the level of glutamate dehydrogenase activity in brain tissue. The error bar graph presents the results for various groups, with the data reported as the mean ± SD (n = 6). The significance levels are denoted as n.s.: no significance, ***p < 0.001 and ****p < 0.0001. (G) Measure the ATP level in brain tissue. Error bars depict group differences (mean ± SD) (n = 6). Significance levels are denoted as n.s.: no significance, *p < 0.05, **p < 0.01 and ****p < 0.0001
3.3 Lrg1 Knockout Modulates Microglial Oxidative Phosphorylation Enrichment Scores via GSEA Following Cerebral Ischemia-Reperfusion Injury
A total of 54,271 microglial cells were obtained and subsequently clustered into 12 distinct groups based on unsupervised clustering analysis (Fig. 3A). The 12 microglial subclusters were functionally annotated using normalized enrichment scores derived from Gene Set Enrichment Analysis (GSEA), followed by targeted assessment of mitochondrial oxidative phosphorylation and glycolysis in distinct microglial populations. The 12 subclusters of microglia exhibited functional differences in oxidative phosphorylation and glycolysis. Specifically, Microglia_C2, Microglia_C5, Microglia_C7, and Microglia_C11 demonstrated higher oxidative phosphorylation scores, while Microglia_C8, Microglia_C9, and Microglia_C10 had higher glycolysis scores (Fig. 3B,C). Moreover, among the four experimental cohorts, the oxidative phosphorylation score in the MCAO/R+WT group was markedly higher than that observed in both the Sham-operated+WT and Lrg1-/- groups. Significantly, this score rose even more substantially in the MCAO/R+Lrg1-/- group, as clearly illustrated in Fig. 3D. In parallel, glycolysis levels diminished in the MCAO/R+WT group and underwent a further decrease in the MCAO/R+Lrg1-/- group (Fig. 3E). According to neutrophil differentiation trajectory based on Scenic, differentially expressed transcription factors were screened in neutrophil among different groups. Our research findings indicated that the expression levels of certain transcription factors, including Zmiz1, Foxp1, Irf8, Chd1, Hivep1, Maf, Foxo1, Mef2c, and Nfkb1, the expression of these transcription factors was heightened in both the MCAO/R+WT group and the MCAO/R+Lrg1-/- group. Notably, a more significant upregulation of these transcription factors was observed in the MCAO/R+Lrg1-/- group compared to the MCAO/R+WT group (Fig. 3F).
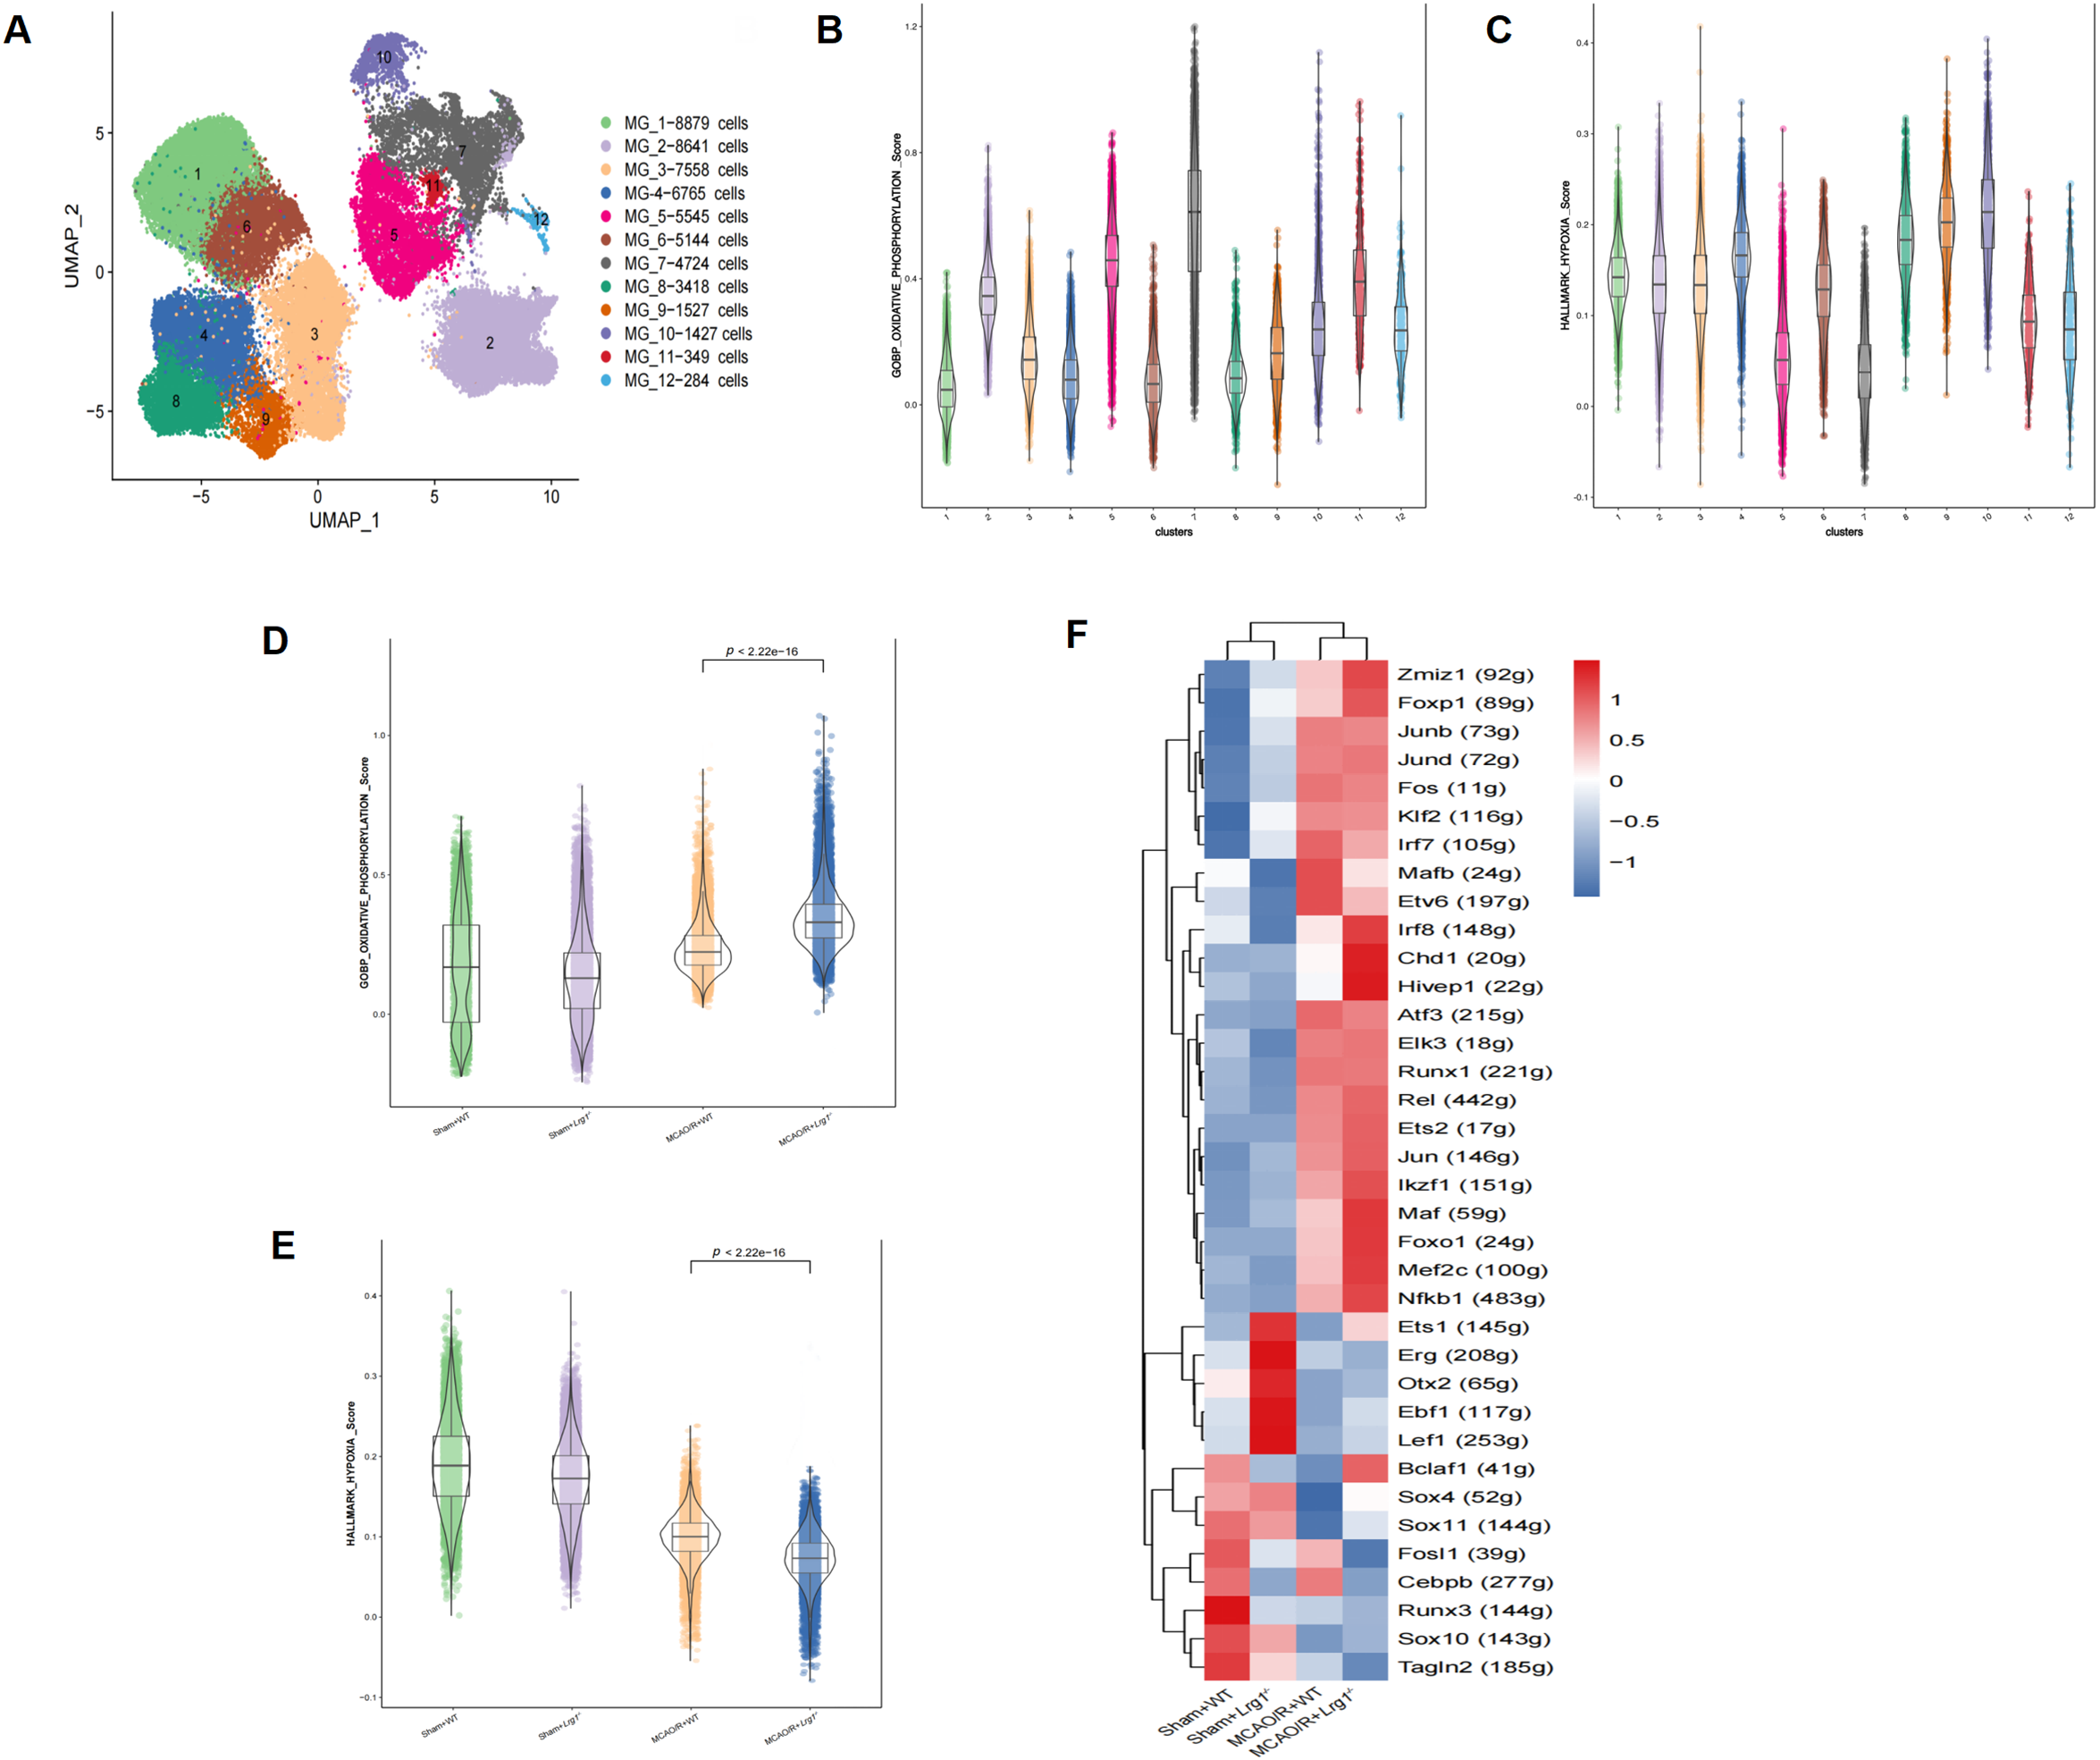
Figure 3: Lrg1 knockout modulates microglial oxidative phosphorylation enrichment scores via GSEA following cerebral ischemia-reperfusion injury. (A) UMAP projection shows microglial clustering in MCAO/R brain. (B) Scoring of oxidative phosphorylation in 12 subclusters of microglia via GSEA. (C) Scoring of glycolysis in 12 subclusters of microglia via GSEA. (D) Oxidative phosphorylation scoring of 4 groups via GSEA. (E) Glycolysis scoring of 4 groups via GSEA. (F) Heatmap representations demonstrate the enrichment patterns of transcription factors (columns) across different experimental groups (rows)
3.4 Lrg1 Knockout Impacts Neutrophil Heterogeneity after Cerebral Ischemia–Reperfusion
A total of 1188 neutrophil cells were obtained and subsequently clustered into 5 distinct groups based on unsupervised clustering analysis (Fig. 4A). The heatmap depiction of the signature genes highlighted notable variations in their expression profiles across these clusters (Fig. 4B) (Supplementary Table 1: Table S1). Specifically, Neutrophil_C1 was mainly abundant in the Sham-operated+WT or Lrg1-/- groups, while the MCAO/R-treated group demonstrated a higher enrichment of Neutrophil_C3 (Fig. 4C). To quantify the distribution of distinct neutrophil subclusters among different groups, further analysis was conducted based on Ro/e values (Fig. 4D). The specific differentiation trajectories of neutrophil within various groups were calculated using Monocle 2, revealing a sequence from Neutrophil_C4 and Neutrophil_C2, Neutrophil_C3, and Neutrophil_C5 to Neutrophil_C1 (Fig. 4E).
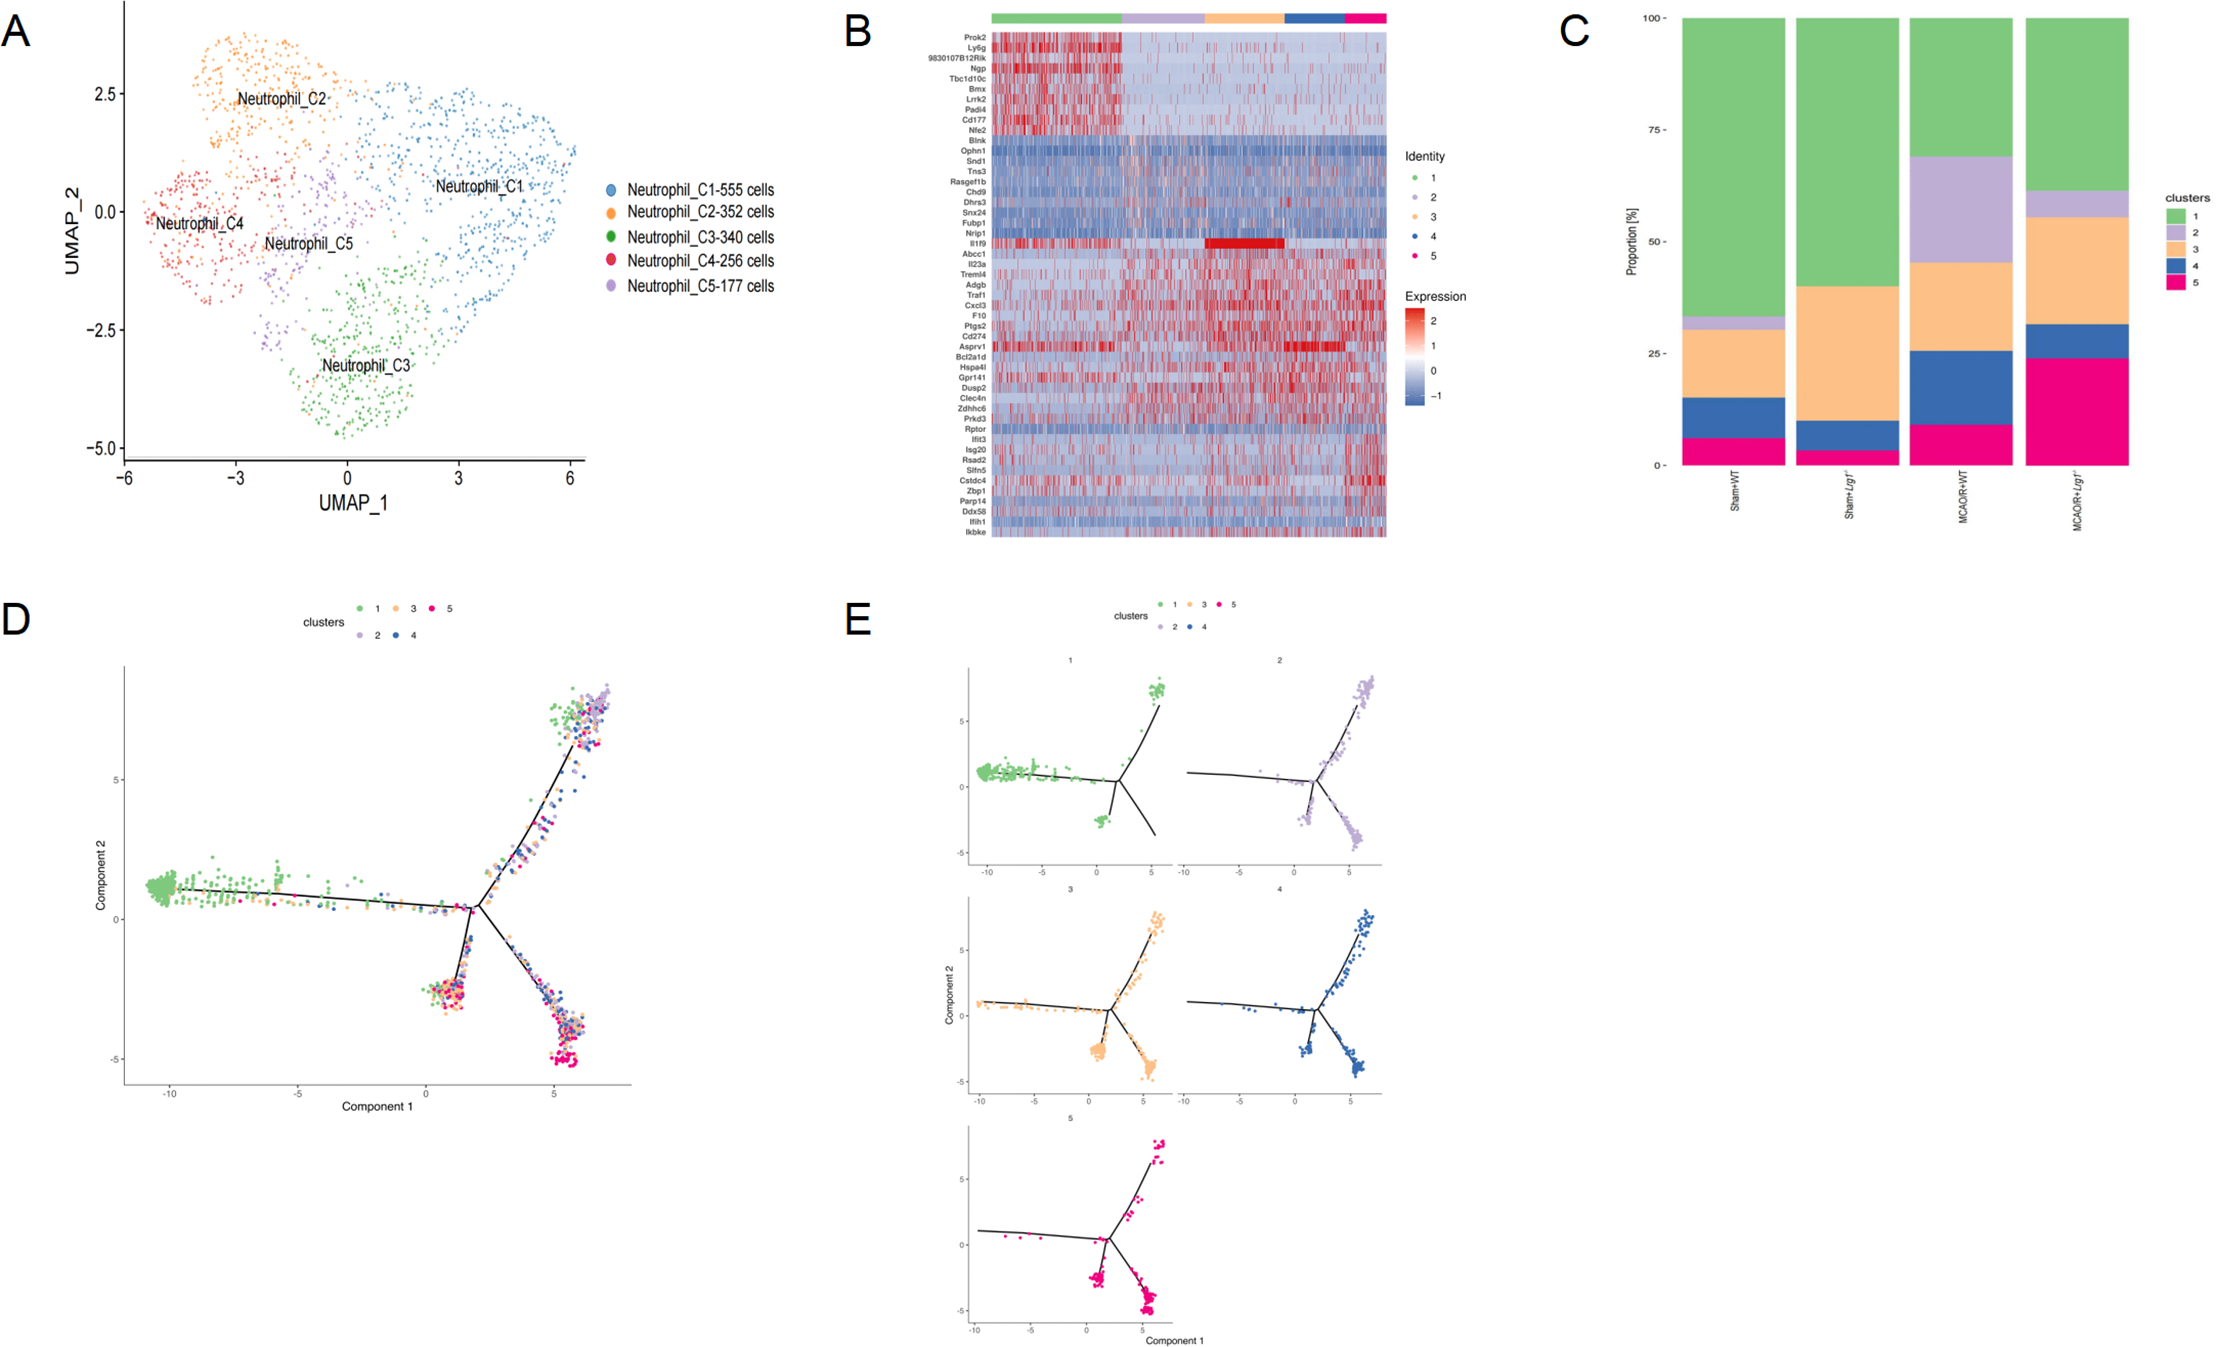
Figure 4: scRNA-seq identified neutrophil heterogeneity in mice brain tissues after cerebral ischemia-reperfusion. (A) UMAP shows neutrophil clustering in MCAO/R brain. (B) Heatmap shows expression of top 10 DEGs in neutrophil subclusters. (C) The bar graph presents the distribution of neutrophil clusters across different groups. (D) The dot plot offers an in-depth and comprehensive visualization of how distinct neutrophil clusters are spatially arranged as they advance along the differentiation trajectory. This analysis was carried out using Monocle2. (E) The dot plot presents a highly transparent and meticulously precise visualization of the differentiation pathways traversed by neutrophil subclusters. This analytical endeavor was executed utilizing the advanced capabilities of Monocle2
3.5 Lrg1 Knockout Impacts Intercellular Interactions and Potential Signaling Pathways after Cerebral Ischemia–Reperfusion
It was found that the MCAO/R+WT group exhibited the highest level of cellular interactions, following the knockout of Lrg1, these interactions decreased markedly (Fig. 5A). It was observed that while some cellular interactions were altered in specific ways, there were also contrasting effects. For instance, the interactions between microglial cells and astrocytes with other cells were enhanced in the MCAO/R+Lrg1-/- group. Specifically, microglial cells and T cells were present in both the sham+WT and sham+Lrg1-/- groups; however, their interactions diminished in the MCAO/R+WT group and subsequently increased again in the MCAO/R+Lrg1-/- group (Fig. 5A). Similarly, the interactions between astrocytes and T cells were also enhanced in the MCAO/R+Lrg1-/- group. Furthermore, the interactions between neutrophils and T cells weakened in the MCAO/R+WT group but were strengthened in the MCAO/R+Lrg1-/- group (Fig. 5A). KEGG pathway enrichment analysis was conducted on the differentially expressed genes (DEGs) identified between the MCAO/R+WT and MCAO/R+Lrg1-/- groups, unveiled their significant participation in phagosome-related pathways. These pathways form a complex and highly interconnected network that is inextricably linked to a spectrum of devastating neurological disorders, notably the triad of Huntington’s, Parkinson’s, and Alzheimer’s diseases (Fig. 5B,C). More importantly, KEGG suggests that the most relevant pathway related to metabolism is oxidative phosphorylation (Fig. 5B,C). Additionally, GO functional annotation revealed associations with pathways related to translation, immune system processes, and inflammatory responses (Fig. 5D,E).
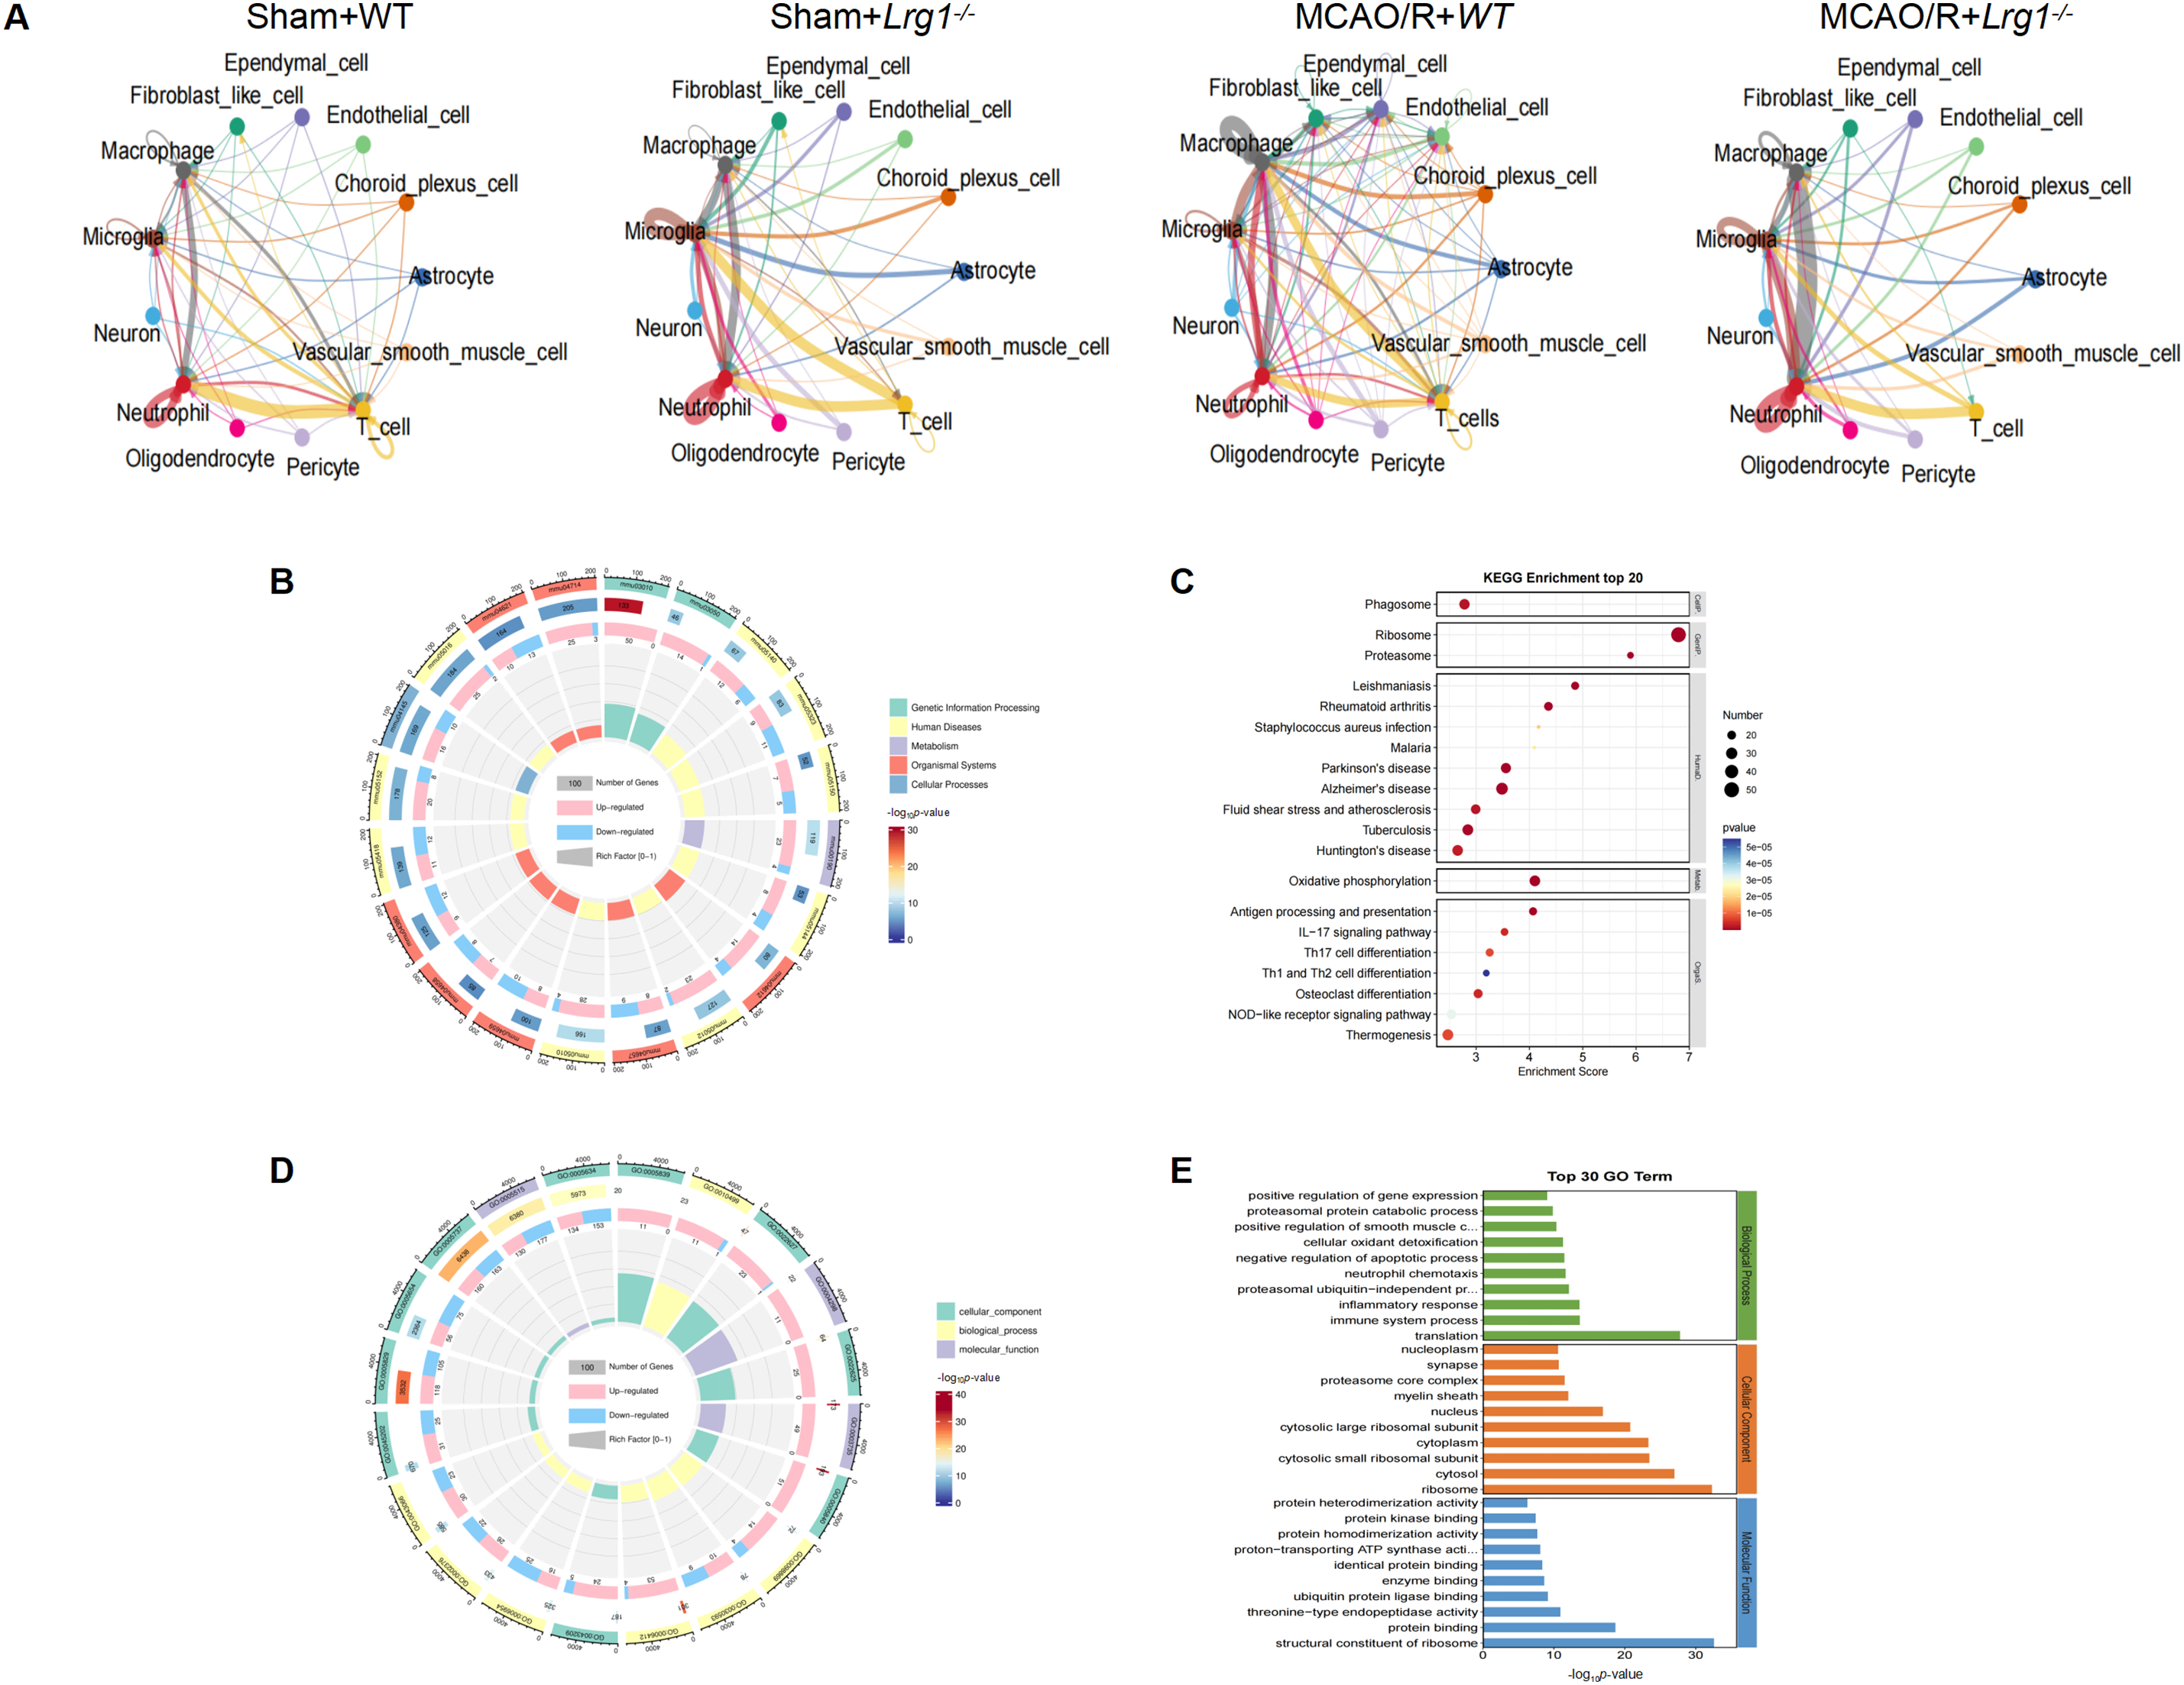
Figure 5: scRNA-seq revealed Lrg1 knockout impacts intercellular interactions and potential signaling pathways after cerebral ischemia–reperfusion. (A) Intercellular interactions based on scRNA-seq in different group. (B) KEGG enrichment of upregulated DEGs in Lrg1-/- mice following MCAO/R compared to the MCAO/R group. (C) Scatter graph visualizes KEGG pathway enrichment analysis. (D) GO (Gene Ontology) annotation of the upregulated DEGs within the brain tissues of Lrg1-/- mice after MCAO/R compared to the MCAO/R group. (E) An error bar plot represents GO annotation analysis
3.6 Lrg1 Knockout Enhance the Phagocytic Capacity of Microglia after Cerebral Ischemia–Reperfusion
Microglia, acting as essential immune regulators in the central nervous system, play a pivotal role in eliminating neutrophils via phagocytosis throughout the progression of ischemic stroke. Our study reveals that Lrg1 knockout significantly enhances microglia’s phagocytic function and improves neutrophil clearance. As shown in Fig. 6A,B, Lrg1 knockout notably reduces neutrophil fluorescence intensity in ischemic brain tissue, potentially enabling phagocytic cells to engulf more neutrophils. Further research explored CD68 expression in microglia under different conditions. CD68, a marker for phagolysosomes in phagocytic cells like microglia and macrophages, indicates enhanced phagocytosis when increased, as supported by Li et al. [2]. Immunostaining showed that Lrg1 knockout elevated CD68+ lysosome expression post-MCAO/R (Fig. 6C,D), with TMEM119 colocalizing with these lysosomes. MCAO/R raised CD68 expression in ischemic brains, an effect further intensified by Lrg1 knockout (Fig. 6C,D).
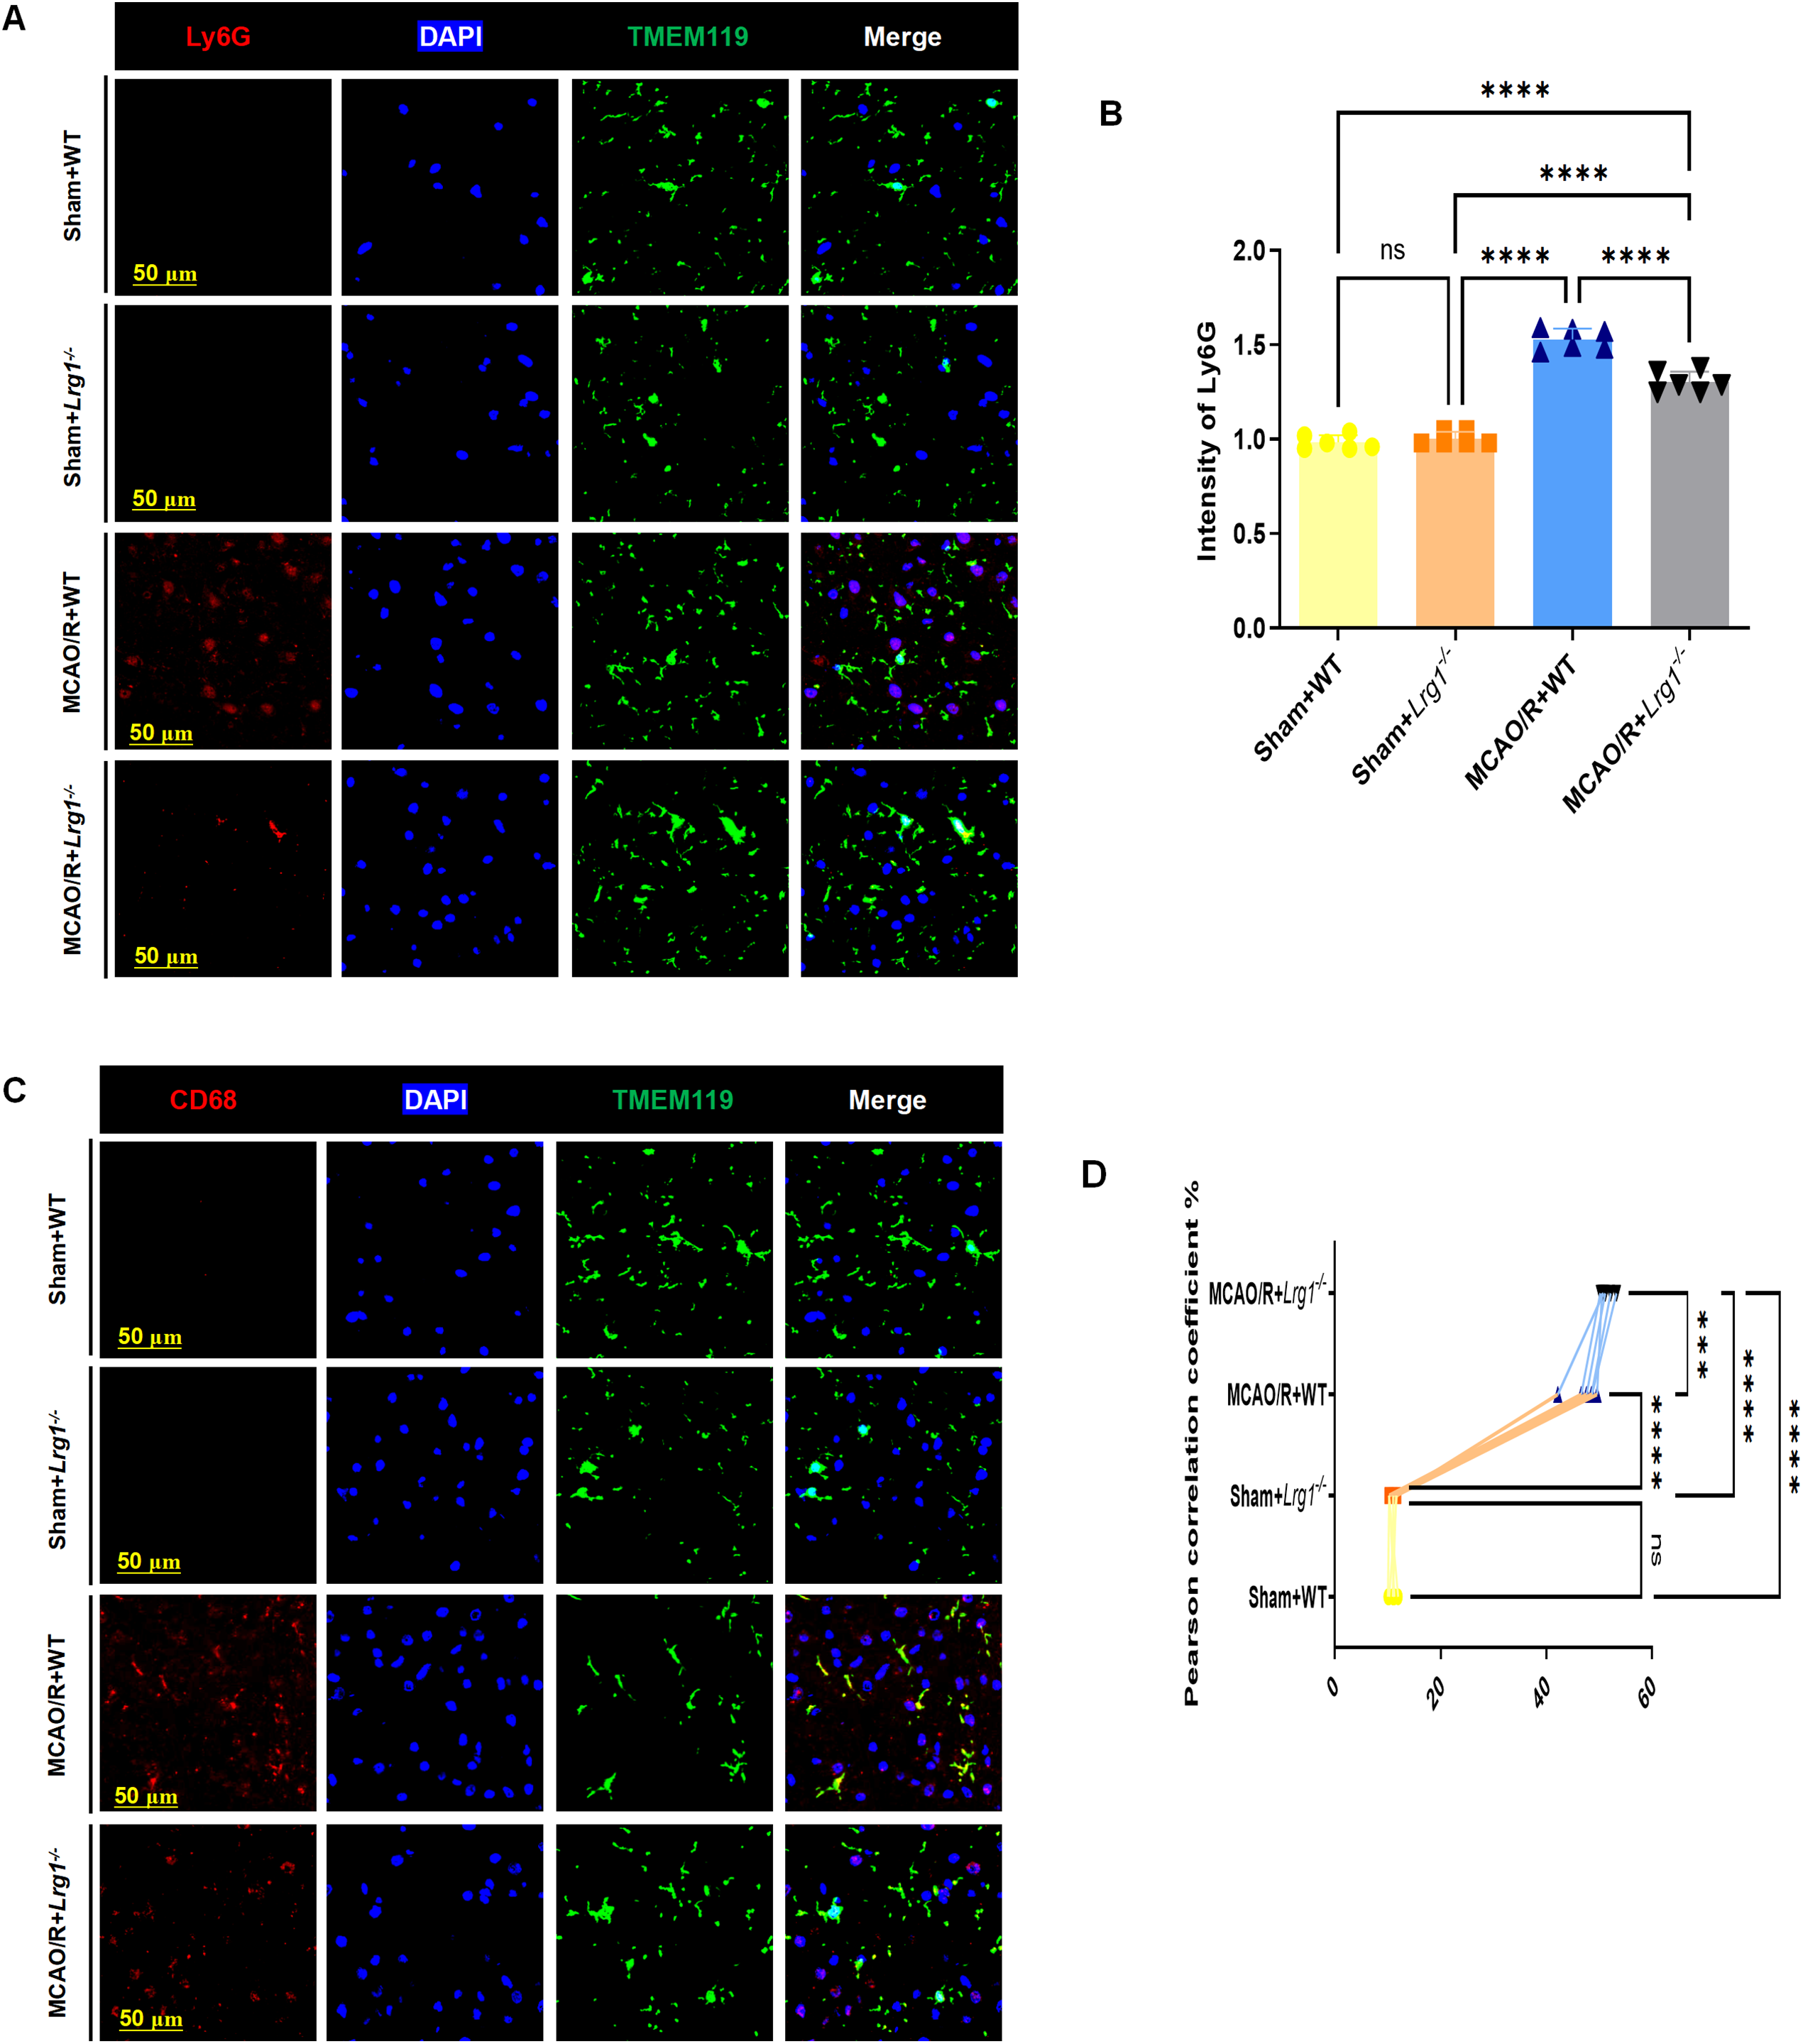
Figure 6: Lrg1 knockout enhance the phagocytic capacity of microglia after cerebral ischemia–reperfusion. (A) Representative images showcase TMEM119+ microglial cells and Ly6G+ neutrophils in the ischemic brain. Scale bar = 50 μm. (B) The error bar graph quantifies the percentage of neutrophils in the ischemic brain. Values are shown as mean ± SD, n = 6. n.s.: no significance and ****p < 0.0001. (C) Representative images illustrate TMEM119+ microglia and CD68+ lysosomes in the ischemic brain. Scale bar = 50 μm. (D) The scatter diagram displays the pearson correlation between the fluorescence expression. of TMEM119+ microglia and CD68+ lysosomes in the ischemic brain. Values are shown as mean ± SD, n = 6. n.s.: no significance and ***p < 0.001, ****p < 0.0001
3.7 Lrg1 Knockout Regulate Complex Enzyme System of Oxidative Phosphorylation after Cerebral Ischemia–Reperfusion Injury
The primary production of ROS occurs in mitochondria. While oxidative phosphorylation provides cells with more energy compared to glycolysis, it comes at the cost of generating ROS [15]. Upon examining the amount of ROS, we found that Lrg1-/- results in higher ROS production compared to the MCAO/R group, suggesting a possible closer association with the oxidative phosphorylation pathway (Fig. 7A). We analyzed the expression of proteins comprising the mitochondrial inner membrane transport chain: Complex I encoded with Ndufb8, Complex II encoded with Sdhb, Complex III encoded with Uqcrc1, Complex IV encoded with Mtco2 and Complex V encoded with Atp5a1. Our research demonstrated a notable decline in the expression of these proteins within the MCAO/R group when contrasted with the sham-operated group. Nevertheless, following MCAO/R treatment in Lrg1-/- mice, we observed a significant elevation in the expression levels of mitochondrial respiratory chain Complexes I-V (Fig. 7B). Immunofluorescence staining was utilized to evaluate the expression patterns of microglia and Complexes I and V in brain tissues. The findings revealed a concordant pattern of fluorescence expression for Complexes I and V (Fig. 7C–F), aligning with their corresponding expressions as determined by western blot analysis.
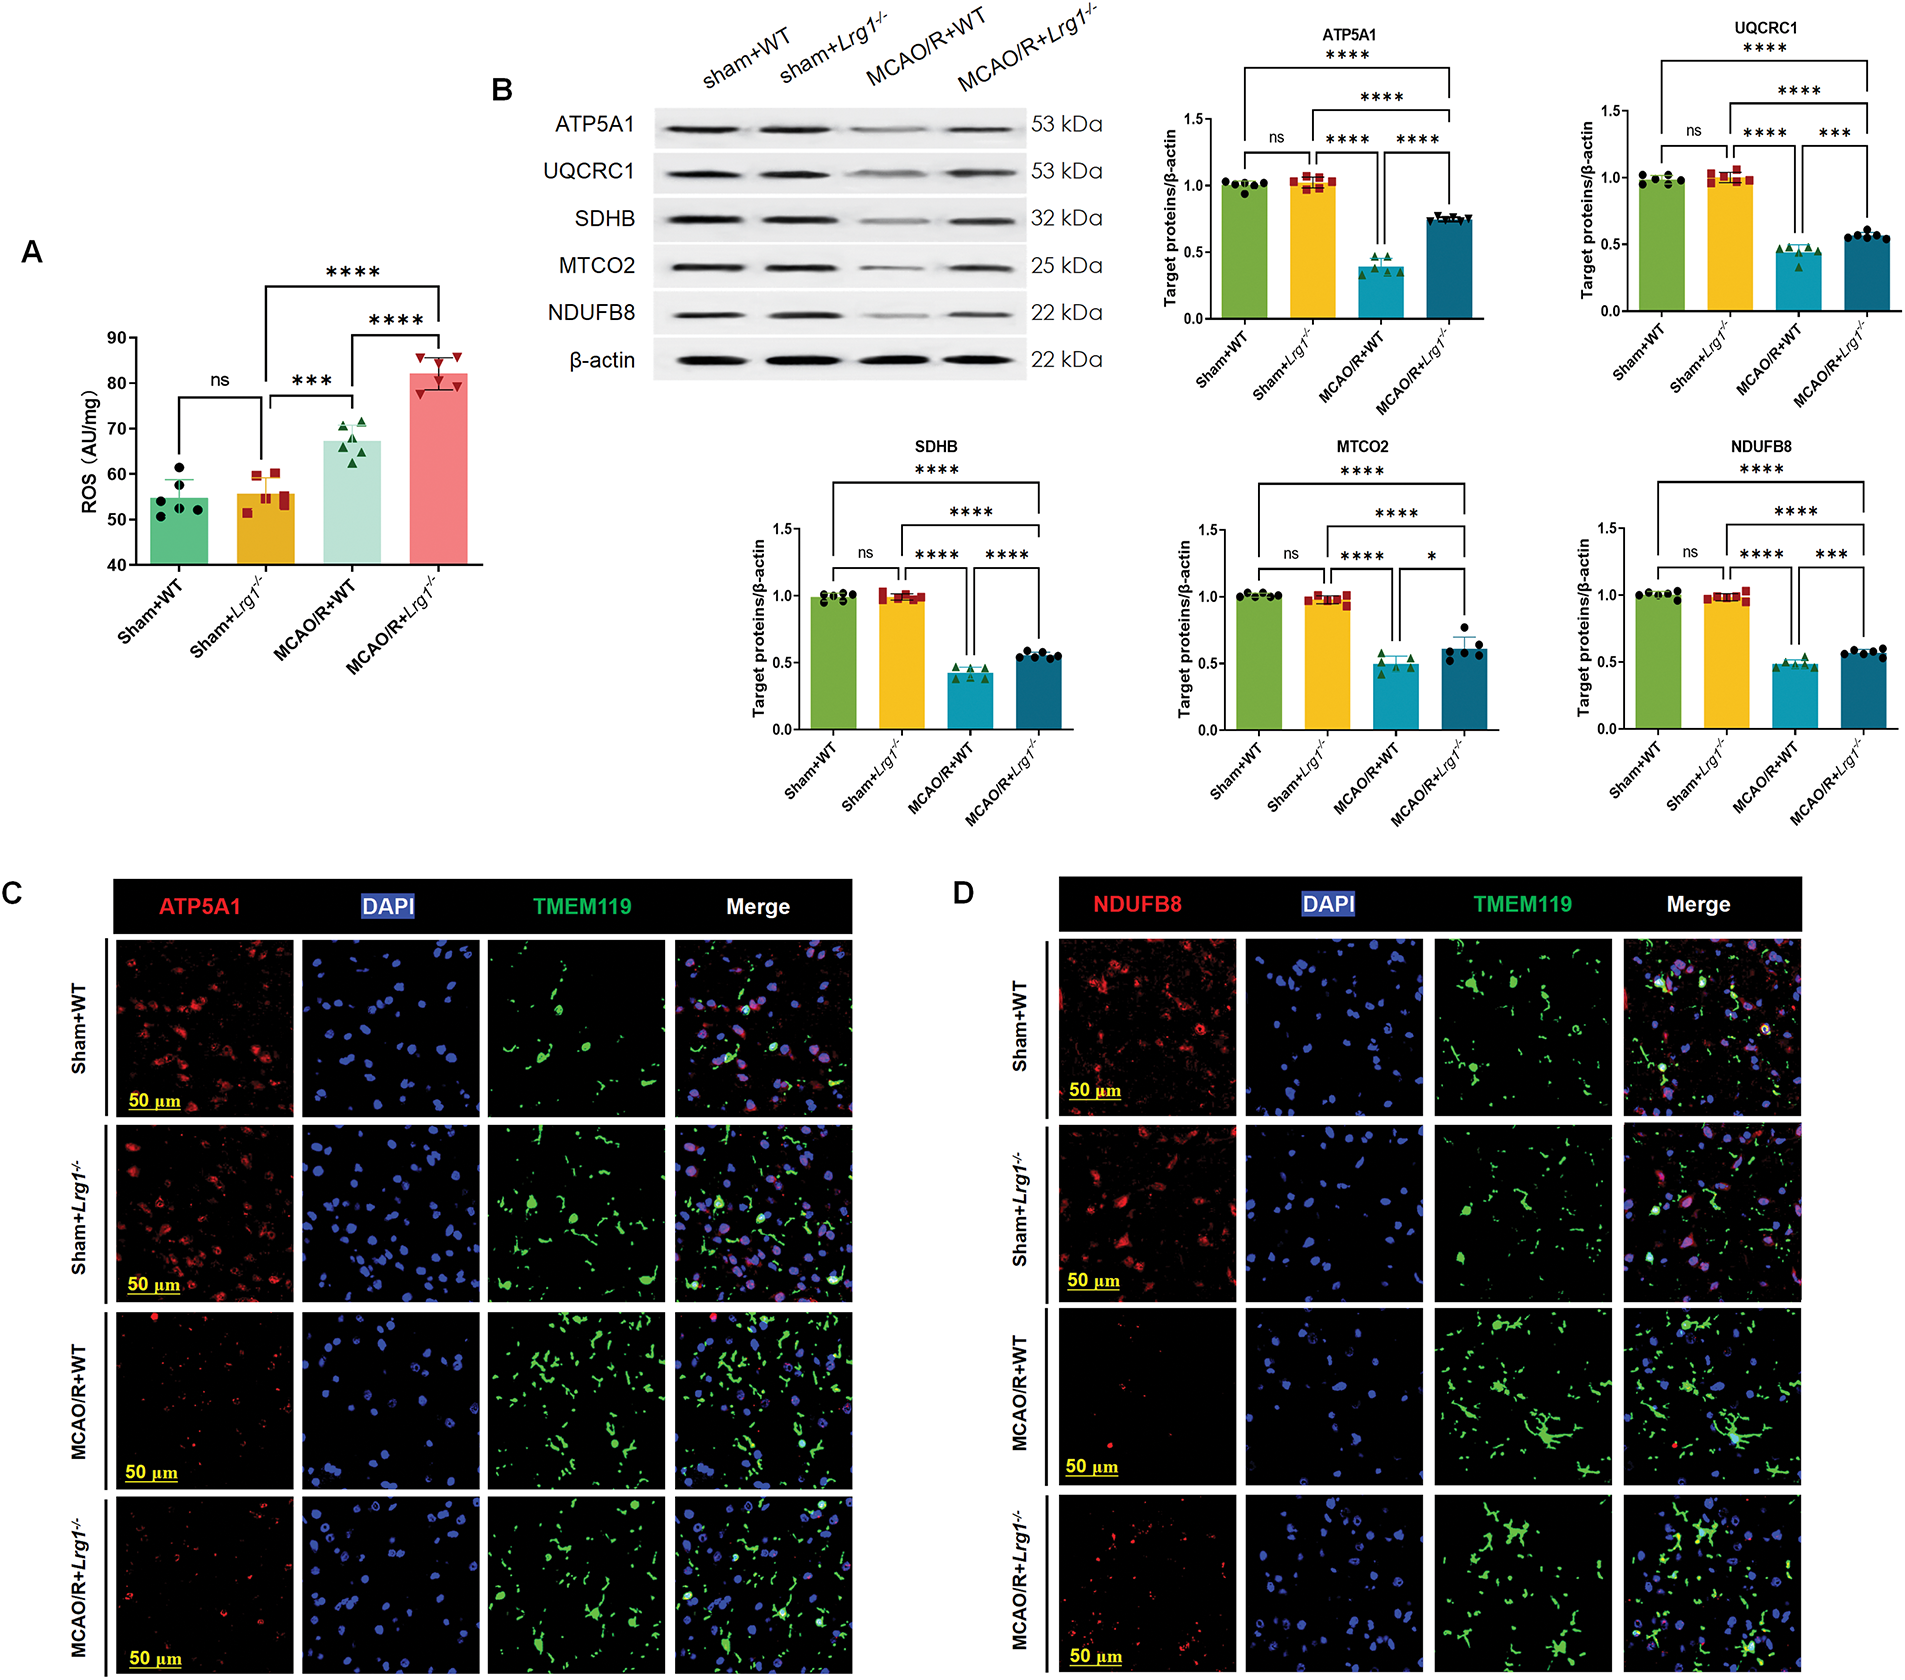
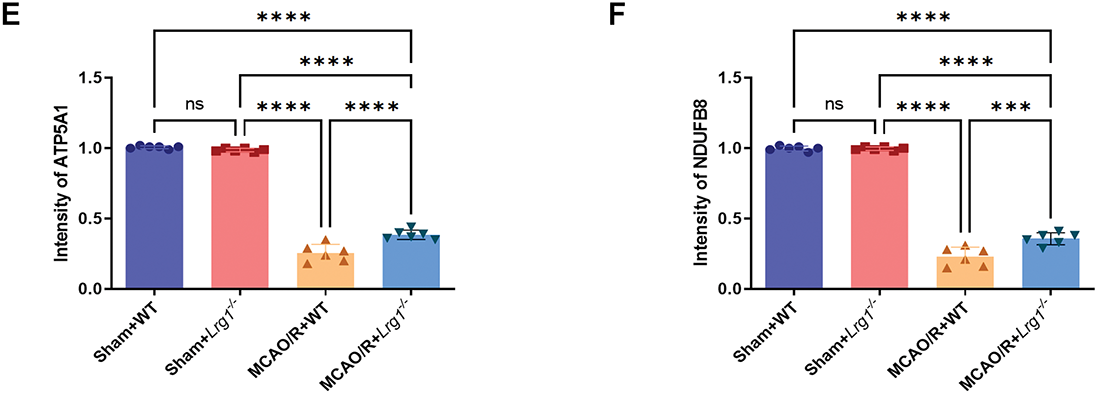
Figure 7: Lrg1 knockout regulate enzyme system of oxidative phosphorylation after cerebral ischemia–reperfusion. (A) Evaluation of ROS concentrations subsequent to cerebral ischemia-reperfusion injury is presented. The error bar graph illustrates the results across various groups, with data represented as the mean ± SD (n = 6). Significance levels are indicated as follows: n.s. denotes no significance, ***p < 0.001 and ****p < 0.0001. (B) Presented here are illustrative Western blot images depicting the expression profiles of NDUFB8, SDHB, UQCRC1, MTCO2, and ATP5A1 in the brains of mice that have undergone cerebral ischemia-reperfusion injury. The corresponding error bar graph provides a detailed breakdown of the results obtained across the various experimental groups, with data reported as the mean ± SD (n = 6). The significance levels are indicated as follows: n.s.: no significance, *p < 0.05, ***p < 0.001 and ****p < 0.0001. (C) Representative immunocytochemical images of microglia stained for NDUFB8 (red), DAPI (blue), and TMEM119 (green) in the Sham+WT, Sham+Lrg1-/-, MCAO/R+WT and MCAO/R+Lrg1-/- groups. Scale bar=50 μm. (D) Representative immunocytochemical images of microglia stained for Complex V encoded with ATP5A1 (red), DAPI (blue), and TMEM119 (green) in the Sham+WT, Sham+Lrg1-/-, MCAO/R+WT and MCAO/R+Lrg1-/- groups. Scale bar = 50 μm. (E) Error bar graph showing the quantitation of the ATP5A1. Data are expressed as the mean ± SD, n = 6. n.s.: no significance and ****p < 0.0001. (F) Error bar graph showing the quantitation of the NDUFB8. Data are expressed as the mean ± SD, n = 6. n.s.: no significance, ***p < 0.001 and ****p < 0.0001
In the immediate aftermath of ischemic stroke, rapid neutrophil infiltration is initiated, driven by blood-brain barrier disruption. This breach facilitates the entry of peripheral immune cells, predominantly neutrophils and macrophages, into the ventricular system. The infiltration reaches its zenith between 24 and 72 h post-stroke, marked by a substantial surge in N1 neutrophils compared to N2 neutrophils [16]. Thereafter, the neutrophil count begins to dwindle by days 4 and 7, with a dramatic decrease observed in the next 14 days. Throughout this inflammatory cascade, neutrophils trigger the production of ROS, which exacerbates hypoxic conditions and disrupts the oxidative phosphorylation process within the mitochondrial respiratory chain, leading to mitochondrial depolarization and elevated O2 levels. Concurrently, the biosynthesis of cytokines such as TNF-α and IL-6 occurs across multiple brain regions [17]. Neutrophil infiltration persists throughout the acute, subacute, and regenerative phases of cerebral ischemia, underscoring its pivotal role in orchestrating the complex inflammatory response following ischemic stroke. The scRNA-seq results provide valuable insights into the cellular subsets and differentiation patterns in cerebral ischemia-reperfusion injury. Available literature evidence also hints at a greater degree of neutrophil heterogeneity in nervous system diseases, yet the mechanisms underlying the microenvironmental regulation of neutrophil status remain elusive [18]. In particular, by focusing on microglia, we examine their phagocytic role in clearing neutrophils from the brain parenchyma, thereby attenuating neuroinflammatory responses. Parallel investigations under this paradigm also dissect the molecular pathways potentially mediating this regulatory function.
Figs. 1, 2 and 5A suggest that after MCAO/R or Lrg1 knockout, the interactions among various cell types have undergone changes. We selected 2 representative cell types–endothelial cells and microglia, and found that there is immunofluorescence colocalization expression between endothelial cells/microglia and neutrophils, leading us to speculate that there may be interactions such as penetration or phagocytosis occurring. There are numerous reports detailing the effects of microglia on neutrophils. In aged brains post-stroke, 6 microglial subclusters exist, with MG5 being highly proliferative and MG6 mimicking neutrophils [19]. Microglial cell are the major cell type involved in debris removal, which chew up the debris, the pathogene, and the bacteria in response to ischemia damage [20]. The adherence of neutrophils to endothelial cells stands as a cornerstone mechanism in the initiation of inflammation during ischemia-reperfusion scenarios. This crucial interaction significantly contributes to the sequential chain of responses that hasten the commencement of inflammation subsequent to episodes of diminished blood flow and the ensuing re-establishment of circulation. When neutrophils adhere to the endothelial lining of blood vessels, they facilitate the infiltration of immune cells into tissues, which triggers a series of inflammatory reactions aimed at restoring tissue homeostasis but can also cause damage if unregulated. Therefore, the adhesion of neutrophils to endothelial cells constitutes a critical early step in the inflammatory process that characterizes MCAO/R injury [21,22]. Additionally, there are also reports that activated vascular smooth muscle cellular subcluster was enriched in neutrophil-mediated immune responses and exocytosis regulation, while specific subcluster 5, linked to type I interferon, had a reduced proportion in the MCAO group [23].
As the precious value of cellular heterogeneity, researchers found through scRNA-seq experiments that 4 neutrophil clusters were identified in the brain, with NEUT0, the most mature, highly expressing CXCL1 [23]. scRNA-seq revealed 6 neutrophil clusters in the blood [24], with age-related changes leading to atypical neutrophils exacerbating stroke. Aged mice had higher CXCL3 production by CD62low neutrophils, linked to poorer reperfusion and outcome. Elevated plasma levels of neutrophil growth factors and proinflammatory mediators were also seen in aged mice. Yang et al. distinguished three neutrophil subsets in the brain, with NEUT1, composed of infiltrated neutrophils, increasing from 0.3% to 18.7% post-stroke. NEUT1 cells showed high activation, with NEUT2 categorized as immature [19]. Through dimensionality reduction, 5 subclusters of neutrophils were identified following ischemic stroke, with the highest cell count observed in MCAO+WT, indicating the infiltration of neutrophils after cerebral ischemia. Additionally, Fig. 4C reveals that NEUT1 accounts for the largest proportion, albeit with varying percentages among different groups. Further experimental evidence is required to investigate the functions of NEUT1. Through further comparison of differentially expressed genes, the differentially expressed genes Camp, Ngp, Lfitm6, Ltf, and Ly6g exhibit higher positive correlation in expression within the NEUT1 subclusters. Research has demonstrated that Ly6G is critically involved in the infiltration, recruitment, and migration of neutrophils during inflammatory responses [25]. With the onset of immunosenescence or aging, the functionality of innate immune cells, including neutrophils and macrophages, becomes compromised, potentially paving the way for pathogen invasion [26,27]. Moreover, a strong correlation has been found between the expression level of Ly6G and the immune functions of neutrophils in antibacterial immunity. These immune capabilities, such as phagocytosis, ROS production, NET formation, migration, and bacterial clearance, weaken with aging [28]. Here, we suggest that the proportion of NEUT1 decreases after MCAO modeling, but increases after Lrg1 knockout, which also indicates an increase in NEUT1. Our research findings have surpassed the conventional limitations of the defined polarization states of neutrophil, which are influenced by a multitude of disease conditions.
Under physiological conditions, homeostatic microglia primarily use oxidative phosphorylation (OXPHOS) for ATP production, but switch to glycolysis during inflammation to meet energy demands. This metabolic shift enables rapid responses to danger signals, critical under pathological conditions [29]. Glycolysis inhibits energy-intensive phagocytosis by providing rapid ATP, while Resolvin D1 reverses this reprogramming to sustain microglial clearance activity [2]. CD68 serves as a well-established marker for phagolysosomes within microglia and macrophages. It is particularly noteworthy that the phagocytic ability of microglia exhibits a substantial and statistically significant enhancement in the MCAO/R+WT and MCAO+Lrg1-/- groups, as depicted in Fig. 6C,D [30]. In Alzheimer’s models, enhancing OXPHOS improves amyloid-β phagocytosis and cognitive outcomes [31]. Chronic Aβ exposure induces microglial immune tolerance via downregulated glycolysis/OXPHOS, impairing reactivity [29]. Conversely, IL-33 promotes glycolysis in primary microglia, activating AKT/NDRG1/mTOR pathways to modulate neurodevelopment [32]. Aging microglia shift to anaerobic glycolysis, increasing inflammatory cytokines/ROS and exacerbating damage [33]. Trem2 deficiency disrupts OXPHOS, altering respiratory gene expression and ATP synthesis, thereby affecting neuronal metabolism [34]. KEGG analysis of MCAO+Lrg1−/− mice showed OXPHOS pathway enrichment, suggesting Lrg1 knockout modulates microglial bioenergetics. However, the molecular mechanisms of neutrophil phagocytosis by microglia require further study.
Glycolysis transpires in the cytoplasm, whereas oxidative phosphorylation unfolds within mitochondria. While glycolysis offers swift energy release, oxidative phosphorylation, albeit accompanied by the production of ROS, yields substantially more energy for the cell. Specifically, oxidative phosphorylation generates approximately 32 ATP molecules per glucose molecule metabolized, in contrast to glycolysis’s mere 2 ATP molecules. This intricate process mandates the participation of proteins situated within the mitochondrial inner membrane transport chain to facilitate the sequential transfer of electrons through a cascade of oxidation-reduction reactions: commencing with Complex I, advancing to Complex II, then moving on to Coenzyme Q (CoQ), followed by Complex III, Cytochrome c, and ultimately reaching its terminus at Complex IV [35]. Notably, the subunits of these five oxidative phosphorylation complexes are encoded by diverse genomes, such as Complex I encoded with Ndufb8 [36], Complex II encoded with Sdhb [36], Complex III encoded with Uqcrc1 [37], Complex IV encoded with Mtco2 [38], and Complex V encoded with Atp5a1 [39] following MCAO/R, a decrease is noted in the expression of signaling molecules related to oxidative phosphorylation. Conversely, when Lrg1 is knockout, a significant increase is observed in the expression of these oxidative phosphorylation signaling molecules, which is accompanied by an augmentation in the levels of ROS. This finding indicates that the absence of Lrg1 results in the enhancement of oxidative phosphorylation in microglia after MCAO/R.
Despite our findings, our study is constrained by several limitations. Notably, our analysis of microglia predominantly hinges on informatics outcomes stemming from single-cell sequencing, particularly in the context of elucidating intercellular communication and oxidative phosphorylation mechanisms. Although we have experimentally confirmed the regulatory mechanism of Lrg1 on oxidative phosphorylation in microglia, the literature on this topic remains sparse, necessitating further investigation into the differentiation process and underlying molecular mechanisms.
The aforementioned research demonstrates that Lrg1 regulates both microglial phagocytosis and the subsequent phenotypic switching of neutrophils in post-ischemic brain tissue. Lrg1 knockout results in a reduction in neutrophil count, and this regulation is associated with the oxidative phosphorylation pathway in microglia modulated by Lrg1 (Fig. 8). Given the correlation between neutrophils and inflammatory tissue infiltration after cerebral ischemia, Lrg1 emerges as a promising target for intervening in the inflammatory and immune responses in ischemic stroke.
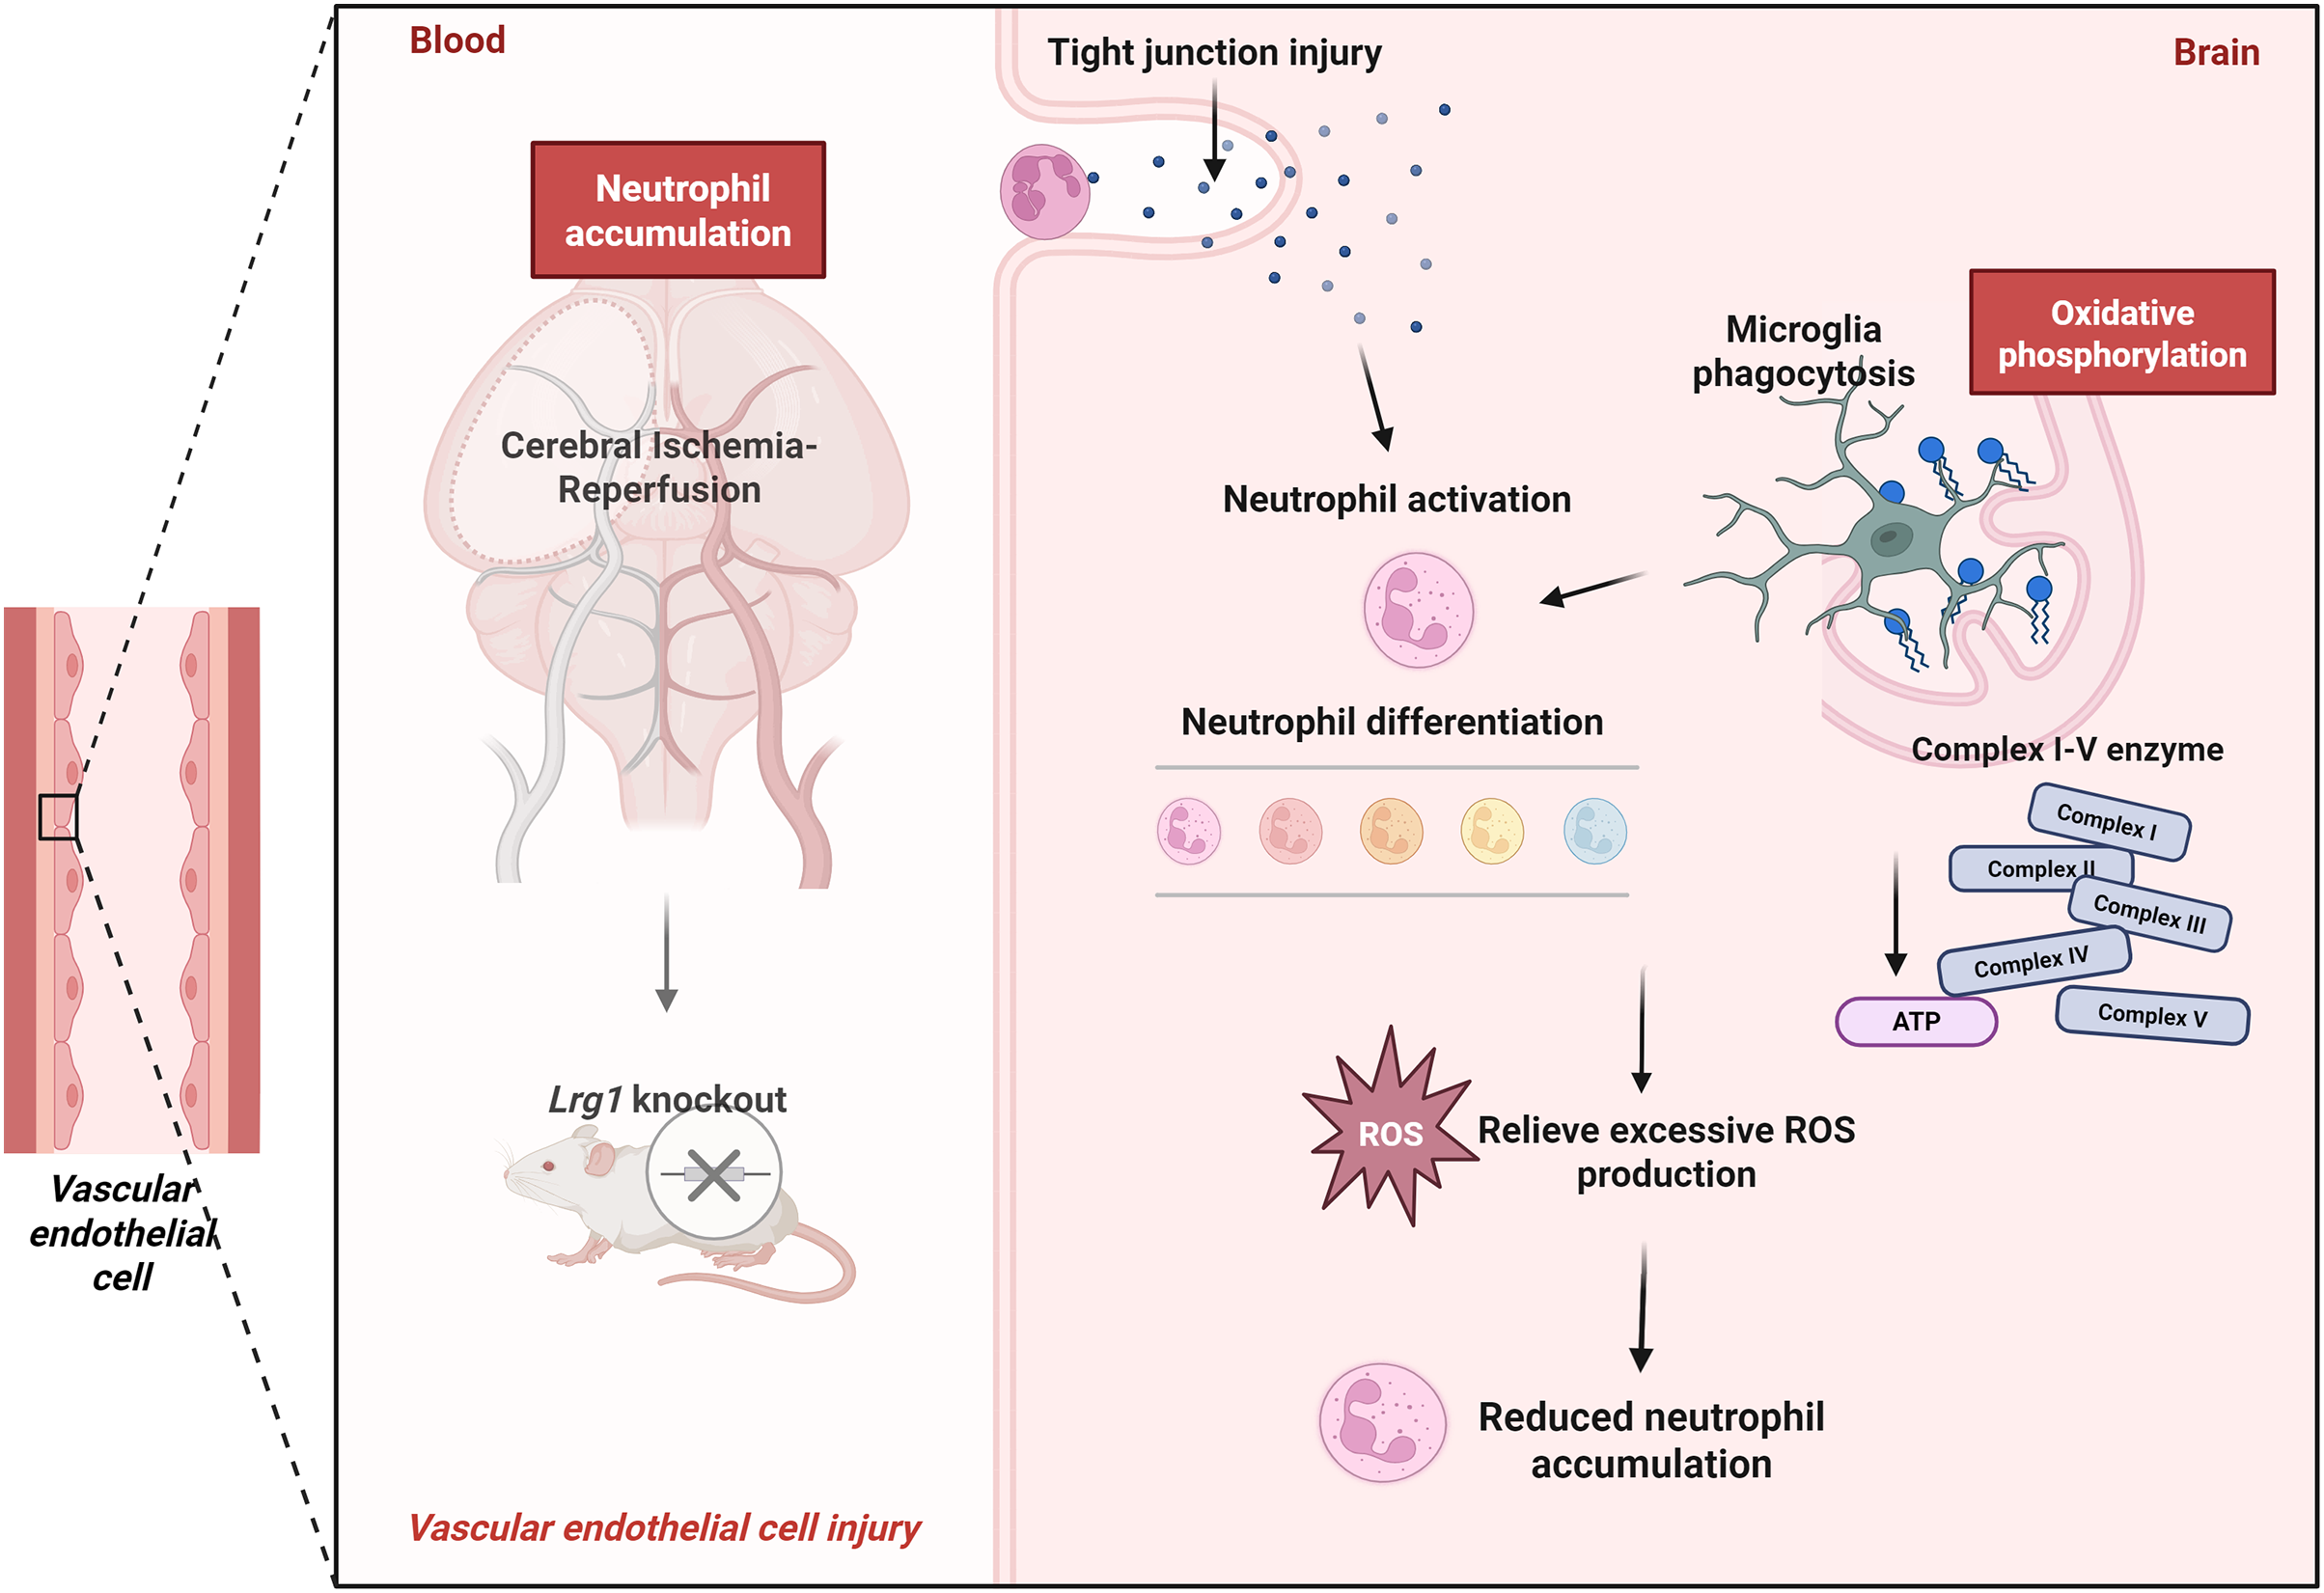
Figure 8: Lrg1 knockout regulate the oxidative phosphorylation pathway in microglia to affect neutrophil accumulation after MCAO/R via scRNA-seq (Drawn via Biorender)
Acknowledgement: We are grateful to the assistance in the experimental assistance from School of Pharmacy of Jiangxi Medical College, Nanchang University. Also, we acknowledge the assistance provided by the Neurology laboratory in conducting the experiments.
Funding Statement: This work was supported by the Foundation Project: National Natural Science Foundation of China (Nos.: 82460249, 82100417, 81760094); The Foundation of Jiangxi Provincial Department of Science and Technology Outstanding Youth Fund Project (20242BAB23080).
Author Contributions: The authors confirm contribution to the paper as follows: Animal experiments: Luyao Jiang, Longsheng Fu, Shaofeng Xiong and Guosheng Cao; Sequencing data analysis and uploading: Yanqin Mei, Yaoqi Wu, Jin Chen and Yanni Lv; Typeset all figures and draw the mechanism diagram: Yanqin Mei and Yaoqi Wu; Disposal data and performed the statistical analysis: Luyao Jiang, Longsheng Fu, Yaoqi Wu, Jin Chen and Yanni Lv; Draft manuscript preparation: Luyao Jiang, Jin Chen and Yanni Lv. All authors reviewed the results and approved the final version of the manuscript.
Availability of Data and Materials: The data reported in this study are available at NCBI GEO (https://www.ncbi.nlm.nih.gov/geo/query/acc.cgi?acc=GSE245386) and (https://www.ncbi.nlm.nih.gov/geo/query/acc.cgi?acc=GSE279462) (accessed on 1 July 2025).
Ethics Approval: Ethics approval and consent to participate. This study was approved by the ethics committee of the First Affiliated Hospital, Jiangxi Medical College, Nanchang University (Nanchang, China) (IACUC Issue No.: CDYFY-IACUC-202306QR028).
Conflicts of Interest: The authors declare no conflicts of interest to report regarding the present study.
Supplementary Materials: The supplementary material is available online at https://www.techscience.com/doi/10.32604/biocell.2025.068507/s1.
Abbreviation
| ANOVA | Analysis of Variance |
| ATP | Adenosine Triphosphate |
| ATP5A1 | ATP Synthase F1 Subunit Alpha |
| BBB | Blood-Brain Barrier |
| CD31 | Cluster of Differentiation 31 |
| CoQ | Coenzyme Q |
| DAPI | 4′,6-diamidino-2-phenylindole |
| DEGs | Differentially Expressed Genes |
| GAPDH | Glyceraldehyde-3-Phosphate Dehydrogenase |
| GEO | Gene Expression Omnibus |
| GO | Gene Ontology |
| H3cit | Citrullinated Histone H3 |
| HRP | Horseradish Peroxidase |
| IL-6 | Interleukin 6 |
| KEGG | Kyoto Encyclopedia of Genes and Genomes |
| Lrg1 | Leucine-rich alpha-2-glycoprotein 1 |
| Ly6G | Lymphocyte Antigen 6 Complex, Locus G |
| MCAO/R | Middle Cerebral Artery Occlusion/Reperfusion |
| MMP9 | Matrix Metalloproteinase 9 |
| MPO | Myeloperoxidase |
| MTCO2 | Mitochondrially Encoded Cytochrome c Oxidase II |
| NDUFB8 | Ubiquinone Oxidoreductase Subunit B8 |
| NE | Neutrophil Elastase |
| NET | Neutrophil Extracellular Trap |
| NEUT | Neutrophil Cluster |
| PBS | Phosphate Buffer Saline |
| PVDF | Polyvinylidene Fluoride |
| ROS | Reactive Oxygen Species |
| RSS | Regulon Specificity Score |
| scRNA-seq | Single-Cell RNA Sequencing |
| SDHB | Succinate Dehydrogenase Complex Iron-Sulfur Subunit B |
| SDS-PAGE | Sodium Dodecyl Sulfate-Polyacrylamide Gel Electrophoresis |
| TMEM119 | Transmembrane Protein 119 |
| UMAP | Uniform Manifold Approximation and Projection |
| UQCRC1 | Ubiquinol-Cytochrome c Reductase Core Protein 1 |
| WT | Wild-type |
References
1. Kang L, Yu H, Yang X, Zhu Y, Bai X, Wang R, et al. Neutrophil extracellular traps released by neutrophils impair revascularization and vascular remodeling after stroke. Nat Commun. 2020;11(1):2488. doi:10.1038/s41467-020-16191-y. [Google Scholar] [PubMed] [CrossRef]
2. Li L, Cheng SQ, Sun YQ, Yu JB, Huang XX, Dong YF, et al. Resolvin D1 reprograms energy metabolism to promote microglia to phagocytize neutrophils after ischemic stroke. Cell Rep. 2023;42(6):112617. doi:10.1016/j.celrep.2023.112617. [Google Scholar] [PubMed] [CrossRef]
3. Sun M, Ma J, Zhang G, Song M, Lv R, Liang J, et al. Brain targeting bacterial extracellular vesicles enhance ischemic stroke therapy via efficient ROS elimination and suppression of immune infiltration. ACS Nano. 2025;19(16):15491–508. doi:10.1021/acsnano.4c16161. [Google Scholar] [PubMed] [CrossRef]
4. Shi FD, Yong VW. Neuroinflammation across neurological diseases. Science. 2025;388(6753):eadx0043. [Google Scholar] [PubMed]
5. Liu J, Liang Y, Meng Q, Chen J, Ma J, Zhu H, et al. Antagonism of β-arrestins in IL-4-driven microglia reactivity via the Samd4/mTOR/OXPHOS axis in Parkinson’s disease. Sci Adv. 2024;10(34):eadn4845. doi:10.1126/sciadv.adn4845. [Google Scholar] [PubMed] [CrossRef]
6. Hu Y, Mai W, Chen L, Cao K, Zhang B, Zhang Z, et al. mTOR-mediated metabolic reprogramming shapes distinct microglia functions in response to lipopolysaccharide and ATP. Glia. 2020;68(5):1031–45. doi:10.1002/glia.23760. [Google Scholar] [PubMed] [CrossRef]
7. Wu QL, Yang X, Luo JX, Liu L, Zhou Y, Lu MH. Microglia energy metabolism: a new perspective on Alzheimer’s disease treatment. J Neurol Sci. 2025;475(10284):123585. doi:10.1016/j.jns.2025.123585. [Google Scholar] [PubMed] [CrossRef]
8. Sturno AMJr, Hassell JE, Lanaspa MA, Bruce KD. Do microglia metabolize fructose in Alzheimer’s disease? J Neuroinflammation. 2025;22(1):85. doi:10.1186/s12974-025-03401-x. [Google Scholar] [PubMed] [CrossRef]
9. Tang F, Li J, Qi L, Liu D, Bo Y, Qin S, et al. A pan-cancer single-cell panorama of human natural killer cells. Cell. 2023;186(19):4235–51.e20. doi:10.1016/j.cell.2023.07.034. [Google Scholar] [PubMed] [CrossRef]
10. Zou Y, Xu Y, Chen X, Wu Y, Fu L, Lv Y. Research progress on Leucine-rich alpha⁃2 glycoprotein 1: a review. Front Pharmacol. 2022;12:809225. doi:10.3389/fphar.2021.809225. [Google Scholar] [PubMed] [CrossRef]
11. Ruan Z, Cao G, Qian Y, Fu L, Hu J, Xu T, et al. Single-cell RNA sequencing unveils Lrg1’s role in cerebral ischemia–reperfusion injury by modulating various cells. J Neuroinflammation. 2023;20(1):285. doi:10.21203/rs.3.rs-3211574/v1. [Google Scholar] [CrossRef]
12. Hao Y, Hao S, Andersen-Nissen E, Mauck WM, Zheng S, Butler A, et al. Integrated analysis of multimodal single-cell data. Cell. 2021;184(13):3573–87.e29. doi:10.1016/j.cell.2021.04.048. [Google Scholar] [PubMed] [CrossRef]
13. Polański K, Young MD, Miao Z, Meyer KB, Teichmann SA, Park JE. BBKNN: fast batch alignment of single cell transcriptomes. Bioinformatics. 2020;36(3):964–5. doi:10.1093/bioinformatics/btz625. [Google Scholar] [PubMed] [CrossRef]
14. Gulati GS, Sikandar SS, Wesche DJ, Manjunath A, Bharadwaj A, Berger MJ, et al. Single-cell transcriptional diversity is a hallmark of developmental potential. Science. 2020;367(6476):405–11. doi:10.1101/649848. [Google Scholar] [CrossRef]
15. Yan JJ, Wang YY, Shi ZY, Ding YY, Wen HQ, Wu MP, et al. SIRT5 modulates mitochondria function via mitophagy and antioxidant mechanisms to facilitate oocyte maturation in mice. Int J Biol Macromol. 2025;306(6):141488. doi:10.1016/j.ijbiomac.2025.141488. [Google Scholar] [PubMed] [CrossRef]
16. Xie M, Hao Y, Feng L, Wang T, Yao M, Li H, et al. Neutrophil heterogeneity and its roles in the inflammatory network afterIschemic stroke. Curr Neuropharmacol. 2023;21(3):621–50. doi:10.2174/1570159x20666220706115957. [Google Scholar] [PubMed] [CrossRef]
17. Tuz AA, Hoerenbaum N, Ulusoy Ö., Ahmadi A, Gerlach A, Beer A, et al. Hypercholesterolemia triggers innate immune imbalance and transforms brain infarcts after ischemic stroke. Front Immunol. 2025;15:1502346. doi:10.3389/fimmu.2024.1502346. [Google Scholar] [PubMed] [CrossRef]
18. Du LD, Fang C, Wang YQ, Feng ZY, Abiola OF, Gao ZL, et al. MMP-9 inhibitor SB-3CT improves neurological outcomes in ischemic stroke mice by modulation of astrocytic lipid metabolism. Acta Pharmacol Sin. 2025;46(8):2120–35. doi:10.1038/s41401-025-01505-x. [Google Scholar] [PubMed] [CrossRef]
19. Li X, Lyu J, Li R, Jain V, Shen Y, del Águila Á., et al. Single-cell transcriptomic analysis of the immune cell landscape in the aged mouse brain after ischemic stroke. J Neuroinflammation. 2022;19(1):83. doi:10.1186/s12974-022-02447-5. [Google Scholar] [PubMed] [CrossRef]
20. Jolivel V, Bicker F, Binamé F, Ploen R, Keller S, Gollan R, et al. Perivascular microglia promote blood vessel disintegration in the ischemic penumbra. Acta Neuropathol. 2015;129(2):279–95. doi:10.1007/s00401-014-1372-1. [Google Scholar] [PubMed] [CrossRef]
21. Dong X, Gao J, Zhang CY, Hayworth C, Frank M, Wang Z. Neutrophil membrane-derived nanovesicles alleviate inflammation to protect mouse brain injury from ischemic stroke. ACS Nano. 2019;13(2):1272–83. doi:10.1021/acsnano.8b06572. [Google Scholar] [PubMed] [CrossRef]
22. Li J, Kumari T, Barazia A, Jha V, Jeong SY, Olson A, et al. Neutrophil DREAM promotes neutrophil recruitment in vascular inflammation. J Exp Med. 2022;219(1):e20211083. doi:10.1084/jem.20211083. [Google Scholar] [PubMed] [CrossRef]
23. Zheng K, Lin L, Jiang W, Chen L, Zhang X, Zhang Q, et al. Single-cell RNA-seq reveals the transcriptional landscape in ischemic stroke. J Cereb Blood Flow Metab. 2022;42(1):56–73. doi:10.1177/0271678x211026770. [Google Scholar] [PubMed] [CrossRef]
24. Gullotta GS, de Feo D, Friebel E, Semerano A, Scotti GM, Bergamaschi A, et al. Age-induced alterations of granulopoiesis generate atypical neutrophils that aggravate stroke pathology. Nat Immunol. 2023;24(6):925–40. doi:10.1038/s41590-023-01505-1. [Google Scholar] [PubMed] [CrossRef]
25. Beliakov IS, Karakasheva TA, Mazurenko NN. Detection of LY6G6D gene exon-intron structure. Mol Biol. 2009;43(4):590–8. doi:10.1134/s0026893309040025. [Google Scholar] [CrossRef]
26. Batista-Duharte A, Hassouneh F, Alvarez-Heredia P, Pera A, Solana R. Immune checkpoint inhibitors for vaccine improvements: current status and new approaches. Pharmaceutics. 2022;14(8):1721. doi:10.3390/pharmaceutics14081721. [Google Scholar] [PubMed] [CrossRef]
27. Goyani P, Christodoulou R, Vassiliou E. Immunosenescence: aging and immune system decline. Vaccines. 2024;12(12):1314. doi:10.3390/vaccines12121314. [Google Scholar] [PubMed] [CrossRef]
28. Saito S, Okuno A, Maekawa T, Kobayashi R, Yamashita O, Tsujimura N, et al. Lymphocyte antigen 6 complex locus G6D downregulation is a novel parameter for functional impairment of neutrophils in aged mice. Front Immunol. 2022;13:1001179. doi:10.3389/fimmu.2022.1001179. [Google Scholar] [PubMed] [CrossRef]
29. Jung ES, Choi H, Mook-Jung I. Decoding microglial immunometabolism: a new frontier in Alzheimer’s disease research. Mol Neurodegener. 2025;20(1):37. doi:10.1186/s13024-025-00825-0. [Google Scholar] [PubMed] [CrossRef]
30. Monsorno K, Ginggen K, Ivanov A, Buckinx A, Lalive AL, Tchenio A, et al. Loss of microglial MCT4 leads to defective synaptic pruning and anxiety-like behavior in mice. Nat Commun. 2023;14(1):5749. doi:10.1038/s41467-023-41502-4. [Google Scholar] [PubMed] [CrossRef]
31. Cheng J, Dong Y, Ma J, Pan R, Liao Y, Kong X, et al. Microglial Calhm2 regulates neuroinflammation and contributes to Alzheimer’s disease pathology. Sci Adv. 2021;7(35):eabe3600. doi:10.1126/sciadv.abe3600. [Google Scholar] [PubMed] [CrossRef]
32. He D, Xu H, Zhang H, Tang R, Lan Y, Xing R, et al. Disruption of the IL-33-ST2-AKT signaling axis impairs neurodevelopment by inhibiting microglial metabolic adaptation and phagocytic function. Immunity. 2022;55(1):159–73.e9. doi:10.1016/j.immuni.2021.12.001. [Google Scholar] [PubMed] [CrossRef]
33. Kang S, Ko EY, Andrews AE, Shin JE, Nance KJ, Barman PK, et al. Microglia undergo sex-dimorphic transcriptional and metabolic rewiring during aging. J Neuroinflammation. 2024;21(1):150. doi:10.1186/s12974-024-03130-7. [Google Scholar] [PubMed] [CrossRef]
34. Tagliatti E, Desiato G, Mancinelli S, Bizzotto M, Gagliani MC, Faggiani E, et al. Trem2 expression in microglia is required to maintain normal neuronal bioenergetics during development. Immunity. 2024;57(1):86–105.e9. doi:10.1016/j.immuni.2023.12.002. [Google Scholar] [PubMed] [CrossRef]
35. Zhao RZ, Jiang S, Zhang L, Yu ZB. Mitochondrial electron transport chain, ROS generation and uncoupling. Int J Mol Med. 2019;44(1):3–15. [Google Scholar] [PubMed]
36. Wang HX, Luo JT, Tian WX, Yan WQ, Ge S, Zhang YH, et al. γ-Tocotrienol inhibits oxidative phosphorylation and triggers apoptosis by inhibiting mitochondrial complex I subunit NDUFB8 and complex II subunit SDHB. Toxicology. 2019;417:42–53. doi:10.1016/j.tox.2019.01.018. [Google Scholar] [PubMed] [CrossRef]
37. Zhao ZR, Ji JM, Ming L, Luo ZF, Li MY, Chen Y, et al. Direct peritoneal resuscitation and melatonin in the treatment of abdominal sepsis-induced lung injury via macrophage metabolic reprogramming. J Pineal Res. 2025;77(4):e70066. doi:10.1111/jpi.70066. [Google Scholar] [PubMed] [CrossRef]
38. Li GZ, Wang ZQ, Gao BX, Dai K, Niu XW, Li X, et al. ANKZF1 knockdown inhibits glioblastoma progression by promoting intramitochondrial protein aggregation through mitoRQC. Cancer Lett. 2024;591:216895. doi:10.1016/j.canlet.2024.216895. [Google Scholar] [PubMed] [CrossRef]
39. Katz Shroitman N, Yitzhaky A, Ben Shachar D, Gurwitz D, Hertzberg L. Meta-analysis of brain samples of individuals with schizophrenia detects down-regulation of multiple ATP synthase encoding genes in both females and males. J Psychiatr Res. 2023;158(22):350–9. doi:10.1016/j.jpsychires.2023.01.005. [Google Scholar] [PubMed] [CrossRef]
Cite This Article
 Copyright © 2025 The Author(s). Published by Tech Science Press.
This work is licensed under a Creative Commons Attribution 4.0 International License , which permits unrestricted use, distribution, and reproduction in any medium, provided the original work is properly cited.
 Downloads
 Citation Tools