
 Submit a Paper
 Propose a Special lssue
 Open Access
ARTICLE
Sailfish Optimizer with EfficientNet Model for Apple Leaf Disease Detection
1 Physical Therapy Department, Majmaah University, Majmaah, 11952, Saudi Arabia
2 Department of Computer Science and Information Systems, College of Applied Sciences, AlMaarefa University, Ad Diriyah, 13713, Riyadh, Saudi Arabia
3 Department of Natural and Applied Sciences, Faculty of Community College, Majmaah University, Majmaah, 11952, Saudi Arabia
4 School of Computing, Kalasalingam Academy of Research and Education, Krishnankoil, 626128, India
5 Department of Computer Sciences, College of Computer and Information Sciences, Princess Nourah bint Abdulrahman University, P.O.Box 84428, Riyadh, 11671, Saudi Arabia
6 Department of Computer Science, College of Science & Art at Mahayil, King Khalid University, 62529, Saudi Arabia
7 Faculty of Computer and IT, Sana’a University, Sana’a, 1247, Yemen
8 Department of Natural and Applied Sciences, College of Community - Aflaj, Prince Sattam Bin Abdulaziz University, Saudi Arabia
* Corresponding Author: Fahd N. Al-Wesabi. Email:
Computers, Materials & Continua 2023, 74(1), 217-233. https://doi.org/10.32604/cmc.2023.025280
Received 18 November 2021; Accepted 17 January 2022; Issue published 22 September 2022
 View Full Text
 Download PDF
Abstract
Recent developments in digital cameras and electronic gadgets coupled with Machine Learning (ML) and Deep Learning (DL)-based automated apple leaf disease detection models are commonly employed as reasonable alternatives to traditional visual inspection models. In this background, the current paper devises an Effective Sailfish Optimizer with EfficientNet-based Apple Leaf disease detection (ESFO-EALD) model. The goal of the proposed ESFO-EALD technique is to identify the occurrence of plant leaf diseases automatically. In this scenario, Median Filtering (MF) approach is utilized to boost the quality of apple plant leaf images. Moreover, SFO with Kapur's entropy-based segmentation technique is also utilized for the identification of the affected plant region from test image. Furthermore, Adam optimizer with EfficientNet-based feature extraction and Spiking Neural Network (SNN)-based classification are employed to detect and classify the apple plant leaf images. A wide range of simulations was conducted to ensure the effective outcomes of ESFO-EALD technique on benchmark dataset. The results reported the supremacy of the proposed ESFO-EALD approach than the existing approaches.Keywords
Agriculture is one of the primary sectors that contribute to economic development of a country. Being a backbone of country’s development, the sector faces a lot of challenges to survive. Plant disease is one such prominent challenge that causes disruption in agricultural crop production. However, this issue can be resolved through the adoption of advanced agricultural technologies [1]. Having said that, it is really hard to attain the goal, owing to lack of awareness, high cost, implementation challenges, etc. But, the costs incurred upon the technique can be decreased by employing image processing applications that make use of Deep Learning (DL) and Machine Learning (ML) methods. Identification of leaf disease using Artificial Intelligence (AI) technique [2] can result in high yield and uncompromised quality products compared to traditional disease detection techniques. Furthermore, leaf diseases tend to occur based on climate and survival conditions. At most of the times, leaf diseases are caused by fungi, viruses, and bacteria [3]. Apple is one of the most cultivated fruits around the globe and it possess high medicinal and nutritional values. But many diseases recurrently affect apple production on a massive scale which cause considerable economic loss. Hence, effective and timely recognition of apple leaf disease is a critical challenge to overcome for healthy growth of apples and increased production. Recently, it has become a hot research topic in agriculture [4]. There is a considerable increase observed in apple planting region and output in the recent years, thanks to its high nutritional content and economic value. But, apple plant leaf disease incur heavy loss in terms of production and economic activities. It reduces the quantity and quality of fruit industry outputs. Hence, it becomes necessary to have a precise detection method for apple leaf disease [5].
In general, visual inspection by professionals is the preferred method for diagnosing plant diseases for a long time. But it involves the risk for error, because of individual perceptions [6]. In such event, many imaging and spectroscopic methods have been investigated for plant disease detection. But there is a need exists for bulky sensors and precise instruments that produce high efficiency at low cost. With the popularity of digital cameras and electronic gadgets in recent years, automated plant disease detection using ML method is being extensively applied these days as an effective alternative [7]. Over the past few years, conventional ML techniques have made considerable progress in apple leaf diseases detection. DL techniques performed an extraordinary innovation in advanced Computer Vision (CV) systems, owing to the development of deep convolution network in AlexNet [8]. Further, it is also commonly employed in diagnosis and identification of plant disease, thanks to its excellent robustness and automated extraction of image features. Many authors have used DL method in the detection of apple leaf diseases.
In the study conducted by Zhong et al. [9], apple leaf image dataset that consists of 2462 images, belonging to six apple leaf diseases, was employed for method evaluation and data modeling. In this study, DenseNet-121 deep convolutional network, three regression techniques, focus loss function and multilabel classification were presented for the identification of apple leaf disease. Michalak et al. [10] introduced an apple leaf disease recognition technique based on pattern recognition methods and image and processing techniques. In this study, a colour conversion technique for the input Red, Green, and Blue (RGB) image was initially presented. Later RGB pattern was changed to grey, and Hue, Saturation, and Intensity (HSI) patterns. The background was detached according to certain threshold values. Later, the disease spot image was divided using Region Growing Algorithm (RGA). A total of 38 features, used for categorization, such as shape, colour, and texture was extracted from all the spot images. In order to enhance the precision of apple leaf disease diagnosis and decrease the dimensionality of feature space, only the effective features were chosen by integrating Correlation-based Feature Selection (CFS) and Genetic Algorithm (GA) methods. Lastly, the disease was detected using Support Vector Machine (SVM) classification method.
Jiang et al. [11] presented a DL method based on enhanced Convolutional Neural Network (CNN) method for real-time recognition of apple leaf disease. In this study, Apple Leaf Disease Data set (ALDD) was used to validate the proposed model. According to the authors, a novel apple leaf disease recognition method that employs Deep Convolutional Neural Network (DCNN) was presented in this study using Rainbow concatenation and GoogLeNet Inception model. Liu et al. [12] presented a precise detection methodology for apple leaf diseases based on DCNN model. It involves the designing of a new framework using DCNN-based AlexNet and generation of adequate pathological images to identify apple leaf disease. In Umamageswari et al. [13], a novel framework was proposed for the detection of plant leaf diseases. Initially, image contrast level was improved as well as overfitting and unwanted noise were detached. Then, fuzzy c-means based Chameleon Swarm Algorithm (FCM-CSA) was employed for the segmentation of plant leaf disease parts. Next, feature extraction was executed using a fast Grey Level Co-occurrence Matrix (GLCM) feature extraction method. Lastly, Progressive Neural Architecture Search (PNAS) was applied for the identification of plant diseases. Tahir et al. [14] presented a novel deep methodology for the classification of apple leaf diseases. Some of the most popular apple leaf diseases are apple cedar, Apple Scab (AS), and brown spot. After the feature was extracted using Transfer Learning (TL) method, the feature was down-sampled using a new variance-controlled method. Tiwari et al. [15] presented a DL-based method for detection and classification of plant diseases identified from leaf images captured in multiple resolutions. The dense CNN framework was trained on a massive plant leaf image datasets from several nations. The six yields, under 27 distinct classes, were taken in the presented method for both laboratory and on-field conditions into account.
The current research paper devises an Effective Sailfish Optimizer with EfficientNet based Apple Leaf Disease detection (ESFO-EALD) model. The proposed ESFO-EALD technique applies Median Filtering (MF) approach to boost the quality of apple plant leaf images. Moreover, SFO with Kapur's entropy-based segmentation technique is utilized in this study for identification of the affected plant region from test image. Furthermore, Adam optimizer with EfficientNet based feature extraction and Spiking Neural Network (SNN)-based classification are employed for both detection and classification of apple plant leaf images. A wide range of simulations was conducted to validate the effective outcomes of ESFO-EALD technique on benchmark dataset. The results established the supremacy of the proposed ESFO-EALD technique than existing approaches.
Rest of the paper is organized as follows. Section 2 introduces the proposed model, Section 3 validates the proposed model, and Section 4 concludes the work.
In this study, an effective ESFO-EALD technique has been developed for identification and classification of apple plant leaf images. The proposed ESFO-EALD method involves MF-based pre-processing, SFO using Kapur’s entropy-based segmentation, EfficientNet-based feature extraction, Adam optimizer-based hyperparameter tuning, and SNN-based classification. The utilization of ESFO-based threshold value selection and Adam optimizer-based hyperparameter selection help in accomplishing enhanced outcomes. Fig. 1 illustrates the overall process of ESFO-EALD technique.
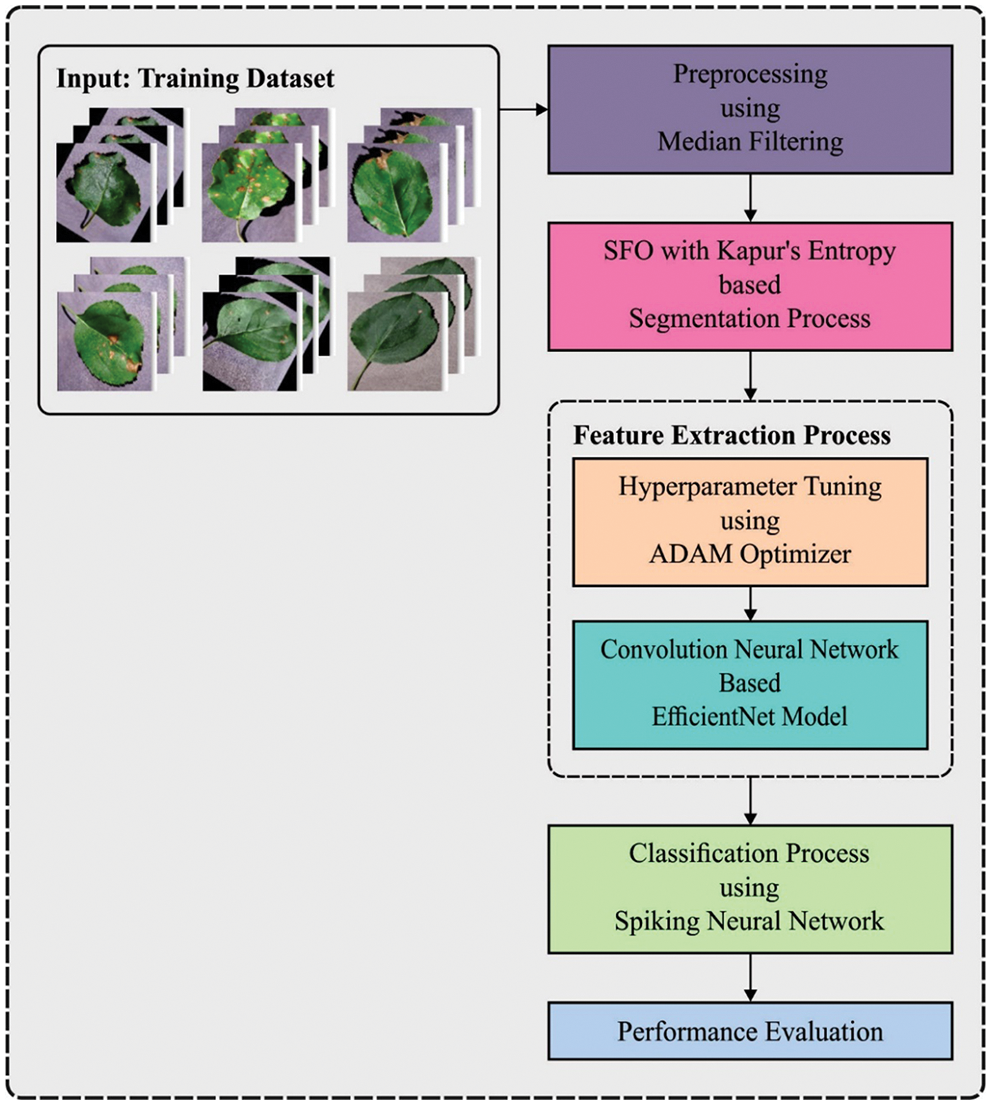
Figure 1: Overall process of ESFO-EALD technique
In this study, the researchers used benchmark plant disease dataset from Kaggle repository. The dataset includes images under four classes namely AS, Black Rot (BR), Cedar Rust (CR), and healthy (HY). Among these, AS dataset includes 2,016 trained images and 504 tested images. In line with this, BR dataset contains 1,987 trained images and 497 tested images. Moreover, CR dataset comprises of 1,760 trained images and 440 tested images. Furthermore, HY dataset includes 2,008 trained images and 502 tested images.
Primarily, MF technique gets rid of the noise present in apple plant leaf images. Being a non-linear method, it is effective in decreasing salt-and-pepper or impulsive noises. Further, it also conserves the edges in image effectively, while decreasing random noises. Salt-and pepper or impulsive noise tend to occur due to arbitrary bit error in transmission network. In median filter, the median intensity value of the pixel within the window and a window that slides alongside the image become the output intensity of pixels. Median filtering smoothens the image and is effective in noise reduction. On the contrary to low-pass filter, median filter could retain discontinuity in a step-wise manner and could smoothen some pixels with value that differs considerably from their surroundings without impacting other pixels.
2.3 ESFO with Kapur’s Entropy-Based Segmentation
During segmentation, SFO algorithm with Kapur’s entropy technique is used to identify the regions affected with plant disease. Kapur’s entropy approach is another thresholding method which is employed in the implementation of segmentation principle. Kapur’s method selects the optimum threshold value-based maximization of entropy. The arithmetical expression is shown in the following equation:
Here,
Let
Here, a vector that comprises of numerous thresholds is
The probability value occurrence
SFO is a new, nature-inspired meta-heuristic algorithm which is modelled after a group of hunting sailfish. It demonstrates a remarkable performance compared to commonly available meta-heuristic approaches. The location of
Here,
The parameter
Here,
The parameter
In this equation,
During early stage of the hunt, sardines do not get injured/tired and sailfish remain energetic. Sardine can rapidly escape the hunting scene. But, with constant hunting, the strength of sailfish attacks gets reduced gradually. In the meantime, sardines get tired and their awareness about the position of sailfish also gets reduced. As a consequence, the sardine is hunted. According to the algorithmic procedure, the novel location of sardine
Now,
The parameter
While
Let
whereas
2.4 Optimal EfficientNet Based Feature Extraction
After segmentation process, the next stage is the generation of useful collection of feature vectors. EfficientNet is a kind of CNN which effectively scales up based on input resolution, layer depth, layer width, and the integration of each factor. It is an advanced DL method that heavily focuses on improving the accuracy and efficiency of the model. It has different versions in the range of B0 to B7. The basic component is MBConv in which the excitation and compression optimization are included. Such block creates shortcuts between the starting and ending points of convolution blocks. The input activation map is extended by 1 × 1 convolution to increase the depth of feature map. The shortcut connection is utilized in this method to link the narrow layer together, when a wider layer is situated between the jump links. Fig. 2 illustrates the Efficientnet structure layer [18]. This framework helps in reducing the size and overall amount of essential transactions. Adam optimizer is used to choose the hyperparameters of EfficientNet model proficiently.
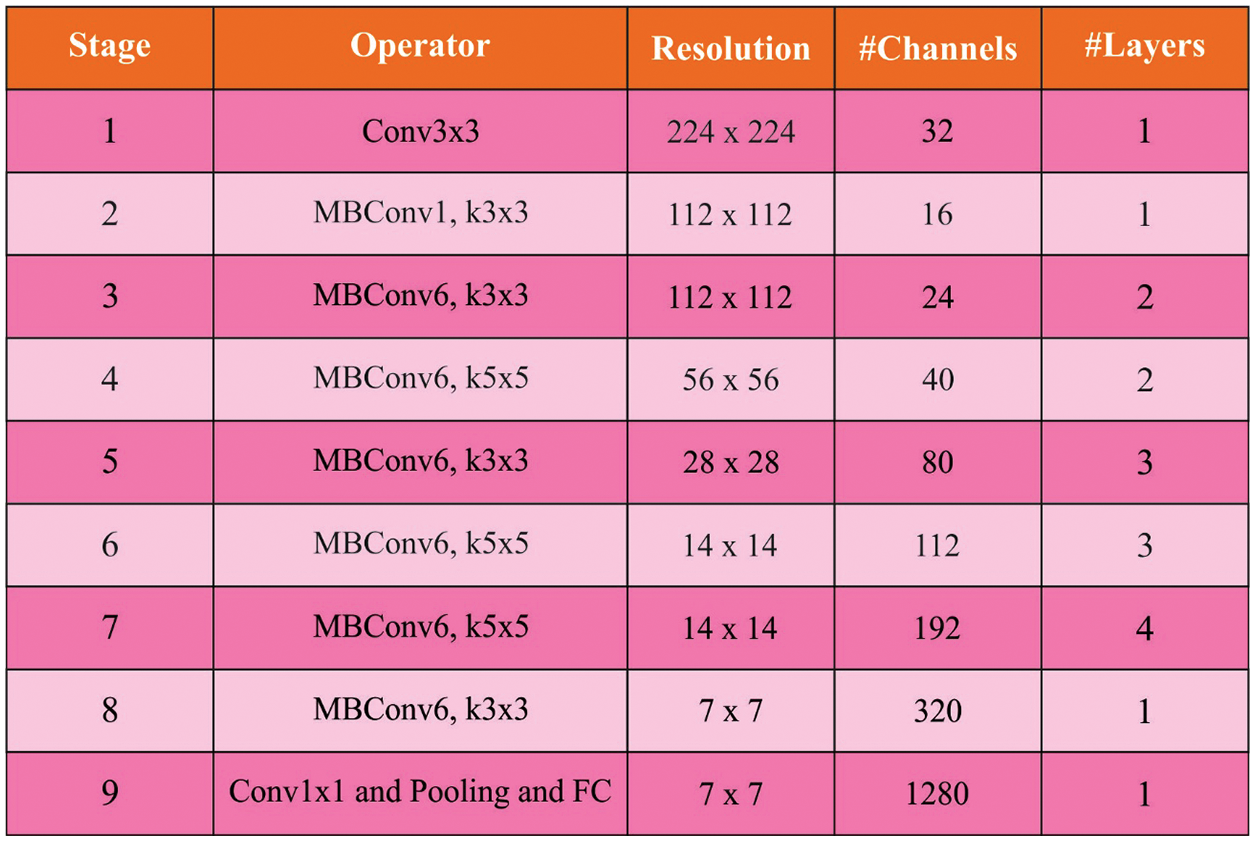
Figure 2: Layer of efficientnet structure
DL frequently consumes much time and computer resources to train. Thus, optimization techniques are extremely apprehensive. Adam's (adaptive momentum) technique consumes less resources and creates the method convergence earlier. This in turn accelerates the learning speed and enhance the effects. Adam optimizer is a 1st-order optimization approach which changes the conventional stochastic gradient descent procedure. It connects the 2nd moment evaluation on fundamental momentum of 1st-order moment evaluation and increases a moment to Adadelta. The rate of learning for all the parameters gets dynamically modified with the help of 1st and 2nd moment’s evaluation of gradients [19]. The bias correction also occurs which further creates the parameters that are comparatively stable.
The iterative equations are as follows:
where
In this last stage, SNN model is utilized as a classifier to allot proper class labels. SNN method is employed for analyzing the learning process and network dynamic features. Assume that
where
The presented method is employed for image classification and recognition issues. In coding phase, the latency-phase encoding technique is utilized for transforming the pixels of respective image fields into accurately-timed spike train. Here, the spike train is employed to represent the outside image stimuli data. At the time of learning phase, all the spike trains correspond to input neurons and become the input to SNN. The synaptic weight can be learned using supervised multiple spike learning model. The SNN provides the output for the targeted spike patterns of the provided image.
The performance validation of the proposed ESFO-EALD technique was conducted using benchmark plant disease dataset [21] and the current section details the same with results. The results were investigated under three test runs. A few sample images are demonstrated in Fig. 3.
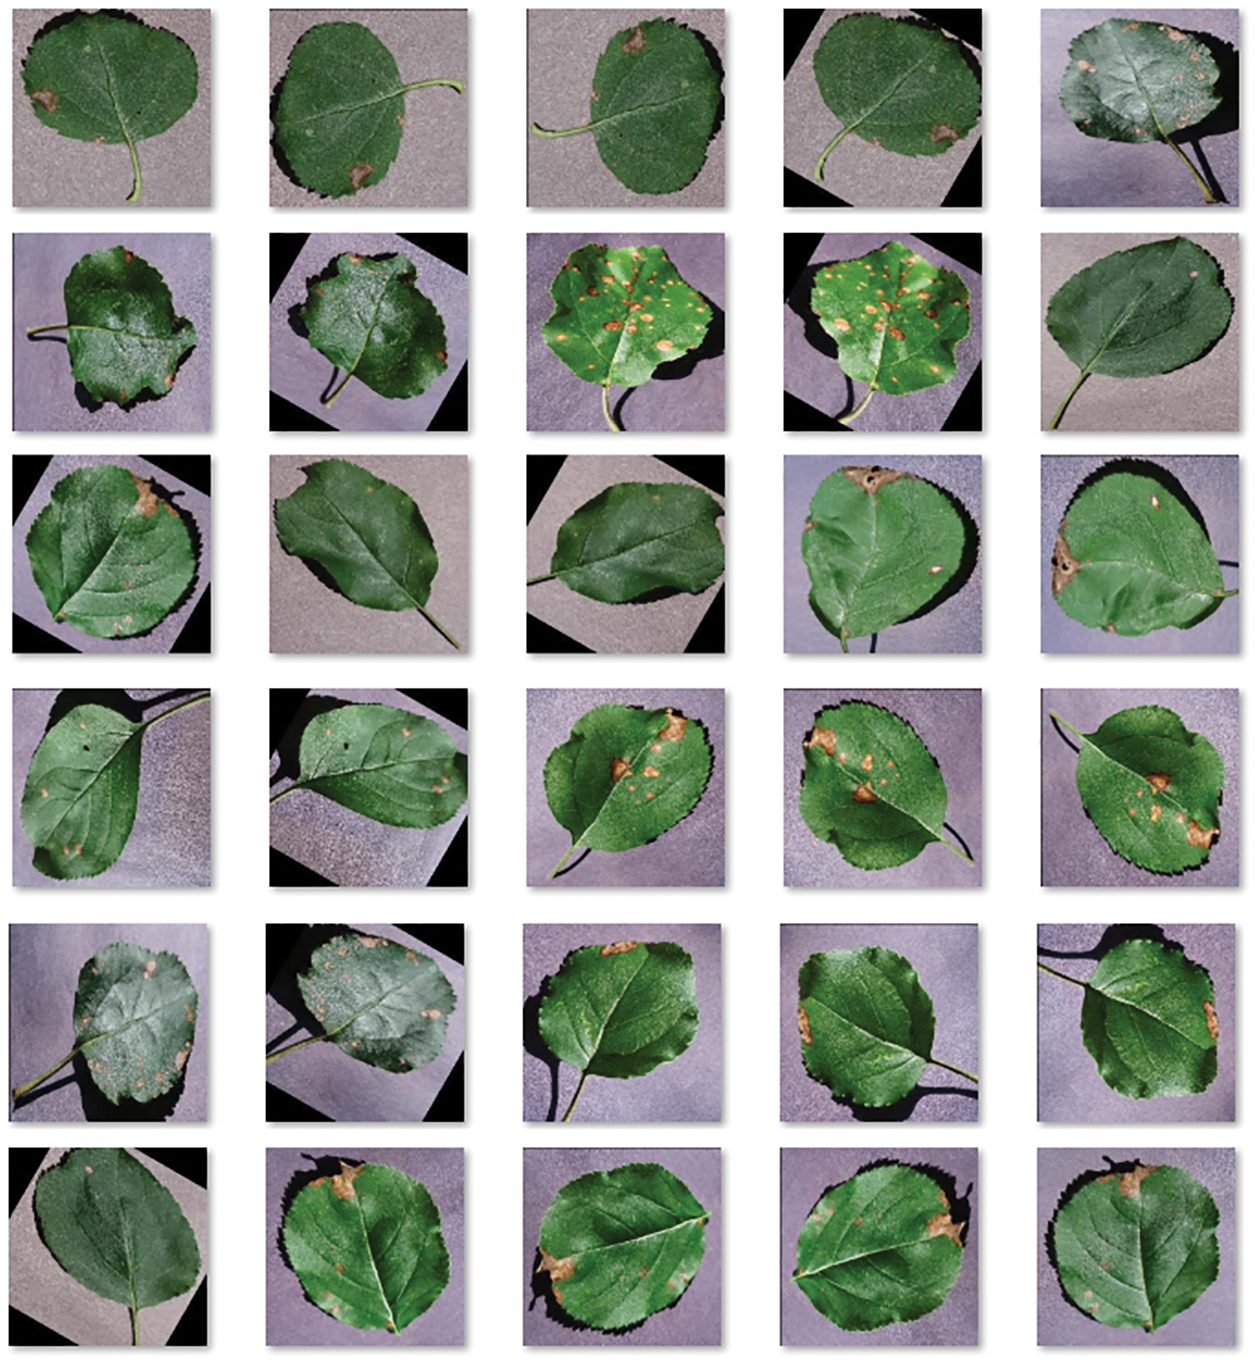
Figure 3: Sample images
The confusion matrix generated by ESFO-EALD technique on test dataset under run-2 is shown in Fig. 4. It is noticed that ESFO-EALD technique categorized 497 images under AS, 488 images under BR, 438 images under CR, and 496 images under HY.
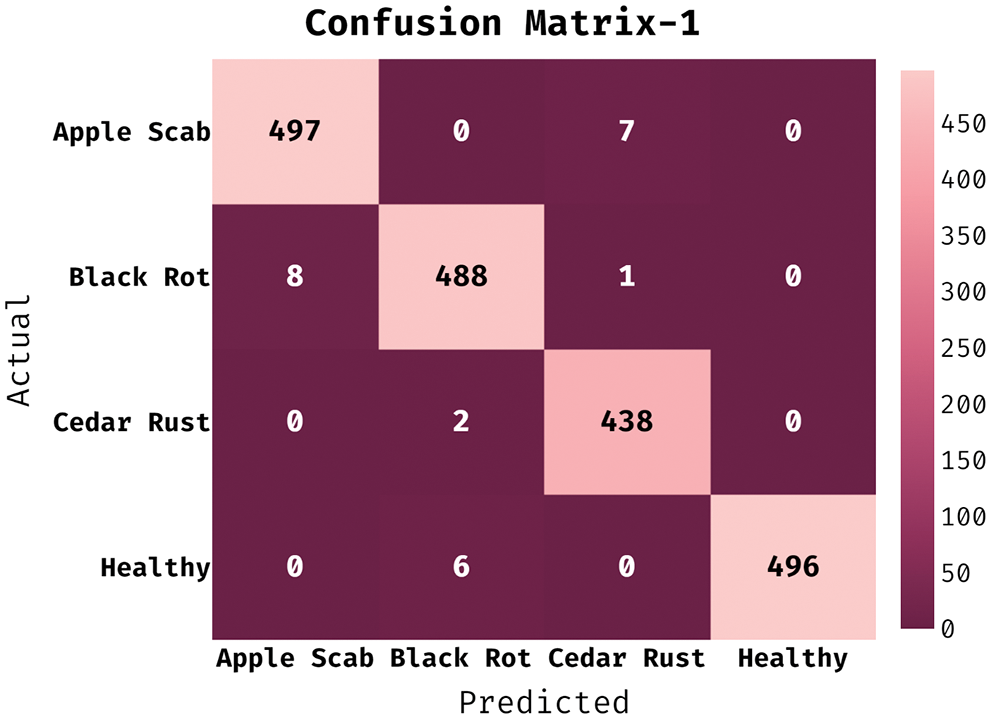
Figure 4: Confusion matrix of ESFO-EALD method on run-1
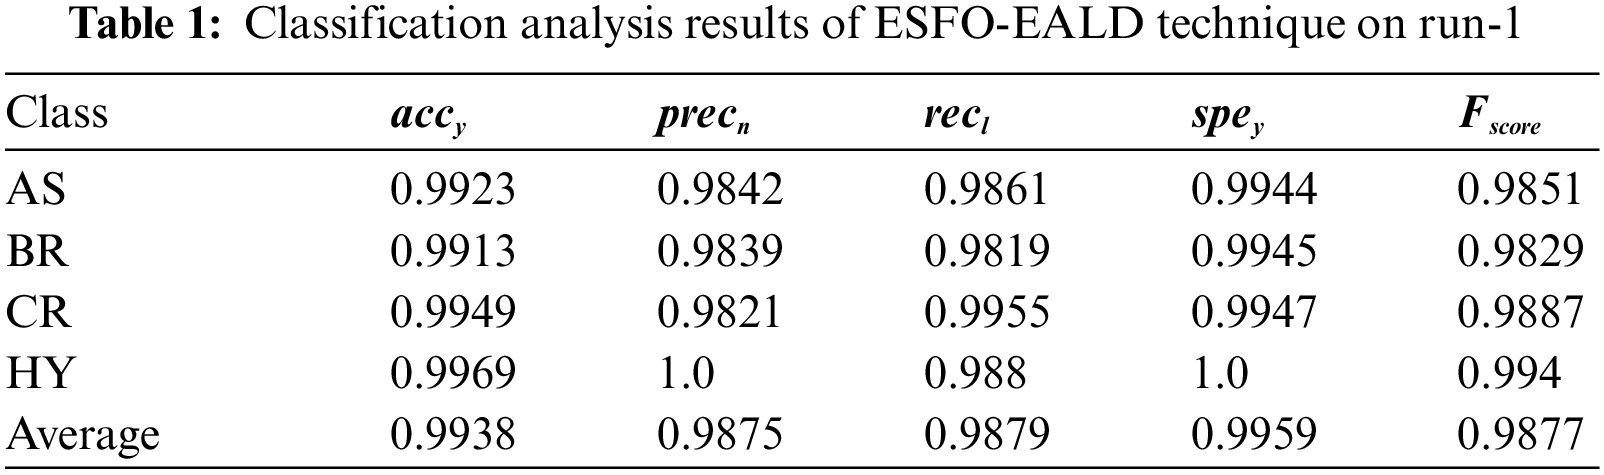
Tab. 1 offers a detailed overview of the results of classification analysis accomplished by ESFO-EALD technique on test run-1. The results demonstrate that ESFO-EALD technique identified the instances under AS class with
The confusion matrix generated by ESFO-EALD system on test dataset under run-2 is depicted in Fig. 5. It is clear that the proposed ESFO-EALD approach categorized 494 images under AS, 490 images under BR, 437 images under CR, and 496 images under HY.
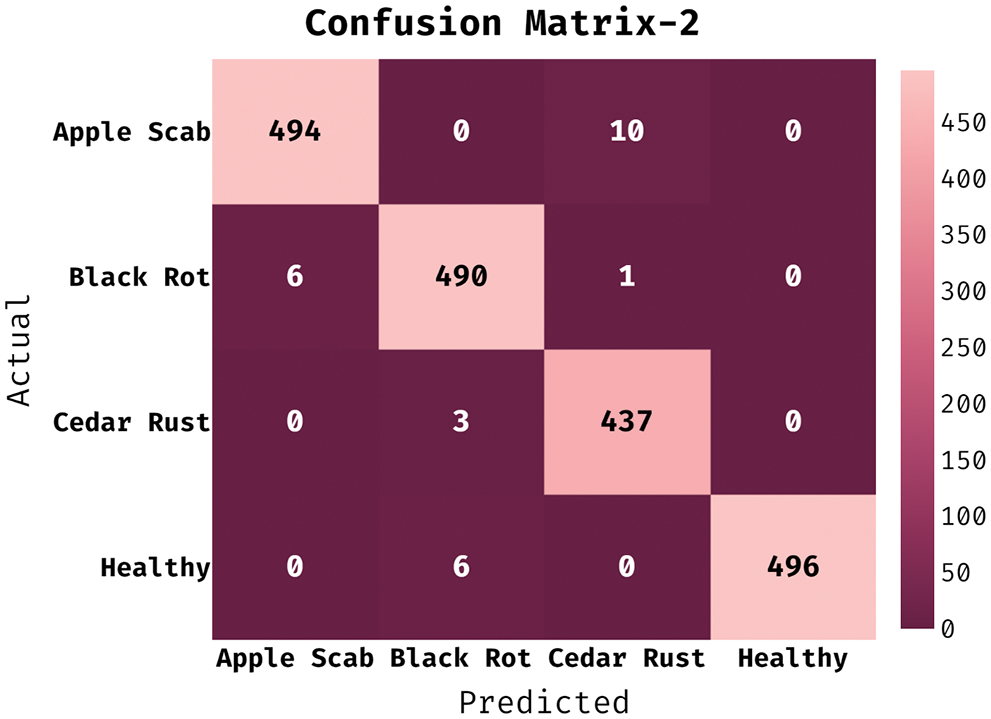
Figure 5: Confusion matrix of ESFO-EALD method on run-3
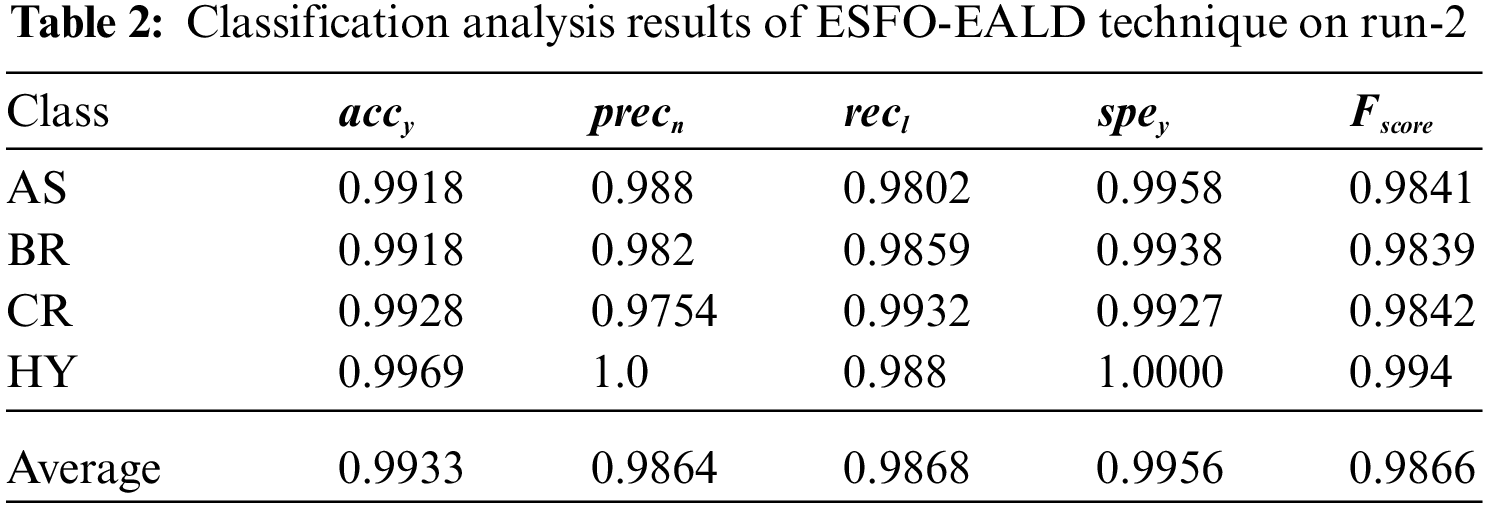
Tab. 2 portrays the results of classification analysis attained by ESFO-EALD method on test run-2. The outcomes portray that ESFO-EALD method categorized the instances under AS class with
The confusion matrix generated by the proposed ESFO-EALD approach on test dataset under run-3 is depicted in Fig. 6. It is observed that ESFO-EALD system categorized 497 images under AS, 490 images under BR, 437 images under CR, and 498 images under HY.

Figure 6: Confusion matrix of ESFO-EALD method on run-3
Tab. 3 provides a brief overview of results from classification analysis accomplished by ESFO-EALD method on test run-3. The outcomes show that ESFO-EALD algorithm categorized the instances under AS class with
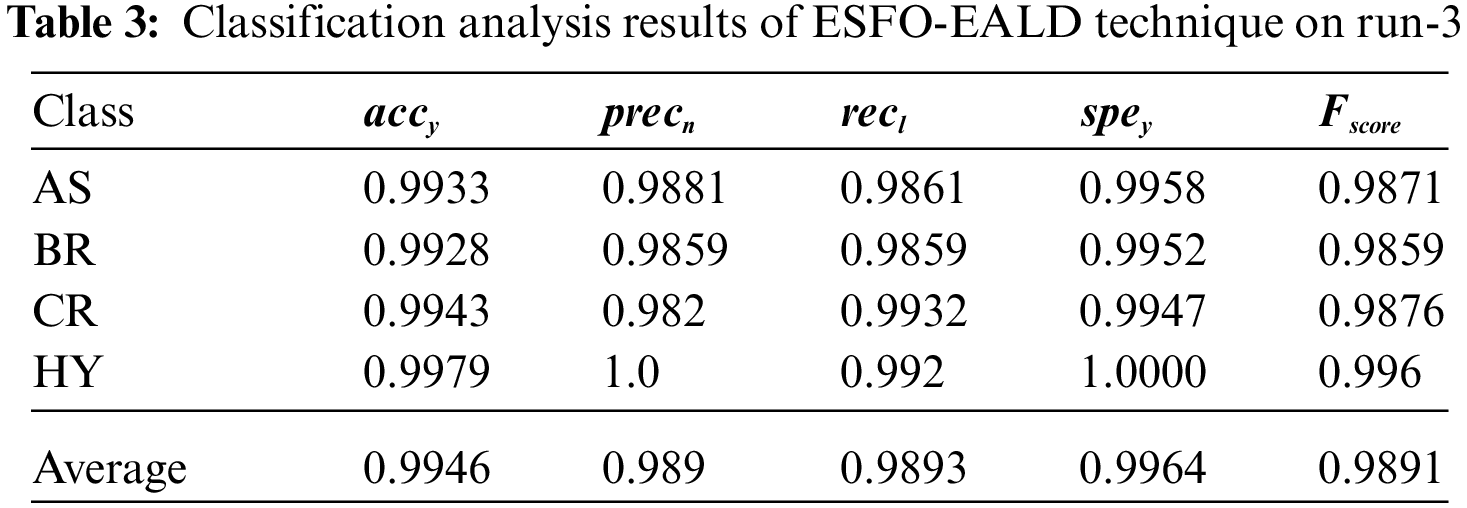
Fig. 7 shows the results of accuracy analysis achieved by ESFO-EALD technique under different number of epochs. The figure exposes that the proposed ESFO-EALD system improved both training and validation accuracies with increase in the number of epochs.
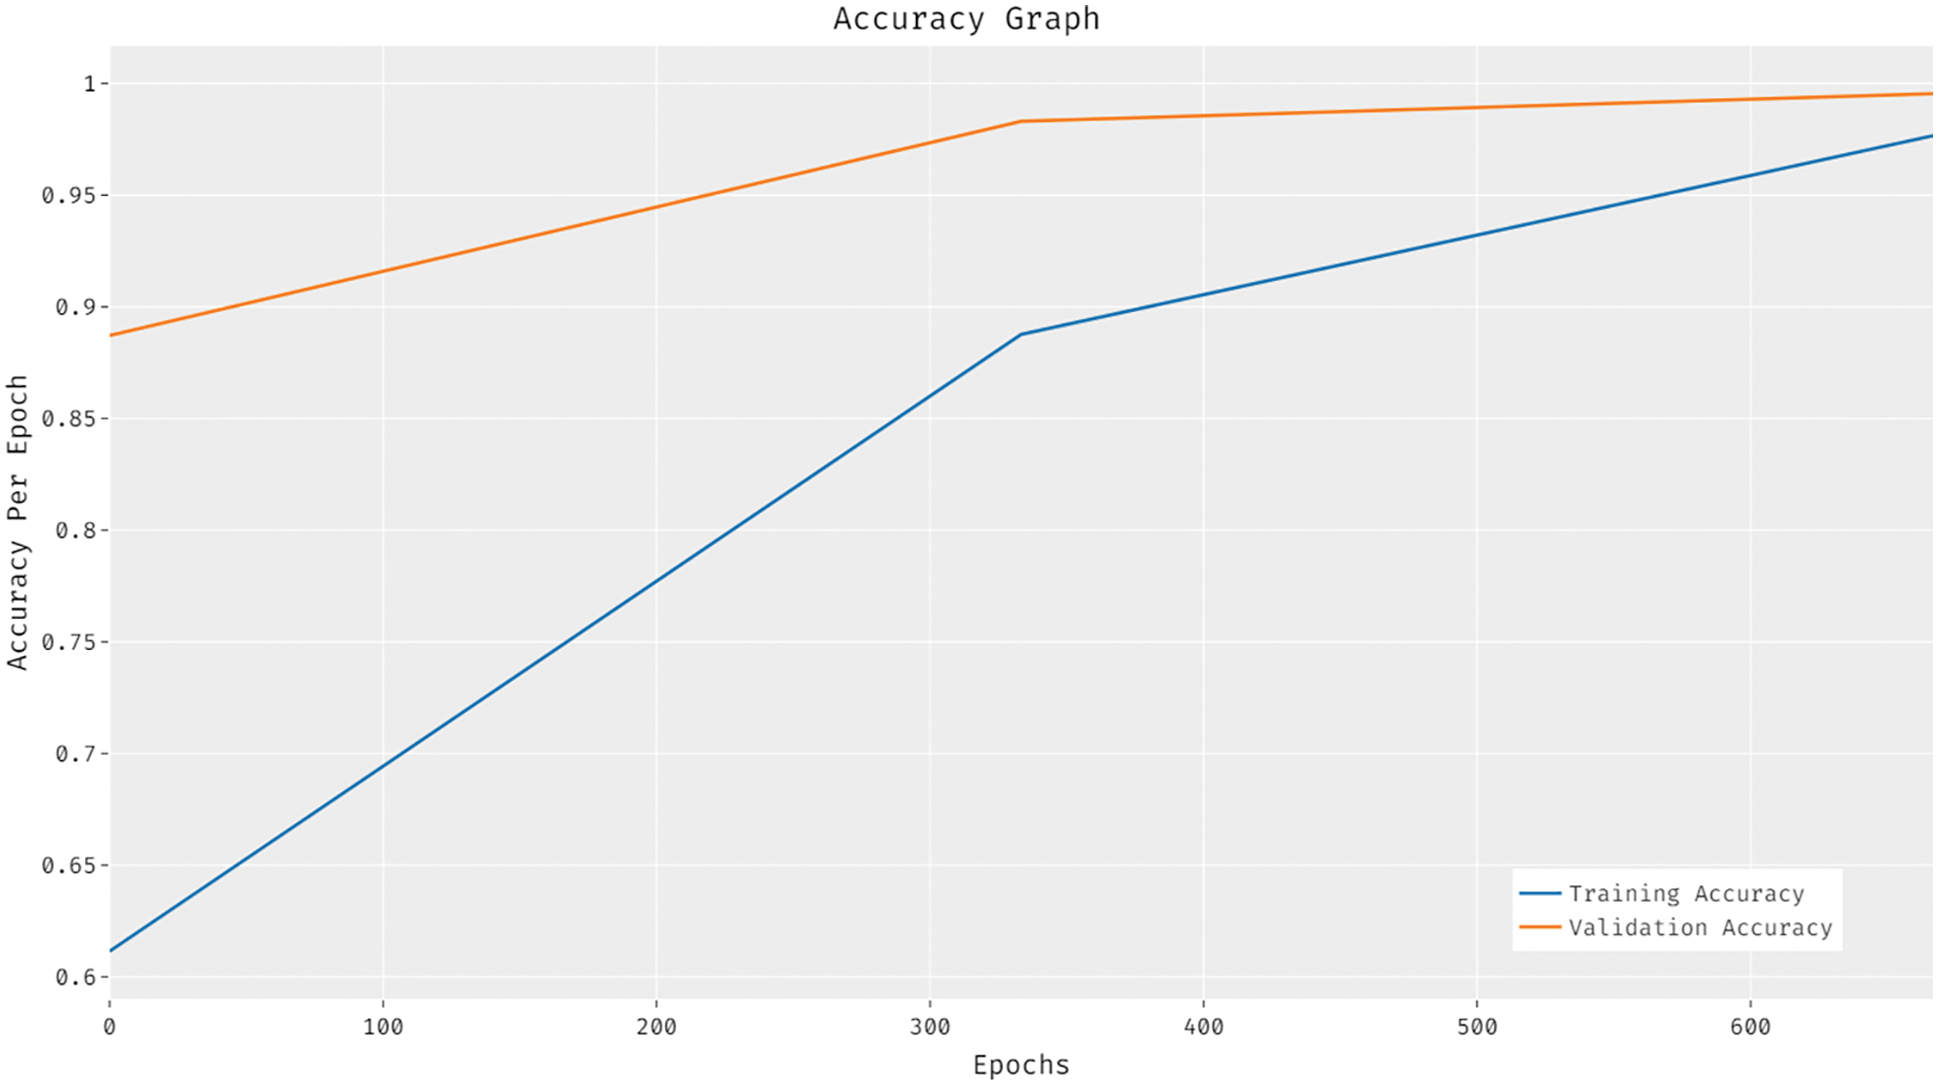
Figure 7: Accuracy graph analysis results of ESFO-EALD technique
Fig. 8 portrays the loss analysis results accomplished by ESFO-EALD manner under distinct number of epochs. The figure reveals that ESFO-EALD method gained low training and validation accuracies with increasing number of epochs. Tab. 4 demonstrates the results accomplished by ESFO-EALD algorithm in memory space and training time analysis.

Figure 8: Loss graph analysis of ESFO-EALD technique
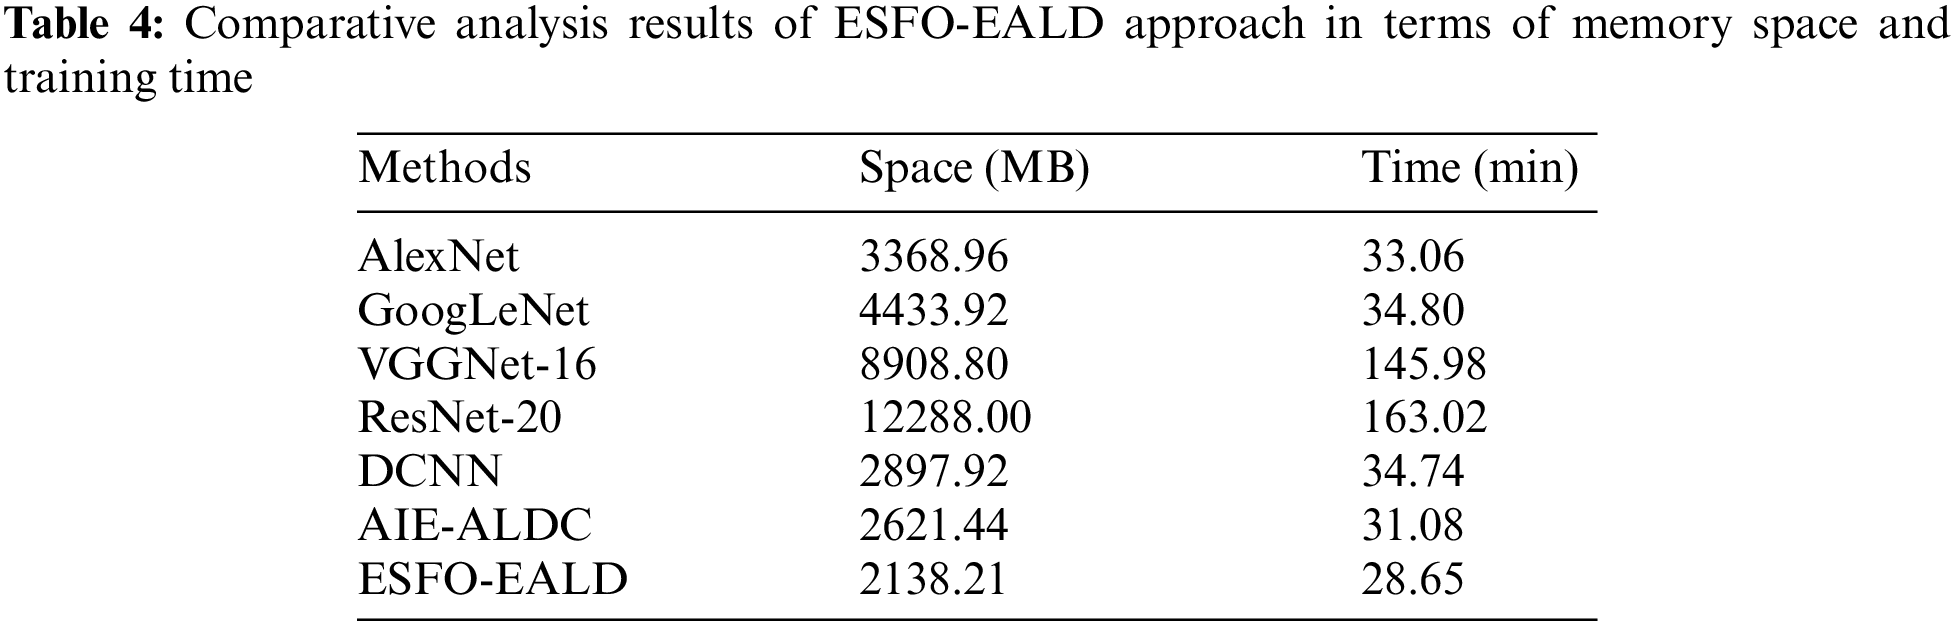
Fig. 9 demonstrates the results achieved by ESFO-EALD system against other methods in terms of memory space analysis. The results show that visual geometry group (VGGNet)-16 and ResNet-16 models accomplished heavy memory spaces such as 8908.80 and 12288.00 MB respectively. In line with these, both AlexNet and GoogleNet approaches obtained somewhat reduced memory space of 3368.96 and 4433.92 MB respectively. Moreover, DCNN and AI-enabled Apple Leaf Disease Classification (AIE-ALDC) techniques gained considerable memory spaces such as 2897.92 and 2621.44 MB respectively. However, the presented ESFO-EALD technique gained the least memory space of 2138.21 MB.

Figure 9: Memory space analysis results of ESFO-EALD approach
Fig. 10 shows the results of training time analysis accomplished by ESFO-EALD method against other systems. The outcomes depict that both VGGNet-16 and ResNet-16 approaches took lengthy training times such as 145.98 and 163.02 min correspondingly. Also, GoogleNet and DCNN systems obtained somewhat reduced training times such as 34.80 and 34.74 min correspondingly. Afterward, AlexNet and AIE-ALDC methods took considerable training times such as 33.06 and 31.08 min correspondingly. However, the presented ESFO-EALD technique consumed a minimum training time of 28.65 min.
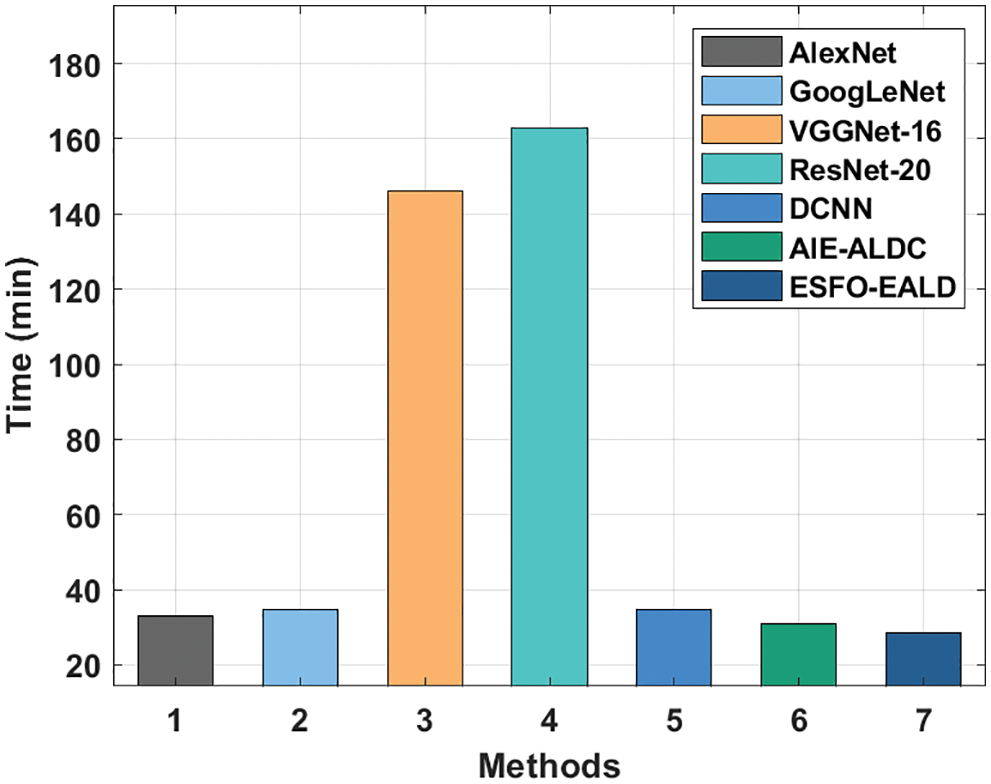
Figure 10: Training time analysis results of ESFO-EALD method
Finally, a detailed comparative
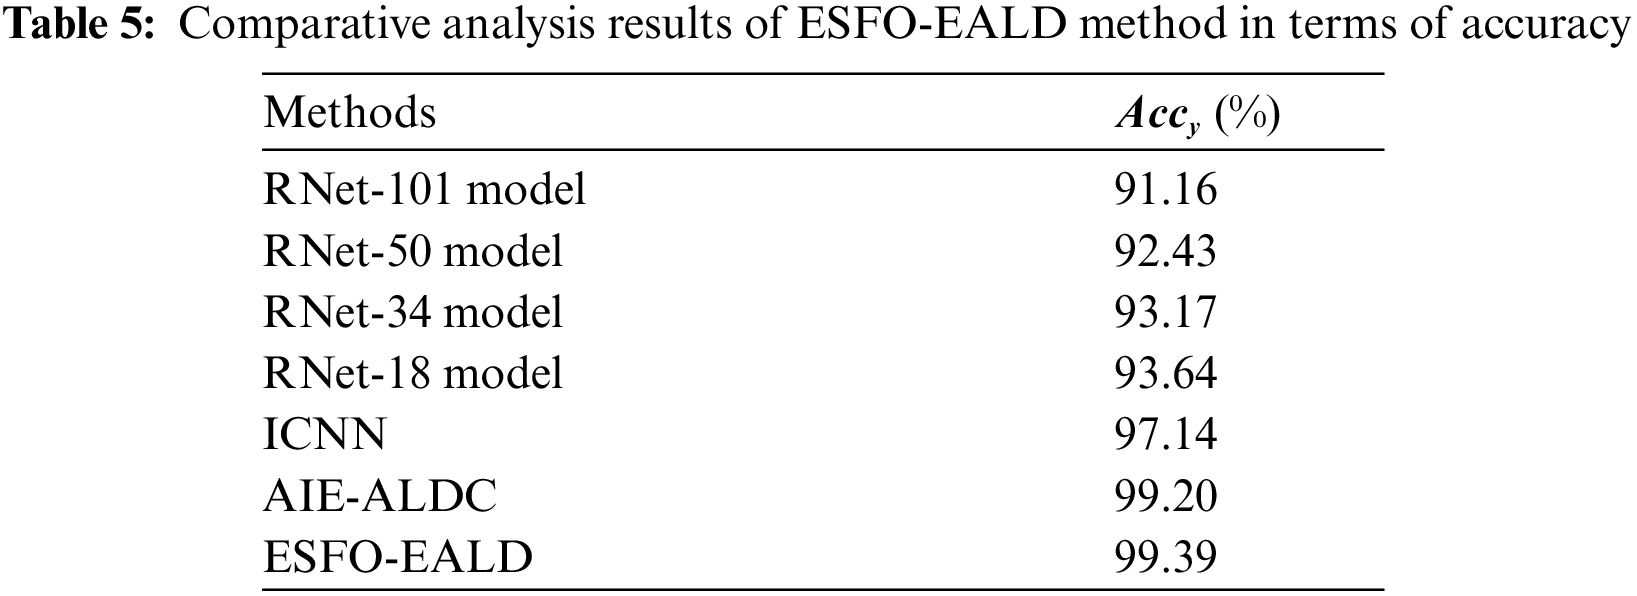
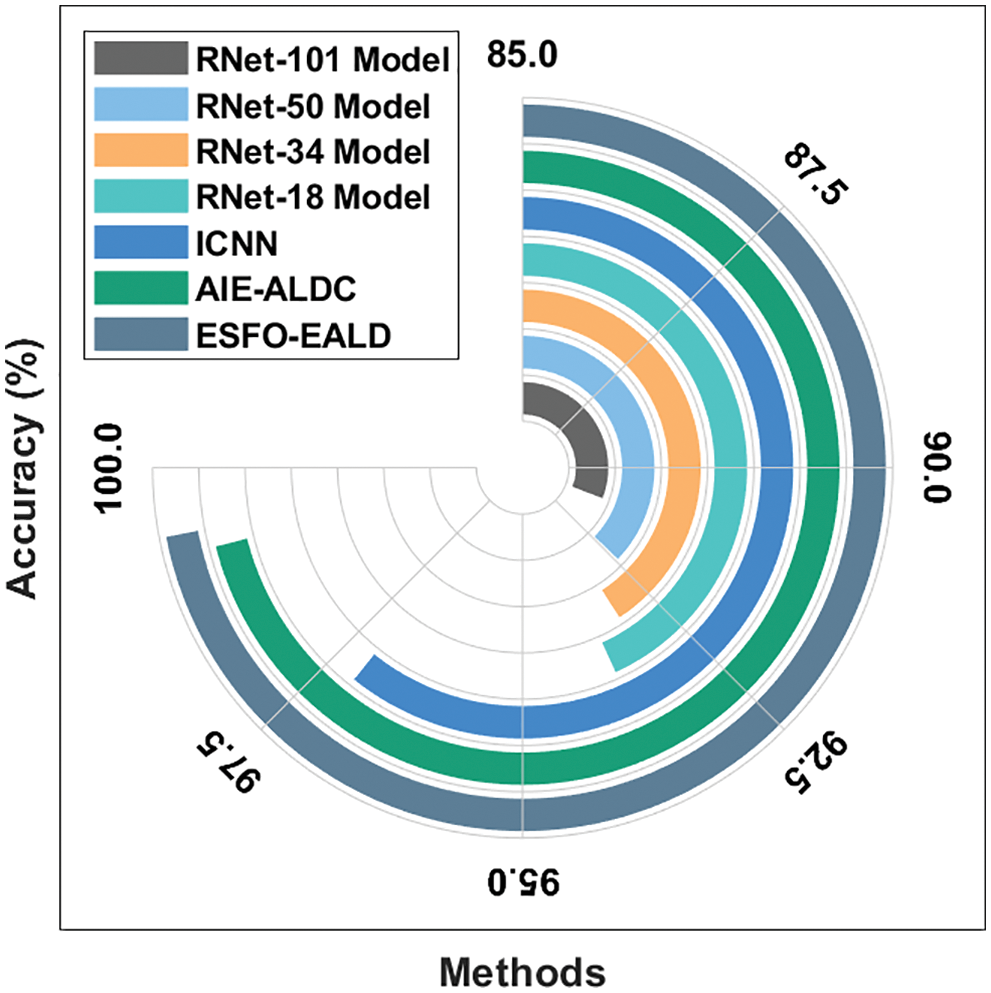
Figure 11: Comparative analysis results of ESFO-EALD method in terms of accuracy
In this study, an effective ESFO-EALD technique is developed for identification and classification of apple plant leaf images. The proposed ESFO-EALD approach includes MF-based preprocessing, ESFO with Kapur’s entropy-based segmentation, EfficientNet-based Feature extraction, Adam optimizer-based hyperparameter tuning, and SNN-based classification. The utilization of SFO-based threshold value selection and Adam optimizer-based hyperparameter selection helps in accomplishing enhanced outcomes. A wide range of simulations was conducted to validate the effective outcomes of ESFO-EALD technique on benchmark dataset. The results showcased the betterment of ESFO-EALD technique over recent state-of-the-art approaches. So, it can be concluded that ESFO-EALD technique can be utilized as a proficient tool in detection of plant diseases. In future, the detection performance can be boosted using advanced DL approaches.
Funding Statement: The authors extend their appreciation to the Deanship of Scientific Research at King Khalid University for funding this work under grant number (RGP 2/209/42).
Princess Nourah bint Abdulrahman University Researchers Supporting Project number (PNURSP2022R191), Princess Nourah bint Abdulrahman University, Riyadh, Saudi Arabia.
Conflicts of Interest: The authors declare that they have no conflicts of interest to report regarding the present study.
References
1. F. Tongke, “Research on crop leaf disease identification method based on LM-BP neural network,” E3S Web of Conferences, vol. 131, no. 2, pp. 1118, 2019. [Google Scholar]
2. M. Dutot, L. M. Nelson and R. C. Tyson, “Predicting the spread of postharvest disease in stored fruit, with application to apples,” Postharvest Biology and Technology, vol. 85, pp. 45–56, 2013. [Google Scholar]
3. A. K. Mahlein, T. Rumpf, P. Welke, H. W. Dehne, L. Plümer et al., “Development of spectral indices for detecting and identifying plant diseases,” Remote Sensing of Environment, vol. 128, pp. 21–30, 2013. [Google Scholar]
4. L. Yuan, Y. Huang, R. W. Loraamm, C. Nie, J. Wang et al., “Spectral analysis of winter wheat leaves for detection and differentiation of diseases and insects,” Field Crops Research, vol. 156, pp. 199–207, 2014. [Google Scholar]
5. F. Qin, D. Liu, B. Sun, L. Ruan, Z. Ma et al., “Identification of alfalfa leaf diseases using image recognition technology,” PLOS ONE, vol. 11, no. 12, pp. e0168274, 2016. [Google Scholar]
6. J. Ma, K. Du, F. Zheng, L. Zhang, Z. Gong et al., “A recognition method for cucumber diseases using leaf symptom images based on deep convolutional neural network,” Computers and Electronics in Agriculture, vol. 154, pp. 18–24, 2018. [Google Scholar]
7. S. D. Khirade and A. B. Patil, “Plant disease detection using image processing,” in 2015 International Conference on Computing Communication Control and Automation, Pune, India, pp. 768–771, 2015. [Google Scholar]
8. D. A. Bashish, M. Braik and S. B. Ahmad, “Detection and classification of leaf diseases using K-means-based segmentation and neural-networks-based classification,” Information Technology Journal, vol. 10, no. 2, pp. 267–275, 2011. [Google Scholar]
9. Y. Zhong and M. Zhao, “Research on deep learning in apple leaf disease recognition,” Computers and Electronics in Agriculture, vol. 168, pp. 105146, 2020. [Google Scholar]
10. K. Michalak and H. Kwasnicka, “Correlation based feature selection method,” International Journal of Bio-Inspired Computation, vol. 2, no. 5, pp. 319, 2010. [Google Scholar]
11. P. Jiang, Y. Chen, B. Liu, D. He and C. Liang, “Real-time detection of apple leaf diseases using deep learning approach based on improved convolutional neural networks,” IEEE Access, vol. 7, pp. 59069–59080, 2019. [Google Scholar]
12. B. Liu, Y. Zhang, D. He and Y. Li, “Identification of apple leaf diseases based on deep convolutional neural networks,” Symmetry, vol. 10, no. 1, pp. 11, 2017. [Google Scholar]
13. A. Umamageswari, N. Bharathiraja and D. S. Irene, “A novel fuzzy c-means based chameleon swarm algorithm for segmentation and progressive neural architecture search for plant disease classification,” ICT Express, pp. S2405959521001090, 2021. [Google Scholar]
14. M. B. Tahir, M. A. Khan, K. Javed, S. Kadry, Y. D. Zhang et al., “Recognition of apple leaf diseases using deep learning and variances-controlled features reduction,” Microprocessors and Microsystems, pp. 104027, 2021. [Google Scholar]
15. V. Tiwari, R. C. Joshi and M. K. Dutta, “Dense convolutional neural networks based multiclass plant disease detection and classification using leaf images,” Ecological Informatics, vol. 63, pp. 101289, 2021. [Google Scholar]
16. E. H. Houssein, M. M. Emam and A. A. Ali, “An efficient multilevel thresholding segmentation method for thermography breast cancer imaging based on improved chimp optimization algorithm,” Expert Systems with Applications, vol. 185, pp. 115651, 2021. [Google Scholar]
17. M. Li, Y. Li, Y. Chen and Y. Xu, “Batch recommendation of experts to questions in community-based question-answering with a sailfish optimizer,” Expert Systems with Applications, vol. 169, pp. 114484, 2021. [Google Scholar]
18. X. Cui, D. Wang and Z. J. Wang, “Multi-scale interpretation model for convolutional neural networks: Building trust based on hierarchical interpretation,” IEEE Transactions on Multimedia, vol. 21, no. 9, pp. 2263–2276, 2019. [Google Scholar]
19. X. Jiang, B. Hu, S. C. Satapathy, S. H. Wang and Y. D. Zhang, “Fingerspelling identification for chinese sign language via alexnet-based transfer learning and adam optimizer,” Scientific Programming, vol. 2020, no. 3, pp. 1–13, 2020. [Google Scholar]
20. D. Liu and S. Yue, “Video-based disguise face recognition based on deep spiking neural network,” in 2018 International Joint Conference on Neural Networks (IJCNN), Rio de Janeiro, pp. 1–8, 2018. [Google Scholar]
21. https://www.kaggle.com/vipoooool/new-plant-diseases-dataset/data#. [Google Scholar]
22. F. N. A. Wesabi, A. A. Albraikan, A. M. Hilal, M. M. Eltahir, M. A. Hamza et al., “Artificial intelligence enabled apple leaf disease classification for precision agriculture,” Computers, Materials & Continua, vol. 70, no. 3, pp. 6223–6238, 2022. [Google Scholar]
Cite This Article
 Copyright © 2023 The Author(s). Published by Tech Science Press.
This work is licensed under a Creative Commons Attribution 4.0 International License , which permits unrestricted use, distribution, and reproduction in any medium, provided the original work is properly cited.
 Downloads
 Citation Tools