
 Submit a Paper
 Propose a Special lssue
 Open Access
ARTICLE
Identification and Visualization of Spatial and Temporal Trends in Textile Industry
1 Department of Computer Science, National Textile University, Faisalabad, 38000, Pakistan
2 Department of Computer Science and Software Engineering, International Islamic University, Islamabad, 44000, Pakistan
3 Department of Computer Science, COMSATS University Islamabad, Islamabad, 45550, Pakistan
4 Department of Information and Communication Engineering, Yeungnam University, Gyeongsan, 38541, Korea
5 Faculty of Engineering, Uni de Moncton, Moncton, NB E1A3E9, Canada
6 International Institute of Technology and Management, Commune d'Akanda, BP, Libreville, 1989, Gabon
7 School of Electrical Engineering, Department of Electrical and Electronic Eng. Science, University of Johannesburg, Johannesburg, 2006, South Africa
8 Spectrum of Knowledge Production & Skills Development, Sfax, 3027, Tunisia
* Corresponding Author: Muhammad Shafiq. Email:
Computers, Materials & Continua 2023, 74(2), 4165-4181. https://doi.org/10.32604/cmc.2023.026607
Received 31 December 2021; Accepted 04 March 2022; Issue published 31 October 2022
 View Full Text
 Download PDF
Abstract
The research volume increases at the study rate, causing massive text corpora. Due to these enormous text corpora, we are drowning in data and starving for information. Therefore, recent research employed different text mining approaches to extract information from this text corpus. These proposed approaches extract meaningful and precise phrases that effectively describe the text's information. These extracted phrases are commonly termed keyphrases. Further, these key phrases are employed to determine the different fields of study trends. Moreover, these key phrases can also be used to determine the spatiotemporal trends in the various research fields. In this research, the progress of a research field can be better revealed through spatiotemporal bibliographic trend analysis. Therefore, an effective spatiotemporal trend extraction mechanism is required to disclose textile research trends of particular regions during a specific period. This study collected a diversified dataset of textile research from 2011–2019 and different countries to determine the research trend. This data was collected from various open access journals. Further, this research determined the spatiotemporal trends using quality phrase mining. This research also focused on finding the research collaboration of different countries in a particular research subject. The research collaborations of other countries’ researchers show the impact on import and export of those countries. The visualization approach is also incorporated to understand the results better.Keywords
Scientific knowledge is rapidly growing, making rich data sources available [1]. However, data is available in the amorphous form, making it difficult for researchers to find the required information of their interest. Significantly, new researchers had more difficulties in searching for relevant data. Moreover, many stakeholders need to discover innovations and the latest trends to make better decisions in real-time [2]. The text mining approach provides a solution to this problem. Text mining is a flexible approach applicable in many fields of research. Text mining approaches are used for finding valuable and exciting information from massive text corpora. Text mining approaches automatically extract semantically meaningful data from a document. Furthermore, text mining approaches are used to extract essential words and phrases known as keywords and keyphrases.
Previously, many text and phrase mining approaches were used for text analysis. Keyphrase extraction approaches are more important. However, the state-of-the-art keyword and keyphrase extraction approach attained more attention. The phrase is considered more informative than a word because the words mainly direct to a specific meaning. Moreover, N-gram phrase extraction is also critical for determining frequent and interesting patterns from massive text corpora [3–5]. Therefore, phrase mining constitutes an essential approach to choosing enormous text topics, social events, and keyphrases.
Many statistical text mining approaches are used for keyword and keyphrase extraction but still have limitations while working with large and complex datasets [6]. Graph-based techniques are used for phrase extraction. The graph-based approach builds a node of words, and frequent phrases are selected from influenced nodes. These approaches improved the quality of keyphrase extraction but still have limitations concerning the semantic meaning of the word or phrase [7,8]. Machine learning approaches performed better than previous approaches for keyphrase extraction because these approaches use a user training model. The training model consists of hand-crafted user data that have semantic meaning. Many machine learning approaches are used for keyphrase extraction, but the quality phrase mining approach performs better in machine learning approaches. A quality phrase gives semantic meaning in the collection of textual data. The phrase would be encountered as a quality phrase if a phrase had four characteristics: famous, complete, concordance, and informative. Frequency is one of the significant aspects of quality phrase mining. If the phrase is not frequent in the document, it is not considered a quality phrase [9].
This research is focused on determining spatiotemporal trends. According to the literature studies, there are some methods to assess the spatial trends used from data collection for different purposes. Similarly, some ways determine temporal trends used for various purposes such as weather analysis, accident causes and medical reforms, etc. So, such an intelligent method is needed to determine the research trends of any field from the published literature with combined properties of spatial and temporal techniques. The key contribution of this research is that previous methods were based on the data collected from different data sources, but this research used published articles from various journals.
Furthermore, this study combines the spatial and temporal data processed by a machine learning method to determine the research trends from the collected data effectively. It works in such a way that it first collects the dataset containing the published research articles from multiple journals preprocesses them to remove nauseous data. Then, we used the machine learning method ‘Quality Phrase Mining’ to determine the research trends of textile literature based on spatiotemporal properties. Finally, the directions of textile research from the previous nine years are visualized in graphs and word clouds to communicate the information effectively.
The rest of this paper is organized as follows. First, Section 2 discusses the current state-of-the-art work in the domain, followed by the proposed research methodology in Section 3. Next, results have been elaborated in Section 4, along with discussions. Finally, Section 5 concludes the paper.
Data mining approaches are used for finding non-trivial and exciting patterns from a massive text corpus. Scientific literature is rapidly growing, and many stakeholders need to discover innovations and new trends to make better decisions in real-time [10]. Therefore, Data mining approaches extract information from many data bulks. Data mining approaches are widely used for event and relation extraction from data. In Data mining, a subdomain called text mining deals with mining textual data. Text mining approaches use for finding useful and interesting information from large text. Keyword extraction is an active domain in text mining [11]. Text mining state-of-the-art approaches are broadly discussed in Section 2.1.
Text results were extracted using different approaches stored in the textual format. These results are difficult to understand. Therefore, researchers try to visualize textual results to understand results better. We can find several visualization approaches designed to show various text data types. A visualization method can better convey a tremendous amount of information with a more negligible reasoning effect. Visualization features are better to explain with an old saying, “A picture worth a thousand words” [12]. Some of the renowned state-the-art approaches for visualization are discussed below in detail in Section 2.2.
Text mining approaches are openly used for finding non-trivial and exciting patterns from a massive text corpus. Text mining methods have used various dimensions and types of interpretative information known as Meta-Knowledge in events and related contexts. Text mining is a flexible technology that is applicable in many fields. There is a lot of work done in text mining for keyword and keyphrase extraction. Many keywords and keyphrase extraction approaches are presented by researchers, which are broadly discussed below. Text mining approaches are further divided into statistical, graph-based, and machine learning methods. Some of the renowned statistical, graph-based, and machine learning approaches are discussed in detail in the following sections.
Statistical approaches in terms of text mining for keyword extraction work on the text data's word occurrence—keywords ranking based on their occurrences in the data collection to quantify the information content of the keywords. In statistical approaches, the frequency of every word concerning its occurrence, then words ranked according to their scores [13,14]. The author presented a frequent pattern mining approach based on FP-growth that mines information using co-occurrence of words also ignores noisy data. The research presented approach uses word weighted and frequency function TF-IDF to encounter the frequency of words [15]. The study proposed an algorithm that repeatedly built a hierarchy of topics from multiple content representative documents [16]. An integrated ranking list distinguishes each subject on different length phrases. The approach works on word centric view for extracting clustering and raking of topical terms.
The study presents a keyword extraction approach by adding co-occurrence to the feature set. The main document is divided into subsets by clustering [17]. Keyword Extraction and Summarization Reinforcement algorithm proposed extracts keywords as topic summarization associated with every topic subset. The proximity matrix is built based on co-occurrence between all document pairs. However, TF-IDF is a better statistical approach but a poor performer when complex structured data, the research had improved the traditional TF-IDF approach.
Therefore, another research also proposed a new feature set of synonyms named synset that enhanced the performance of TF-IDF FLC and BDS algorithms [18]. The study work to improve TF-IDF performance added another feature to the feature set. The proposed approach named Term Frequency-Adaptive Inverse Document Frequency performs better than traditionally used TF-IDF. The experiment author used Hidden Markov Model, which is based on the POS tagger. The study used the TF-IDF approach to experiment on different environments to obtain results [19]. There still exists a limitation of scalability and sparsity. However, simple statistical methods are insufficient for keyword extraction from complex documents or performance decreases on the complex dataset.
The graph is made based on nodes and edges, the words in the document are considered as nodes, and the edge between them is made based on some specific constraint. The constraint may be the co-occurrence or any other (depending on the nature of the graph). The study presented a keyword extraction method based on the Patricia-tree (PAT-tree). PAT-a tree is constructed on the sentence's context based on keyword location, then keyword mined from the PAT-tree. However, PAT-tree construction is time-consuming in this method [20]. Another research uses the SVM model for classification. However, keywords are divided into good and bad keywords from the document. It also produces local and global context attributes for the classification model [21].
The study used a graph-based approach that enhanced the results on complex data. New Selectivity parameter of nodes used for keyword extraction that defines as the average weighted of single edge node on the link [22]. However, graph base search improved by selecting a feature set and adding other parameters from the dataset. Instead of PageRank and HITS, centrality measures are used for better keyword extraction results. Twitter Keyword Graph (TKG) proposed to overcome the limitation of VSM, such as sparsity and scalability. Centrality measure is used for keywords extraction in TKG. Tweets data are used for analysis, and tweets are represented as graph nodes [23].
However, another research proposed a k-core approach for document representation as a graph of words. For node representation, the central core is used. That approach gives better proximity between the variability in the number of keywords and keywords extracted from a subset of nodes. However, the performance can be compromised by choosing the wrong parameters [24,25]—an approach based on a new parameter of the influenced node from the word network graph. Therefore, the research uses a graph degeneracy approach. The CRP approach is used to enhance keyword extraction, which comparatively improves results from the traditional method.
The author proposed a weighted graph-based approach named Keyword from Weighted Graph [26]. The Weighted Graph approach is an unsupervised approach that uses node edge for ranking the nodes, neighborhood closeness, and node importance calculated by centrality measure [27]. The words selected within a fixed-size sliding window used accumulated co-occurrences with a word co-occurrence graph. TextRank is a graph-based ranking algorithm that ranks words on association within the graph and then tops words from ranking considered a keyword. Multiword keywords are also extracted by combining adjacent keywords from documents. That method performed better when only working on nouns and adjectives as potential keywords.
2.3 Machine Learning Approaches
Machine learning approaches provide keyword or keyphrases based on the training dataset containing user annotating keywords or key phrases. First, data from the corpus is preprocessed for keyphrase extraction. Then, the machine learning algorithm is applied to the processed data. Machine learning algorithms use training data to extract keywords or keyphrases from data. Some of the renowned machine learning approaches are discussed below.
Keyword extraction gives a concise representation of the document. The study [28] proposed a novel approach on iterative reinforcement, which simultaneously extracts text summary and keywords from a single document. This approach uses full reinforcement between keywords and sentences by combining three different relationships between keywords and sentences, which can be heterogeneous or homogeneous. The corpus-based approach is validated as a knowledge base approach for word semantics from computing [29]. The author proposed a machine learning-based method for keyword extraction called Rapid Automatic keyword extraction (RAKE). RAKE is a domain and language independent, the unsupervised approach used for keywords extraction from a specific document. Research performs experiments on a benchmark dataset of technical abstracts that show the proposed algorithm is computationally efficient than TextRank.
Furthermore, model training time consumption is resolved in the machine learning approach called Automatic Term Recognition (ATR). An annotated n-gram is used for the training dataset, consisting of a positive and negative example. Furthermore, the machine learning approach is used for bilingual ATR with some modifications w.r.t monolingual machine learning methods [30]. The study proposed a system that works automatic keyphrase extraction [31]. To overcome complexity, the study [32] proposed an automatic keyphrase extraction algorithm that can run supervised and unsupervised tasks. The proposed algorithm represents every document as a semantic network. Keyphrases are elected on the structural dynamics of the semantic network.
Particle Swarm Optimization is used for recomputed node and the optimal corresponding node predicted. The research proposed a novel K-means Non-Negative Matrix Factorization (KNMF), implemented using Negative Matrix Factorization guidelines [33]. The study comprehensively compares learning algorithms (Support Vector Machine, Naïve Bayes, Random Forest, and logistic regression) with widely used ensemble approaches (Bagging, AdaBoost, majority Voting, Dagging, and Random Subspace) [34]. The first study shows the effectiveness of statistical keyword extraction methods combined with ensemble learning algorithms.
To improve the previous study, the author proposed a supervised machine learning approach for keyphrase extraction called citation-enhanced keyphrase extraction (CeKE) [35]. However, the result's quality may be compromised, but another keyphrase extraction method works on web pages. Therefore, the author proposed that the approach WebEmbedRank is the addition of the previously proposed method of structural information extraction. However, results improved, but it did not get much better results on textual datasets than expected [36].
The improvement in getting a better result has proposed a framework for solving Spatio-temporal data mining of multiple events. Moreover, the author improved Spatiotemporal pattern mining by considering both space and time factors [37]. The research focuses on spatial co-location patterns (events that are located frequently in a geographical space). The study proposed an approach weighted sliding window model (WSW-Model) that includes the time factor to feature the spatiotemporal co-location pattern mining. The research also proposed an algorithm STCP-Miner that focuses on mining spatiotemporal co-location patterns [38]. Another study provided an approach that discovers the spatiotemporal ways in trajectory data [39].
The research demonstrates the implementation of Spatiotemporal pattern mining to identify property crime ratios in different geographical areas [40]. The proposed approach claimed to be the first Bayesian model, embedded with Markov Chain Monte Carlo simulation using WinBUGS. The research was conducted to determine the average crime trend, area-specific crime trends, and different probability ratios of crimes in other areas (area-specific crime ratio) [41]. Spatiotemporal Data Mining includes keyword extraction, primarily targeted to research articles or relevant datasets. The research focuses on improved spatiotemporal data mining (STDM), considering a critical climate change topic [42]. The research subjects to increase the STDM efficiency, accuracy, and scalability. The research objective is to historically record climate change and identify its challenges using spatiotemporal pattern mining.
The proposed research methodology is divided into two phases. First, data is collected using a crawler from the collected research articles of open access research journals. In the first phase, preprocessing tasks consist of tokenization, stop words removal, and stemming. Next, preprocessed data is used for research trend mining. This research uses the machine learning-based approach named quality phrase mining. Quality phrase mining is used to determine the spatiotemporal trends. This provides the research trends in different countries from 2011 to 2019. The trends are visualized using state-of-the-art visualization approaches to understand results better. The researcher's collaboration from other countries is determined using research articles metadata from the dataset in the second phase. The research methodology used in this research is shown in Fig. 1.
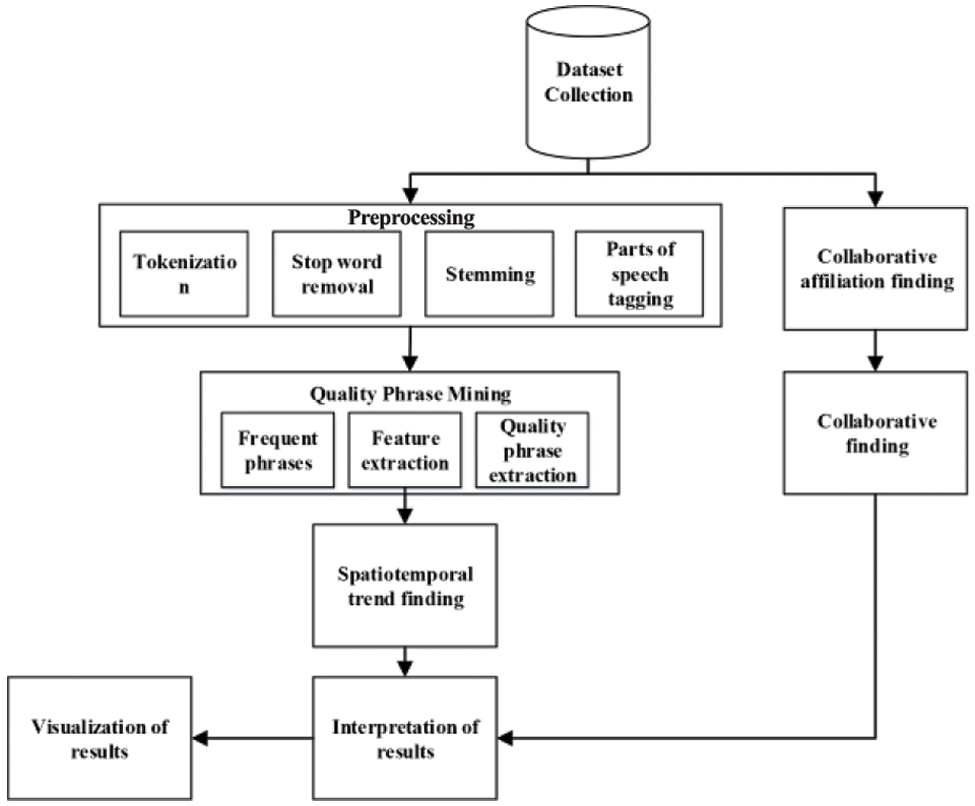
Figure 1: Proposed methodology
This study collected data from previously published literature related to textiles and their applications. Many datasets were studied, but no data pertaining to textiles is suitable for this research's requirement. Data collection tasks are performed with a crawler that crawls data from several scientific digital libraries.
These scientific digital libraries include Sage journals, Science Direct, Springer, and MDPI. Different scientific digital libraries were selected for data collection to avoid the journal preferences of publications. Several available approaches of text mining use only research article abstract instead of the entire paper because every journal's research articles are not freely available. In this research, full-text research articles are used for trend mining from research articles of textiles. This research collected research articles from open access journals only from 2011 to 2019. For spatiotemporal trend mining, different country and years data was needed. More than 1500 full-text research articles are collected from various open access journals. This research chooses nine developed countries affiliated research articles like China, France, Germany, Italy, Japan, South Korea, UK, and the USA for spatial data. After data collection, all research articles are arranged country and yearly basis.
Each country had a research article from 2011 to 2019, as shown in Fig. 2. For this research, data were collected from different impact journals related to different research domains of textiles. Statistics of data are shown in Tab. 1. Finding research collaborations research articles with more than one country affiliation selected from the same dataset.
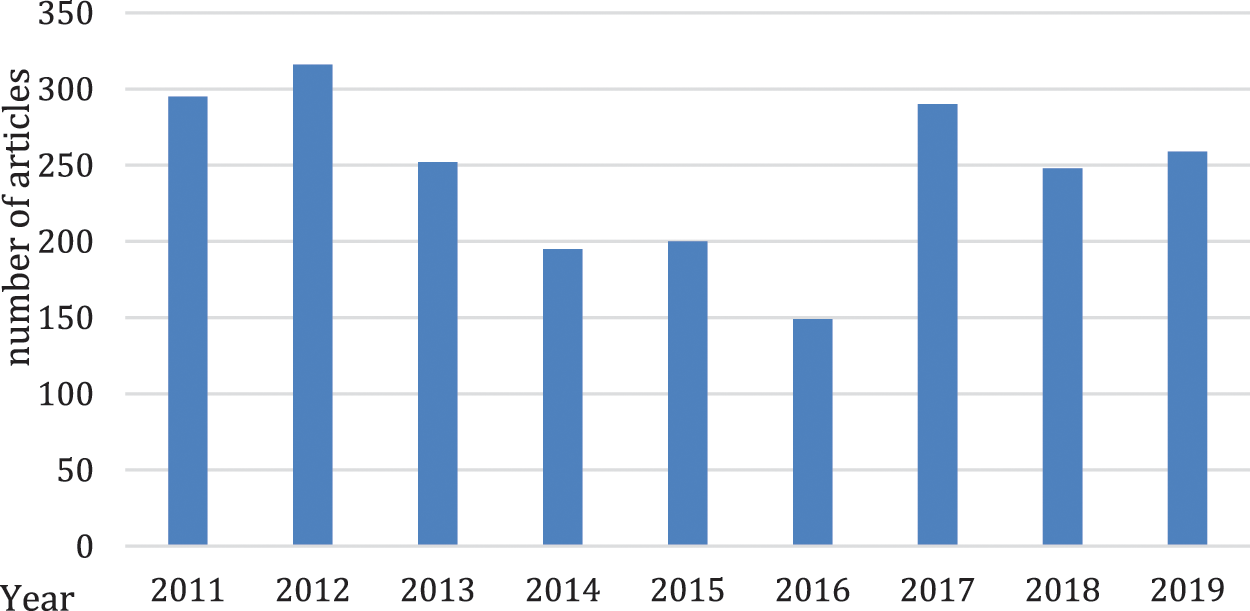
Figure 2: Research articles from 2011 to 2019
In this step, raw data was converted into a process-able form. First, the research article is available in a pdf file converted into a text file. After this, articles were discarded other than the English language because this research only processed the English language data. Then the preprocessing task is performed, which consists of multiple steps as follows (tokenization, stop word removal and stemming).
In this step quality, phrases were mined from the dataset generated from the previous step. Mining quality phrase is a crucial step in methodology because the phrase mined affects this research results. A phrase is considered a quality phrase with four features: popularity, concordance, completeness, and informative.
A phrase occurred in the document with a higher than the specific frequency is considered a quality phrase. A phrase should be frequent in a document. If it is not frequent, it cannot be a quality phrase from a given document. Popularity also ensures downward property. A subset of a phrase must be frequent if the phrase is frequent.
Concordance is the frequency higher than the frequency that occurred by chance. Identify the relevancy between several sentences and synonyms identification of all the words. For example, strong tea is similar to solid tea in English. However, strong tea is a more proper word and occurs frequently. If strong tea is selected as a quality phrase, power tea is also a quality phrase because both words have the same semantic meaning.
An informative phrase indicates a specific topic. All frequent phrases are not referred to as informative phrases because an informative phrase has semantic meaning. Like “this paper” is can frequently occur in the document but not informative in research articles. The approach name used in the research article is informative for research.
Completeness refers to the property of a phrase that deals with a complete, understandable meaning of the phrase. The phrase is determined as a complete semantic entity. A phrase may not always appear as a single word. It frequently appears as a combination of two words that give a single understandable meaning. So, completeness refers to the quality of a phrase that makes it understand completely.
The spatial is a term that refers to a geographical location. The location may be any geographical space like a country city. In contrast, a temporal term refers to any time span like decades, years, and months. The term is combined as spatiotemporal, referring to both meanings, firstly space and secondly time. In this research, the term spatiotemporal means both geographical location and year; here, geographical location represents the country where research is being taken. The year represents the specific year in which the research was being done. Trend refers to a direction in which research is being conducted, for example, bulletproof fiber production.
Finally, the spatiotemporal trend means that country of a specific year following the research performed in the textile research field. This research has arranged datasets on a different country and yearly basis. To get research trends, a specific country and one-year data analysis were performed through quality phrase mining. The exact process followed for every analysis. This research has focused on collecting data of a specific time (number of years) from 2011 to 2019 based on specific countries on which this research method was performed. For spatiotemporal trends, finding data related to a country was separated and the quality phrase mining method was applied to get trends in a country. This task performed year-wise data to show different years of textile research trends in a specific country.
3.5 Author Affiliation Extraction
This step involves extracting the author's affiliation information from all research articles (from the previously collected dataset). Focus on the affiliated country of a specific research article. At first, this research selects articles from more than one country and discards all others. The next step filtered out only those articles that contained at least two different countries. Then, all the researcher's affiliations in a research article are extracted. This research used pdfx [43] for affiliation findings in research articles. It first converts the pdf files to an XML format that gives control to extract any specific information. This research extracted only affiliations of authors and from affiliations of authors filtered out only country names. Next, this research extracted the author's given keyword in collaborative research articles. These keywords show different countries’ collaboration, which is frequently used to collaborate with different countries. That can also help the researcher find the researcher for collaboration from another country. A researcher can effectively search for another country's researcher collaborating on a specific topic.
Collaboration in research means that researchers from different countries collaborate for the research. Many research articles contain authors from different countries. In collaborative research, various researchers from other countries work together on a problem. This research finds collaborative research articles from the collected dataset by finding at least two affiliated authors in a research article. In this research, collaboration means researchers from different geographical areas (for example, one author from one country and another from other countries) researched on any specific research topic. Previously collected data of the researcher's affiliation was used to find researchers’ collaboration from different countries. Authors defined keywords also extracted to show which keyword researchers collaborate from other countries. This research gives us research trends in various countries’ textile field collaboration. After finding a collaborative document, this research also extracts the author's given keyword to show country collaboration based on the keywords. That also helps to see which countries collaborate on which keywords.
Computer visualizations have become more diverse since it has been implemented in various previous studies. It supports single and multi-dimension data and visualizes it. It means every type of data can be converted into the visualization format at first and then can be visualized effectively. As the main application of visualization is to display data effectively, it also supports an additional feature that enables the viewer to zoom in and zoom out the content to view hierarchy levels or connections. While dealing with visualization D3.js has been used by many research articles in literature [44]. It works on JavaScript that deals with web front-end view. There are various options of visualization related to different types of datasets. There are many guidelines for the visual design of information visualization, but the basic principle can be summarized into Visual Information Seeking Mantra: “overview, zoom and filter details on demand” [45]. This research also experimented with many visualizations available on D3.js and selected the most appropriate visualization named Zoomable-circle-packing and Bilevel-edge-building that fulfills our research results criteria to be visualized. Zoomable circle packing fulfilled Visual Information Seeking Mantra and was used to visualize spatiotemporal trends, where the outer circle indicates the country name, as shown in Fig. 3. These circles are zoomable and clickable. According to Visual Information Seeking Mantra, that image gives an overview of information and these circles are zoomable.
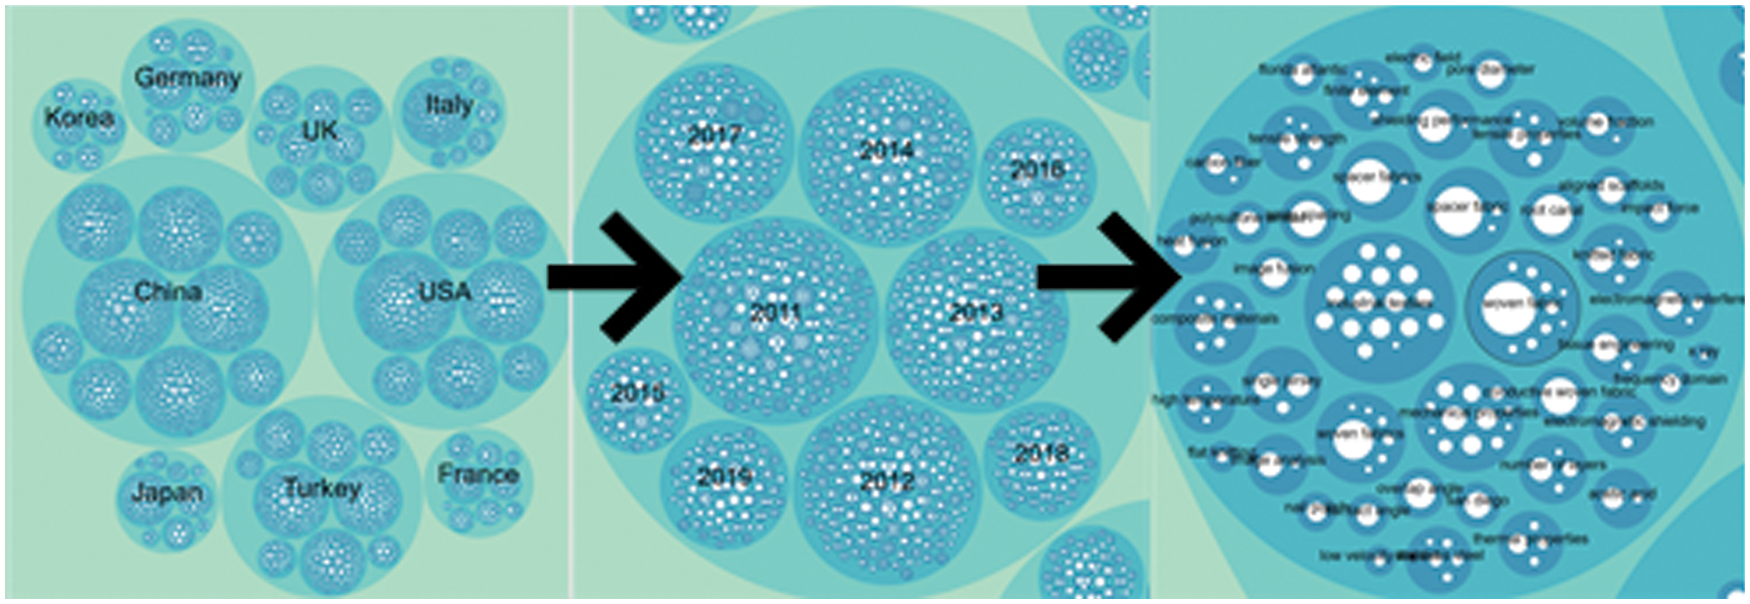
Figure 3: Zoomable-circle-packing
Results can be filtered out by clicking on a circle according to the country name. Clicking on specific country circle detail on demand will be shown. Zoomable circle packing is also used to show research collaborations as shown in Fig. 8. The outer circles show country names like in Fig. 3 and the inner circle shows the country name that collaborates with the outer circle name country. Further, inner circles show the author's given keywords in research articles. Bilevel edge building visualization is also used to show collaborations of different countries. This visualization is in the ring-based net graph, which only shows the number of collaborations with other countries. Connected lines with other countries also highlighted that show which specific country collaborate. The mouse pointer put on a country name a message box showed with a number of collaborations on it.
This research identifies the spatiotemporal scientific trends in textiles and their applications from 2011 to 2019 using quality phrase mining on a scholarly dataset. In this approach, quality phrases of variable length are extracted from literature related to textiles. In this approach, the maximum phrase length is set to five, and the frequency threshold value is set according to the number of publications. Because that process is divided into ten spans, the number of publications differs in each span. Further, these spans are divided into nine different countries.
This section is divided into two further sections. In the first section discusses trends. That section is further divided into spatial, temporal, and spatiotemporal trends. The second section discusses the collaboration of researchers from different countries in textiles. The first section is further divided into nine years from 2011 to 2019. Furthermore, in a year, there are nine different countries’ research trends. Moreover, results are shown using visualization for a better understanding of results. The second section shows the researcher's collaboration with different countries. Results also show the keyword on which researchers collaborate. Two different visualizations were used for better results representation.
4.1 Temporal Trend Using the Word Cloud
In this step, the scientific trend of textiles from a timespan of the year 2011 to 2019 years is described using the word cloud visualization method. The year 2011, 2012 and 2013 trend of textile research are shown (using the word cloud) as in Fig. 4. To further identify the accuracy of phrases, Tab. 1 was constructed to show the top ten trends with the frequency of keyphrases that appeared in 2011, 2012 and 2013. The frequency here means the occurrence value of phrases, the more frequency value the more the phrase is considered as influenced among all the collection. The keyphrases that are higher in size represent the higher number of occurrences in the collection as in Fig. 4. it can be seen that the phrases are not of any defined size. Some are single words, some are dual and some are in a combination of more than two words. This shows that our method is not restricted to the size of phrases. It is flexible enough to deal with different sizes of phrases. Every phrase directs to a specific term with a predefined meaning, making our claim more accurate.
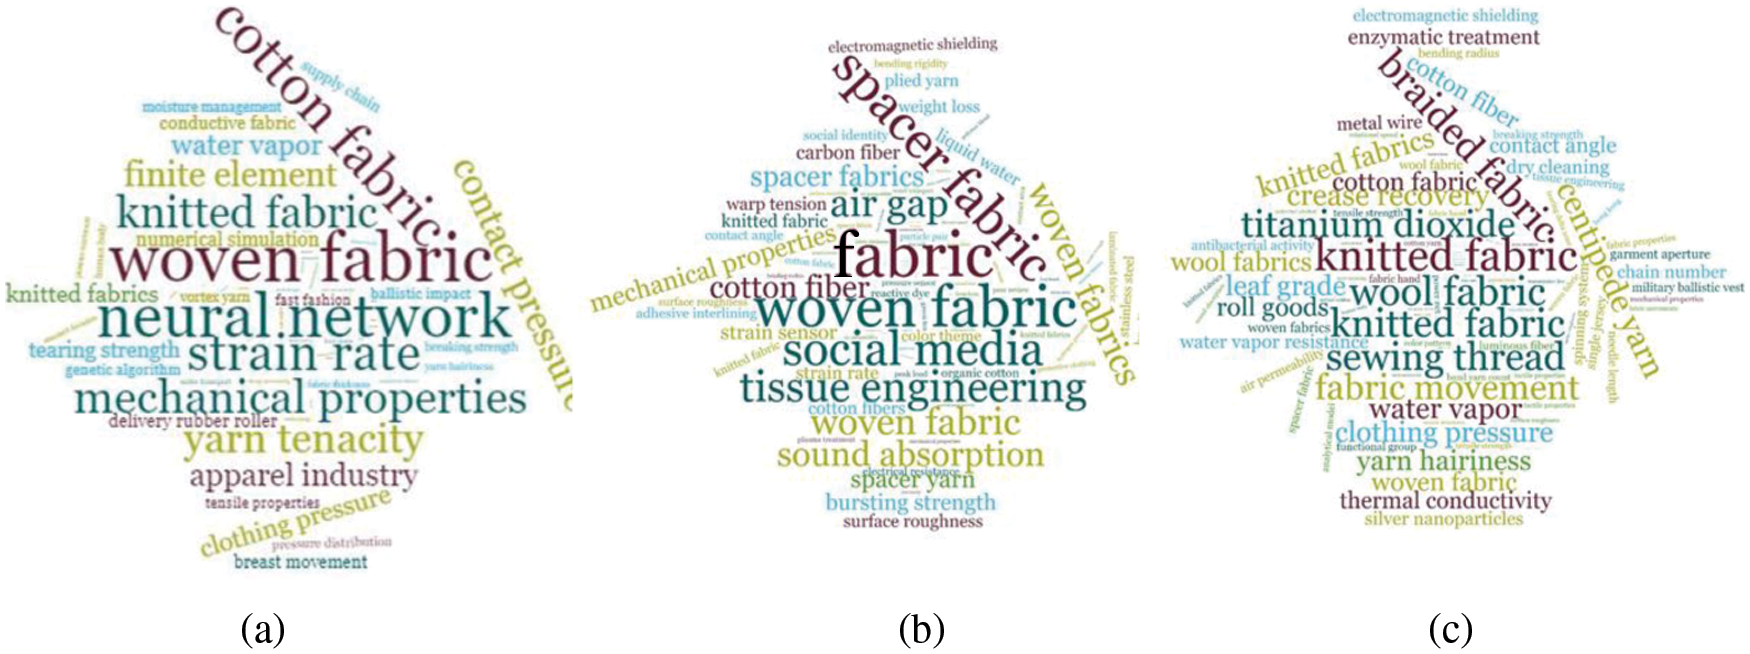
Figure 4: Temporal trend using word cloud for 2011, 2012 and 2013
4.2 Spatial Trend Using World Cloud
In this step, the scientific trends of textiles from different countries in the time span of year 2011 to 2019 is described using the word cloud visualization. The China, USA and UK's trends of textile research from year 2011 to 2019 shown (using word cloud) in Fig. 5. It shows the top trends with the high frequency keyphrases appeared in the year 2011, 2012 and 2013 from dataset.
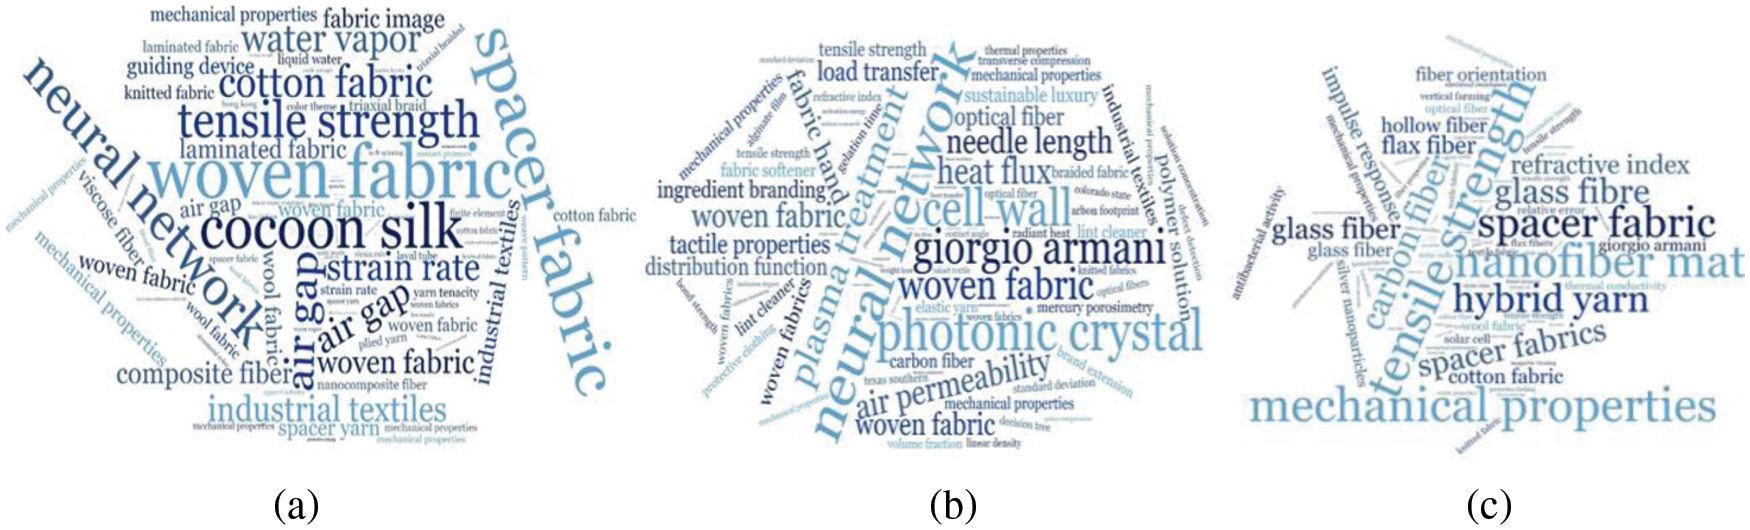
Figure 5: Spatial and temporal trend using word cloud from year 2011 to 2019
4.3 Spatiotemporal Trend Using World Cloud
This step deals with the representation of scientific trends of textiles from different countries during timespan of year 2011 to 2019 using the word cloud visualization. Every country's trends of textile research from year 2011 to 2019 are shown separately. The top temporal trends identified by this research for the year 2011 were “Tissue Engineering”, “Nano mat”, and “Composite Fiber” and are also given in the Fig. 5a along with other trends of a specific year.
These were the top three terms that were considered to be the trending terms in the year 2011 in textile field research. The same way this research identified spatial trends of a specific country “China” from the timespan of the year 2011 to the year 2019 and the top three trending terms identified by the proposed method were “woven fabric”, “spacer fabric”, and “Tensile strength”. Therefore, it is determined that these three terms were the topmost trending research terms in the said timespan. It is being observed from these two, the spatial and the temporal trends individually that determined trends were different in results. So, there was a need for such a method that works in such a way to work efficiently in determining factors, the spatial and the temporal combined. In this regard, this research's proposed approach named spatiotemporal trend mining worked well in determining both factors of the trends, it produced meaningful and more accurate results than the individually determined results (spatio and temporal) which is given in the Fig. 5c.
The top trend of the year 2012 extracted using quality phrase mining are “Spacer fabric”, “fabric”, “woven fabric”, and more trends given in the Fig. 4b. The spatial trends are also identified using quality phrase mining of USA from year 2011–2019. The USA's top spatial trends are “Social commerce”, “tissue engineering”, “carbon fiber”, and more results are shown in the Fig. 5a. Furthermore, the spatiotemporal trend of USA year 2012 is shown in the Fig. 6c. The top trends determined from word cloud are “length distribution”, “cotton nonwoven”, “woven fabric”, and more shown in the Figures. These figures clearly show that the spatial and temporal trends are different from each other. Further, the results are better revealed by this research's proposed spatiotemporal trends method as compared to the other methods that deal with spatial and temporal individually.
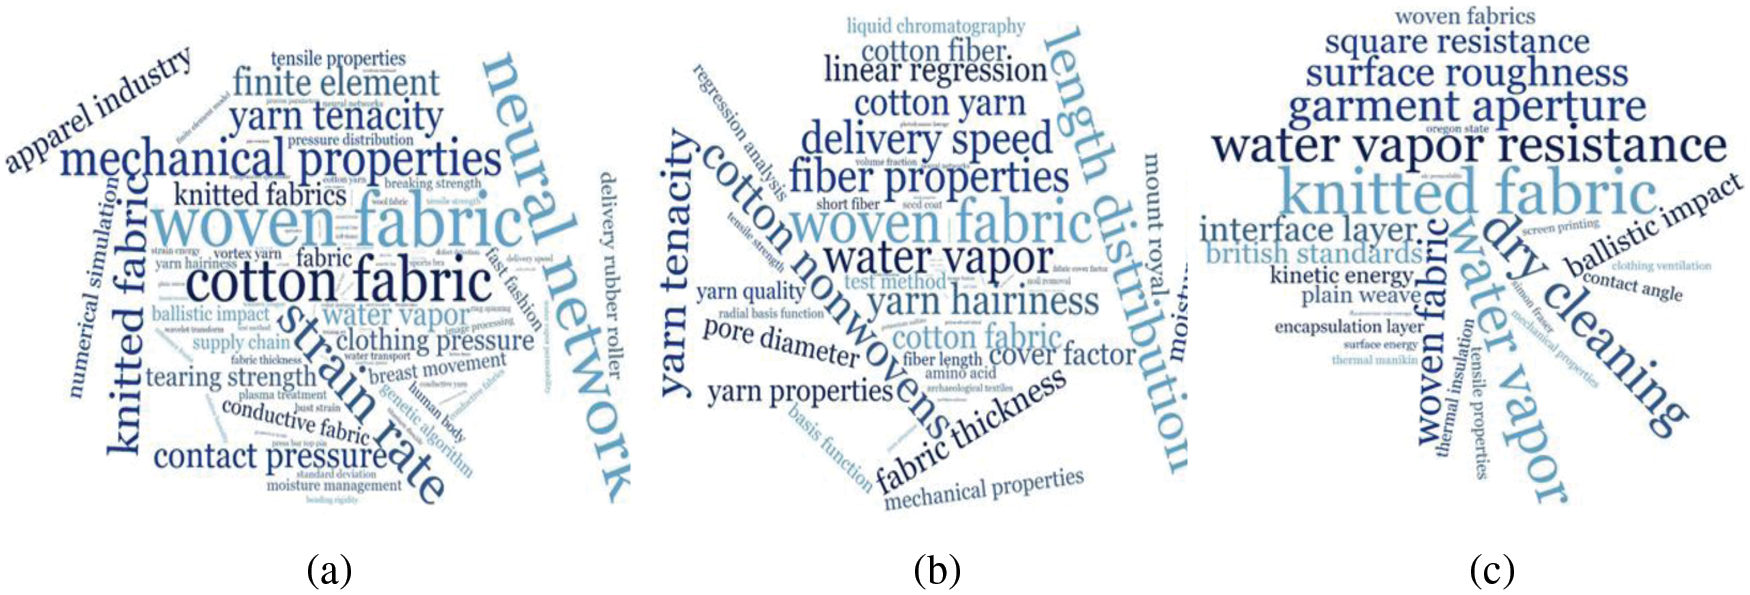
Figure 6: Spatiotemporal trends of USA in year 2012 using word cloud
4.4 Collaboration of Researchers
In this step, the collaboration of researchers of a country with other country researchers, determined in the Section 3.6 are shown graphically using two visualization methods zoomable circle method and simple network representation of researchers collaboration. In this research, 37 different country's data was used for determining the collaboration of the researcher. Collaborative countries and keyword on which researchers collaborate are shown in this section. The collaboration of countries that collaborate with china is visualized. It shows countries name on vertex and edges connected show collaboration between countries.
The connections between the names of countries are actually the collaborative research number; the more the links means the more number of collaborative researches conducted between them. The visualization works in such a dynamic way that when the mouse is moved on any country's name, the links of that country to the other countries are highlighted with the dark color, form which the collaborative countries can easily be seen. Further, the Zoomable-circle-packing visualization also used for visualizing research collaboration shown in the Fig. 7. The collaborative keywords of a country with other country can be displayed by click on the country's circle.
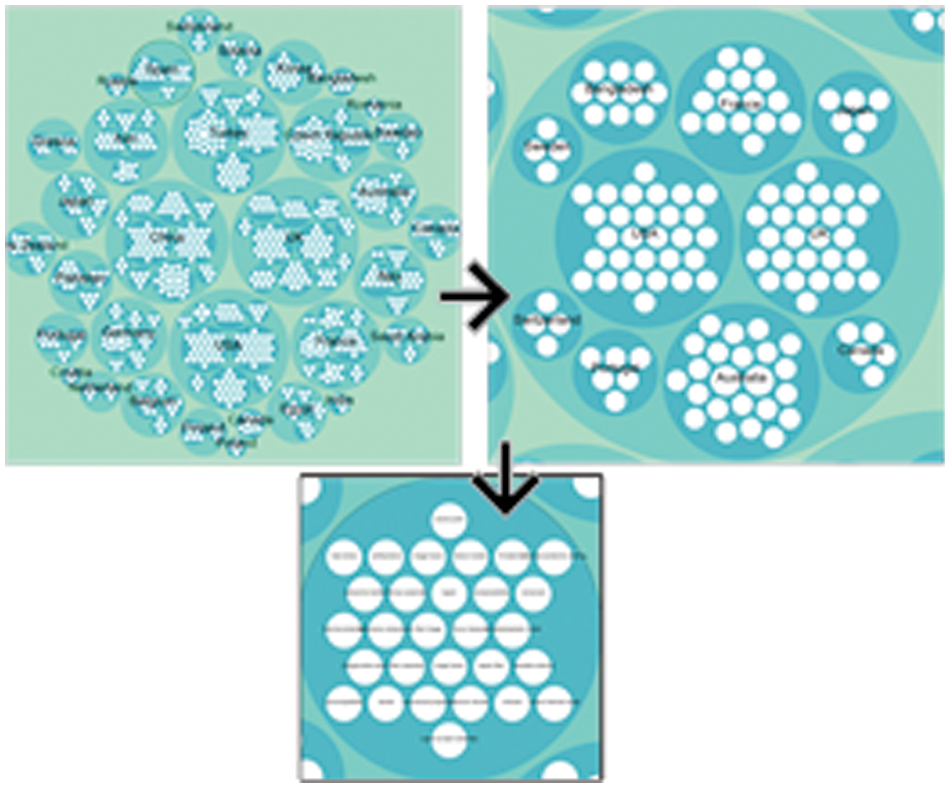
Figure 7: Zoomable circle visualization for research collaboration results
This visualization works in hierarchy-based zooming, if we click on a circle of a specific country it will show the collaboration of that country with the other countries with their names on circles, the bigger the circle is the more number of collaborations are there. When the inner circle is clicked containing the name of collaborative country the keywords of both countries are shown, that shows on basis of which topic both countries were collaborating in the research.
The results are also validated by fetching textile exports of countries. This experiment was carried out in such a way that, it shows the collaborative textile exports stats of those countries which are collaborating in textile research. It was being observed that as according to the results of the proposed method, the most collaborative countries in the said timespan were the USA and China. The textile export stats of both countries were also observed higher, so it can relate that the countries having collaborative research also have economical rise collaboratively in exports. The Figs. 8 and 9 are the representation of statistics of export and import results of most collaborative countries (USA and China).
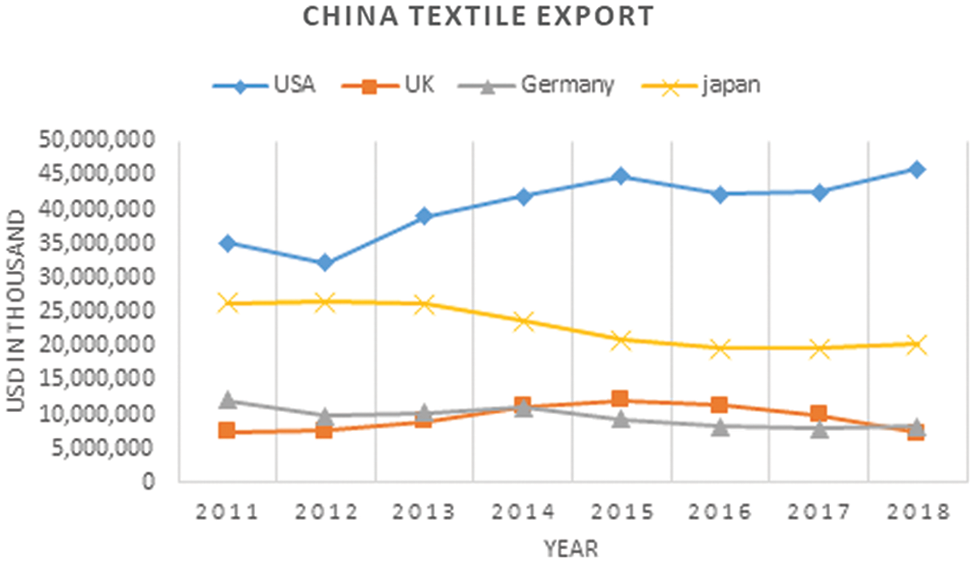
Figure 8: China textile exports (2011–2018)
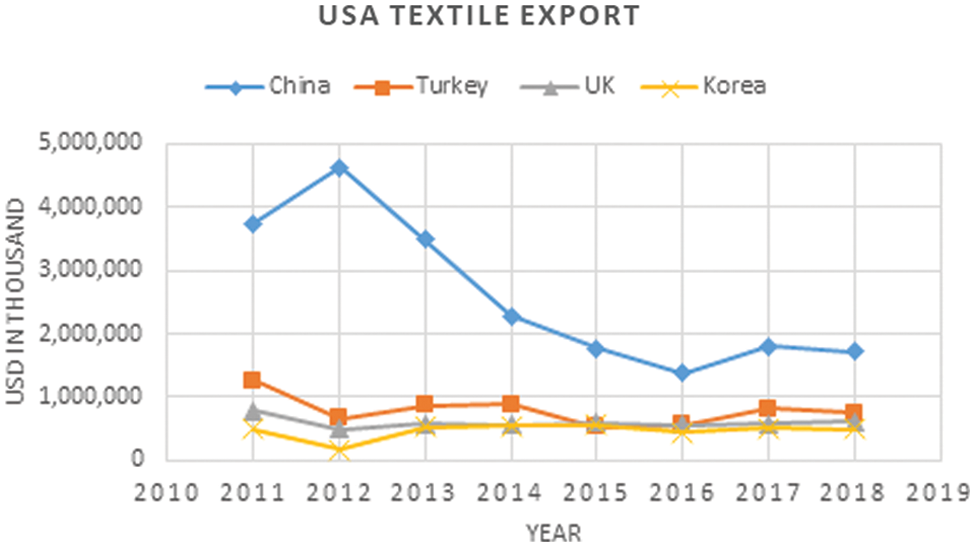
Figure 9: USA textile exports (2011–2018)
Many data mining approaches are available that extract spatial, temporal, or combined spatiotemporal data from different types of datasets. Although these techniques are used in literature but no such methods exist that deals with the extraction of data based on spatiotemporal factor from scholarly data collection. The progress of any research domain can better be revealed through the spatiotemporal scientific trend analysis. So, the key idea of this research is to analyze the scientific spatiotemporal trend in the rapidly growing research field from published literature. To achieve this claim more than fifteen hundred research articles are extracted from open source journals of textiles from year 2011–2019. This research used quality phrase mining approach that was applied to the collected dataset in order to determine the spatial (in the Section 4.2) and temporal (in the Section 4.1) results. In this research it has been observed that the spatial and temporal trends tend to be less informative separately as compared to the combined spatiotemporal results. Moreover, the collaboration of researchers based on the country was also determined to show importance of collaborative research. The research collaboration results show that the countries with more collaboration in the research have more import-export collaborations. Furthermore, for an effective understanding of all results, this research implemented visualization techniques. Word cloud visualization is used to compare the results of spatial and temporal results with proposed method spatio-temporal results. Different visualization approaches are used for better representation of further results such as Word cloud, zoomable-circle-packing, and bilevel-edge-binding.
Acknowledgement: The author thanks Natural Sciences and Engineering Research Council of Canada (NSERC) and New Brunswick Innovation Foundation (NBIF) for the financial support of the global project. These granting agencies did not contribute in the design of the study and collection, analysis, and interpretation of data.
Funding Statement: This work was supported by Natural Sciences and Engineering Research Council of Canada (NSERC) and New Brunswick Innovation Foundation (NBIF) for the financial support of the global project. These granting agencies did not contribute in the design of the study and collection, analysis, and interpretation of data.
Conflicts of Interest: The authors declare that they have no conflicts of interest to report regarding the present study.
References
1. K. Huang and P. Yu, “Effect of carbon doping on the mesoporous structure of nanocrystalline titanium dioxide and its solar-light-driven photocatalytic degradation of NOx,” Langmuir, vol. 24, no. 7, pp. 3510–3516, 2008. [Google Scholar]
2. A. Lakhtakia, “Nanotechnology and metamaterials: Conceptualization and intersection for new opportunities,” in Proc. Int. Conf. on Software Engineering, Kuala Lumpur, Malaysia, pp. A1, 2012. [Google Scholar]
3. J. Liu, J. Shang, and J. Han, “Phrase mining from massive text and its applications,” Synthesis Lectures on Data Mining and Knowledge Discovery, vol. 9, no. 1, pp. 1–89, 2017. [Google Scholar]
4. S. Lahiri, S. R. Choudhury and C. Caragea, “Keyword and keyphrase extraction using centrality measures on collocation networks,” arXiv preprint arXiv:1401.6571, 2014. [Google Scholar]
5. C. Aalla and V. Pudi, “Mining research problems from scientific literature,” in Proc. Int. Conf. on Data Science and Advanced Analytics, Montreal, Canada, pp. 351–160, 2016. [Google Scholar]
6. X. Wang, A. McCallum, and X. Wei, “Topical n-grams: Phrase and topic discovery, with an application to information retrieval,” in Proc. Int. Conf. on Data Mining, Omaha, NE, USA, pp. 697–702, 2007. [Google Scholar]
7. M. Barouni-Ebarhimi, and A. A. Ghorbani, “A novel approach for frequent phrase mining in web search engine query streams,” in Proc. Conf. on Communication Networks and Services Research, Fredericton, NB, Canada, pp. 125–132, 2007. [Google Scholar]
8. S. K. Bharti, and K. S. Babu, “Automatic keyword extraction for text summarization: A survey,” arXiv preprint arXiv:1704.03242, 2017. [Google Scholar]
9. J. Liu, J. Shang, C. Wang, X. Ren and J. Han, “Mining quality phrases from massive text corpora,” in Proc. ACM Special Interest Group on Management of Data, Melbourne, Australia, pp. 1729–1744, 2015. [Google Scholar]
10. C. Plug, J. C. Xia and C. Caulfield, “Spatial and temporal visualisation techniques for crash analysis,” Accident Analysis & Prevention, vol. 43, no. 6, pp. 1937–1946, 2011. [Google Scholar]
11. T. Lappas, M. R. Vieira, D. Gunopulos and V. J. Tsotras, “On the spatiotemporal burstiness of terms,” arXiv preprint arXiv:1205.6695, 2012. [Google Scholar]
12. J. Law, M. Quick and P. Chan, “Bayesian spatio-temporal modeling for analysing local patterns of crime over time at the small-area level,” Journal of Quantitative Criminology, vol. 30, no. 1, pp. 57–78, 2014. [Google Scholar]
13. C. Rangu, S. Chatterjee and S. R. Valluru, “Text mining approach for product quality enhancement: (improving product quality through machine learning),” in Proc. Int. Advanced Computing Conf., Hyderabad, India, pp. 456–460, 2017. [Google Scholar]
14. N. Cao and W. Cui, Introduction to Text Visualization, Paris: Atlantis Press, 2016. [Online]. Available: https://link.springer.com/book/10.2991%2F978-94-6239-186-4. [Google Scholar]
15. M. Zhao, W. Yu, W. Lu, Q. Liu and J. Li, “Chinese document keyword extraction algorithm based on fp-growth,” in Proc. Int. Conf. on Smart City and Systems Engineering, Hunan, China, pp. 202–205, 2016. [Google Scholar]
16. A. Onan, S. Korukog˘lu and H. Bulut, “Ensemble of key word extraction methods and classifiers in text classification,” Expert Systems with Applications, vol. 57, pp. 232–247, 2016. [Google Scholar]
17. W. Xu, W. Luo, N. Woodward and Y. Zhang, “Supporting data driven access through automatic keyword extraction and summarization,” in Proc. Int. Conf. on Blockchain and Cryptocurrency, NY, USA, pp. 704–707, 2015. [Google Scholar]
18. T. Ruas and W. Grosky, “Keyword extraction through contextual semantic analysis of documents,” in Proc. Management of Digital EcoSystems, Bangkok, Thailand, pp. 150–156, 2017. [Google Scholar]
19. M. Zimniewicz, K. Kurowski and J. Weglarz, “Scheduling aspects in keyword extraction problem,” International Transactions in Operational Research, vol. 25, no. 2, pp. 507–522, 2018. [Google Scholar]
20. F. Chien, “Pat-tree-based keyword extraction for Chinese information retrieval,” in Proc. ACM Special Interest Group on Information Retrieval, Philadelphia, Pennsylvania, USA, pp. 50–58, 1997. [Google Scholar]
21. K. Zhang, H. Xu, J. Tang and J. Li, “Keyword extraction using support vector machine,” in Proc. Web-Age Information Management, Jiuzhaigou, China, pp. 85–96, 2006. [Google Scholar]
22. S. Beliga, A. Meštrovic´ and S. Martinčic´-Ipšic´, “Towards electivity based keyword extraction for Croatian news,” arXiv preprint arXiv:1407.4723, 2014. [Google Scholar]
23. W. D. Abilhoa and L. N. De Castro, “A keyword extraction method from twitter messages represented as graphs,” Applied Mathematics and Computation, vol. 240, pp. 308–325, 2014. [Google Scholar]
24. J. Cao, Z. Jiang, M. Huang and K. Wang, “A way to improve graph-based keyword extraction,” in Proc. IEEE Int. Conf. on Communications, Chengdu, China, pp. 166–170, 2015. [Google Scholar]
25. F. Rousseau and M. Vazirgiannis, “Main core retention on graph-of-words for single-document keyword extraction,” in Proc. European Conf. on Information Retrieval, Vienna, Austria, pp. 382–393, 2015. [Google Scholar]
26. S. K. Biswas, “Keyword extraction from tweets using weighted graph”, in Proc. Cognitive Informatics and Soft Computing, Balasore, India, pp. 475–483, 2019. [Google Scholar]
27. R. Mihalcea and P. Tarau, “Text rank: Bringing order into texts,” in Proc. Conf. on Empirical Methods in Natural Language Processing, Barcelona, Spain, pp. 404–411, 2004. [Google Scholar]
28. X. Wan, J. Yang and J. Xiao, “Towards an iterative reinforcement approach for simultaneous document summarization and keyword extraction,” in Proc. Association of Computational Linguistics, USA, pp. 552–559, 2007. [Google Scholar]
29. S. Rose, D. Engel, N. Cramer, “Automatic keyword extraction from individual documents,” Wiley Online Library, vol. 1, pp. 1–20, 2010. [Google Scholar]
30. P. Lopez and L. Romary, “Humb: Automatic key term extraction from scientific articles in grobid,” in Proc. SemEval’10, Uppsala, Sweden, pp. 248–251, 2010. [Google Scholar]
31. F. Qian, L. Yin, Q. He and J. He, “Mining spatio-temporal co-location patterns with weighted sliding window,” in Proc. IEEE Intelligent Computing and Intelligent Systems, Shanghai, China, pp. 181–185, 2010. [Google Scholar]
32. J. Kang and H. -S. Yong, “Mining spatio-temporal patterns in trajectory data,” Journal of Information Processing Systems, vol. 6, no. 4, pp. 521–536, 2010. [Google Scholar]
33. J. H. Faghmous and V. Kumar, “Spatio-temporal data mining for climate data: Advances, challenges, and opportunities,” in Proc. Springer, Berlin, Heidelberg, pp. 83–116, 2014. [Google Scholar]
34. J. J. Lee, H. H. Kwon and T. Kim, “Spatio-temporal analysis of extreme precipitation regimes across South Korea and its application to regionalization,” Journal of Hydro-Environment Research, vol. 6, no. 2, pp. 101–110, 2012. [Google Scholar]
35. M. Asif, A. Ishtiaq, H. Aljuaid and J. Shah, “Sentiment analysis of extremism in social media from textual information,” Telematics and Informatics, vol. 48, pp. 101345, 2020. [Google Scholar]
36. I. Ali, M. Asif, M. Shahbaz and A. Guergachi, “Text categorization approach for secure design pattern selection using software requirement specification,” IEEE Access, vol. 6, pp. 73928–73939, 2018. [Google Scholar]
37. G. Chernyshova, G. Smorodin and A. Ovchinnikov, “Technique of cluster validity for text mining,” in Proc. IEEE Conf.-Cloud System and Big Data Engineering, Noida, India, pp. 337–340, 2016. [Google Scholar]
38. T. Matsumoto, W. Sunayama, Y. Hatanaka and K. Ogohara, “Data analysis support by combining data mining and text mining,” in Proc. Congress on Advanced Applied Informatics, Hamamatsu, Japan, pp. 313–318, 2017. [Google Scholar]
39. A. Treisman, “Preattentive processing in vision,” Computer Vision, Graphics, and Image Processing, vol. 31, no. 2, pp. 156–177, 1985. [Google Scholar]
40. C. Ware, Information Visualization: Perception for Design (Interactive Technologies), 3rd ed., vol. 1, USA: Morgan Kaufmann Press, 2019. [Online]. Available: https://www.amazon.com/Information-Visualization-Perception-Interactive-Technologies/dp/0123814642. [Google Scholar]
41. J. Zhang, “The nature of external representations in problem solving,” Cognitive Science, vol. 21, no. 2, pp. 179–217, 1997. [Google Scholar]
42. D. Keim and C. Graphics, “Information visualization and visual data mining,” IEEE Transactions on Visualization and Computer Graphics, vol. 8, no. 1, pp. 1–8, 2002. [Google Scholar]
43. A. Constantin, S. Pettifer and A. Voronkov, “PDFX: Fully-automated PDF-to-XML conversion of scientific literature,” in Proc. ACM Symposium on Document Engineering, New York, USA, pp. 177–180, 2013. [Google Scholar]
44. Y. Zhao, Z. Chen, S. Cai and Z. YAN, “Dynamic web visualization of large scientific computing data,” Modern Computer, vol. 14, pp. 3–6, 2012. [Google Scholar]
45. B. Shneiderman, “The eyes have it: A task by data type taxonomy for information visualizations,” in Proc. of the IEEE Symp. on Visual Languages, Boulder, USA, pp. 336–343, 1996. [Google Scholar]
Cite This Article
 Copyright © 2023 The Author(s). Published by Tech Science Press.
This work is licensed under a Creative Commons Attribution 4.0 International License , which permits unrestricted use, distribution, and reproduction in any medium, provided the original work is properly cited.
 Downloads
 Citation Tools