
 Submit a Paper
 Propose a Special lssue
 Open Access
ARTICLE

Optimal Machine Learning Driven Sentiment Analysis on COVID-19 Twitter Data
1 Information Systems Department, Faculty of Computing and Information Technology, King Abdulaziz University, Jeddah, 21589, Saudi Arabia
2 Center of Excellence in Smart Environment Research, King Abdulaziz University, Jeddah, 21589, Saudi Arabia
3 Information Systems Department, HECI School, Dar Alhekma University, Jeddah, Saudi Arabia
4 Information Technology Department, Faculty of Computing and Information Technology, King Abdulaziz University, Jeddah, 21589, Saudi Arabia
5 Department of Mathematics, Faculty of Science, Al-Azhar University, Naser City, 11884, Cairo, Egypt
6 Centre for Artificial Intelligence in Precision Medicines, King Abdulaziz University, Jeddah, 21589, Saudi Arabia
* Corresponding Author: Mahmoud Ragab. Email:
Computers, Materials & Continua 2023, 75(1), 81-97. https://doi.org/10.32604/cmc.2023.033406
Received 15 June 2022; Accepted 15 September 2022; Issue published 06 February 2023
 View Full Text
 Download PDF
Abstract
The outbreak of the pandemic, caused by Coronavirus Disease 2019 (COVID-19), has affected the daily activities of people across the globe. During COVID-19 outbreak and the successive lockdowns, Twitter was heavily used and the number of tweets regarding COVID-19 increased tremendously. Several studies used Sentiment Analysis (SA) to analyze the emotions expressed through tweets upon COVID-19. Therefore, in current study, a new Artificial Bee Colony (ABC) with Machine Learning-driven SA (ABCML-SA) model is developed for conducting Sentiment Analysis of COVID-19 Twitter data. The prime focus of the presented ABCML-SA model is to recognize the sentiments expressed in tweets made upon COVID-19. It involves data pre-processing at the initial stage followed by n-gram based feature extraction to derive the feature vectors. For identification and classification of the sentiments, the Support Vector Machine (SVM) model is exploited. At last, the ABC algorithm is applied to fine tune the parameters involved in SVM. To demonstrate the improved performance of the proposed ABCML-SA model, a sequence of simulations was conducted. The comparative assessment results confirmed the effectual performance of the proposed ABCML-SA model over other approaches.Keywords
The impact of Coronavirus Disease 2019 (COVID-19) upon the daily routines of people across the globe was disastrous. People utilized social media to express their thoughts and feelings regarding the unprecedented events that occurred after the outbreak of COVID-19. Social Networking Sites like Twitter experienced a tremendous increase in the number of users and their usage. In other terms, the number of tweets increased in relation to the pandemic within a short period of time [1]. Twitter is one of the most typically used social media platforms. It offers real information about the ongoing events in brief and seizures the thoughts and emotions of the people. During pandemic lockdown, people used social media platforms like Twitter to express their emotions, feelings, thoughts and opinions about the pandemic worldwide [2]. COVID-19 rapidly spread across the globe and the number of COVID-19 positive cases increased within a short span of time. Various nations got affected since the infection is an air-borne one. The disease tend to affect the person who shares close space with an infected individual. Global biomedical professionals made persistent efforts to contain the spread of disease and help the patients using the available medicines [3]. Vaccination was found to be the most effectual strategy to prevent the spread of coronavirus infection globally. Those individuals affected with coronavirus were advised to isolate themselves and were prescribed to test themselves from time to time, whereas the rest of the people were advised to get vaccinated [4].
Individuals exhibited their feelings through social networking sites when they were in isolation. Because, social media had realistic and valuable information regarding coronavirus infection; but, the information from mass media was considered to be misleading or useless in some cases [5]. Miseries increased when the data from online media was found to be misleading. Work from home, isolation time and stay-at-home became the new norm and were frequently used in social media to share the emotions, news, advice and opinions [6]. Misinformation is defined as an attempt made to misdirect others with fake or inappropriate data, for instance, ‘consuming bananas was a preventative measure against this viral infection.’ An individual, affected by COVID-19, undergoes multiple levels of mental and physical health issues. So, the disease condition demands to apply logical policies so as to comprehend informative data streams [7]. Social networking sites like Facebook and Twitter have too much of noisy information. Hence, it is challenging to find a useful content from such huge volumes of noisy data. However, if the noisy data is cleaned, it is possible to capture different types of emotions, human feelings, thoughts and expressions. Through complete analysis, the data can provide more information regarding the present attitude, nature and mood of a large human society [8].
Sentiment Analysis (SA) is also termed as emotion or opinion Artificial Intelligence (AI). It uses Machine Learning (ML), computational linguistics, Natural Language Processing (NLP) and text analysis processes to methodically examine the texts written by people [9]. The results from SA help in determining the sentiments, opinions, attitudes and emotions. SA is broadly implemented to gain insights about online media posts. It intends to differentiate the polarity of a text as neutral, positive and negative [10]. Thus, the main topic in SA is to realize the responses for the tweets made at first. Till now, several researchers have scrutinized the effects of a tweet’s Sentiment Polarity (SP) based on the responses received for the tweet. The current research work intends to fill this research gap.
The current study presents an Artificial Bee Colony (ABC) with Machine Learning-driven SA (ABCML-SA) model for conducting Sentiment Analysis of COVID-19 Twitter data. The prime focus of the presented ABCML-SA model is to recognize the sentiments present in COVID-19 tweets. The model involves data preprocessing at the initial stage followed by n-gram feature extraction to derive the feature vectors. For identification and classification of the sentiments, the Support Vector Machine (SVM) model is exploited. At last, the ABC algorithm is applied to fine tune the parameters involved in SVM. In order to demonstrate the improved performance of the proposed ABCML-SA model, a sequence of simulations was conducted.
Naseem et al. [11] developed a policy to be implemented in social networking sites. For instance, the policy decides the level of moderation required to curtail the misinformation on social networking sites. This work also examined the views, with regards to COVID-19, by concentrating on individuals who communicated and shared their opinions in Twitter. In the study conducted earlier [12], SA was conducted for the tweets made by individuals from the top-10 infected nations. The experimentations were carried out using the collected data i.e., individuals’ tweets from the top-10 infected nations along with the Sultanate of Oman. In literature [13], Sentiment Analysis was conducted upon the tweets made during the first wave of COVID-19 pandemic in Europe. This study used Neural Network (NN) for SA using multilingual sentence embeddings.
Pastor [14] focused on how to expose the sentiments of Filipinos, especially from Luzon region, during the regulation of extreme community quarantine at the time of COVID-19 outbreak. The study collected a twitter user’s tweets from the Philippines. It examined the impact of the pandemic upon a person’s lifestyle changes based on their tweets. NLP is one of the techniques that can be applied in determining a user’s sentiment from the extracted tweets. In this study, opinions were assumed as data to conduct the analysis. Qualitative method was utilized in this study to determine the impact of extreme community quarantine in Luzon region, the Philippines.
In the study conducted earlier [15], a rule-related method was employed to conduct SA upon the tweets made by the Honorable President, Donald Trump, during the initial spread of COVID-19 infection in the United States (US). The study found a statistically-important adverse relation between the sentiments of his messages and the sum of COVID-19 cases recorded in the US. The results inferred that his tone in the tweets made an impact and the pandemic severely affected the lives and the economy of the US. Pano et al. [16] enhanced a distinct text preprocessing strategy to correlate the sentiment scores secured by Twitter text with Bitcoin prices during COVID-19 lockdown. In addition, the authors explored the impact of several preprocessing features, time lengths and the functions of data upon the outcomes of the correlation process. Among 13 approaches, the authors found that dividing the sentences or eliminating Twitter-specific tags or both the activities enhanced the relation of volume polarity and sentiment scores with Bitcoin rates.
In current study, a new ABCML-SA method is proposed for conducting sentiment analysis of the COVID-19 Twitter data. The prime focus of the presented ABCML-SA is to recognize the sentiments present in COVID-19 tweets. It involves data pre-processing at the initial stage and n-gram feature extraction in the next stage to derive the feature vectors. For identification and classification of the sentiments, the SVM model is exploited. At last, the ABC algorithm is applied to fine tune the parameters involved in SVM. Fig. 1 illustrates the block diagram of ABCML-SA approach.

Figure 1: Block diagram of ABCML-SA approach
In this initial phase, ABCML-SA model performs pre-processing of the data to transform the input data into a compatible form. Data pre-processing is primarily executed to clean the raw data, by following a few steps, so as to attain superior outcomes in multiple assessments. The collected data is pre-processed using a user-defined pre-processing function related to Natural Language Toolkit (NLTK) i.e., Python library for NLP. Stemming is helpful in reducing the inflected words to its base or root form whereas Tokenization helps in dividing every sentence into small words.
Next, the n-gram model is applied to generate the feature vectors. After pre-processing, the study follows the Bag-of-Words (BOW) mechanism with a commonly-emerged word from lexicon words and attains a list of the most-commonly used words for COVID-19 [17]. Numerous words are established within the produced corpus at different times and dissimilar locations of the Twitter. Now, the reappearance of every word is calculated and the top 50 commonly-used words are proposed together with popularity. Then, word popularity is determined to evaluate the possibility of recurrence for all the words i.e., 3, 53, 704 words in total. Both probability and popularity counts of the most commonly-used words are represented as follows.
Lexical
For instance, a sentence is assumed to be ‘Still Covid19 wave is running’. According to the probability chain rules, P(“Still Covid
Bigram models estimate the probability of the words using the condition probability
The probability is determined as given below.
The authors found the most commonly-used unigram, bigram and trigrams within the corpus through the
3.3 SVM Based Sentiment Classification
In order to identify and classify the sentiments, SVM model is exploited. SVM is a two-class classification model and is defined herewith. Consider that
In case of a hyperplane, linear separation is achieved. The instance near one to the separating hyperplane is named as support vector. In boundary (support vector), Eq. (8) is rewritten as follows.
Based on Eq. (9):
Hence, the issue is to find w and b. Various hyperplanes are available to split the two-class dataset. However, SVM generates the optimum hyperplane. This hyperplane has the maximal distance to assist the vector. The margin of the splitting hyperplane is
Though the instances are linearly separable during most of the instances, it cannot be detached easily. For non-linear problems, a positive slack parameter
In Eq. (11), C is named after penalty factor. It is familiarized to regulate the trade-off between error minimization and margin maximization. This issue is resolved using Lagrange multiplier. Fig. 2 illustrates the SVM hyperplane.

Figure 2: SVM hyperplane
In Eq. (12),
Here,
Some kernel function is
linear:
polynomial:
RBF:
and quadratic:
In each function,
3.4 ABC Based Parameter Tuning
Finally, ABC algorithm is applied to fine tune the parameters related to SVM. ABC algorithm is a popular algorithm that was developed to overcome continuous optimization problems. The algorithm was inspired from the natural foraging behaviour of honey bees. ABC algorithm makes use of three control variables and three types of artificial bees such as the scouts, the employed bees and the onlooker bees. The employed bee makes half of a colony. As far as the algorithm is concerned, the food sources signify a feasible solution. A single employed bee is allocated for every food source. The employed bee implements the searching method by investigating a solution in its neighbourhood. The onlooker bees select the food sources for exploitation on the basis of the data gained from the employed bees. In case, if a food source does not increase for a predefined number of cycles, the scout bees replace the food source with a novel one that is selected on a random basis. As an iterative process, ABC algorithm initiates again by relating every employed bee with an arbitrarily-produced food source. Every bee
Various formulas are used for fitness function. However, in most of the implementation works, especially for maximization problems, fitness is proportionate to the objective function value. If the issue to be resolved targets the minimization of the function and is represented by
Every employed bee finds a food source in the neighbourhood and computes the fitness. The location of the new neighbourhood solution is formulated using the Eq. (17) in which
Once the fitness of the novel solution is higher than the fitness of the previous one, then the employed bees continue to execute exploitation method using novel food sources, or else it retains the older one. The employed bees share the data regarding the fitness of the food source to onlooker bees whereas the onlooker bees select a food source i with probability which is proportionate to the solution fitness.
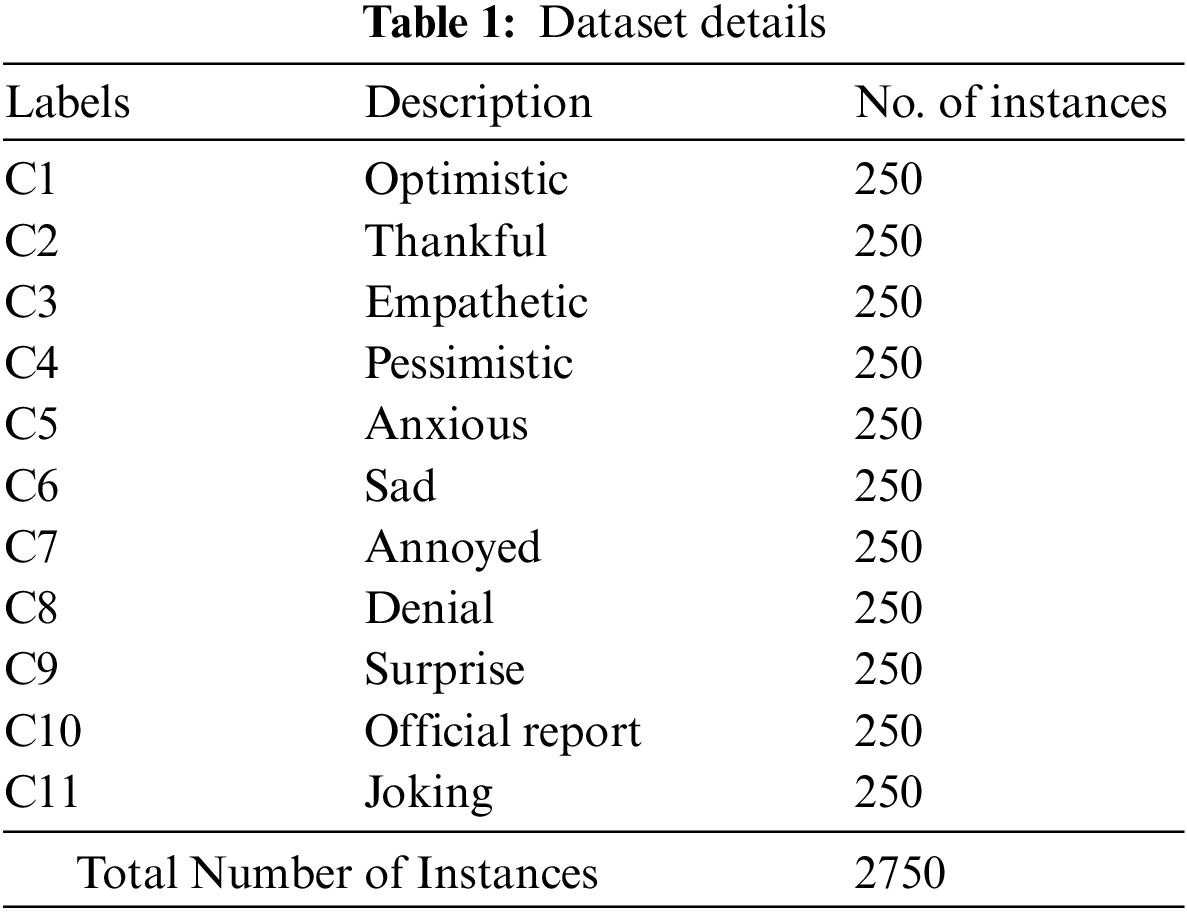
The proposed ABCML-SA model was experimentally validated for sentiment analysis performance using COVID-19 tweets dataset (available at https://www.kaggle.com/competitions/sentiment-analysisof-COVID-19-related-tweets/data?select=validation.csv). The dataset has a total of 2,750 sample tweets under 11 class labels as depicted in Table 1. Each class holds a total of 250 samples.
The confusion matrices, generated by the proposed ABCML-SA model, on the applied dataset under different Training (TR) and Testing (TS) datasets, are shown in Fig. 3. On the entire dataset, the proposed ABCML-SA model recognized 249 samples as C1, 247 samples as C2, 245 samples as C3, 246 samples as C4, 241 samples as C5, 250 samples as C6, 246 samples as C7, 244 samples as C8, 247 samples as C9, 246 samples as C10, and 247 samples as C11 class respectively. Also, on 70% of TR data, ABCML-SA methodology categorized 181 samples under C1, 177 samples under C2, 168 samples under C3, 173 samples under C4, 168 samples under C5, 177 samples under C6, 187 samples under C7, 174 samples under C8, 170 samples under C9, 170 samples under C10 and 160 samples under C11 class correspondingly. Besides, on 30% of TS data, the presented ABCML-SA technique classified 68 samples under C1, 70 samples under C2, 77 samples under C3, 73 samples under C4, 73 samples under C5, 73 samples under C6, 59 samples under C7, 70 samples under C8, 77 samples under C9, 84 samples under C10 and 87 samples under C11 class respectively.

Figure 3: Confusion matrices of ABCML-SA approach (a) entire dataset, (b) 70% of TR data, and (c) 30% of TS data
Table 2 shows the SA outcomes of the proposed ABCML-SA model on the applied data. Fig. 4 shows the
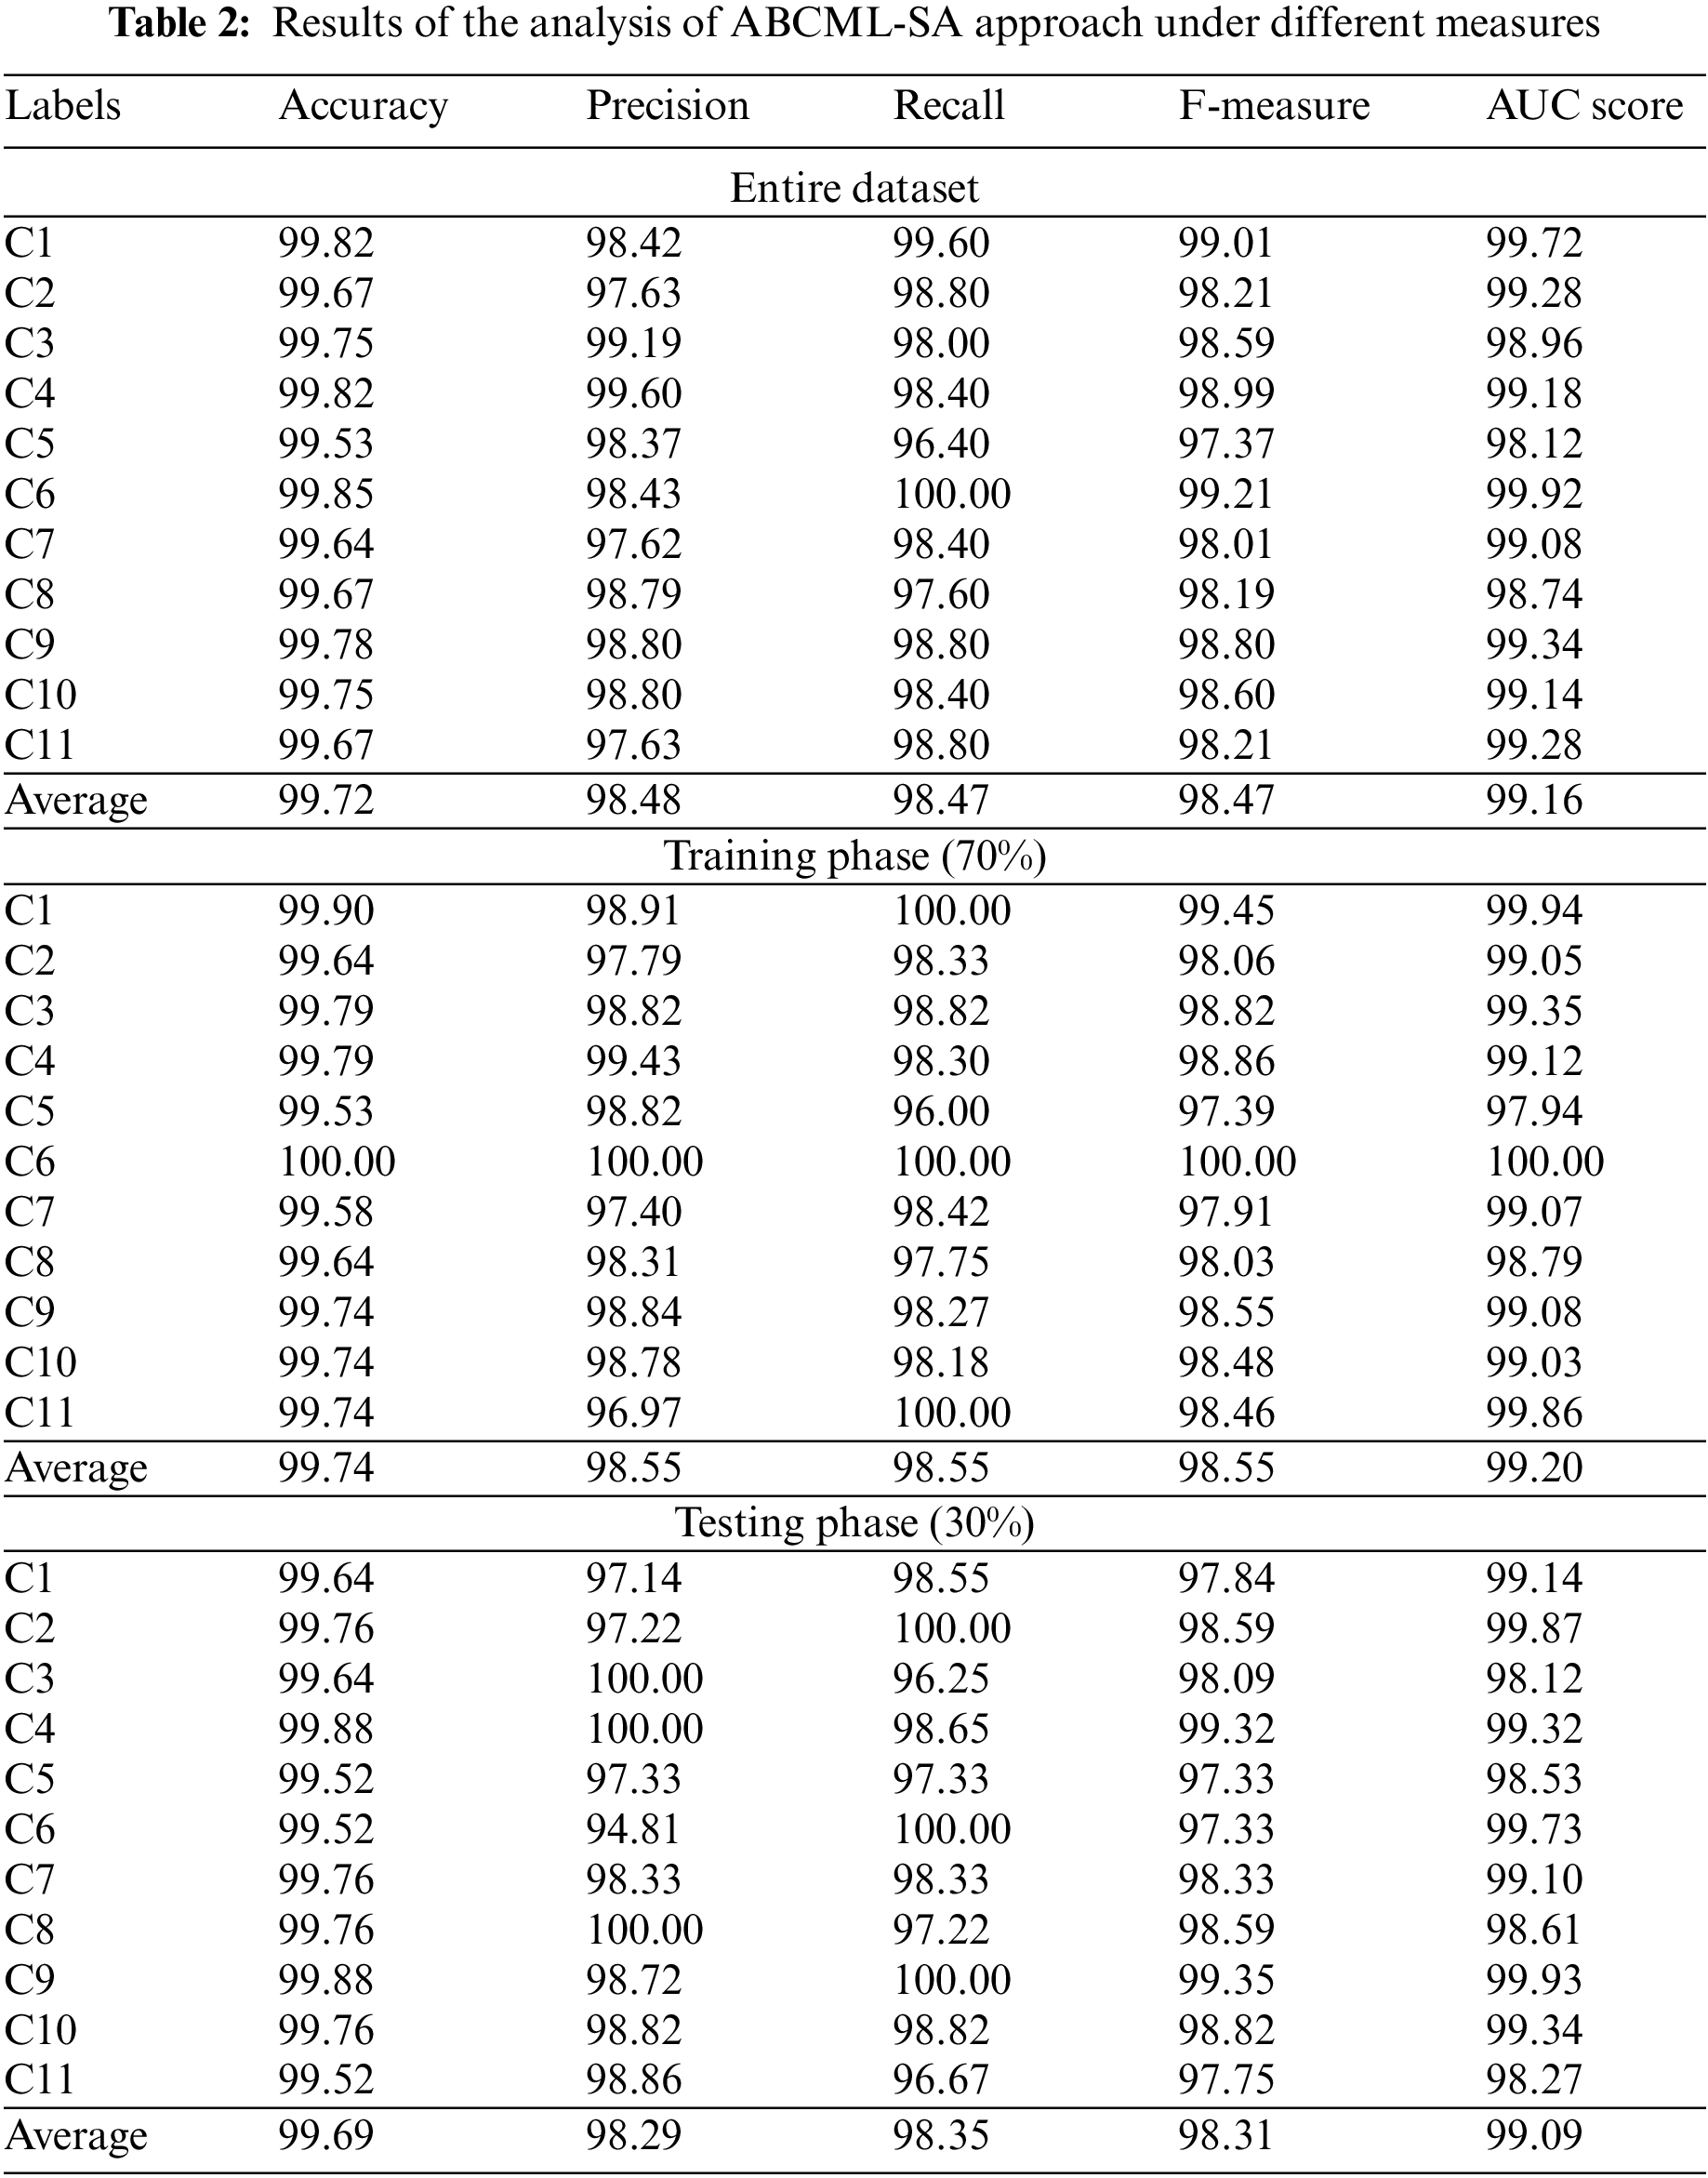

Figure 4:
Fig. 5 depicts the

Figure 5:
Both Training Accuracy (TA) and Validation Accuracy (VA) values, acquired by the proposed ABCML-SA method on test dataset, are demonstrated in Fig. 6. The experimental outcomes infer that the proposed ABCML-SA approach attained the maximum TA and VA values whereas VA values were higher than TA.

Figure 6: TA and VA analyses results of ABCML-SA approach
Both Training Loss (TL) and Validation Loss (VL) values, obtained by the proposed ABCML-SA approach on test dataset, are shown in Fig. 7. The experimental outcomes imply that the proposed ABCML-SA algorithm established the minimal TL and VL values whereas VL values were lesser than TL.

Figure 7: TL and VL analyses results of ABCML-SA approach
A comparative assessment was conducted between ABCML-SA model and other recent models and the results are shown in Table 3 [19]. Fig. 8 portrays the comparison study results accomplished by ABCML-SA model and other existing models in terms of
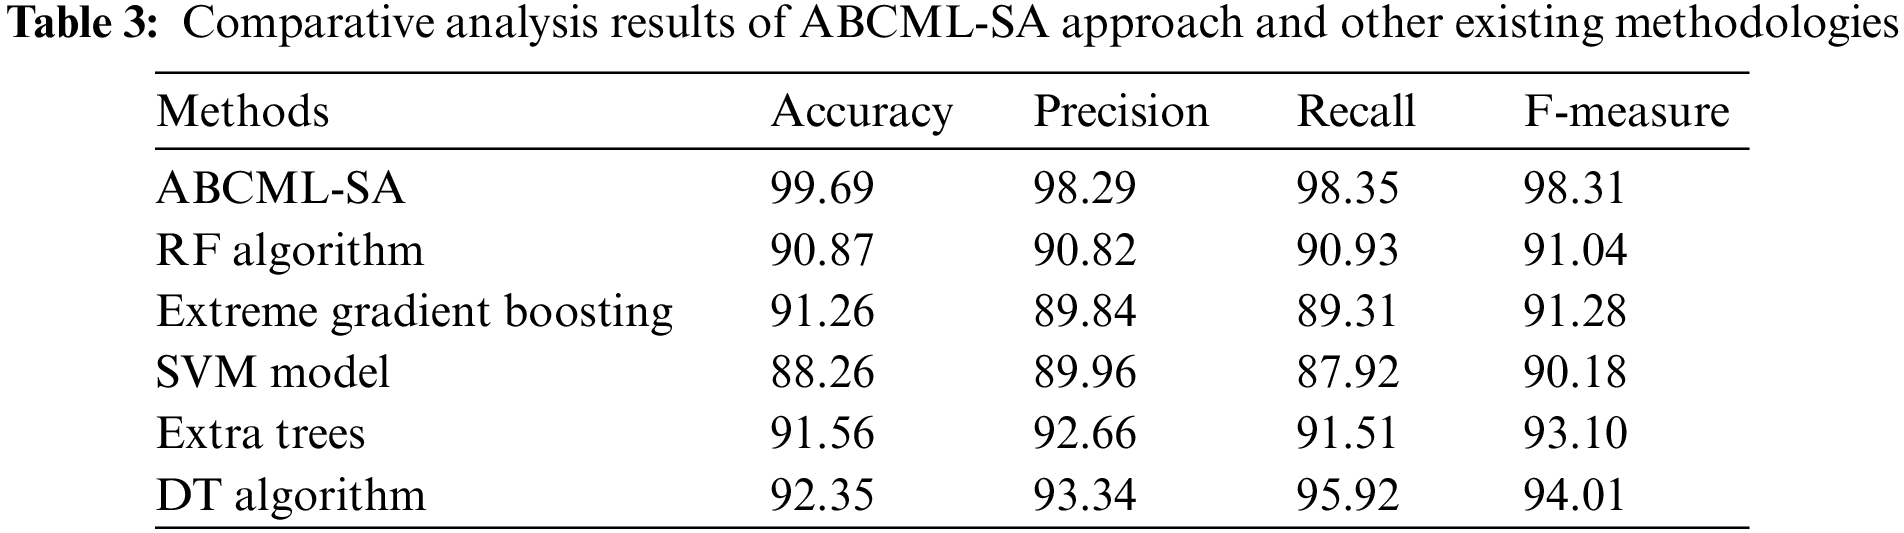

Figure 8:
Fig. 9 shows the results achieved by the proposed ABCML-SA method and other existing models in terms of

Figure 9:
Fig. 10 indicates the detailed study outcomes achieved by ABCML-SA methodology and other existing models in terms of
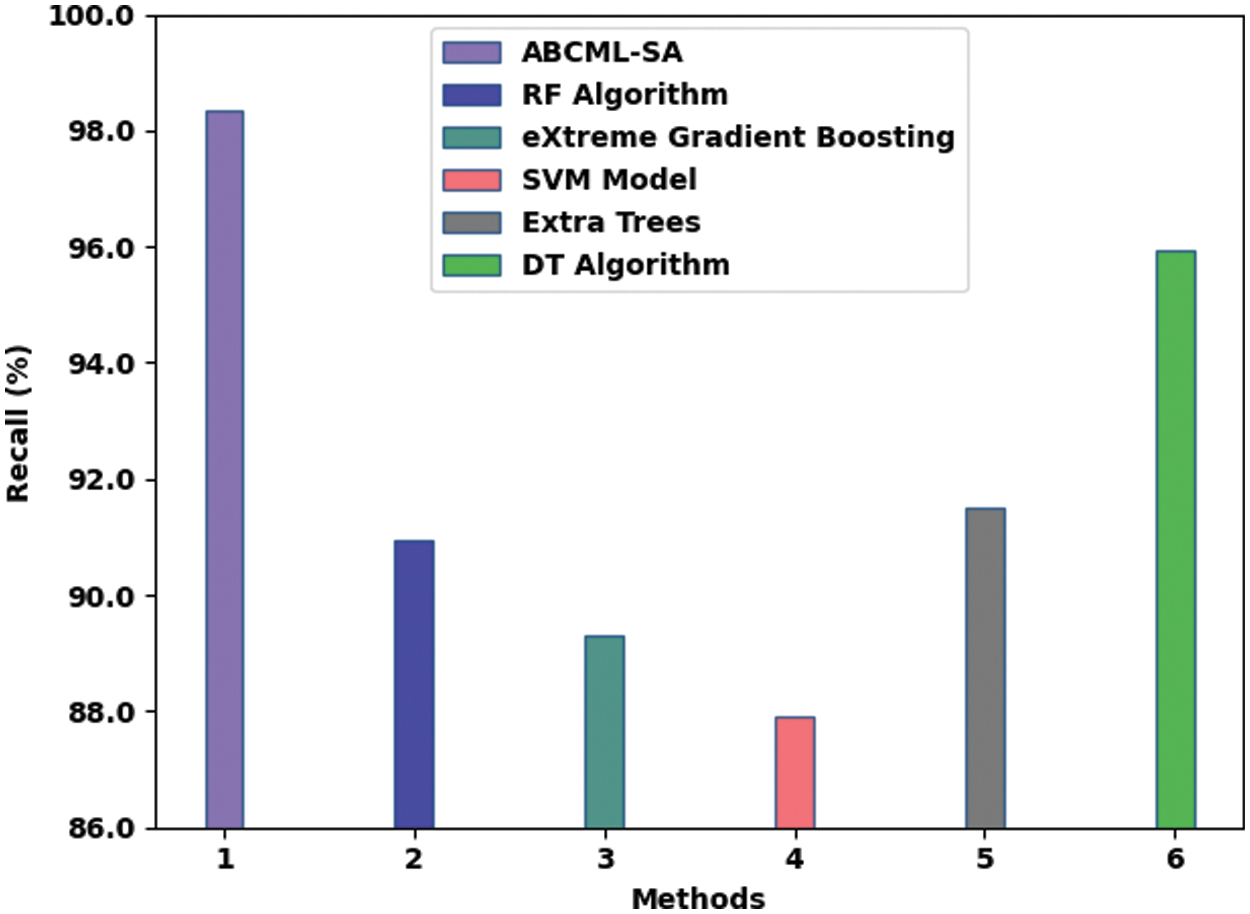
Figure 10:
Fig. 11 depicts the comparative study results accomplished by the proposed ABCML-SA algorithm and other existing models in terms of

Figure 11:
In this study, a new ABCML-SA method has been developed for conducting Sentiment Analysis on COVID-19 Twitter data. The key objective of the presented ABCML-SA model is to recognize the sentiments expressed in COVID-19 tweets. It involves data pre-processing at the initial stage followed by n-gram based feature extraction in the second stage to derive the feature vectors. For identification and classification of the sentiments, the SVM model is exploited. At last, the ABC algorithm is applied to fine tune the parameters involved in SVM. To demonstrate the enhanced performance of ABCML-SA model, a sequence of simulations was conducted. The comparative analysis outcomes confirmed the effectual performance of the proposed ABCML-SA model over other approaches.
Acknowledgement: The Deanship of Scientific Research (DSR) at King Abdulaziz University, Jeddah, Saudi Arabia has funded this project, under Grant No. (FP-205-43). The authors, therefore acknowledge with thanks DSR for technical and financial support.
Funding Statement: The Deanship of Scientific Research (DSR) at King Abdulaziz University, Jeddah, Saudi Arabia has funded this project, under Grant No. (FP-205-43).
Conflicts of Interest: The authors declare that they have no conflicts of interest to report regarding the present study.
References
1. D. V. Cruz, V. F. Cortez, A. L. Chau and R. S. Almazán, “Does twitter affect stock market decisions? financial sentiment analysis during pandemics: A comparative study of the h1n1 and the COVID-19 periods,” Cognitive Computation, vol. 14, no. 1, pp. 372–387, 2021. [Google Scholar]
2. S. Boon-Itt and Y. Skunkan, “Public perception of the COVID-19 pandemic on twitter: Sentiment analysis and topic modeling study,” JMIR Public Health and Surveillance, vol. 6, no. 4, pp. e21978, 2020. [Google Scholar]
3. K. H. Manguri, R. N. Ramadhan and P. R. Mohammed Amin, “Twitter sentiment analysis on worldwide COVID-19 outbreaks,” Kurdistan Journal of Applied Research, vol. 5, no. 3, pp. 54–65, 2020. [Google Scholar]
4. S. H. Sahir, R. S. A. Ramadhana, M. F. R. Marpaung, S. R. Munthe and R. Watrianthos, “Online learning sentiment analysis during the COVID-19 Indonesia pandemic using twitter data,” IOP Conference Series: Materials Science and Engineering, vol. 1156, no. 1, pp. 012011, 2021. [Google Scholar]
5. M. Rahman and M. N. Islam, “Exploring the performance of ensemble machine learning classifiers for sentiment analysis of COVID-19 tweets,” in Sentimental Analysis and Deep Learning, vol. 1408, pp. 383–39, 2022, Springer, Singapore: Advances in Intelligent Systems and Computing book series. [Google Scholar]
6. K. Chakraborty, S. Bhatia, S. Bhattacharyya, J. Platos, R. Bag et al., “Sentiment analysis of COVID-19 tweets by deep learning classifiers—a study to show how popularity is affecting accuracy in social media,” Applied Soft Computing, vol. 97, pp. 106754, 2020. [Google Scholar]
7. Z. B. Nezhad and M. A. Deihimi, “Twitter sentiment analysis from Iran about COVID 19 vaccine,” Diabetes & Metabolic Syndrome: Clinical Research & Reviews, vol. 16, no. 1, pp. 102367, 2022. [Google Scholar]
8. C. Villavicencio, J. J. Macrohon, X. A. Inbaraj, J. H. Jeng and J. G. Hsieh, “Twitter sentiment analysis towards COVID-19 vaccines in the Philippines using naïve Bayes,” Information, vol. 12, no. 5, pp. 204, 2021. [Google Scholar]
9. N. A. Alkhaldi, Y. Asiri, A. M. Mashraqi, H. T. Halawani, S. A. Khalek et al., “Leveraging tweets for artificial intelligence driven sentiment analysis on the COVID-19 pandemic,” Healthcare, vol. 10, no. 5, pp. 910, 2022. [Google Scholar]
10. Y. Lu and Q. Zheng, “Twitter public sentiment dynamics on cruise tourism during the COVID-19 pandemic,” Current Issues in Tourism, vol. 24, no. 7, pp. 892–898, 2021. [Google Scholar]
11. U. Naseem, I. Razzak, M. Khushi, P. W. Eklund and J. Kim, “COVIDSenti: A large-scale benchmark twitter data set for COVID-19 sentiment analysis,” IEEE Transactions on Computational Social Systems, vol. 8, no. 4, pp. 1003–1015, 2021. [Google Scholar]
12. M. Kausar, A. Soosaimanickam and M. Nasar, “Public sentiment analysis on twitter data during COVID-19 outbreak,” International Journal of Advanced Computer Science and Applications, vol. 12, no. 2, pp. 415–422, 2021. [Google Scholar]
13. A. Kruspe, M. Häberle, I. Kuhn and X. X. Zhu, “Cross-language sentiment analysis of european twitter messages during the COVID-19 pandemic,” arXiv:2008.12172v1, pp. 1–10, 2020. [Google Scholar]
14. C. K. Pastor, “Sentiment analysis of Filipinos and effects of extreme community quarantine due to coronavirus (COVID-19) pandemic,” Social Science Research Network, Rochester, NY, SSRN Scholarly Paper ID 3574385, Apr. 2020. 2022. [Online]. Available: https://papers.ssrn.com/abstract=3574385 (accessed on 15 June 2022). [Google Scholar]
15. U. Yaqub, “Tweeting during the COVID-19 pandemic: Sentiment analysis of twitter messages by president trump,” Digital Government: Research and Practice, vol. 2, no. 1, pp. 1–7, 2021. [Google Scholar]
16. T. Pano and R. Kashef, “A complete vader-based sentiment analysis of bitcoin (btc) tweets during the era of COVID-19,” Big Data and Cognitive Computing, vol. 4, no. 4, pp. 33, 2020. [Google Scholar]
17. M. Ghiassi, J. Skinner and D. Zimbra, “Twitter brand sentiment analysis: A hybrid system using n-gram analysis and dynamic artificial neural network,” Expert Systems with Applications, vol. 40, no. 16, pp. 6266–6282, 2013. [Google Scholar]
18. D. K. Pathak, S. K. Kalita and D. K. Bhattacharya, “Hyperspectral image classification using support vector machine: A spectral spatial feature based approach,” Evolutionary Intelligence, pp. 1–15, 2021, DOI: 10.1007/s12065-021-00591-0. [Google Scholar] [CrossRef]
19. K. Shankar, E. Perumal, V. G. Díaz, P. Tiwari, D. Gupta et al., “An optimal cascaded recurrent neural network for intelligent COVID-19 detection using chest X-ray images,” Applied Soft Computing, vol. 113, Part A, pp. 1–13, 2021. [Google Scholar]
Cite This Article
 Copyright © 2023 The Author(s). Published by Tech Science Press.
This work is licensed under a Creative Commons Attribution 4.0 International License , which permits unrestricted use, distribution, and reproduction in any medium, provided the original work is properly cited.
 Downloads
 Citation Tools