
 Submit a Paper
 Propose a Special lssue
 Open Access
ARTICLE
A Deep CNN-LSTM-Based Feature Extraction for Cyber-Physical System Monitoring
Department of Information Systems, Faculty of Computing and Information Technology, King Abdulaziz University, Jeddah, 21589, Saudi Arabia
* Corresponding Author: Alaa Omran Almagrabi. Email:
Computers, Materials & Continua 2023, 76(2), 2079-2093. https://doi.org/10.32604/cmc.2023.039683
Received 10 February 2023; Accepted 15 June 2023; Issue published 30 August 2023
 View Full Text
 Download PDF
Abstract
A potential concept that could be effective for multiple applications is a “cyber-physical system” (CPS). The Internet of Things (IoT) has evolved as a research area, presenting new challenges in obtaining valuable data through environmental monitoring. The existing work solely focuses on classifying the audio system of CPS without utilizing feature extraction. This study employs a deep learning method, CNN-LSTM, and two-way feature extraction to classify audio systems within CPS. The primary objective of this system, which is built upon a convolutional neural network (CNN) with Long Short Term Memory (LSTM), is to analyze the vocalization patterns of two different species of anurans. It has been demonstrated that CNNs, when combined with mel-spectrograms for sound analysis, are suitable for classifying ambient noises. Initially, the data is augmented and preprocessed. Next, the mel spectrogram features are extracted through two-way feature extraction. First, Principal Component Analysis (PCA) is utilized for dimensionality reduction, followed by Transfer learning for audio feature extraction. Finally, the classification is performed using the CNN-LSTM process. This methodology can potentially be employed for categorizing various biological acoustic objects and analyzing biodiversity indexes in natural environments, resulting in high classification accuracy. The study highlights that this CNN-LSTM approach enables cost-effective and resource-efficient monitoring of large natural regions. The dissemination of updated CNN-LSTM models across distant IoT nodes is facilitated flexibly and dynamically through the utilization of CPS.Keywords
In the present day, there is a growing focus on global initiatives aimed at organizing the relationships between different entities worldwide, such as states, businesses, and others. These efforts have garnered the attention of international institutions, including the United Nations (UN), and are centered around establishing sustainable development objectives (SDGs). Notably, the SDGs that have received significant attention include Goals 11, which focuses on ecological cities and towns; 13, centered on environmental policy, 14, which addresses life beneath the sea; and 15, which concerns living on earth. Local and regional institutions are working towards a plan to accomplish these objectives.
This is precisely the situation with the Doana Biological Station (DBS). This public research organization is a part of the area of Natural Resources in Spanish Council for Scientific Research-CSIC and is situated in the Spain’s south. Its research primarily concentrates on the Doana National Park which is 135 km2 natural park comprising various ecologies. On their routes from Europe to Africa, multiple species of birds pause in the DNP, an important ecosystem. These characteristics give this area an exceptional setting for exploring various facets of the relationships between people and the natural world [1].
The SCENA-RBD project, created by the Seville university in DBS conjunction, is discussed in this publication. The project’s primary objective is to plan and implement a CPS that enables distributed information analysis for biological information. For different authorities (regional, national, and international), this CPS will be a valuable resource for assessing an area’s durability. Many parameters can be considered for this [2].
The initial step of the CPS is the main topic of this essay. The voice recording comes first. Machines and equipment like the Song Meter [3] have developed into reliable systems for high-quality field recordings of wildlife sounds. The associated software often provided by these devices allows for captured data after analysis is made. Moreover, this kind of item has characteristics that should be considered while deploying several sensing devices. First off, the devices are relatively expensive. If the study region is large, it is necessary to disperse a sizable number of components. This can significantly raise the cost of the project.
Even though some initiatives (such as AudioMoth [4]) are built on open hardware and thus lower the cost of production, the options they present could be more flexible and stable. Second, this kind of gadget captures sound waves on a predetermined timetable. This trait entails a lack of adaptability, resulting in much data with little helpful information. Finding out what specific events might start the data transfer would be beneficial. Thirdly, there is no way to perform any processing. Such data are either saved in their raw state or after simple preparation. A single channel (mono) with 16 bits in each sample records audio waveforms with a standardized bandwidth of 19 to 19 kHz at a sampling frequency of 44.1 kHz.
Another successful method was using CNNs and Deep CNNs [5,6] and other standard techniques to extract expressions from voice. The researchers employed the Deep CNNs [7] to address the problem. Two convolutional layers and two pooling layers used to train and validate the data, the best accuracy of 40.2% in test is obtained. The standard classification problem is solved using support vector machine, and the authors in [8] conducted a thorough study utilizing them. They approached the issue using a support vector machine in biased state. Their highest average accuracy was 58.24%. The proposed contributions is stated below:
• Toto extracts two pairs of features from voice data, and two-way feature extraction is proposed.
• The two-way feature extraction models are principal component analysis (PCA) and Transfer learning with dense and dropout layers for extracting Mel spectrograms.
• The CNN-LSTM is used for the anuran sounds classification, and also it uses focal loss to minimize the data imbalance.
The research article is presented as follows: the related work is discussed in Section 2 on Cyber-physical systems, Deep learning and environmental monitoring techniques. Section 3 explains general working architecture of the proposed scenario. Section 4 provides implementation outcomes and results performance evaluation. At end, Section 5 states conclusion of the work and result evaluation is discussed.
In the literature, there are two methods used by different research teams to categorize anuran sounds using CNNs [9,10]. The first study [11] investigated the classification of anuran noises using CNN with MelFrequency Cepstral Coefficient as input. The database has 7784 noises from the Leptodactylidae, Hylidae, Dendrobatidae and Bufonidae anuran families. The Two binary CNN are developed, with the ability to distinguish between members of the Leptodactylidae family with 91.41% accuracy and Adenomera Hylaedactyla species with 99.14% accuracy.
A collection of papers [12–14] from our research team at the University of Seville have been published in the automatic detection framework and classification of noises using different techniques. The MPEG-7 standards were thoroughly examined in [15] to produce standardized acoustic characteristics that could describe animal sound sequences. The study’s findings show the benefits of using this norm in scaling the acoustic wireless sensor networks.
Additionally, research in [16] evaluated using a log mel filterbank on a CNN to detect ad hoc respiratory sounds. In contrast, a work by authors [17] used continuous wavelet transform (CWT) and STFT characteristics for training the CNN that can predict four different types of sounds from lungs. Although STFT characteristics were used for a SVM classifier and VGG16 in [18] for the same target, Liu et al. [19] described a bidirectional residual network (bi-ResNet) that combines short-time Fourier transform (STFT) features and wavelet analysis to classify lung sounds.
In addition to the research conducted by CNN [20–22], LSTMs [23], deep neural networks (DNNs) [24–26], and the combination of CNN and LSTM models have also shown promising results in the field of expression recognition. LSTMs are advanced versions of Recurrent Neural Networks (RNNs) that have been optimized with gating mechanisms to regulate data flow. This methodology was employed in a previous study [27]. The study utilized magnitude, log-mel, and Mel-Frequency Cepstral Coefficients (MFCC) spectrograms extracted from the data, and a hybrid CNN-LSTM model was trained and evaluated. The researchers used MFCCs as input and achieved an accuracy of 82.35%. It is worth noting that this study focused on evaluating only four specific emotions.
The proposed audio wave processing is processed using Deep Learning methods, and it implements the Cyber-Physical System (CPS), which also has physical IoT systems. Initially, the sound waves are collected by the CPS system through IoT Sensor nodes. Next, the data is augmented, and then the mel spectrograms are generated. Then the mel spectrograms features are extracted using Two-way feature extraction methods such as Principal component analysis (PCA) and Transfer Learning (TL). Finally, the extracted features are given in the classification process using CNN-LSTM methods.
3.1 Implementation of Cyber-Physical System
The decentralized structure is used to implement Cyber-Physical Systems (CPS). The sound wave data is gathered from the source node and processed the data. The CNN-LSTM classification method finally produces the short plain text file. With the help of sink nodes, the files are collected.
In contrast to traditional guidelines, the CPS approach combines methodologies from both the physical and cyber domains, ensuring a comprehensive integration.
The approach used in this method creates CNN-LSTM implementations with two stages: learning in a cyber system and CNN-LSTM deployment over networks in a physical system. This approach needs to be examined in light of many criteria. The communication capabilities between nodes and physical and cyber systems are crucial to achieving the goals since CPS employs a distributed processing paradigm. On the one hand, the network cannot allow the transfer of raw voice files because of the low connection speed of wireless links between nodes.
Hence, each node should use its processing power to run the CNN-LSTM. There are two options: preprocessing the CPU audio signal and running CNN on the GPU or running CNN-LSTM on the CPU. The CPU pre-processes an audio file, and CNN-LSTM runs in this research with the help of a TensorFlow Lite Library [28]. The testbed platform utilized in this study is built upon the System on Chip (SoC) BCM2835. This SoC features the ARM1176JZF-S microprocessor, which operates at a clock speed of 700 MHz and has the ability to overclock up to 1 GHz with the assistance of the GPU VideoCore IV. The architecture of the proposed method is illustrated in Fig. 1.
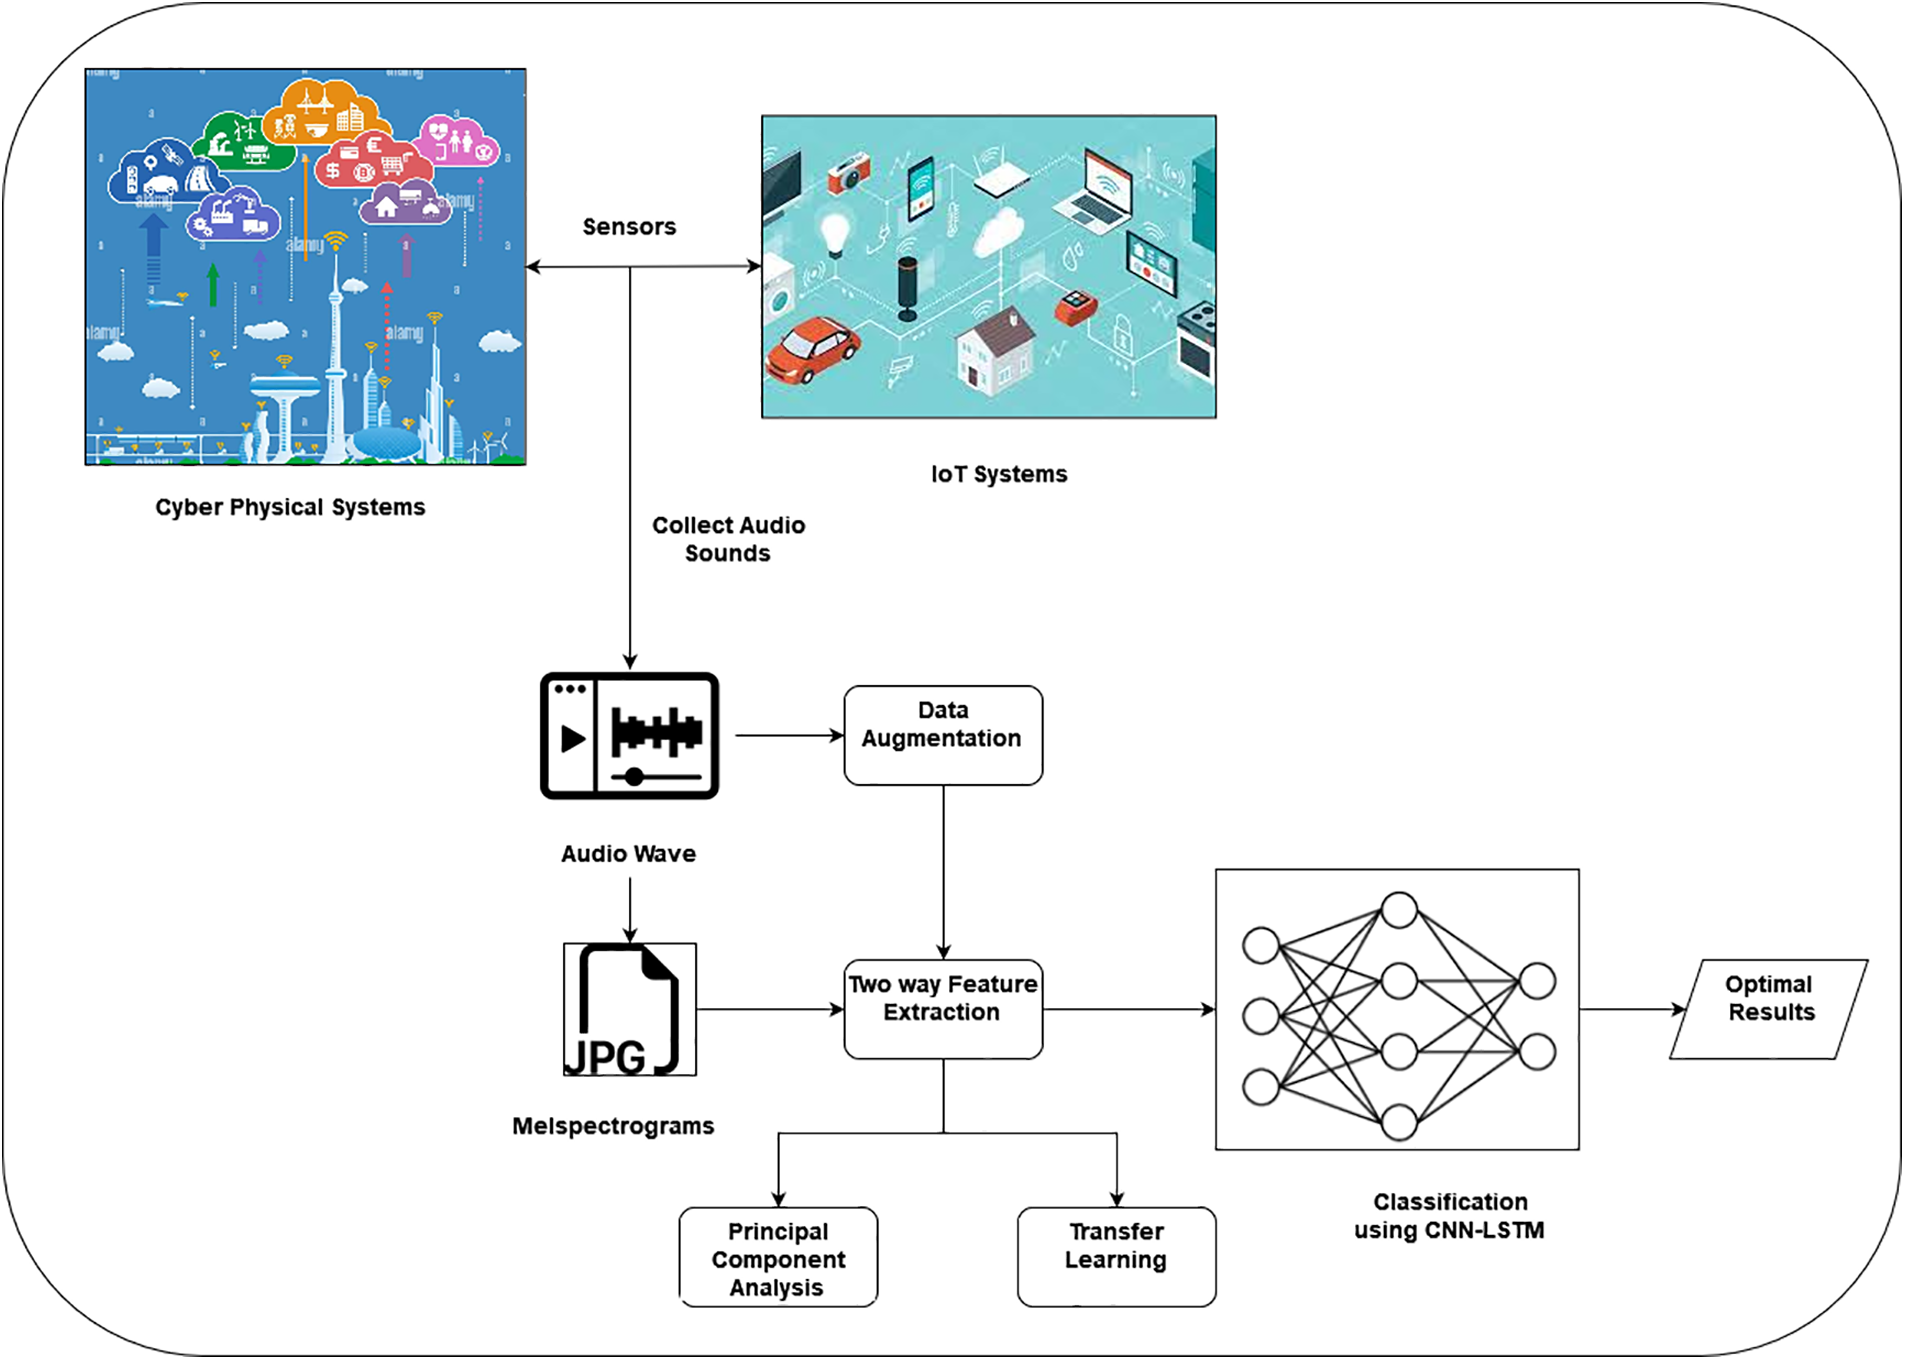
Figure 1: Proposed architecture model
The cyber system was implemented on a workstation running Windows 10 Pro and fitted with an AMD Thread ripper Pro 3955WX CPU, 32 GB of RAM, and an NVIDIA Quadro P620 GPU. TCP/IP protocol was utilized for communication between the physical and virtual systems. A Python program for CNN-LSTM is developed using a chosen dataset. The biologist, who serves as the end user, utilizes the cyber system to facilitate communication with the physical servers or their digital twins for tasks such as ordering new CNN-LSTM training and upgrades. This enables them to perform simulations and collaborative categorization effectively. Fig. 2 illustrates how a CPS design could satisfy a classification issue’s needs while reducing the limitations associated with earlier methods.
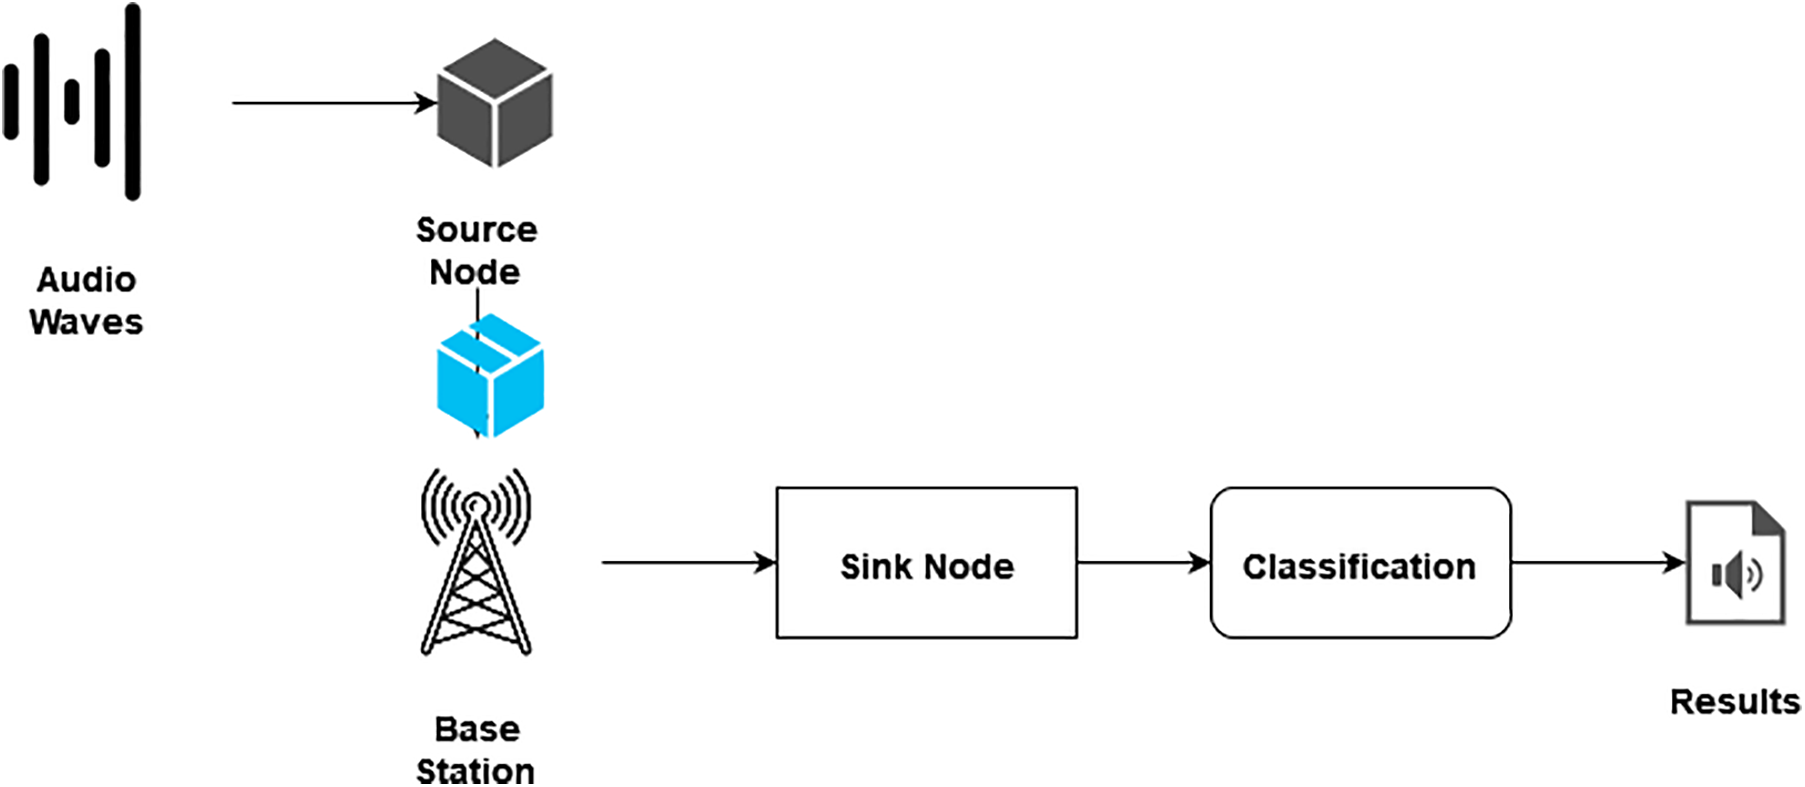
Figure 2: Cyber-physical systems
In south spain, Biological Reserve called Doana is separated by 60 kilometers on Higher Technical School of Computer Engineering, are where the CPS is being tested. The physical design is made up of 9 IoT nodes that are dispersed over DBR’s Ojillo Lake. With such a base station serving as the root, these nodes form a spanning tree. LoRa® facilitates communication between nodes. A node with two interfaces is responsible for executing the functions of the base station.
The proposed method consists of the following steps, which are discussed below. After implementing the Cyber-physical system, the data is augmented. Next, the data is extracted, the classification is processed, and the results are processed.
An augmentation procedure used the sound database to produce a more reliable training set. While using CNN-LSTM to process photos, data augmentation entails expanding the collection of original images (rotations, size modifications, etc.). The audio must be transformed for the current work on audio, and subsequently, these alterations are mirrored in the images of mel-spectrogram.
In this manner, ten extra audio samples were created for every one of the 865 audio data in the database:
• Two audio files that have two different forms of white noise applied.
• Four files consists of noticeable shift in time (1, 1.25, 1.75, and 2 s).
• Four records with changes to loudness of signal: two with 20% and 40% amplitude increases and two with 20% and 40% amplitude decrease. For this procedure, dynamic decompression was explicitly applied. It mutes loud sounds while amplifying (to a certain extent) silent ones. The goal was to produce new transmissions with the ambient noise amplified and the anuran sound muted.
These adjustments were made so the system would pick up the anurans in a loud setting and at different ranges from recorded microphones. The 865 soundtracks were changed into 9515 audios using the preceding procedures. Every component of the system is in its true place in Fig. 3.
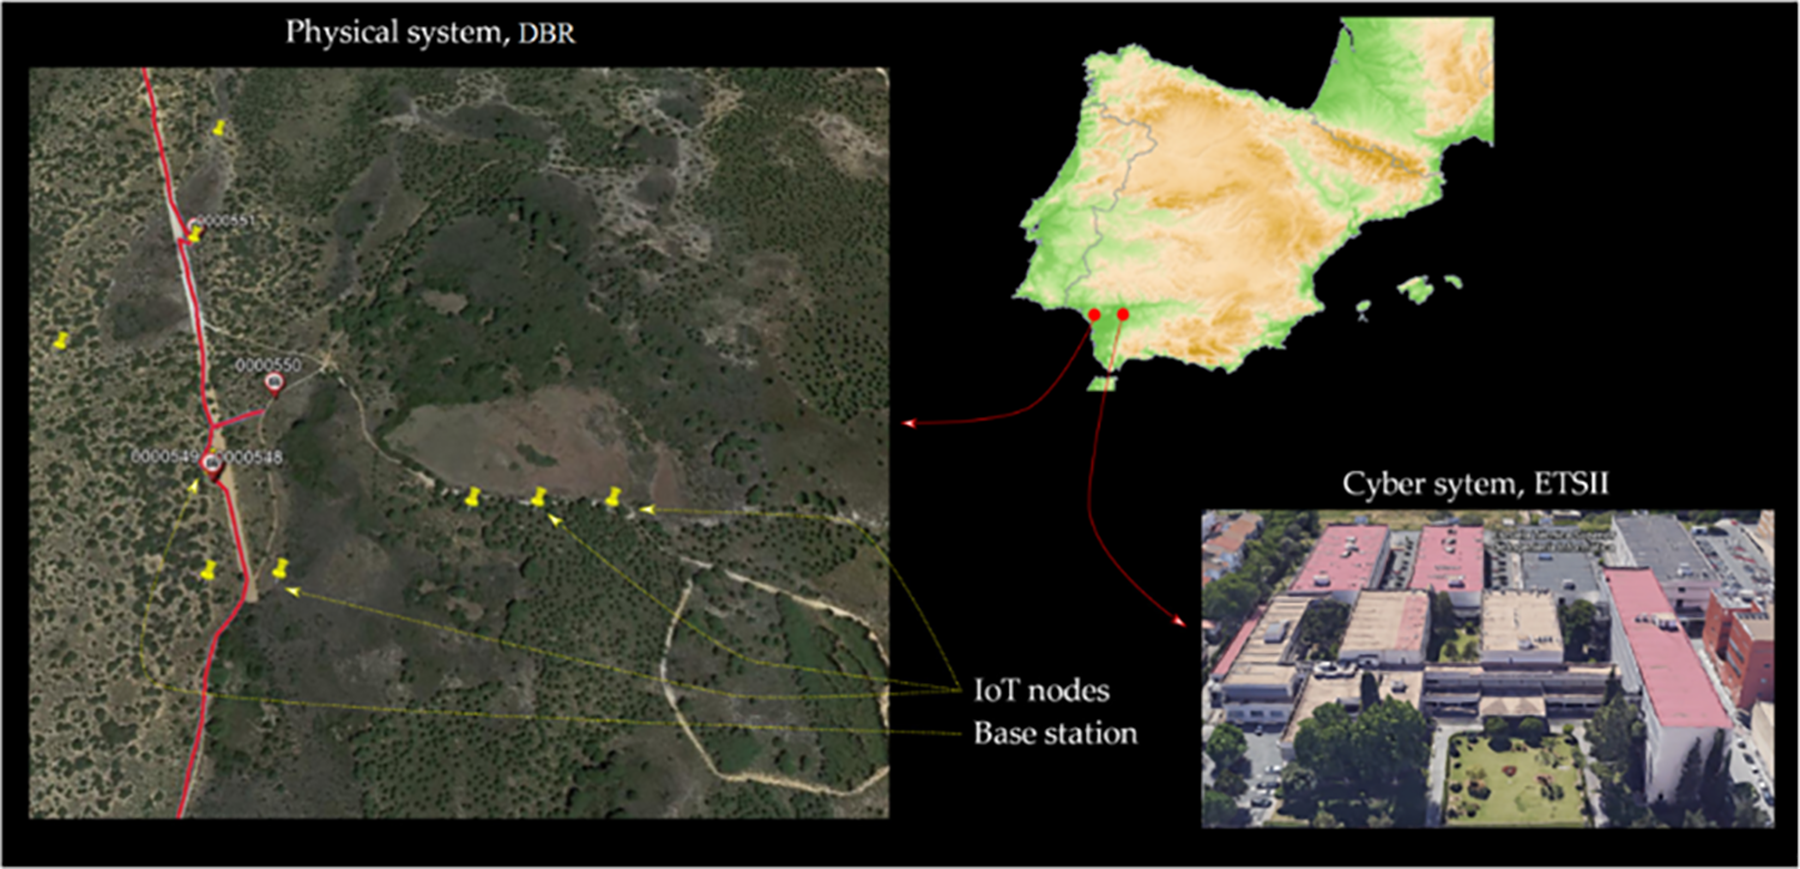
Figure 3: Topology of CPS. Cyber system developed by ETSII in Seville, Spain; physical system by DBR in Huelva, Spain [1]
3.3 Generation of Mel Spectrogram
Creating a melspectrogram for all the audio file was uniquely fitted to the system’s classifications goal. To generate the model-spectrogram, filter banks were applied to the WAV recordings. The shape of every audio sample was changed to 128 435, signifying the employment of 128 filters and 435 time-series per audio sample.
The feature extraction is processed after the completion of Data augmentation. Here, a two-way feature extraction approach is used for extracting audio features. Principal Component Analysis (PCA) and Transfer Learning methods are used for feature extraction.
3.4.1 Principal Component Analysis
A sound dataset is considered applicable by taking acceptable features from audio data. A Mel-Spectrogram has been extracted using this method. After extraction, every file’s attributes and labels were transformed into a 2-D feature vector.
The audio files have produced a total of 9515 features. More pre-processing has been done to reduce the dataset’s sparse and high dimensionality. Firstly, Sklearn for the MinMaxScaler was used to normalize the data. Dimensionality reduction has also been achieved through the utilization of Principal Component Analysis (PCA). PCA is employed because removing highly correlated variables dramatically reduces overfitting. 865 relevant characteristics have been chosen using PCA to enable efficient training and evaluation.
With this strategy, we added a feature extraction technique utilizing transfer learning. Using this method, we created a Mel-Spectrogram from the audio input dataset. Every audio file Mel-Spectrogram has been extracted. Fig. 4 feature extraction process are shown with Audio Files.
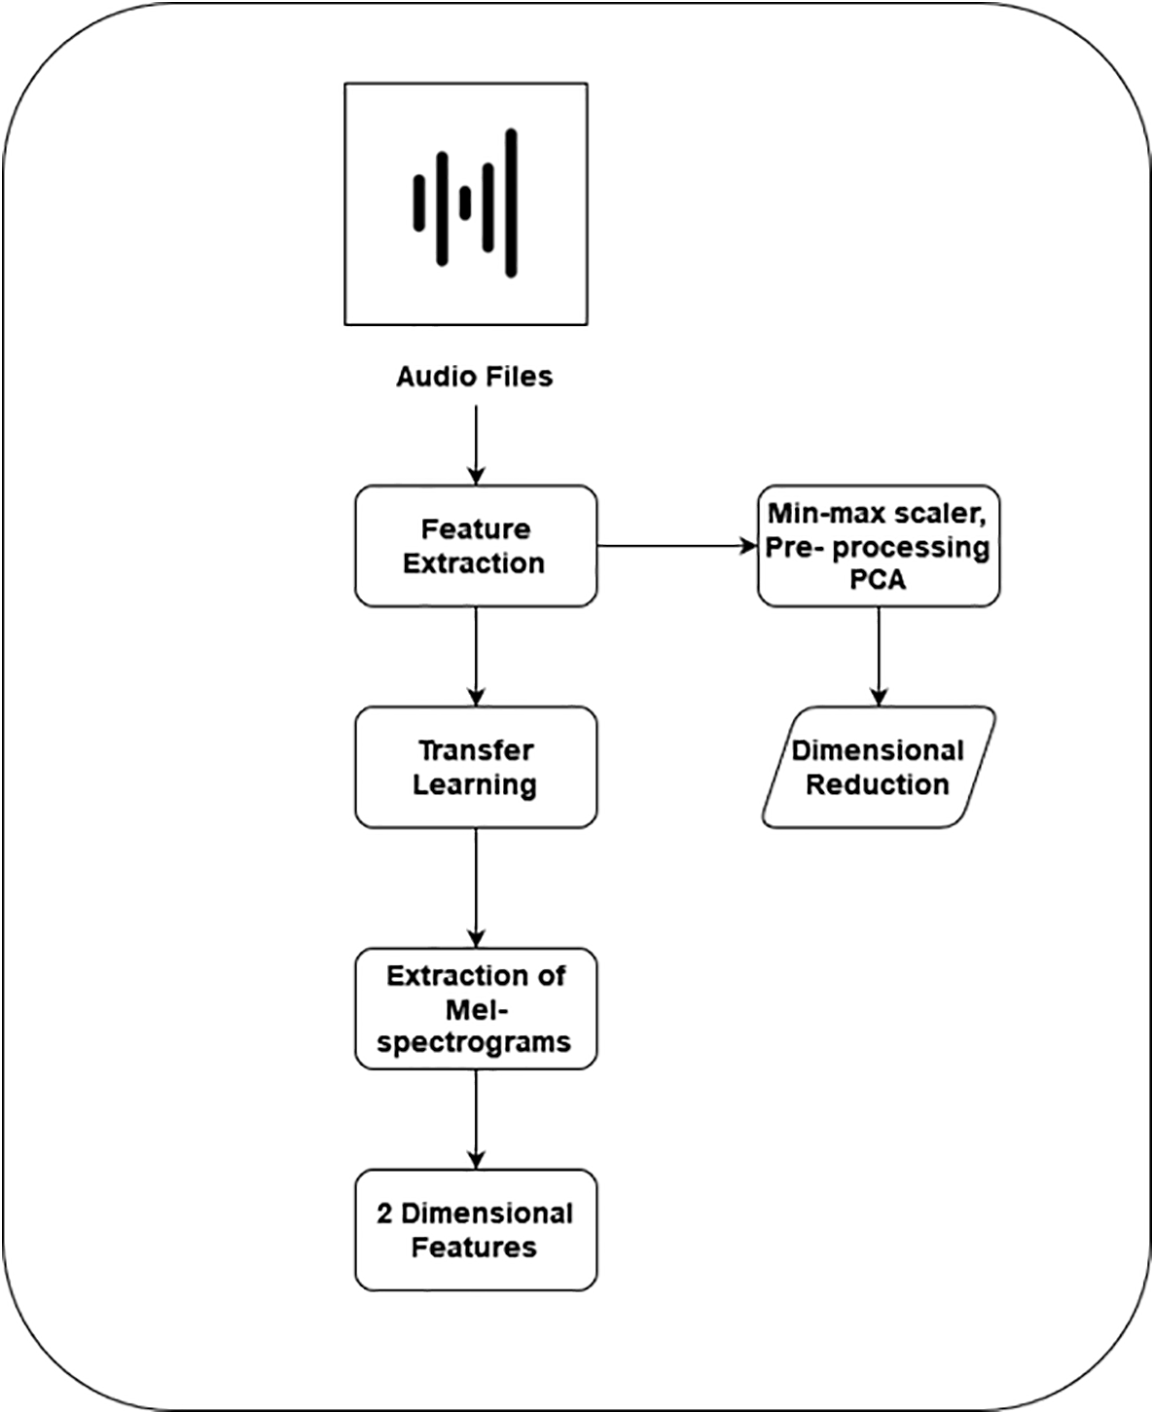
Figure 4: Feature extraction process
Transfer learning is a technique that allows models to leverage knowledge learned from one task to improve performance on another related task. In the context of the paragraph, transfer learning was employed as a feature extraction technique to produce a Mel-Spectrogram from the audio input dataset. The transfer learning process involves implementing pretrained model on large dataset as a initial point to extract useful features for a new dataset. In this case, the pre-trained data was likely a deep learning model trained on a large audio dataset such as speech or music, and the new dataset was the audio input dataset.
The use of transfer learning for feature extraction can be very effective, especially when the pre-trained model has learned much generalizable knowledge about the domain of interest. This knowledge can then be used to extract relevant features to the new dataset, even though dataset is different from the original dataset. Mel-Spectrograms are a commonly used feature representation in audio signal processing. They represent the frequency content of an audio signal as it changes over time. They are often used as input features to machine learning models for speech recognition or music classification tasks. By extracting Mel-Spectrograms from the audio input dataset using transfer learning, the model can leverage the knowledge learned from the pre-trained model to create more meaningful and practical features for the new dataset.
This process involves feeding the audio files into the pre-trained model and extracting the Mel-Spectrograms from the output of a particular layer in the model. These extracted Mel-Spectrograms can then be used as input features for the machine learning model.
3.5 Classification Using CNN-LSTM
After the extraction of Mel spectrograms, it forms into 2-dimensional features. Next, the extracted features are given in the classification process. For classification, it uses a deep learning method CNN-LSTM. The CNN-LSTM approach combined with Focal Loss Function (FL) helps the training process and measures errors during the classifications. Most precisely, utilizing STFT with a Hanning window, 1D respiratory signals are converted into 2D red, blue and green (RGB) spectrogram pictures with a dimensions of 7550 pixels and transmitted to the input nodes. Initially, the CNN portion of the system, which consists of a complete 4 convolutional number, 3 max-pooling layers, 2 batch normalization, and 3 dropout layers, is applied to the collection. As the input traverses through the deeper network layers, complicated characteristics are retrieved from the array at the exact moment, and dimensionality reduction occurs.
The 32 histograms with nine-time-steps in the x-axis that were obtained from original Mel spectrograms via the CNN section and represented by the 3D (32 6 9) array described above are then flattened into a 2D array (32 54 1) and given into the segments of LSTM network. This component, which consists of an LSTM, a flattened level, a fully connected layer, and a dropout layer, is responsible for identifying and remembering the long-term relationships in the data. For every input Mel spectrogram, At the final output layer, which employs a softmax activation function, estimations are made for each of the four classes. In a multi-classification network, softmax, a sigmoid function generalization, is typically selected as the output layer activation function. The rectified linear unit function is nonlinear used by the convolutional layers and the completely connected layer for their input signal. As illustrated in Fig. 5 this model comprises an input layer, 17 hidden layers, and one output layer that classifies the classes.
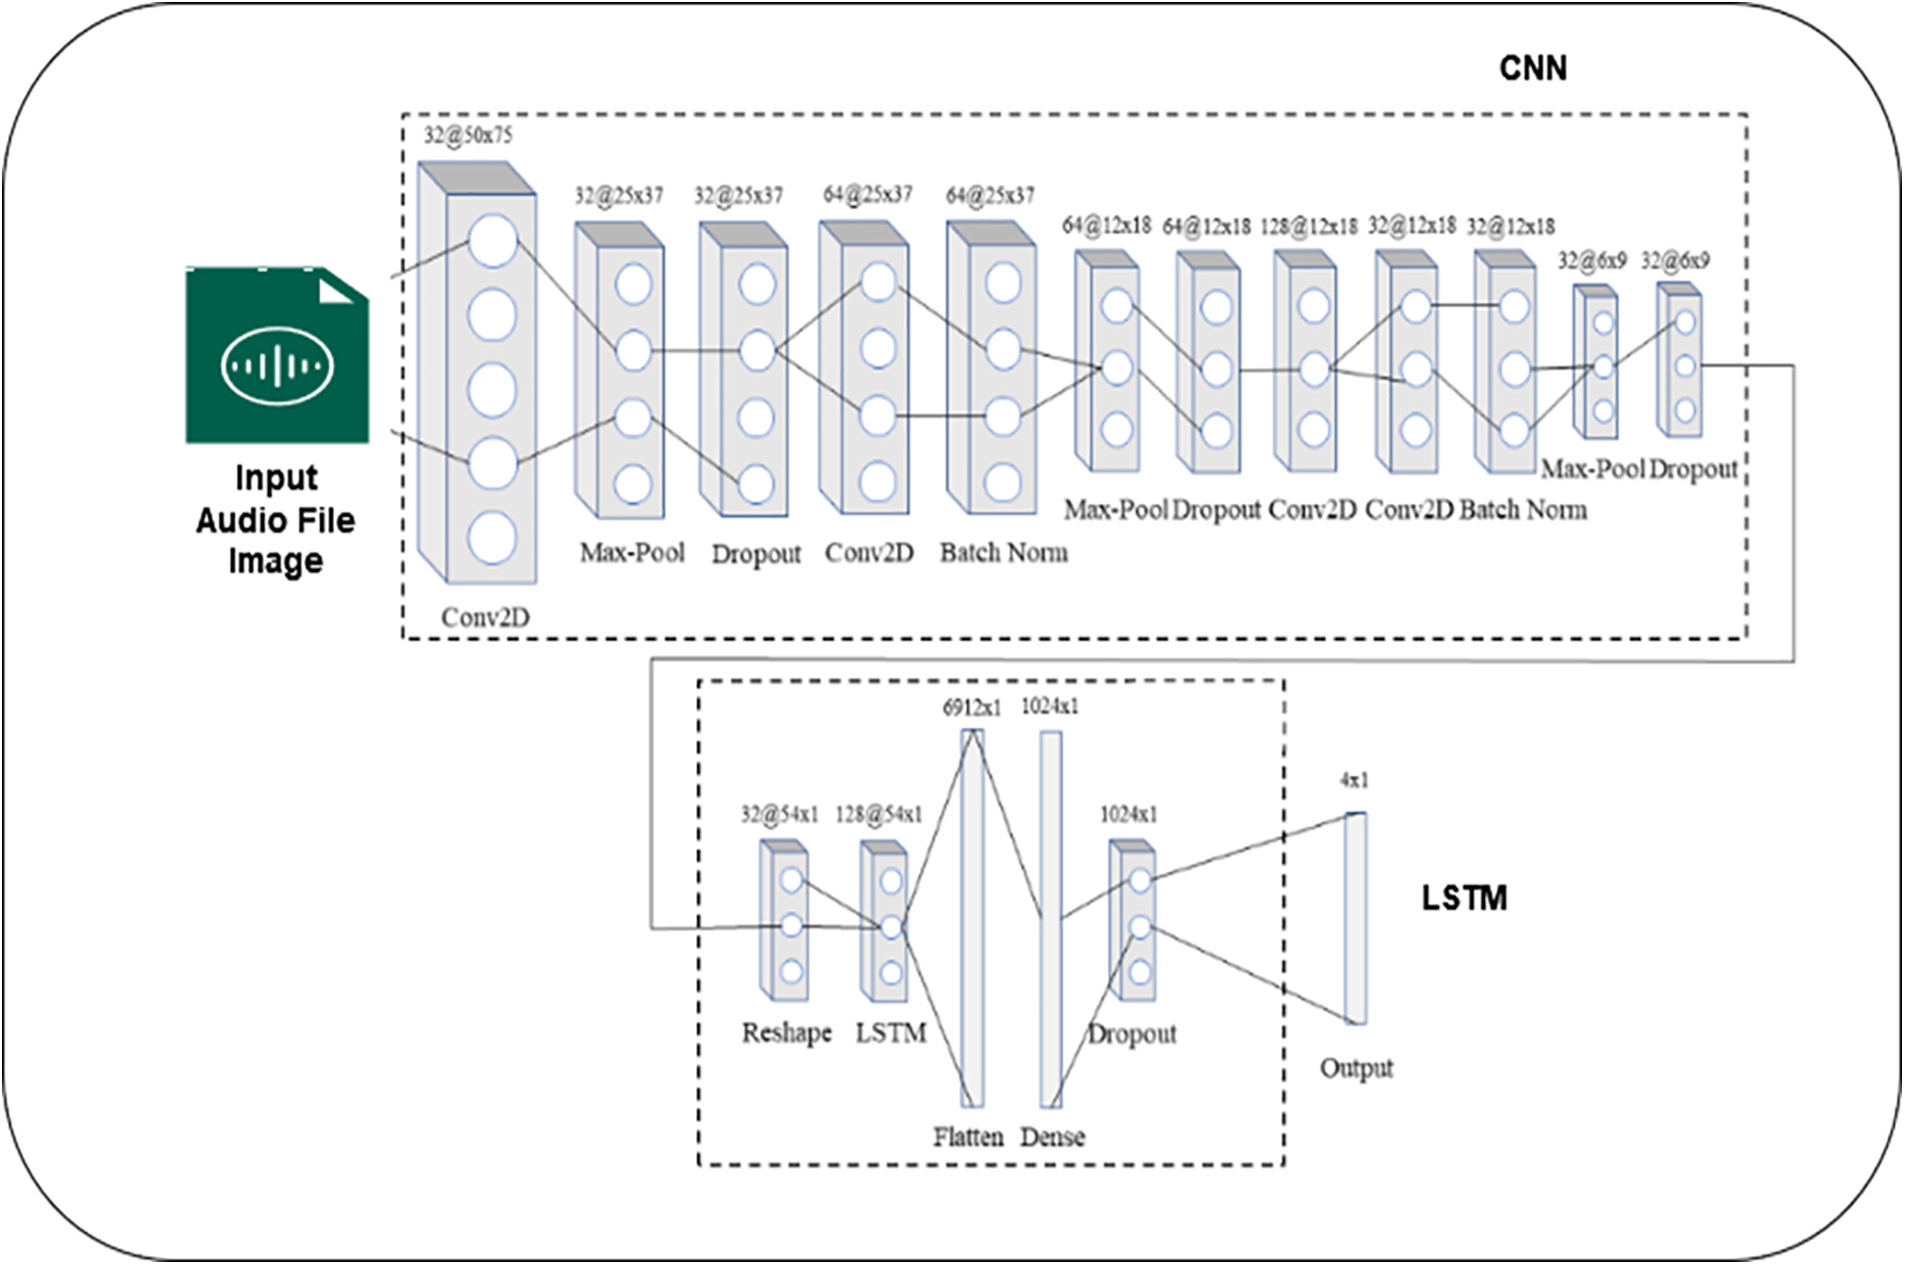
Figure 5: CNN-LSTM architecture for mel spectrograms images
For the training phase, 80% of the data were utilized as training instances and 20% as test material. This method is frequently employed to improve a machine learning model’s generalization and avoid overfitting. For the test set, a balanced sample was performed. One good example (together with related to samples of data augmentation) was chosen out of five for each form of anuran call. As a result, 1892 data were utilized for testing, whereas 7623 data were used for training.
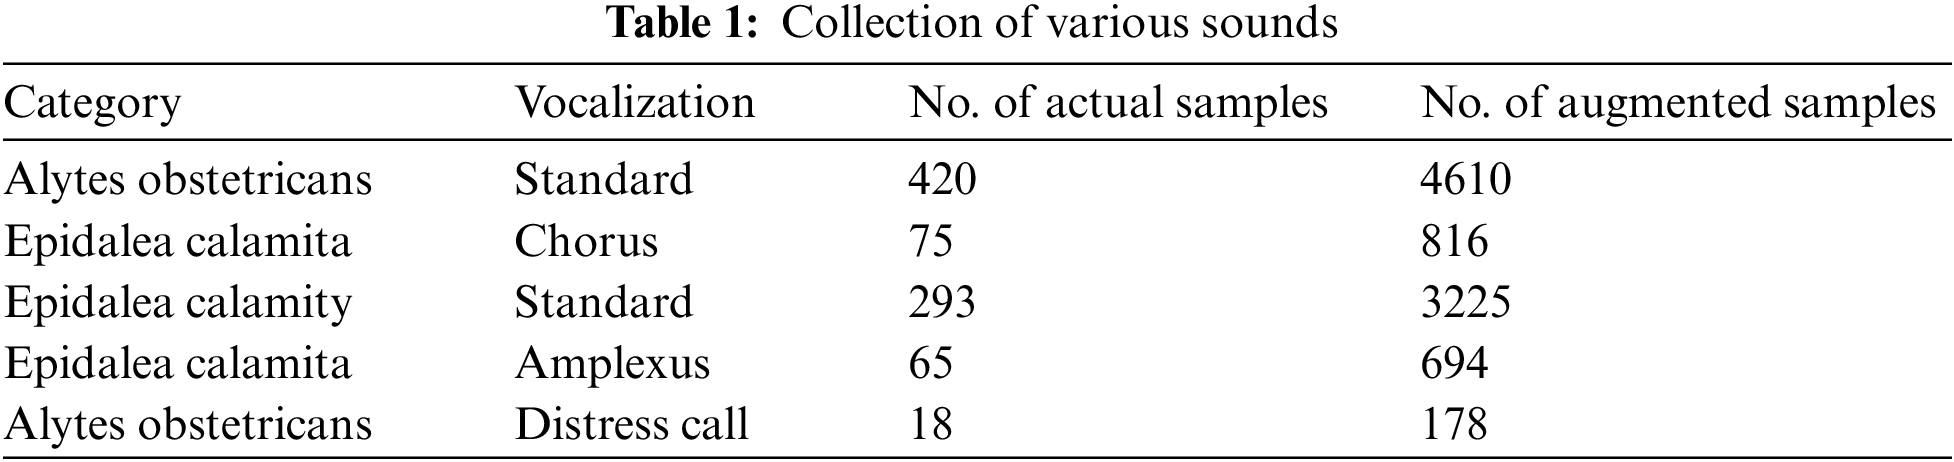
A CNN-LSTM was trained initially for classifying model in 4 sound categories created in prior work [1], as described previously in the data preprocessing part. Afterward, a secondary CNN-LSTM was developed to add the other five classes in Table 1 to the classification method.
Remarkable results were achieved in the initial system through training for only eight epochs, which represents the number of iterations over the entire training dataset. Additionally, a batch size of 32, indicating the sample sizes used in each training iteration, was found to be effective. Six epochs and a batch size of 32 once more made the best training results for the second network. The “adam” optimizer [29] and the initial learning speed [30] with 0.001 have been the variables utilized in the training procedure with both networks.
The first column lists the sound categories named after the species that produce them (Epidalea calamity and Alytes obstetricans). The second column indicates the type of vocalization within each category, such as common vocalization or distress call. The third column shows the actual number of audio samples collected for each vocalization type. Finally, the fourth column lists the augmented models generated for each vocalization type.
The CNN-LSTM architecture uses this data to train a model that can accurately classify different vocalization types into their respective categories. Specifically, the model first processes the raw audio data using a CNN to extract relevant feature. The extracted features are subsequently inputted into a long short-term memory (LSTM) network, which leverages the temporal information to make predictions regarding the vocalization type. Using a combination of actual and augmented samples, the CNN-LSTM architecture can learn from a more extensive and diverse set of data, improving its accuracy and robustness when applied to real-world scenarios.
When examining the CPS, several aspects were taken into account. Initially, two paradigms were contrasted at the stage of data transport interaction. The central concept is built on delivering an audio recording from node IoT to its electronic counterpart on the cyber system side, which is analyzed. The distributed model analyzes the audio file in the Internet of Things node and delivers the outcome to its digital twin, which then sends it to the central processing unit. The output file (WAV) is 434 kB when a audio register for 5-second is captured at a sampling frequency of 44.1 kHz and 32 bits per sample with a mono setup.
Because of this, it considers like there is one radio link (1 kbps) only and that it will take at least 57.8 s to transfer an physical process on audio file to the cyber system. Compared to data transmission through a radio link in this method, the time required for fiber optic data communication was insignificant. Sending the data takes 5 s of audio and more than ten times as long. As a result, actual broadcasting was impossible. There is a requirement for distributed processing.
Employing the same related to the existing WAV file, it took 120 ms to compute the model-spectrogram and 160 ms to execute CNN-LSTM using the TensorFlow Lite package. Last, the CNN-LSTM analysis of a 5-second audio recording suggests that the duration for transmitting the findings (70 B) is 0.55 s. Therefore, the entire time required in the dispersed paradigm is about 300 ms. In summation, real-time audio analysis is a possibility. The fundamental drawback of this strategy is that radio links are required to send the network’s topology, weight, and structure whenever a CNN-LSTM modification is needed. Using TensorFlow Lite, a typical neural network size is around 5 MB.
Secondly, while running the CNN-LSTM, the temperature of the SoC at the IoT was measured at the boundary condition layer. Fig. 6 depicts a thermal image illustrating the SoC’s temperature (48.8°C). This demonstrates that the chosen platform is appropriate for this type of analysis.

Figure 6: Temperatures at the CNN-LSTM running IoT node’s SoC
The SoC is a complete computing system on a single chip, including a processor, memory, and other components. The IoT refers to a network of connected devices that are capable of exchanging data with each other and with other systems over the Internet. In this context, the IoT is likely acting as a sensor network, collecting data processed by the SoC.
To measure the temperature of the SoC, the authors likely used a thermal imaging camera or some other type of temperature sensor. The resulting thermal image, shown in Fig. 6, illustrates the temperature of the SoC at the boundary condition layer. The temperature of the SoC is measured to be 48.8°C.
This temperature measurement is essential because it demonstrates that the chosen platform is appropriate for this type of analysis. Running a CNN-LSTM involves significant computation, which can generate heat and damage the hardware if not correctly managed. By measuring the temperature of the SoC and confirming that it is within a safe range, the authors can ensure that their analysis will not cause any harm to the hardware and that the results are reliable.
Thirdly, the CNN-LSTM operation was examined using a precision multimeter at the degree of power usage. The energy the IoT platform needs when CNN-LSTM starts running is seen in Fig. 7. The solar panel installed at the node’s remote position has been sized to accommodate the IoT’s power requirements. Finally, the CNN-LSTM program uses 16.2% of the CPU’s capability and 8.5% of the Memory at the resources level. These findings enable us to conclude that the computational power widely accessible is sufficient to support this kind of program.
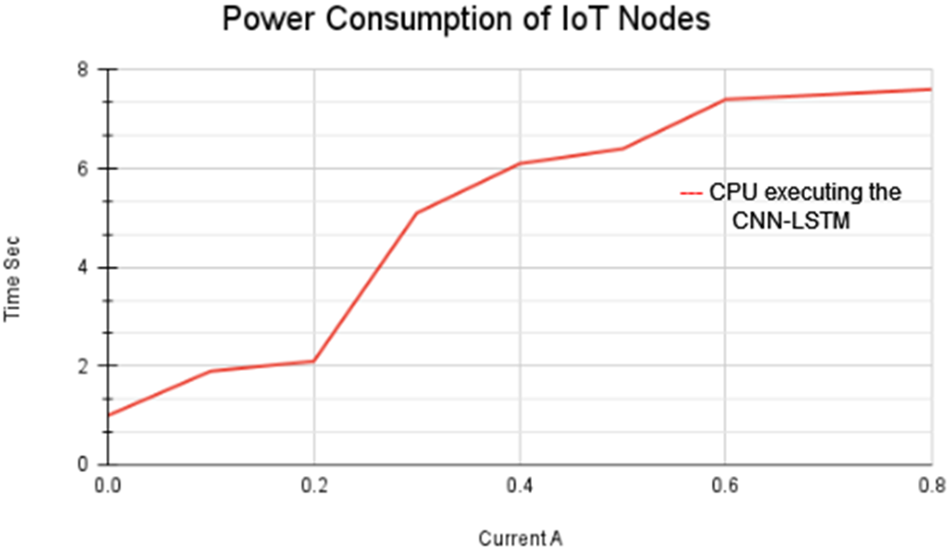
Figure 7: The amount of power used by the IoT running CNN-LSTM
Confusion Matrix and Accuracy of CNN-LSTM Methods
For the initial system, which divided the audio into four categories, the total accuracy values are 97.34% for training examples and 98.53% for testing data.
Apart from the Epidalea calamity category with amplexus vocalization, with 9.05% errors (13 errors vs. 143 audios), all classes have error rates of between 1.01% and 4.78%. Contrarily, there was only one distress call error in the Alytes obstetricans class. As an outcome, the network categorization findings can be regarded as both positive and reliable. The efficiency findings for these networks are marginally less accurate than those for the previous network. However, they are still sufficient to demonstrate that the CNN-LSTM can distinguish between the standard and amplexus vocalization for Epidalea calamita. Table 2 provides more information on the confusion matrix for the testing data in this network.
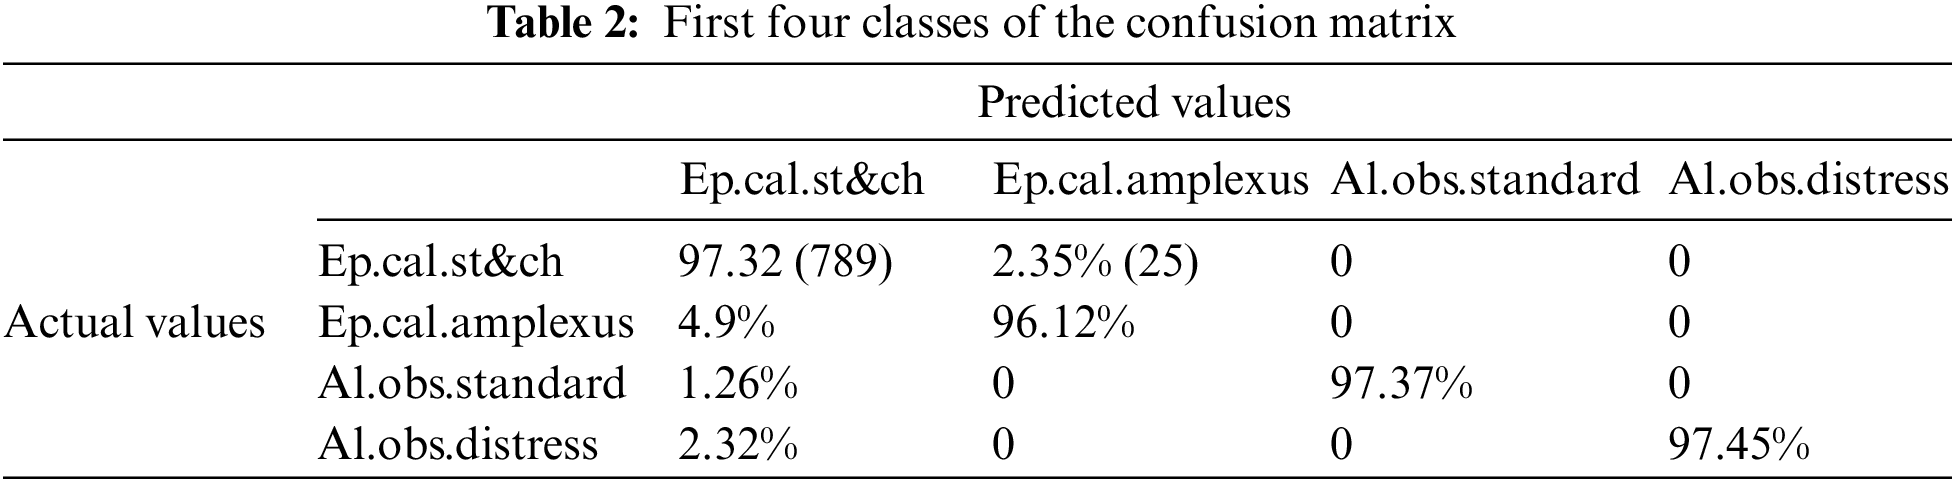
Fig. 8 shows the confusion matrix of the First four classes.

Figure 8: Confusion matrix for four classes
The distribution of mistakes across the five classes is shown in Table 3.
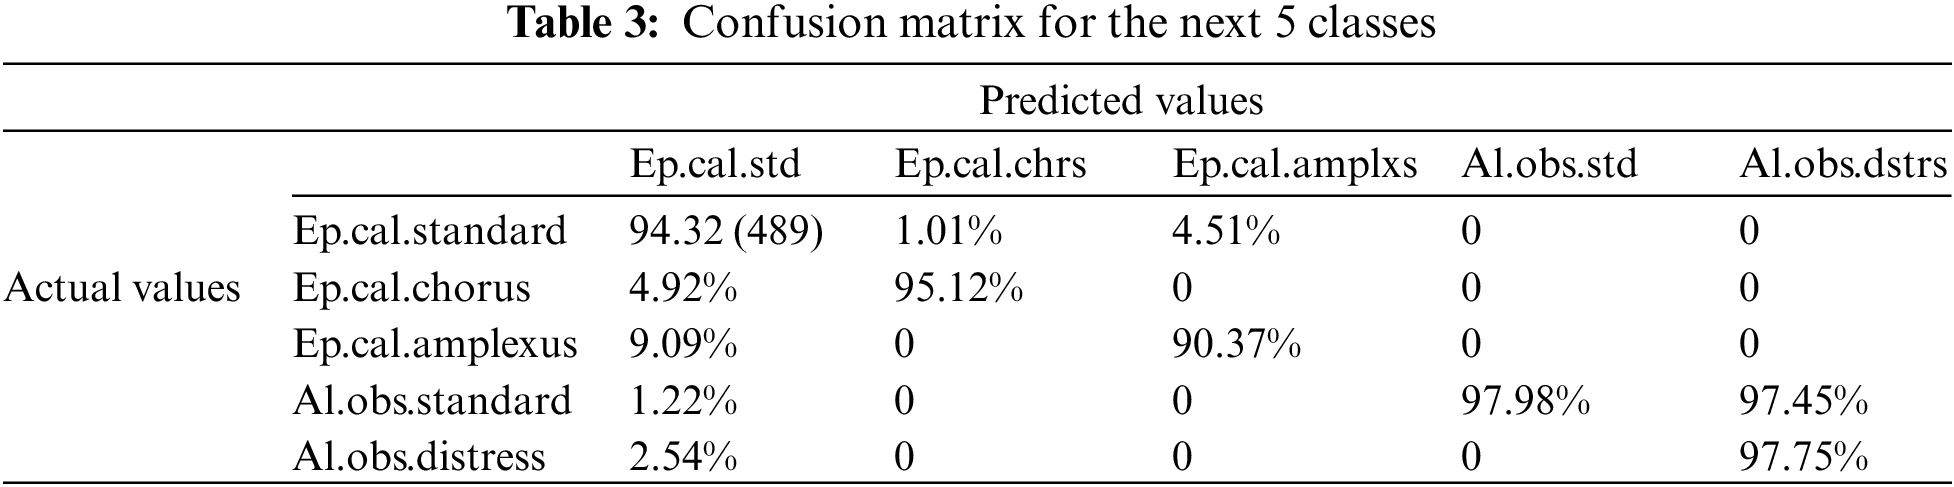
Fig. 9 shows the confusion matrix of 5 classes.

Figure 9: Confusion matrix for five classes
The proposed CNN-LSTM achieves greater precision in both the testing and Training dataset. The first two bar represents the training accuracy of CNN and CNN-LSTM. The following two bar represents the testing accuracy of bar charts. In both, CNN-LSTM achieves more precision when compared to CNN. Fig. 10 shows the training and testing accuracy, and the dataset is compared with existing CNN methods.
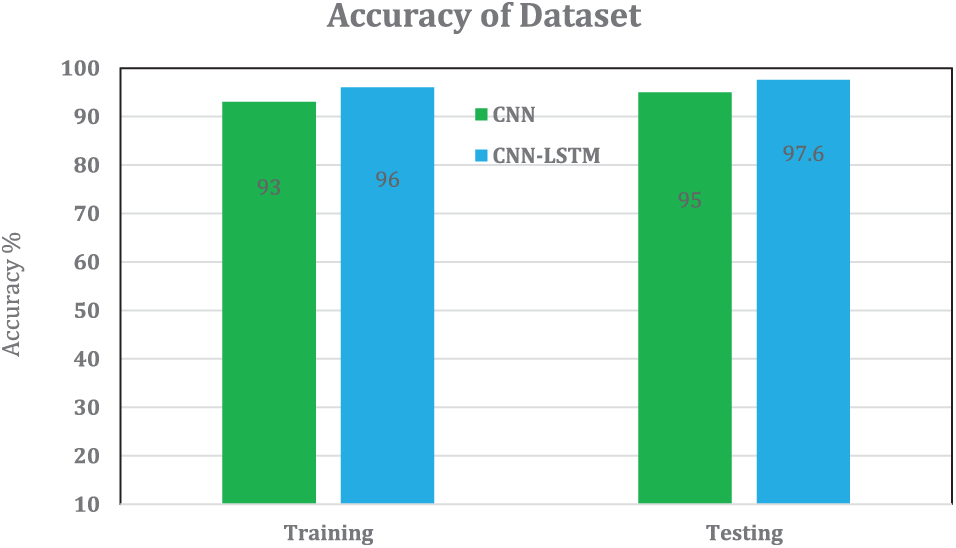
Figure 10: Accuracy of training and testing dataset
The proposed audio wave processing is processed using Deep Learning methods, and it implements the Cyber-Physical System (CPS), which also has physical IoT systems. Personal assistance is not required in the categorization system in the current work, thanks to the use of deep learning capabilities, which is a considerable advancement. Earlier compositions could not distinguish the chorus and common vocalization for Epidalea calamity. It is feasible to obtain excellent outcomes (97.34%) while creating this additional class using the classification technique utilizing the second CNN-LSTM. This entails a higher level of information in proper categorization and suggests a significant advancement over the earlier study mentioned above. This anuran sound classification system shows the viability of a CNN-LSTM-based design for categorizing biological acoustic targets. In this manner, the first goal of those suggested in the study was accomplished. Based on the results presented here, the researchers concluded that CPS architecture is a unique, adaptable, and potent Predator Avoidance Model (PAM) system. Therefore, CNN-LSTM in IoT nodes might be employed as a fusion technique at the classification stage to reduce the amount of data sent and increase the amount of data disseminated.
Acknowledgement: This research work was funded by Institutional Fund Projects under Grant No. IFPIP: 236-611-1442. Therefore, the author gratefully acknowledges the technical and financial support from the Ministry of Education and King Abdulaziz University, Jeddah, Saudi Arabia.
Funding Statement: Funded by Institutional Fund Projects under Grant No. IFPIP: 236-611-1442 by Ministry of Education and King Abdulaziz University, Jeddah, Saudi Arabia (A.O.A.).
Conflicts of Interest: The authors declare that they have no conflicts of interest to report regarding the present study.
References
1. Í. Monedero, J. Barbancho, R. Márquez and J. F. Beltrán, “Cyber-physical system for environmental monitoring based on deep learning,” Sensors, vol. 21, no. 11, pp. 3655, 2021. [Google Scholar] [PubMed]
2. G. Petmezas, G. A. Cheimariotis, L. Stefanopoulos, B. Rocha, R. P. Paiva et al., “Automated lung sound classification using a hybrid CNN-LSTM network and focal loss function,” Sensors, vol. 22, no. 3, pp. 1232, 2022. [Google Scholar] [PubMed]
3. A. Khan, A. Sohail, U. Zahoora and A. S. Qureshi, “A survey of the recent architectures of deep convolutional neural networks,” Artificial Intelligence Review, vol. 53, no. 8, pp. 5455–5516, 2020. [Google Scholar]
4. A. Dhillon and G. K. Verma, “Convolutional neural network: A review of models, methodologies, and applications to object detection,” Progress in Artificial Intelligence, vol. 9, no. 2, pp. 85–112, 2019. [Google Scholar]
5. L. Nanni, A. Rigo, A. Lumini and S. Brahnam, “Spectrogram classification using dissimilarity space,” Applied Sciences, vol. 10, no. 12, pp. 4176, 2020. [Google Scholar]
6. N. Bento, D. Belo and H. Gamboa, “ECG biometrics using spectrograms and deep neural networks,” International Journal of Machine Learning and Computing, vol. 10, no. 2, pp. 259–264, 2020. [Google Scholar]
7. Z. Mushtaq and S. F. Su, “Environmental sound classification using a regularized deep convolutional neural network with data augmentation,” Applied Acoustics, vol. 167, no. 4, pp. 107389, 2020. [Google Scholar]
8. J. Xie, K. Hu, M. Zhu, J. Yu and Q. Zhu, “Investigation of different CNN-based models for improved bird sound classification,” IEEE Access, vol. 7, pp. 175353–175361, 2019. [Google Scholar]
9. M. Lech, M. Stolar, C. Best and R. Bolia, “Real-time speech emotion recognition using a pre-trained image classification network: Effects of bandwidth reduction and companding,” Frontiers in Computer Science, vol. 2, pp. 14, 2020. [Google Scholar]
10. R. A. Khalil, E. Jones, M. I. Babar, T. Jan, M. H. Zafar et al., “Speech emotion recognition using deep learning techniques: A review,” IEEE Access, vol. 7, pp. 117327–117345, 2019. [Google Scholar]
11. J. Joy, A. Kannan, S. Ram and S. Rama, “Speech emotion recognition using neural network and MLP classifier,” International Journal of Engineering Science and Computing, vol. 2020, pp. 25170–25172, 2020. [Google Scholar]
12. N. Damodar, H. Vani and M. Anusuya, “Voice emotion recognition using CNN and decision tree,” International Journal of Innovative Technology and Exploring Engineering, vol. 8, no. 12, pp. 4245–4249, 2019. [Google Scholar]
13. Y. Eom and J. Bang, “Speech emotion recognition using 2D-CNN with mel-frequency cepstrum coefficients,” Journal of Information and Communication Convergence Engineering, vol. 19, pp. 148–154, 2021. [Google Scholar]
14. A. Rezaeipanah and M. Mojarad, “Modeling the scheduling problem in cellular manufacturing systems using genetic algorithm as an efficient meta-heuristic approach,” Journal of Artificial Intelligence and Technology, vol. 1, pp. 228–234, 2021. [Google Scholar]
15. R. Krishnamoorthi, S. Joshi, H. Z. Almarzouki, P. K. Shukla, A. Rizwan et al., “A novel diabetes healthcare disease prediction framework using machine learning techniques,” Journal of Healthcare Engineering, vol. 2022, no. 3, pp. 1684017, 2022. [Google Scholar] [PubMed]
16. M. Dubey, V. Kumar, M. Kaur and T. P. Dao, “A systematic review on harmony search algorithm: Theory, literature, and applications,” Mathematical Problems in Engineering, vol. 2021, no. 2, pp. 5594267, 2021. [Google Scholar]
17. P. K. Shukla, M. Zakariah, W. A. Hatamleh, H. Tarazi and B. Tiwari, “AI-driven novel approach for liver cancer screening and prediction using cascaded fully convolutional neural network,” Journal of Healthcare Engineering, vol. 2022, no. 4, pp. 4277436, 2022. [Google Scholar] [PubMed]
18. P. K. Shukla, P. K. Shukla, P. Sharma, P. Rawat, J. Samar et al., “Efficient prediction of drug-drug interaction using deep learning models,” IET Systems Biology, vol. 14, no. 4, pp. 211–216, 2020. [Google Scholar]
19. J. Liu, Z. Liu, C. Sun and J. Zhuang, “A data transmission approach based on ant colony optimization and threshold proxy re-encryption in WSNs,” Journal of Artificial Intelligence and Technology, vol. 2, pp. 23–31, 2022. [Google Scholar]
20. G. De Luca, “A survey of NISQ era hybrid quantum-classical machine learning research,” Journal of Artificial Intelligence and Technology, vol. 2, pp. 9–15, 2022. [Google Scholar]
21. S. Sultana, M. Z. Iqbal, M. R. Selim, M. M. Rashid and M. S. Rahman, “Bangla speech emotion recognition and cross-lingual study using deep CNN and BLSTM networks,” IEEE Access, vol. 10, pp. 564–578, 2021. [Google Scholar]
22. K. H. Lee, H. K. Choi and B. T. Jang, “A study on speech emotion recognition using a deep neural network,” in Proc. of the 2019 Int. Conf. on Information and Communication Technology Convergence (ICTC), Jeju, Korea, pp. 1162–1165, 2019. [Google Scholar]
23. R. Liu, S. Cai, K. Zhang and N. Hu, “Detection of adventitious respiratory sounds based on convolutional neural network,” in Proc. of the Int. Conf. on Intelligent Informatics and Biomedical Sciences (ICIIBMS), Shanghai, China, pp. 13–18, 2019. [Google Scholar]
24. K. Minami, H. Lu, H. Kim, S. Mabu, Y. Hirano et al., “Automatic classification of large-scale respiratory sound dataset based on convolutional neural network,” in Proc. of the 2019 19th Int. Conf. on Control, Automation and Systems (ICCAS), Jeju, Korea, pp. 100–106, 2019. [Google Scholar]
25. F. Demir, A. Sengur and V. Bajaj, “Convolutional neural networks based efficient approach for classification of lung diseases,” Health Information Science and Systems, vol. 8, pp. 1–8, 2019. [Google Scholar]
26. J. Acharya and A. Basu, “Deep neural network for respiratory sound classification in wearable devices enabled by patient-specific model tuning,” IEEE Transactions on Biomedical Circuits and Systems, vol. 14, pp. 535–544, 2020. [Google Scholar] [PubMed]
27. F. Demir, A. M. Ismael and A. Sengur, “Classification of lung sounds with CNN model using parallel pooling structure,” IEEE Access, vol. 8, pp. 105376–105383, 2020. [Google Scholar]
28. R. H. Byrd, G. M. Chin, J. Nocedal and Y. Wu, “Sample size selection in optimization methods for machine learning,” Mathematical Programming, vol. 134, no. 1, pp. 127–155, 2012. [Google Scholar]
29. J. Patterson and A. Gibson, “Understanding learning rates,” in Deep Learning: A Practitioner’s Approach, 1st ed., Sebastopol, CA, USA: Mike Loukides, Tim McGovern, O’Reilly, pp. 415–530, 2017. [Google Scholar]
30. H. Zhong, Z. Chen, C. Qin, Z. Huang, V. W. Zheng et al., “Adam revisited: A weighted past gradients perspective,” Frontiers in Computer Science, vol. 14, pp. 1–16, 2020. [Google Scholar]
Cite This Article
 Copyright © 2023 The Author(s). Published by Tech Science Press.
This work is licensed under a Creative Commons Attribution 4.0 International License , which permits unrestricted use, distribution, and reproduction in any medium, provided the original work is properly cited.
 Downloads
 Citation Tools