
 Submit a Paper
 Propose a Special lssue
 Open Access
ARTICLE

Deep Learning Models Based on Weakly Supervised Learning and Clustering Visualization for Disease Diagnosis
1 School of Computer and Information Engineering, Chuzhou University, Chuzhou, 239000, China
2 School of Computer Science and Technology, Changchun University of Science and Technology, Changchun,
130022, China
3 Zhongshan Institute of Changchun University of Science and Technology, Zhongshan, China
4 School of Intelligent Engineering, Henan Institute of Technology, Xinxiang, 453003, China
* Corresponding Author: Zhengang Jiang. Email:
Computers, Materials & Continua 2023, 76(3), 2649-2665. https://doi.org/10.32604/cmc.2023.038891
Received 02 January 2023; Accepted 17 May 2023; Issue published 08 October 2023
 View Full Text
 Download PDF
Abstract
The coronavirus disease 2019 (COVID-19) has severely disrupted both human life and the health care system. Timely diagnosis and treatment have become increasingly important; however, the distribution and size of lesions vary widely among individuals, making it challenging to accurately diagnose the disease. This study proposed a deep-learning disease diagnosis model based on weakly supervised learning and clustering visualization (W_CVNet) that fused classification with segmentation. First, the data were preprocessed. An optimizable weakly supervised segmentation preprocessing method (O-WSSPM) was used to remove redundant data and solve the category imbalance problem. Second, a deep-learning fusion method was used for feature extraction and classification recognition. A dual asymmetric complementary bilinear feature extraction method (D-CBM) was used to fully extract complementary features, which solved the problem of insufficient feature extraction by a single deep learning network. Third, an unsupervised learning method based on Fuzzy C-Means (FCM) clustering was used to segment and visualize COVID-19 lesions enabling physicians to accurately assess lesion distribution and disease severity. In this study, 5-fold crossvalidation methods were used, and the results showed that the network had an average classification accuracy of 85.8%, outperforming six recent advanced classification models. W_CVNet can effectively help physicians with automated aid in diagnosis to determine if the disease is present and, in the case of COVID-19 patients, to further predict the area of the lesion.Keywords
The coronavirus disease 2019 (COVID-19) has been spreading globally for more than 2 years now, and no specific cure is available. Its main symptoms are fever, generalized aches and pains, malaise, and cough, which can have serious health consequences, especially among older adults. The strategy to deal with COVID-19 is timely detection and treatment, good protection, and blocking of the transmission route. Therefore, its urgent and effective diagnosis is of great significance.
The World Health Organization recommended confirmation of COVID-19 diagnosis using reverse transcription-polymerase chain reaction (RT-PCR) [1]. The diagnostic kits are limited in the face of sudden outbreaks involving large numbers of patients. Therefore, a rapid and effective artificial intelligence (AI)-based complementary diagnostic method must be urgently developed. Also, the lesion must be segmented and displayed to determine its area and severity, helping physicians comprehend the condition. The present study investigated both classification and segmentation perspectives simultaneously. Chest computed tomography (CT) and chest X-ray (CXR) are the two most commonly used imaging modalities to diagnose and screen for chest-related diseases. They are less complex, highly usable, and faster in detecting positive cases. Although CXR images are inexpensive and easy to acquire, the hairy glass-like cloudiness in the lesion area may not be thick enough to show up clearly. In terms of using AI algorithms, the most significant difference between CT and CXR images is the form of the input. CT images contain a series of slices and, therefore, have multiple input channels. They provide more detailed information with higher sensitivity and specificity compared with CXR images. Therefore, we used CT images in this study.
Image-level and pixel-level labeling of the data is required for classification and segmentation studies, respectively. However, often only one category of segmented data is available, which cannot be classified. Also, the classification data are not marked at the pixel level and cannot be segmented. Therefore, data with both image- and pixel-level tags are rarely obtained. Currently, most studies on COVID-19 focus on either classification or segmentation, with very few addressing both aspects. Employing image-level labeled data for classification, while using unsupervised learning to locate focal areas, is a significant and challenging task. It can help doctors accurately judge the size and area of the lesion while assisting in diagnosis.
Deep learning networks have recently advanced in terms of semantic segmentation [2], target recognition [3], and image classification [4–6] in computer-aided diagnosis tasks. During the COVID-19 pandemic crisis, researchers focused on analyzing COVID-19 diagnostic methods using CNNs. Many studies have demonstrated that using deep learning algorithms can enhance image detection features and improve the awareness, specificity, and efficiency of diagnosis [7]. The deep learning technique is a practical, valuable, and appropriate method considered reliable for COVID-19 diagnosis [8]. Identifying lesions using medical images can reduce the workload of clinicians, provide reliable quantitative assessment, and speed up diagnostic processes.
Deep learning has been the fastest-growing field of AI in recent years. It also plays an essential role in COVID-19 diagnosis; most researchers use it for intelligent diagnosis. Ullah et al. [9] used CT scan, CXR, and electrocardiogram trace images for three data types and proposed a Shufflenet CNN-based method for COVID-19 identification. Extensive experiments were conducted using binary and multiclass classifications. The results on different data types revealed that the accuracy rate was more than 99%, which was a good outcome. Xu et al. [10] used various CNN models and conducted many experiments by combining two and three-dimensional CNNs to propose a relevant model. The results of the multiclass classification of CT images showed a sensitivity of 98.2% and a specificity of 92.2%. Shah et al. [11] used ResNet50, VGG19, DenseNet169, InceptionV3, and VGG16. Various deep learning networks were trained separately, and the experiments proved that the VGG19 model achieved 94% accuracy for COVID-19 binary classification, which was the best outcome. Jagan Mohan et al. [12] improved the local, intermediate, and global features to improve the feature extraction capability. They proposed the global, intermediate, and local features convolutional neural network (GIL-CNN), which used a support vector machine as a classifier. Gour et al. [13] collected some CT images, integrated three X-ray image data to obtain a new dataset, and conducted experiments based on these two datasets. Two convolutional networks, Xception and VGG19, were stacked to improve feature discrimination, and the sensitivity of binary classification was 98.31% for CT images and 97.62% for triple classification on the X-ray dataset.
The aforementioned studies on COVID-19 usually faced two challenges: (1) the presence of a large amount of redundant information in images with poor generalization ability and (2) the uneven distribution and size of lesions and the simplicity of features extracted using a single network. Therefore, this study focused on removing the background, retaining the main regions of features, and fully using various deep learning networks to extract rich features. As the classification dataset in this study was not labeled with lung regions, we used a weakly supervised learning approach for segmentation preprocessing.
The main contributions were as follows:
1. A deep-learning disease diagnosis model was proposed based on weakly supervised learning and clustering visualization (W_CVNet).
2. An optimizable weakly supervised segmentation preprocessing method was proposed. It acted as focal attention to the features.
3. This study proposed a dual asymmetric complementary bilinear feature extraction method using two networks, ResNet and VGG, to extract complementary features in parallel.
4. A new method was also proposed to visualize lesions based on the FCM clustering method (FCMM).
5. The results showed that the W_CVNet proposed in this study was better than the six most popular current classification networks.
The structured of this paper as follows. Section 2 summarizes the current research onCOVID-19 based on AI-assisted diagnosis. Section 3 discusses the proposed new model and each module. Section 4 provides the experimental details and a comparison of the proposed method with the existing methods. Section 5 concludes this study with a summary and discussion.
Previous studies have developed many computer-aided diagnosis systems that have demonstrated favorable outcomes. The AI-aided diagnosis of COVID-19 mainly used deep learning methods. This study aimed to explore migration learning and weakly supervised learning based on deep learning. The related studies are discussed later.
Transfer learning has become a popular and promising area in machine learning due to its broad applications. Several researchers used it for COVID-19 diagnosis. As a large amount of data can improve the accuracy of experiments, Loey et al. [14] collected COVID-19 data for experiments while generating many new images using a generative adversarial network based on migration learning. Cengil et al. [15] used a migration learning approach to extract features from EfficientNet-B0, Xception, and AlexNet, and pooled the extracted features for classification. Experiments were conducted on three different datasets with a classification accuracy of up to 99.6%. Gupta et al. [16] used migration learning to introduce two networks, DarkNet19 and MobileNetV2, and proposed a new network named deep learning models (DLMs). The 10-fold cross-validation experiments were conducted on a large, publicly available CT image dataset, with a classification accuracy of 98.91%. Pathak et al. [17] collected some of the data and trained the Densenet201 model using deep transfer learning techniques while visualizing the COVID-19-infected region using the Grad-Cam technique of patient classification. Further, a top-two smoothing loss function was introduced to avoid the problems of noise and data imbalance.
The problem of insufficient image labeling and excessive redundant information was addressed by many researchers using methods such as weakly supervised and unsupervised learning. Guendel et al. [18] proposed location-aware Dense Networks to improve classification accuracy by sensing lesion regions using CXR pathological location information. Tang et al. [19] proposed an iterative attention-guided refinement framework to improve the accuracy of disease classification and weakly supervised localization performance. Tang et al. [20] used thorax X-ray images for annotation and proposed a cross-attention-based segmentation network that could improve feature acquisition by obtaining contextual information. Mao et al. [21] identified COVID-19 by acquiring vessel-like signals and using unsupervised learning, with a final recognition accuracy of 93.1% and an area under the curve (AUC) of 97.1%. Rajawat et al. [22] used an image preprocessing pipeline to extract regions of interest and proposed a new method called C-COVIDNet with an F1-score of 97.91% and an accuracy of 97.5%. Chen et al. [23] used an unsupervised learning method to find the same feature regions of lung cancer images as COVID-19 images for the segmentation process. They proposed a teacher-student network to achieve good segmentation performance.
Most of the aforementioned studies related to lung diseases used a single network that could not extract complementary features. Some of the networks using migration learning also did not process redundant data. Further, most experiments used X-ray images, and fewer studies were performed on CT images. The majority of classification networks solely perform disease diagnosis, neglecting the segmentation and visualization of lesions. This study used a weakly supervised learning method for data preprocessing to address the aforementioned shortcomings, preserving the core part of the lung region. Further feature extraction was performed using VGG and ResNet with different focus points. Moreover, the lesions were segmented and visualized using the FCMM.
3.1 Optimizable Weakly Supervised Segmentation Preprocessing Module
This study used two publicly available datasets: the Data 1 dataset [24] for classification and the Data 2 dataset for data preprocessing. Both datasets had CT images. Data 1 had two categories: COVID-19 (349 images) and non-COVID (397 images). This dataset had image-level labeling, no pixel-level labeling of lesions, and no lung-area labeling. The Data 2 (COVID-19 CT segmentation [25]) was labeled for both lung and focal regions. In this study, we mainly trained the segmentation network using its lung-region-labeled data based on a weakly supervised learning strategy, which made the network recognize the lung region and obtain the learning model. This strategy was used to segment the lung region of Data 1 images. The data preprocessing is shown in Fig. 1. A new set of preprocessed data was finally obtained, named Data1_P.
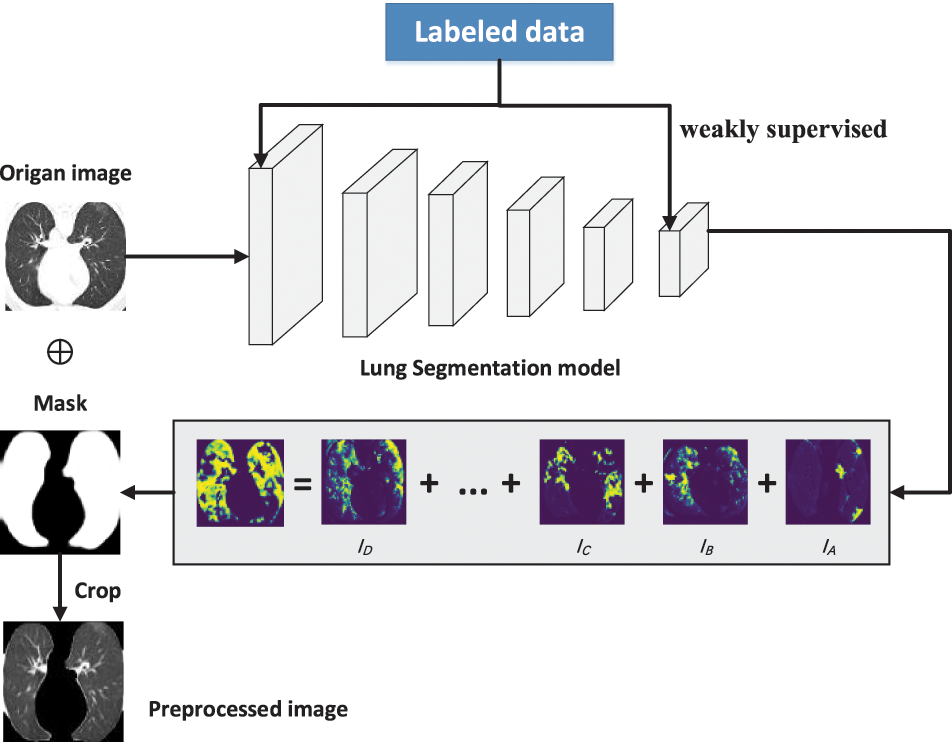
Figure 1: Data preprocessing using weakly supervised learning
We resized the set D1 (Data1-P) to a consistent size of 224 × 224 to obtain the new set D2 of images, as shown in Eq. (1).
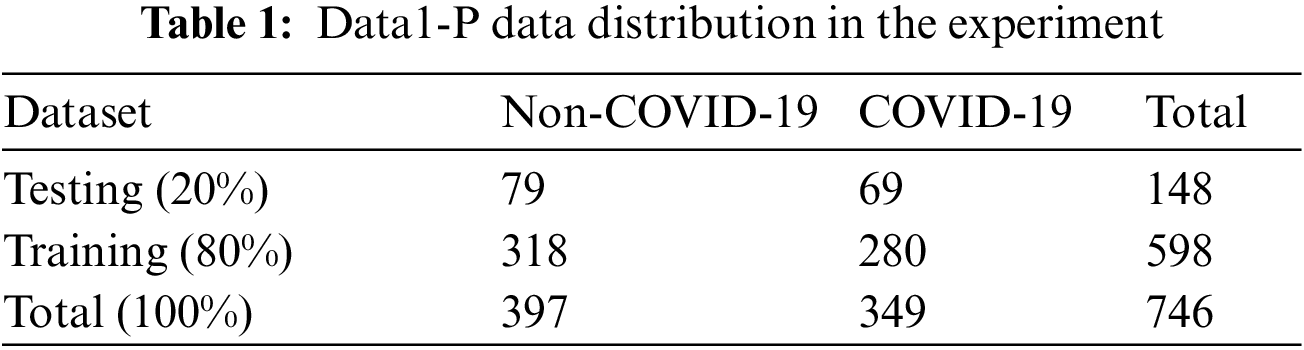
The dataset was categorized: the training set (X: 80%) and the testing set (Y: 20%), as shown in Table 1. The multiple-way data augmentation (MDA) [26] technique was applied due to the small amount of data to expand the data and decrease the occurrence of overfitting. Five data enhancement methods were used, converting it from the original image of the training set into six images.
where |.| refers to the cardinality of a set, i is the number of training set images, and j is the number of testing set images.
We used five MDA data enhancement (k1, k2, k3, k4, and k5) methods (noise injection, gamma correction, brighter, rotation, and darker) in the training set (X) to convert the original graph into six graphs. The expansion of the training set prevented the overfitting problem. The data augmentation methods and the associated parameter settings were as follows:
① Data enhancement1: Noise injection (No)
② Data enhancement2: Gamma correction (Ga)
③ Data enhancement3: Brighter (Bri)
④ Data enhancement4: Rotation (Ro)
The rotation angle θRot = 90° was applied to the images:
⑤ Data enhancement5: Darker (Dar)
where
where
3.3 Dual Asymmetric Complementary Bilinear Feature Extraction Module
The small amount of data led to insufficient training of deep learning networks and failed convergence. Migration learning can solve this problem by migrating some parameters trained on ImageNet to speed up training and improve performance. Using different deep learning networks can help extract complementary features. This study used a migration learning approach for VGG16 [27] and ResNet50 [28], and the extracted features were fused at the feature-level fusion. Fig. 2 shows the structure of the two networks. VGG is a simple and efficient network with few layers and low equipment requirements. The ResNet network structure is slightly more complex, introducing a residual structure and a deeper network to extract more complex features. VGG and ResNet networks together can yield complementary information.
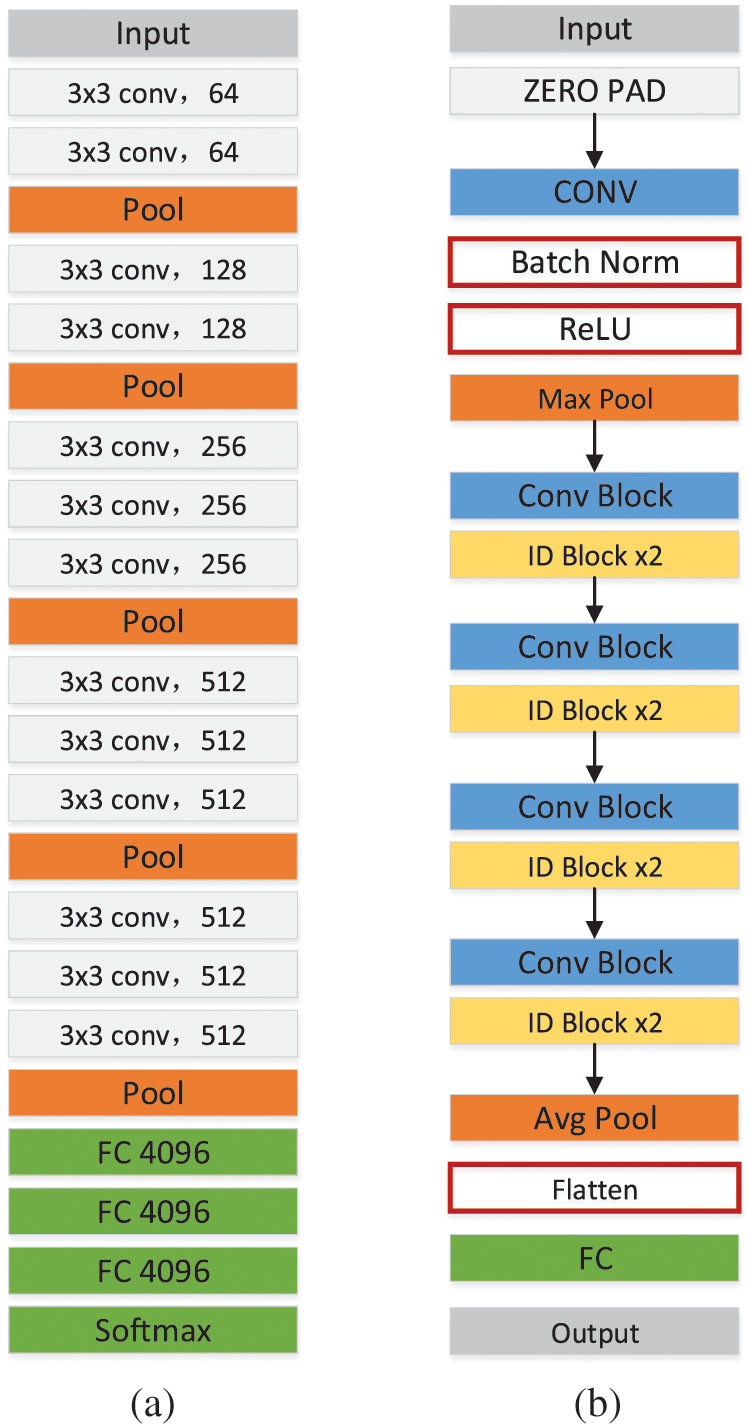
Figure 2: Structure diagram of VGG16 (a) and ResNet50 (b)
Feature extraction is performed using a computer to extract the information characteristics of an image. The image features extracted in this study were mainly focal areas, and COVID-19 was mainly judged based on a ground-glass-like decrease in translucency and increased density changes. The density of solid lesions was uniform, and no lung texture was seen. The lesions could be single or multiple. The dual asymmetric complementary feature extraction module had two feature extractors that performed linear operations on the extracted features to make them more obvious and effective, as shown in Fig. 3.
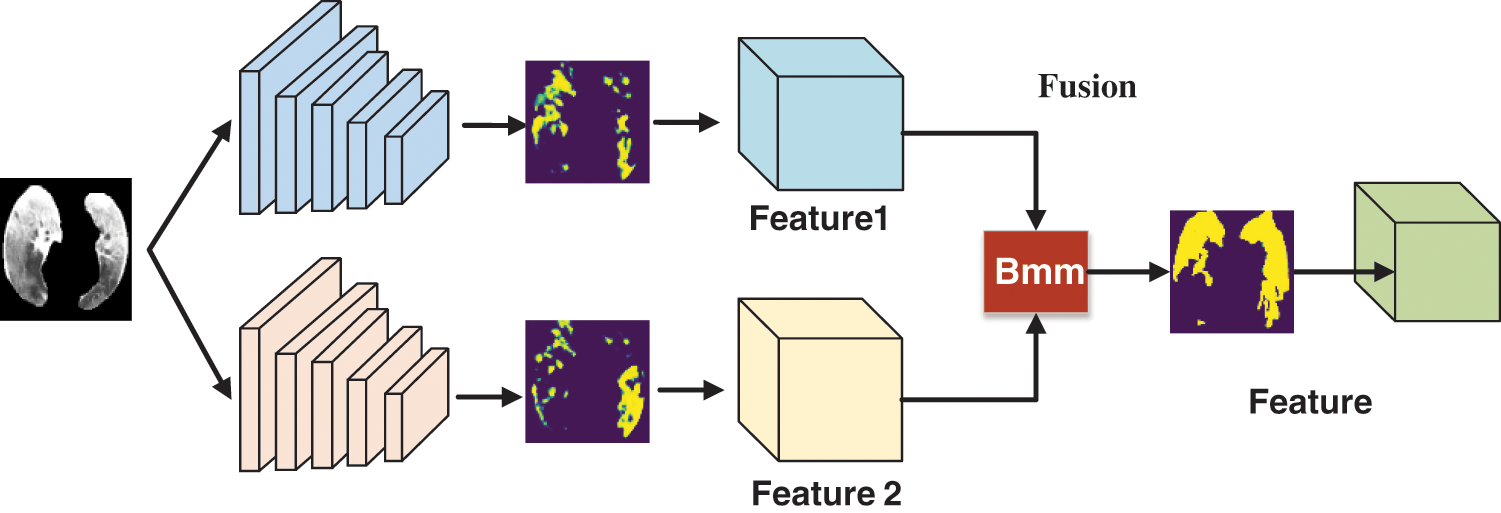
Figure 3: Flowchart of the dual asymmetric complementary bilinear feature extraction module
3.4 FCM Clustering Visualization Module
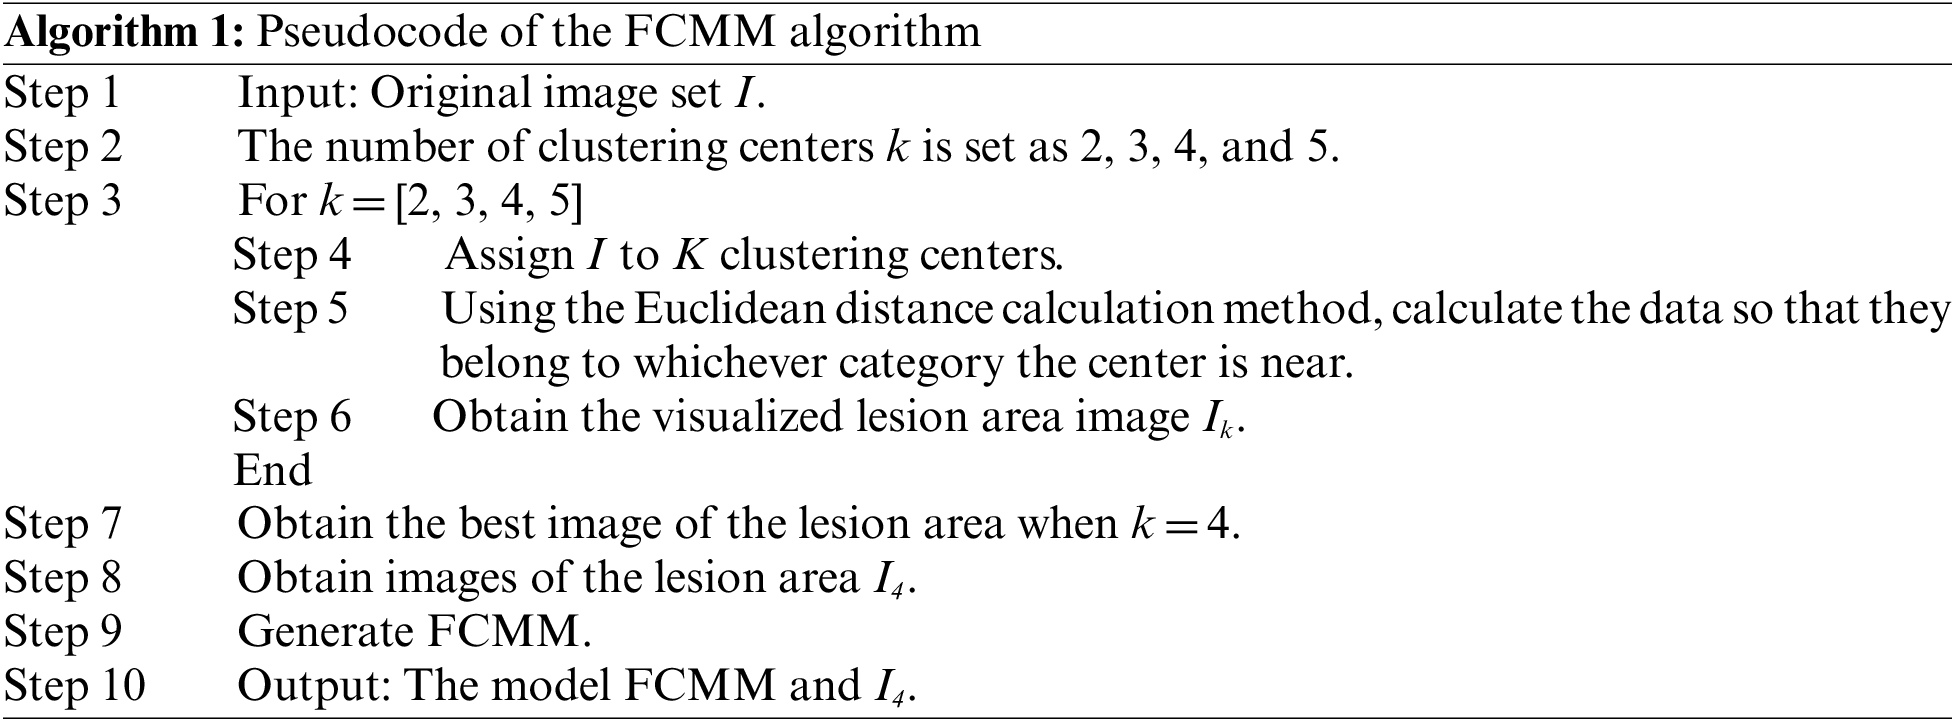
We used an FCM clustering [29] method that converted image-level markers into pixel-level markers for visual display to help doctors view the size and shape of the lesion area, identify the lesion accurately, and treat the disease quickly and effectively. The FCM algorithm is an improvement over the ordinary c-mean algorithm, which is rigid in terms of data division, while FCM is a flexible fuzzy mean division. In the FCM clustering algorithm, the purpose of iteration was to continuously optimize so that the result was infinitely close to the objective function. Eventually, each given data point was classified using an affiliation function with a value range between 0 and 1 to determine the degree to which it belonged to each class.
Suppose the given dataset is D. If these data are grouped into k classes, then k class centers are denoted as K. The affiliation of each sample j belonging to a class is uij. In this study, we set the k values to 2, 3, 4, and 5 for experiments. The results showed that the best effect was achieved when k was 4; m was the affiliation factor, generally set to 2;
The general steps of the FCM algorithm were as follows:
(1) Determine the number of categories k and the value of the index m, and also the end condition of the procedure: the number of iterations.
(2) Initialize an affiliation degree U.
(3) Calculate the clustering center C based on U.
(4) Calculate the objective function, T.
(5) Return to calculate U based on C, go back to step 3, and keep looping until the end.
Finally, we obtained the last calculated U. Each point belonging to a class had u. Then, we found the largest u among them and considered that this point belonged to this class. The pseudocode of FCMM is presented in Algorithm 1.
The physician first eliminated the distracting factors when finding the lesion, then gradually narrowed the scope to find the lung area, and finally determined the lesion area from the lung area. In this study, we proposed a deep learning classification network W_CVNet, which was grouped into three modules: O-WSSPM, D-CBM, and FCMM. The main role of O-WSSPM was to remove redundant data, preserve the lung region, and narrow the feature range. The main role of D-CBM was to obtain rich features for accurate localization of the lesion area. The FCMM mainly used FCM clustering to visualize the lesion area, which solved the problem of poor deep-learning visualization. Fig. 4 shows the structure of the proposed W_CVNet framework.
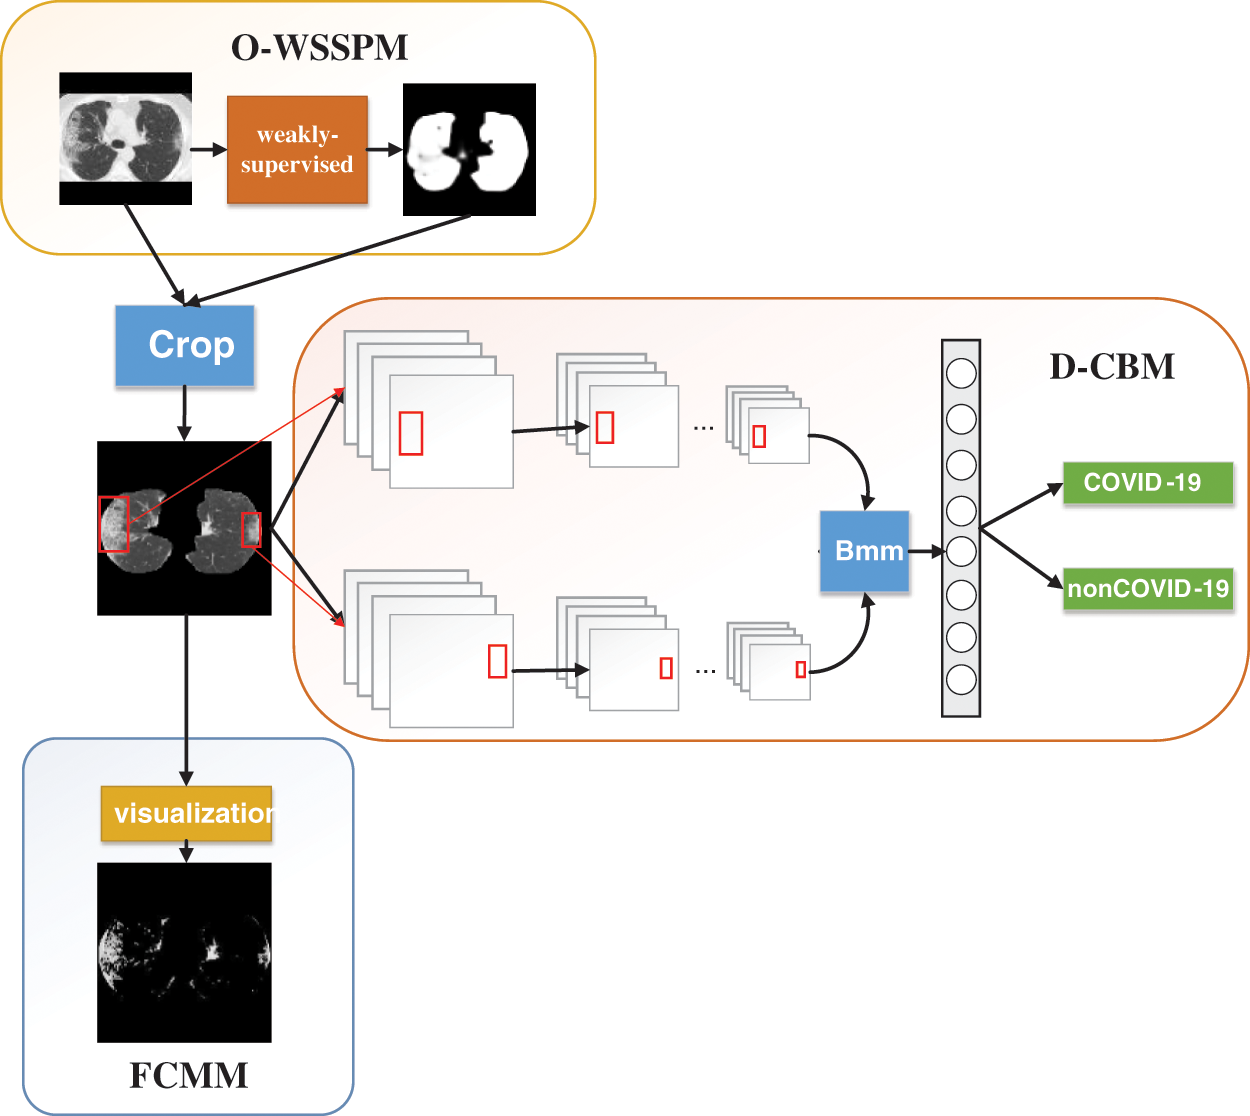
Figure 4: Structure of the proposed W_CVNet
The working environment of the experiment was mainly deployed on the Linux system, and the Tesla-V100 32 GB graphics card was used for deep learning training. The code is based on Python language for all experiments, including experimental data preprocessing and algorithm implementation. In addition, Pytorch syntax is used to complete the core experimental algorithm work, such as Numpy library. In terms of superparameters, the Epoch is adjusted and optimized to use 30, the learning rate is set to 0.003, the Dropout rate is set to 0.4, and the Batch Size is set to 8.
4.1 Data Pre-Processing Based on Weakly Supervised Learning
Inf-Net [30] was a segmentation network proposed by Fan et al. This network performed better than all five currently popular segmentation networks: U-Net [31], Attention-UNet [32], Gated-UNet [33], Dense-UNet [34], and U-Net++ [35]. We used lung-region data from Data 2 to train the Inf-Net network, with 80% as the training set and 20% as the test set. The aim was to let the network learn the lung-region features, obtain the segmentation model, and subsequently segment Data 1. Performance evaluation was conducted using six different metrics:
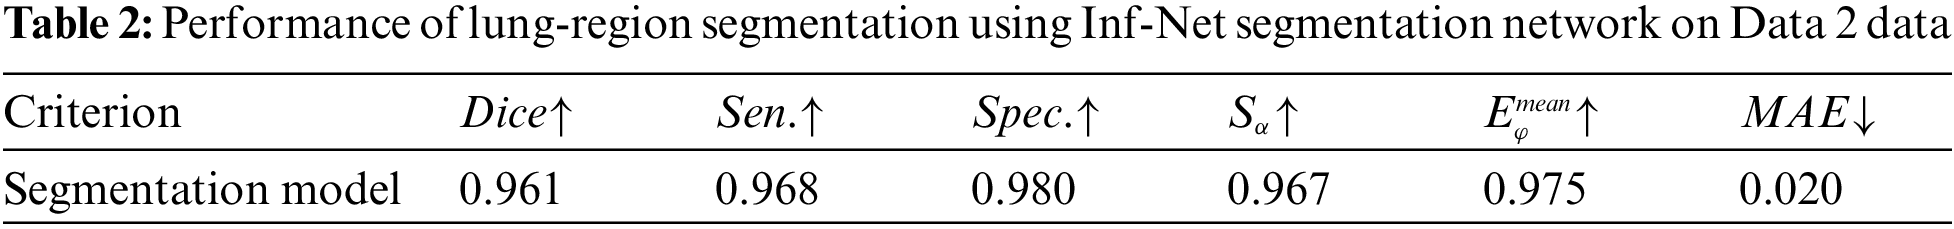
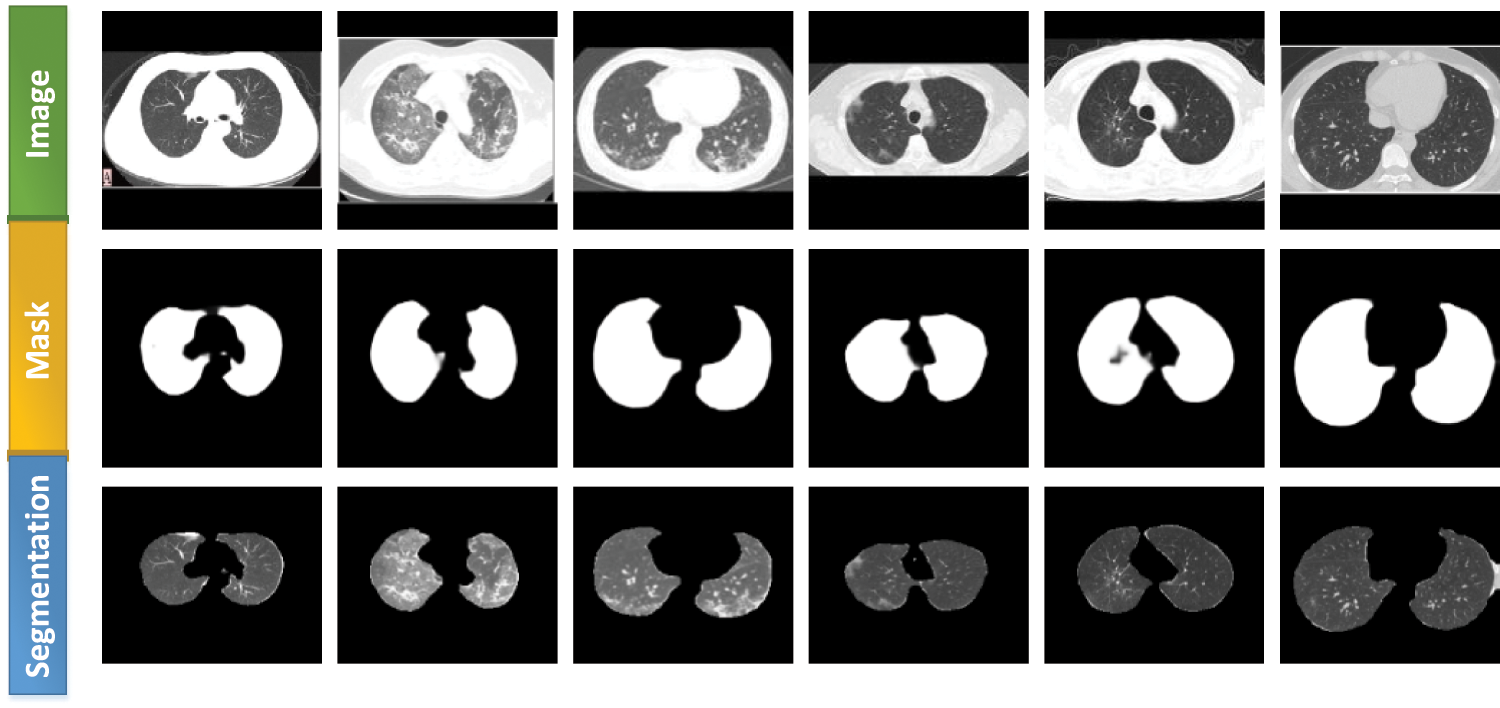
Figure 5: Lung segmentation generated using the Inf-Net network
We used six metrics to evaluate the performance of the proposed W_CVNet model: accuracy, specificity, sensitivity, precision, recall, and F1-score [36,37].
W_CVNet used ResNet50 and VGG16 as the backbone. The best performance of W_CVNet on the test set is depicted in Table 3. The accuracy, sensitivity, precision, recall, specificity, and F1-score were 86.486%, 89.855%, 82.667%, 89.855%, 83.544%, and 86.111%, respectively, for COVID-19 images, whereas they were 86.486%, 83.544%, 90.411%, 83.544%, 89.855%, and 86.842, respectively, for non-COVID images. Hence, the W_CVNet proposed in this study was effective. Fig. 6 shows the W_CVNet training process. The best results were considered for plotting the training loss and the test accuracy under each epoch. The epoch was plotted on the horizontal axis, while the test accuracy and training loss were represented on the left and right vertical axes, respectively. The training loss decreased with the iteration of the epoch until it reached 0.08 and did not change further.
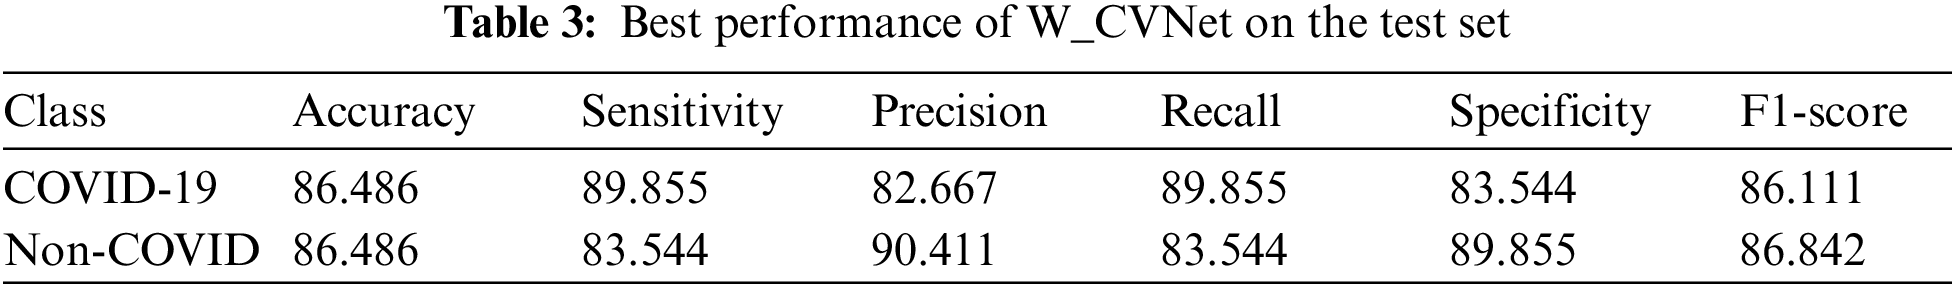
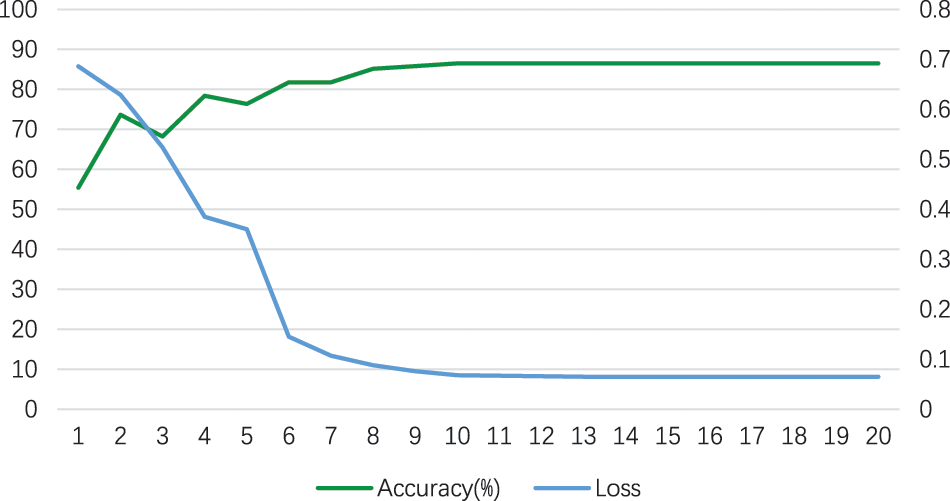
Figure 6: Training loss and test accuracy (%) of the W_CVNet
A confusion matrix [38] is a standard form of accuracy evaluation. Fig. 7 demonstrates a schematic confusion matrix of the two class conditions. The true negatives (TN), false negatives (FN), true positives (TP), and false positives (FP) were considered to explore the diagnosis based on CT images using the model. Fig. 8 illustrates the confusion matrix of the proposed W_CVNet.
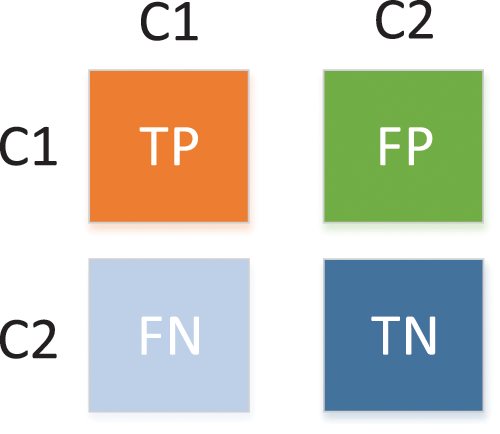
Figure 7: Confusion matrix of two class conditions
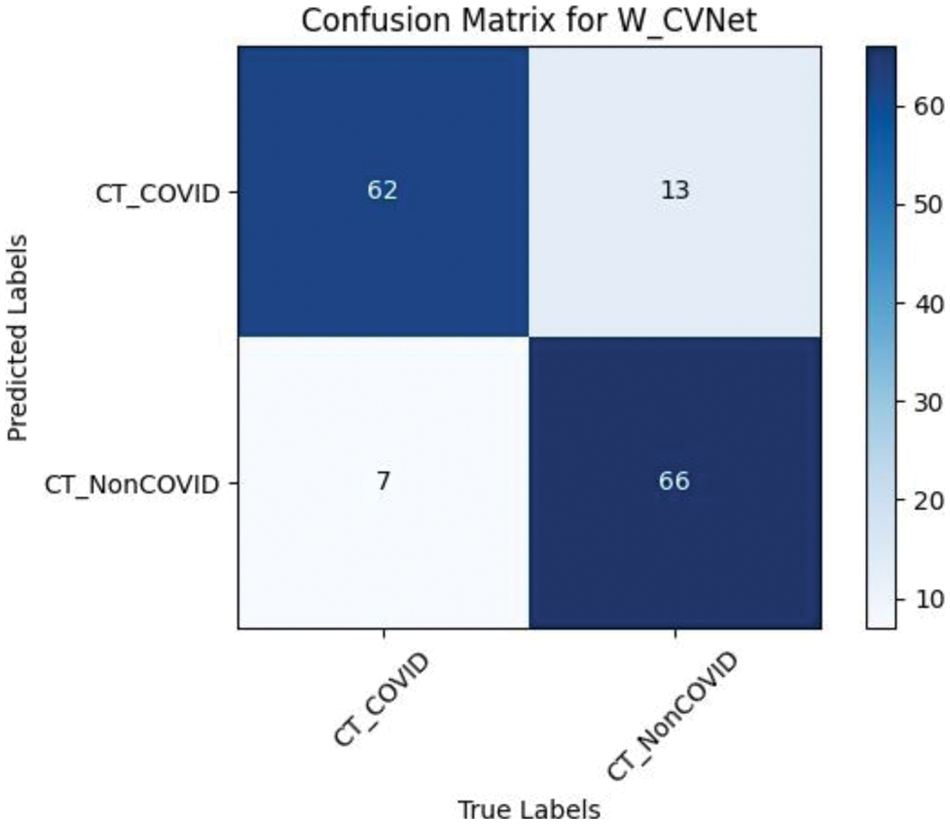
Figure 8: Confusion matrix of W_CVNet
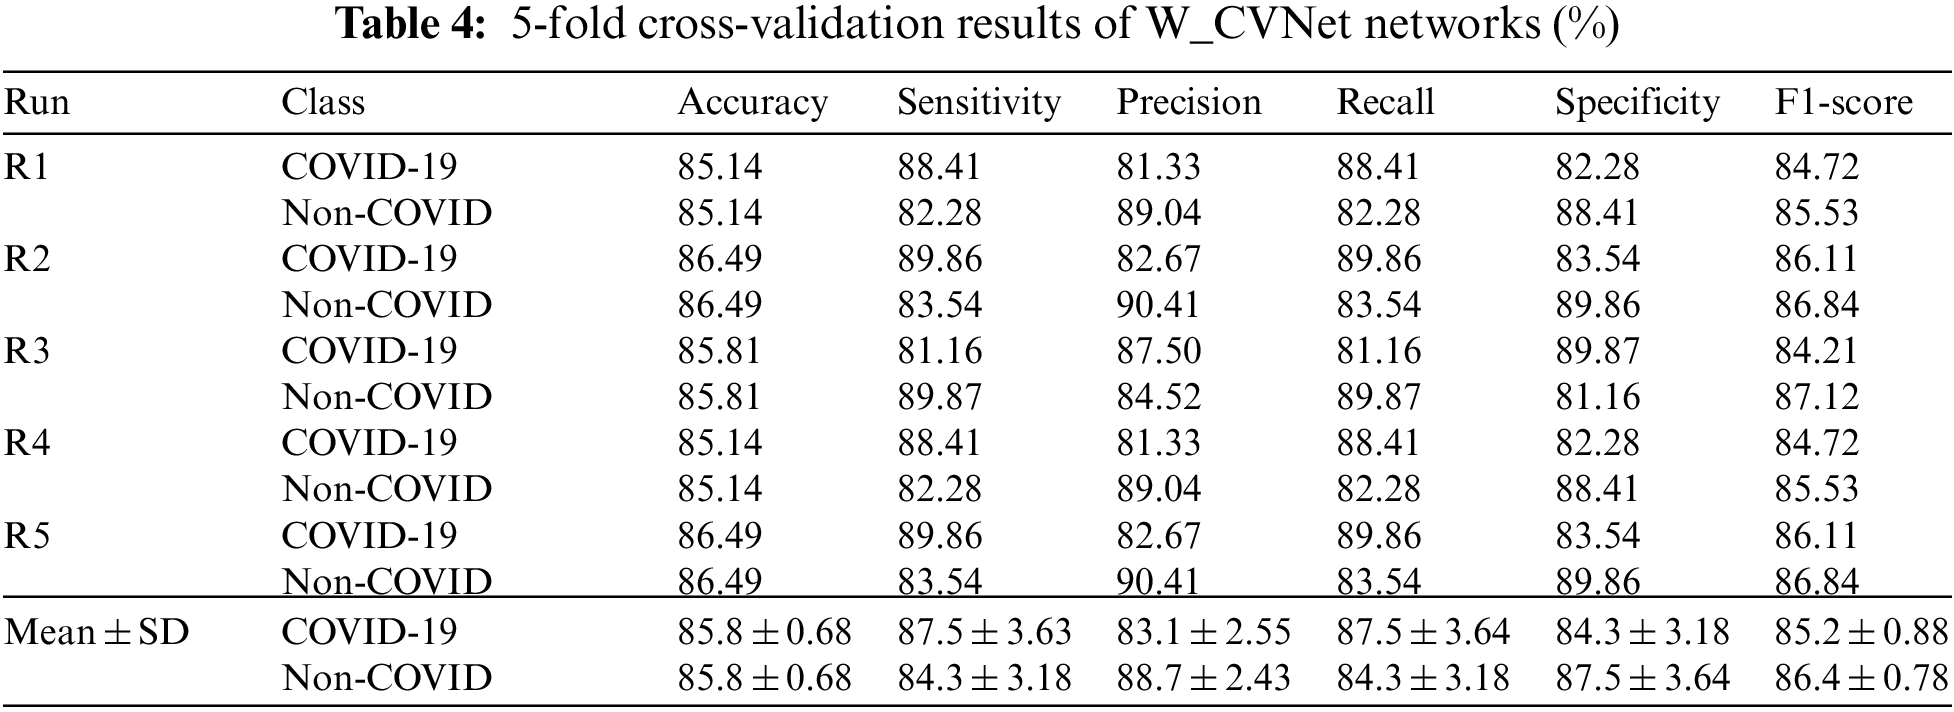
The study adopted the 5-fold cross-validation method, dividing the data into five equal parts. The first experiment used one of them as a test set and the other four as the training set; the second experiment used the second one as a test set and the other four as a training set, and so on. Notably, each one was used as a test set. The performance of all five experiments was obtained, and the final performance was the average of the five experiments. The 5-fold cross-validation could prevent overfitting problems during the experiments, leading to more accurate model results. W_CVNet performed a 5-fold cross-validation using the new dataset Data1-P. The results are presented in Table 4.
4.5 FCM Clustering Visualization Results
The data used in this study were image-level markers and could only be used for classification; no focal areas were marked. We used the FCMM to view the size and location of the lesions. Fig. 9 contains three sets of images: the first set contains the original images (Data 1), the second set contains the images after segmenting the lung area using weak supervision (Data1-P), and the third set contains the images of the lesion area using FCM. The lesions could be viewed, and FCMM was effective.
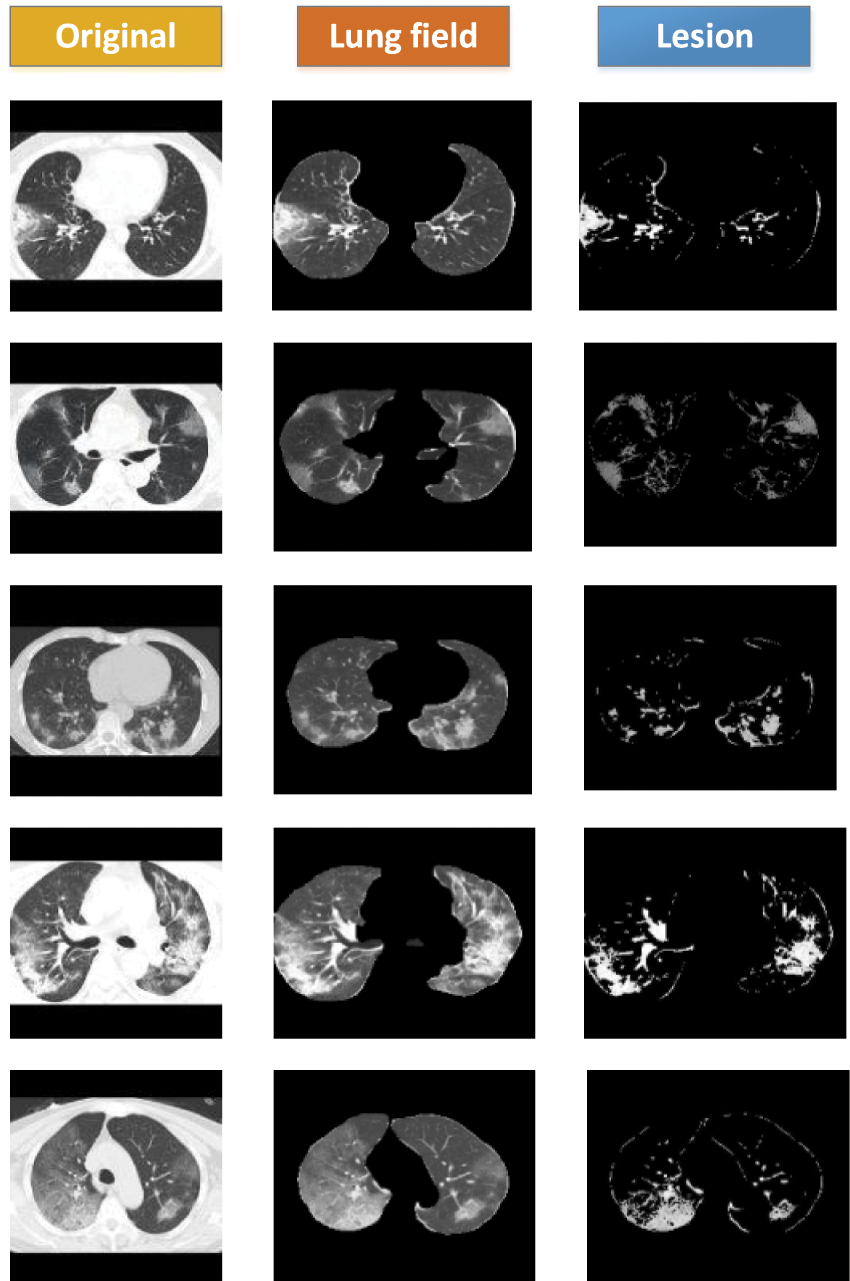
Figure 9: FCM clustering visualization showing COVID-19 lesion results
We compared the W_CVNet method with six different methods having better performance (FCONet [39], Fused-DenseNet-Tiny [40], Xception [41], ECOVNet [42], DTL-V19 [43], and BCNN_SVM [44]) to demonstrate its effectiveness. The experimental results are depicted in Table 5, revealing that our proposed W_CVNet method works best with the same data.
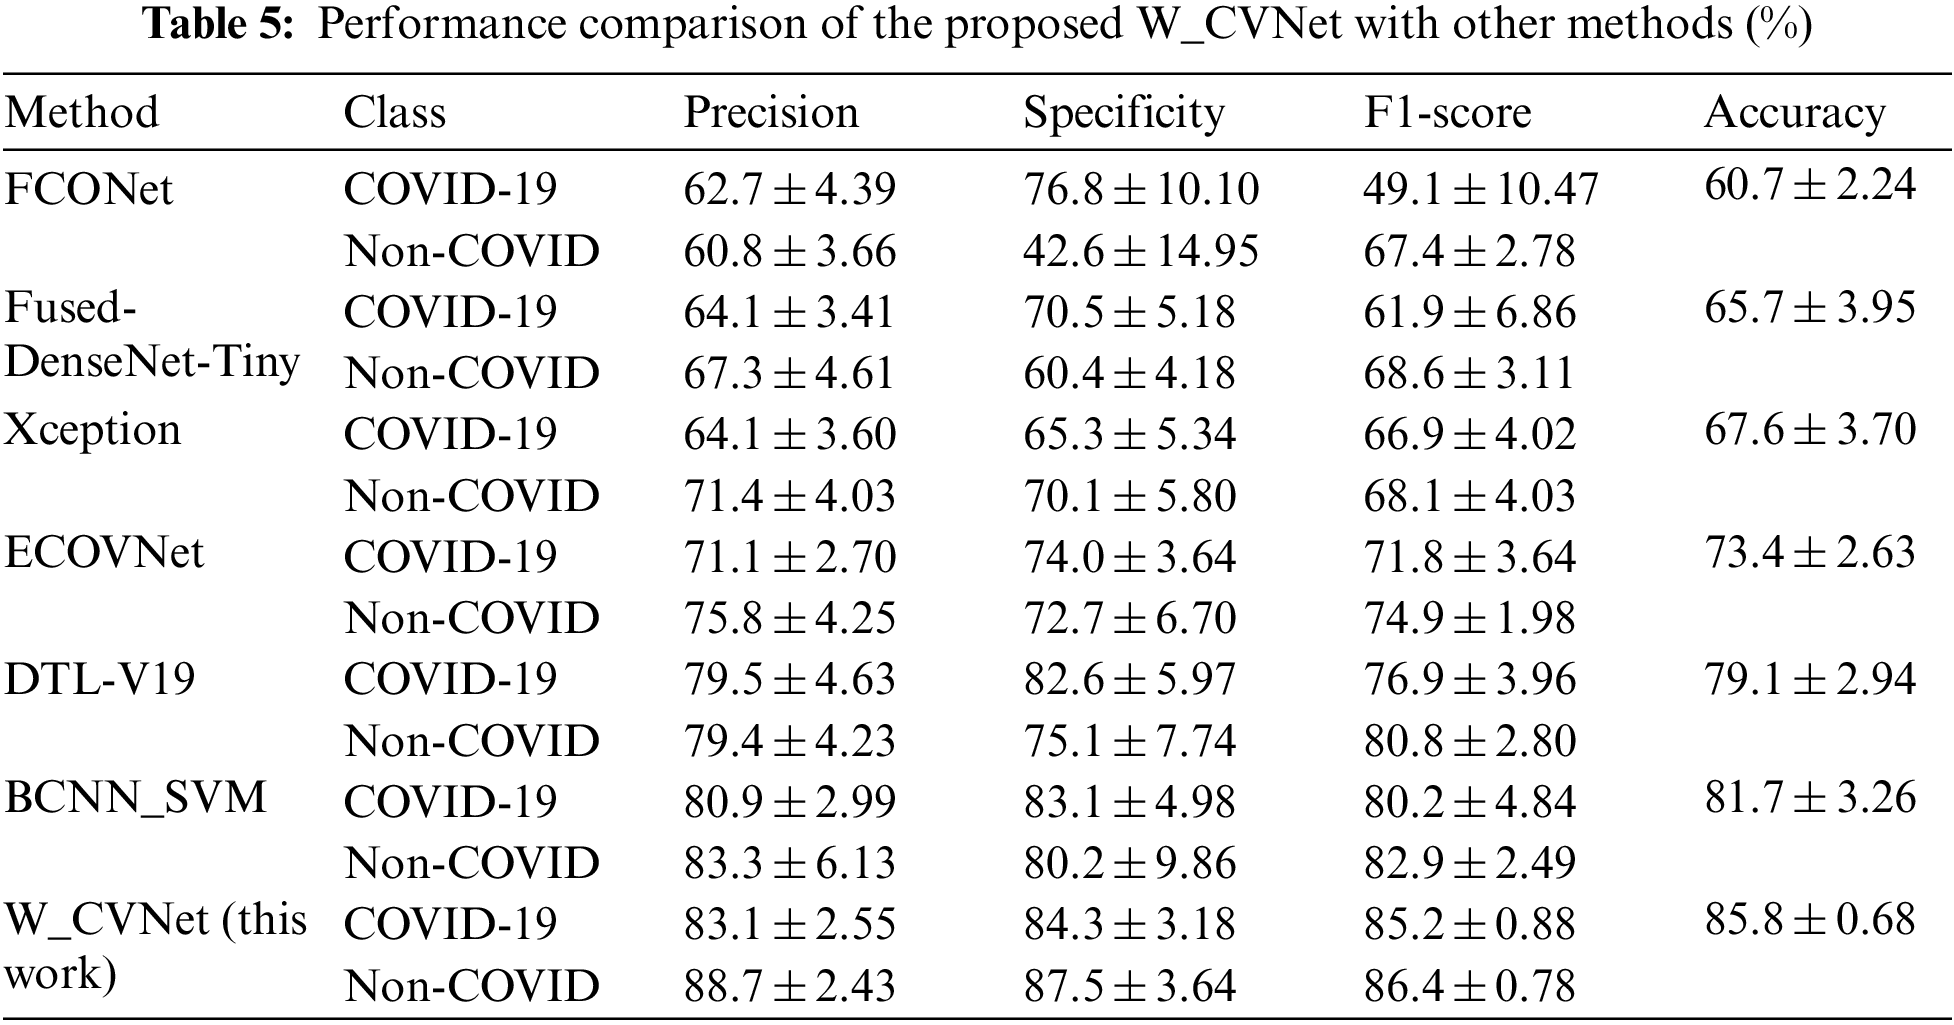
The aforementioned six methods were all relatively advanced classification methods proposed recently, among which Xception and ECOVNet did not perform migration learning and fusion. Fused-DenseNet-Tiny, FCONet, and DTL-V19 also used migration learning but did not perform feature fusion. BCNN_SVM used two identical VGG networks for feature fusion and could not obtain complementary feature. This study used VGG and ResNet to extract features in parallel. The feature extraction ability was better than that of the individual networks. Migration learning and feature fusion played an essential role in improving the feature extraction performance. Compared with other methods, our proposed W_CVNet was unique because it removed the redundant features, focused on the deep learning attention on the core region, and learned more accurate features. At the same time, it used different networks to extract features in parallel, focusing on different regions, thereby obtaining richer features. It also used the MDA data enhancement technique, which helped prevent overfitting of the model. The effectiveness of the network was verified.
This study proposed a network model (W_CVNet) that included both classification and segmentation. This model has a limitation: finding labeled data in the lung area was difficult due to insufficient labeling data. However, this model had the following advantages: ① It could remove redundant information and narrow down the feature-finding range. ② Complementary features could be obtained to improve the deep learning extraction performance by fusing different deep learning networks focusing on different features. ③ FCMM was used to focus on images without pixel-level labeling and to visualize them. ④ We conducted an experimental comparison with six classification networks and the results were the best. ⑤ The model could be adjusted to suit the actual images and then deployed on hospital servers to assist doctors in disease diagnosis and accurate identification of lesion areas, making it highly practical for clinical use. However, the drawback of the model was that the complexity was high due to the use of two networks to extract features in parallel, leading to a longer training time. Further studies should be conducted to optimize the network structure and reduce the time complexity.
Moreover, the proposed W_CVNet had the following two disadvantages: (1) As the segment was trained on the lung region of CT images, weakly supervised segmentation of CXR images could not be performed. (2) The severity of the disease could not be judged.
Acknowledgement: The authors would like to thank the Anhui Engineering Research Center of Intelligent Perception and Elderly Care of Chuzhou University.
Funding Statement: This research was funded by the Open Foundation of Anhui Engineering Research Center of Intelligent Perception and Elderly Care, Chuzhou University (No. 2022OPA03) , the Higher Education Natural Science Foundation of Anhui Province (No. KJ2021B01) and the Innovation Team Projects of Universities in Guangdong (No. 2022KCXTD057).
Author Contributions: The authors confirm contribution to the paper as follows: study conception and design: Zhengang Jiang, Jingyao Liu; data collection: Qinghe Feng, Jiashi Zhao, Yu Miao; analysis and interpretation of results: Jingyao Liu, Wei He, Weili Shi; draft manuscript preparation: Jingyao Liu. All authors reviewed the results and approved the final version of the manuscript.
Availability of Data and Materials: The data that support the findings of this study are openly at: https://medicalsegmentation.com/covid19/, reference number [25].
Conflicts of Interest: The authors declare that they have no conflicts of interest to report regarding the present study.
References
1. World Health Organization, Laboratory testing for coronavirus disease 2019 (COVID-19) in suspected human cases: Interim guidance, 2020. [Google Scholar]
2. B. Xie, S. Li, M. Li, C. H. Liu, G. Huang et al., “Sepico: Semantic-guided pixel contrast for domain adaptive semantic segmentation,” IEEE Transactions on Pattern Analysis and Machine Intelligence, vol. 45, no. 7, pp. 9004–9021, 2023. [Google Scholar]
3. Z. Lv, Z. Yu, S. Xie and A. Alamri, “Deep learning-based smart predictive evaluation for interactive multimedia-enabled smart healthcare,” ACM Transactions on Multimedia Computing Communications and Applications, vol. 18, no. 1s, pp. 1–20, 2022. [Google Scholar]
4. S. Lu, B. Yang, Y. Xiao, S. Liu, M. Liu et al., “Iterative reconstruction of low-dose CT based on differential sparse,” Biomedical Signal Processing and Control, vol. 79, pp. 104204, 2023. [Google Scholar]
5. A. Amyar, R. Modzelewski, H. Li and S. Ruan, “Multi-task deep learning based CT imaging analysis for COVID-19 pneumonia: Classification and segmentation,” Computers in Biology and Medicine, vol. 126, pp. 104037, 2020. [Google Scholar] [PubMed]
6. J. Liu, Q. Feng, Y. Miao, W. He, W. Shi et al., “COVID-19 disease identification network based on weakly supervised feature selection,” Mathematical Biosciences and Engineering, vol. 20, no. 5, pp. 9327–9348, 2023. [Google Scholar] [PubMed]
7. H. T. Zhang, J. S. Zhang, H. H. Zhang, Y. D. Nan, Y. Zhao et al., “Automated detection and quantification of COVID-19 pneumonia: CT imaging analysis by a deep learning-based software,” European Journal of Nuclear Medicine and Molecular Imaging, vol. 47, pp. 2525–2532, 2020. [Google Scholar] [PubMed]
8. S. D. Thepade and K. Jadhav, “COVID19 identification from chest X-ray images using local binary patterns with assorted machine learning classifiers,” in 2020 IEEE Bombay Section Signature Conf. (IBSSC), Mumbai, India, pp. 46–51, 2020. [Google Scholar]
9. N. Ullah, J. A. Khan, S. El-Sappagh, N. El-Rashidy and M. S. Khan, “A holistic approach to identify and classify COVID-19 from chest radiographs, ECG, and CT-scan images using ShuffleNet convolutional neural network,” Diagnostics, vol. 13, no. 1, pp. 162, 2023. [Google Scholar] [PubMed]
10. X. Xu, X. Jiang, C. Ma, P. Du, X. Li et al., “A deep learning system to screen novel coronavirus disease 2019 pneumonia,” Engineering, vol. 6, no. 10, pp. 1122–1129, 2020. [Google Scholar] [PubMed]
11. V. Shah, R. Keniya, A. Shridharani, M. Punjabi, J. Shah et al., “Diagnosis of COVID-19 using CT scan images and deep learning techniques,” Emergency Radiology, vol. 28, pp. 497–505, 2021. [Google Scholar] [PubMed]
12. N. Jagan Mohan and D. K. Pandiri, “GIL-CNN: A novel multipath features for COVID-19 detection using CT-scan images,” IETE Journal of Research, pp. 1–12, 2022. https://doi.org/10.1080/03772063.2022.2098194 [Google Scholar] [CrossRef]
13. M. Gour and S. Jain, “Automated COVID-19 detection from X-ray and CT images with stacked ensemble convolutional neural network,” Biocybernetics and Biomedical Engineering, vol. 42, no. 1, pp. 27–41, 2022. [Google Scholar] [PubMed]
14. M. Loey, F. Smarandache and N. E. M. Khalifa, “Within the lack of chest COVID-19 X-ray dataset: A novel detection model based on GAN and deep transfer learning,” Symmetry, vol. 12, no. 4, pp. 651, 2020. [Google Scholar]
15. E. Cengil and A. Çınar, “The effect of deep feature concatenation in the classification problem: An approach on COVID-19 disease detection,” International Journal of Imaging Systems and Technology, vol. 32, no. 1, pp. 26–40, 2022. [Google Scholar] [PubMed]
16. K. Gupta and V. Bajaj, “Deep learning models-based CT-scan image classification for automated screening of COVID-19,” Biomedical Signal Processing and Control, vol. 80, pp. 104268, 2023. [Google Scholar] [PubMed]
17. Y. Pathak, P. K. Shukla, A. Tiwari, S. Stalin and S. Singh, “Deep transfer learning based classification model for COVID-19 disease,” IRBM, vol. 43, no. 2, pp. 87–92, 2022. [Google Scholar] [PubMed]
18. S. Guendel, S. Grbic, B. Georgescu, S. Liu, A. Maier et al., “Learning to recognize abnormalities in chest X-rays with location-aware dense networks,” in Progress in Pattern Recognition, Image Analysis, Computer Vision, and Applications: 23rd Iberoamerican Cong., CIARP 2018, Madrid, Spain, pp. 757–765, 2019. [Google Scholar]
19. Y. Tang, X. Wang, A. P. Harrison, L. Lu, J. Xiao et al., “Attention-guided curriculum learning for weakly supervised classification and localization of thoracic diseases on chest radiographs,” in Machine Learning in Medical Imaging: 9th Int. Workshop, MLMI 2018, Held in Conjunction with MICCAI 2018, Granada, Spain, pp. 249–258, 2018. [Google Scholar]
20. Y. B. Tang, Y. X. Tang, J. Xiao and R. M. Summers, “XLSor: A robust and accurate lung segmentor on chest X-rays using criss-cross attention and customized radiorealistic abnormalities generation,” in Int. Conf. on Medical Imaging with Deep Learning, London, UK, pp. 457–467, 2019. [Google Scholar]
21. X. Mao, X. P. Liu, M. Xiong, X. Yang, X. Jin et al., “Development and validation of chest CT-based imaging biomarkers for early stage COVID-19 screening,” Cold Spring Harbor Laboratory Press, 2020. [Google Scholar]
22. N. Rajawat, B. S. Hada, M. Meghawat, S. Lalwani and R. Kumar, “C-COVIDNet: A CNN model for COVID-19 detection using image processing,” Arabian Journal for Science and Engineering, vol. 47, no. 8, pp. 10811–10822, 2022. [Google Scholar] [PubMed]
23. H. Chen, Y. Jiang, H. Ko and M. Loew, “A teacher-student framework with fourier transform augmentation for COVID-19 infection segmentation in CT images,” Biomedical Signal Processing and Control, vol. 79, pp. 104250, 2023. [Google Scholar] [PubMed]
24. J. Zhao, Y. Zhang, X. He and P. Xie, “COVID-CT-dataset: A CT scan dataset about COVID-19,” Computer Science, Medicine, vol. 490, no. 10.48550, 2020. [Google Scholar]
25. COVID-19 CT segmentation dataset, 2020. [Online]. Available: https://medicalsegmentation.com/covid19/ [Google Scholar]
26. S. H. Wang, V. V. Govindaraj, J. M. Górriz, X. Zhang and Y. D. Zhang, “COVID-19 classification by FGCNet with deep feature fusion from graph convolutional network and convolutional neural network,” Information Fusion, vol. 67, pp. 208–229, 2021. [Google Scholar] [PubMed]
27. K. Simonyan and A. Zisserman, “Very deep convolutional networks for large-scale image recognition,” arXiv preprint arXiv:1409.1556, 2014. [Google Scholar]
28. K. He, X. Zhang, S. Ren and J. Sun, “Deep residual learning for image recognition,” in Proc. of the IEEE Conf. on Computer Vision and Pattern Recognition, Las Vegas, USA, pp. 770–778, 2016. [Google Scholar]
29. R. Xu and D. Wunsch, “Survey of clustering algorithms,” IEEE Transactions on Neural Networks, vol. 16, no. 3, pp. 645–678, 2005. [Google Scholar] [PubMed]
30. D. P. Fan, T. Zhou, G. P. Ji, Y. Zhou, G. Chen et al., “Inf-Net: Automatic COVID-19 lung infection segmentation from CT images,” IEEE Transactions on Medical Imaging, vol. 39, no. 8, pp. 2626–2637, 2020. [Google Scholar] [PubMed]
31. O. Ronneberger, P. Fischer and T. Brox, “U-Net: Convolutional networks for biomedical image segmentation,” in Medical Image Computing and Computer-Assisted Intervention–MICCAI 2015: 18th Int. Conf., Munich, Germany, vol. 9351, pp. 234–241, 2015. [Google Scholar]
32. O. Oktay, J. Schlemper, L. L. Folgoc, M. Lee, M. Heinrich et al., “Attention U-Net: Learning where to look for the pancreas,” arXiv preprint arXiv:1804.03999, 2018. [Google Scholar]
33. J. Schlemper, O. Oktay, M. Schaap, M. Heinrich, B. Kainz et al., “Attention gated networks: Learning to leverage salient regions in medical images,” Medical Image Analysis, vol. 53, pp. 197–207, 2019. [Google Scholar] [PubMed]
34. X. Li, H. Chen, X. Qi, Q. Dou, C. W. Fu et al., “H-DenseUNet: Hybrid densely connected UNet for liver and tumor segmentation from CT volumes,” IEEE Transactions on Medical Imaging, vol. 37, no. 12, pp. 2663–2674, 2018. [Google Scholar] [PubMed]
35. Z. Zhou, M. M. Rahman Siddiquee, N. Tajbakhsh and J. Liang, “UNet++: A nested U-Net architecture for medical image segmentation,” in Deep Learning in Medical Image Analysis and Multimodal Learning for Clinical Decision Support: 4th Int. Workshop, DLMIA 2018, and 8th Int. Workshop, ML-CDS 2018, Granada, Spain, pp. 3–11, 2018. [Google Scholar]
36. S. F. Qadri, L. Shen, M. Ahmad, S. Qadri, S. S. Zareen et al., “SVseg: Stacked sparse autoencoder-based patch classification modeling for vertebrae segmentation,” Mathematics, vol. 10, no. 5, pp. 796, 2022. [Google Scholar]
37. S. F. Qadri, L. Shen, M. Ahmad, S. Qadri, S. S. Zareen et al., “OP-convNet: A patch classification-based framework for CT vertebrae segmentation,” IEEE Access, vol. 9, pp. 158227–158240, 2021. [Google Scholar]
38. D. Chicco, N. Tötsch and G. Jurman, “The Matthews correlation coefficient (MCC) is more reliable than balanced accuracy, bookmaker informedness, and markedness in two-class confusion matrix evaluation,” BioData Mining, vol. 14, no. 1, pp. 1–22, 2021. [Google Scholar]
39. H. Ko, H. Chung, W. S. Kang, K. W. Kim, Y. Shin et al., “COVID-19 pneumonia diagnosis using a simple 2D deep learning framework with a single chest CT image: Model development and validation,” Journal of Medical Internet Research, vol. 22, no. 6, pp. e19569, 2020. [Google Scholar] [PubMed]
40. F. J. P. Montalbo, “Diagnosing COVID-19 chest X-rays with a lightweight truncated DenseNet with partial layer freezing and feature fusion,” Biomedical Signal Processing and Control, vol. 68, pp. 102583, 2021. [Google Scholar] [PubMed]
41. F. Chollet, “Xception: Deep learning with depthwise separable convolutions,” in Proc. of the IEEE Conf. on Computer Vision and Pattern Recognition, Honolulu Hawaii, USA, pp. 1251–1258, 2017. [Google Scholar]
42. A. Garg, S. Salehi, M. La Rocca, R. Garner and D. Duncan, “Efficient and visualizable convolutional neural networks for COVID-19 classification using chest CT,” Expert Systems with Applications, vol. 195, pp. 116540, 2022. [Google Scholar] [PubMed]
43. H. Panwar, P. K. Gupta, M. K. Siddiqui, R. Morales-Menendez, P. Bhardwaj et al., “A deep learning and grad-CAM based color visualization approach for fast detection of COVID-19 cases using chest X-ray and CT-scan images,” Chaos, Solitons & Fractals, vol. 140, pp. 110190, 2020. [Google Scholar]
44. R. Mastouri, N. Khlifa, H. Neji and S. Hantous-Zannad, “A bilinear convolutional neural network for lung nodules classification on CT images,” International Journal of Computer Assisted Radiology and Surgery, vol. 16, pp. 91–101, 2021. [Google Scholar] [PubMed]
Cite This Article
 Copyright © 2023 The Author(s). Published by Tech Science Press.
This work is licensed under a Creative Commons Attribution 4.0 International License , which permits unrestricted use, distribution, and reproduction in any medium, provided the original work is properly cited.
 Downloads
 Citation Tools