
 Submit a Paper
 Propose a Special lssue
 Open Access
ARTICLE

Detection of Different Stages of Alzheimer’s Disease Using CNN Classifier
1 Department of Computer Science, American International University-Bangladesh (AIUB), Dhaka, 1229, Bangladesh
2 Centre for Advanced Machine Learning and Applications (CAMLAs), Dhaka, Bangladesh
3 Department of Software Engineering, Daffodil International University, Dhaka, Bangladesh
4 Department of Computer Engineering, Umm Al-Qura University, Mecca, 24381, Saudi Arabia
5 Department of ECE, University of Saskatchewan, Saskatoon, SK S7N5A9, Canada
6 Group of Biophotomatiχ, Department of ICT, MBSTU, Santosh, Tangail, 1902, Bangladesh
* Corresponding Authors: Kawsar Ahmed. Email: ,
Computers, Materials & Continua 2023, 76(3), 3933-3948. https://doi.org/10.32604/cmc.2023.039020
Received 08 January 2023; Accepted 13 June 2023; Issue published 08 October 2023
 View Full Text
 Download PDF
Abstract
Alzheimer’s disease (AD) is a neurodevelopmental impairment that results in a person’s behavior, thinking, and memory loss. The most common symptoms of AD are losing memory and early aging. In addition to these, there are several serious impacts of AD. However, the impact of AD can be mitigated by early-stage detection though it cannot be cured permanently. Early-stage detection is the most challenging task for controlling and mitigating the impact of AD. The study proposes a predictive model to detect AD in the initial phase based on machine learning and a deep learning approach to address the issue. To build a predictive model, open-source data was collected where five stages of images of AD were available as Cognitive Normal (CN), Early Mild Cognitive Impairment (EMCI), Mild Cognitive Impairment (MCI), Late Mild Cognitive Impairment (LMCI), and AD. Every stage of AD is considered as a class, and then the dataset was divided into three parts binary class, three class, and five class. In this research, we applied different preprocessing steps with augmentation techniques to efficiently identify AD. It integrates a random oversampling technique to handle the imbalance problem from target classes, mitigating the model overfitting and biases. Then three machine learning classifiers, such as random forest (RF), K-Nearest neighbor (KNN), and support vector machine (SVM), and two deep learning methods, such as convolutional neuronal network (CNN) and artificial neural network (ANN) were applied on these datasets. After analyzing the performance of the used models and the datasets, it is found that CNN with binary class outperformed 88.20% accuracy. The result of the study indicates that the model is highly potential to detect AD in the initial phase.Keywords
Alzheimer’s disease (AD) is a neurological illness responsible for impairing a person’s behavior, thinking, and memory to the point where they frequently forget things and have trouble doing daily chores. Alzheimer’s disease is the most prominent form of dementia, responsible for roughly 60–80 percent of all dementia cases [1]. AD symptoms are comparable to general human aging, thus making detection harder in the early stages. It is critical to recognize that Alzheimer’s disease, like dementia, is not a normal aspect of aging and that both of these conditions imply brain deterioration. The most common symptom is memory loss, in which daily activities are hampered. In time, signs of depression and apathy are also prevalent and some may also suffer from verbal and physical agitation [2]. With further disease progression, delusions, hallucinations, and aggression become a more common sight [3]. Over time, the symptoms of dementia only keep worsening. Recent research points out that AD is associated with neurotic plaques and neurofibrillary tangles in the brain [3]. Neurotic plaques are made of a special protein called Amyloid beta. While it is strongly implicated in AD, its role as a causative factor is still debated. A potential cause of AD is genetic factors. AD is mainly influenced by two genes: Deterministic Genes and Risk Genes. Deterministic genes directly cause AD, so anyone inheriting the gene will eventually develop symptoms of AD. This rare case accounts for only 1% of AD cases [4]. While this gene is rare, its discovery has paved the way for future research for understanding AD. Risk genes are genetic components that can increase the chances of being diagnosed with AD but are not always the direct cause of AD. Mild Cognitive Impairment (MCI) is often considered an initial stage of AD where family members can notify the patient’s cognitive changes. However, often the changes are not significant enough to be classified as dementia. It can be considered as the path toward dementia [5].
AD is a protein-misfolding disease. In protein misfolding, the polypeptide folds incorrectly, causing its final three-dimensional structure to be incorrect. As a result, the protein does not perform its intended work. The protein quality control (POC) systems often break down these proteins to be used for future protein synthesis. However, cells that are aging and cells with genetic diseases may not properly control this buildup of misfolded protein. As a result, these protein blocks may hamper basic cell cell-selectivity 11. In the case of AD, amyloid beta protein folds abnormally in the brains of AD patients [1,3]. These amyloid protein fragments often form a sticky plaque-like structure [6]. These structures block the signaling between brain cells, triggering an immune response and thus the eventual death of neurons through neurodegeneration. Amyloid plaques are “a characteristic sign of a pathological diagnosis of AD” according to a study [7]. Biomarkers can detect the formation and accumulation of these plaques. The protein quaintly can be measured in plasma and cerebrospinal fluid (CSF). Alzheimer’s Disease can also be caused by abnormal clustering of tau protein. Tau protein is a protein associated with microtubules that stabilize microtubules in the cell’s cytoskeleton [8]. It keeps the microtubules straight, causing molecules to pass freely between different cell components. However, when the protein tangles and creates twisted strands, the microtubules lose their structure and disintegrate, causing the obstruction of Ion and nutrient transport from cell to cell and leading to the eventual death of neurons. This continuous accumulation of neurofibrillary tangles and formation of beta-amyloid plaques eventually cause the death of neurons and the breakage of synapses, causing various cognitive problems and memory decline [7,9]. On the other hand, these plaques and tangles can also be noticed in the brains of older people who did not experience any symptoms of Alzheimer’s disease during their lifetime [3,10]. Since such scenarios are rare in the brains of young individuals, it is assumed that the AD-related symptoms in older patients represent “pathological aging” or preclinical AD [10–12]. This implies the disease may exist, but there are no clinically noticeable changes in cognition. Currently, AD and natural aging cannot be easily differentiated from one another. AD is such a disease that is not still curable. While progress has been made in detecting and treating AD, it is still a hopeless disease that ensures eventual death. The current treatments mainly try to tackle the progression of the disease and lessen the impact of the symptoms. This becomes effective in case of early detection. These treatments deal with symptoms such as cognitive decline and its psychological problems. These treatments are also used to lessen the effect of behavioral problems and ensure environmental adjustments to assist the patients in dealing with basic daily activities with less burden. Since AD can be controlled by early-stage detection, the study aims to build a model to detect AD in the initial stage of the disease.
In recent years, many researchers and academicians applied machine learning and deep learning techniques to propose a predictive model to detect Kavitha et al. proposed a machine learning-based predictive model employing a feature selection and extraction technique to predict AD with 83% accuracy of the voting classifier [13]. In this study, they used numerical survey data, which is arguably inefficient to predict since most of the symptoms of the disease are noticeable among healthy populations as well in the initial stage. Harish et al. in 2022 proposed a machine learning methodology to classify AD, where they extracted six important features [14]. Among six features, Local Binary Pattern (LBP) features performed with 75% accuracy, which is not good enough to classify such a fatal disease. Neelaveni et al. proposed a support vector machine to predict AD with 85% accuracy [15]. Sudharsan et al. proposed Regularized Extreme Learning Machine (RELM), and the ad showed that it performed better than other applied algorithms to predict AD from MRI images with 78.31% accuracy [16]. However, the obtained accuracy can be surpassed using updated and state-of-the-art technology. Park et al. proposed an RF-based predictive model to predict definite and probable AD based on administrative health data [17]. They showed 82.3% accuracy for predicting definite AD and 78.8% accuracy for probable AD. It is possible to increase the model accuracy by applying advanced state-of-the-art technology. Antor et al. conducted a study to build a predictive model to classify demented and nondemented patients using OASIS numerical data. They proposed an SVM classifier for their proposed model [18]. Grueso et al. conducted a systematic review and found that most of the researchers proposed SVM as the AD predictor [19]. The mean accuracy they found is 75.4% and the higher mean accuracy was 78.5%. The study indicates that more study needs to be conducted based on state-of-the-art technology such as deeds p learning methods.
Zhang et al. proposed a deep learning approach to predict AD using MRI images by enhancing gray matter feature information more effectively by aggregation of slice region and attention technique [20]. Their proposed model was able to classify 82.50% of cases of AD correctly and MCI. Lee et al. collected three public datasets related to genes responsible for AD [21]. They selected candidate genes from the collected dataset after collecting deferentially expressed genes (DEGs), applied five feature selection techniques to find appropriate features, and applied five machine learning classifiers to classify the AD cases. They showed that blood gene expressions are highly potential to identify AD cases. However, collecting gene samples is time-consuming and expensive for people from developing and underdeveloped countries. In this case, something cost-effective should be proposed. Ahmed et al. built an ensemble model to classify AD cases employing CNN architecture [22]. In their study, they utilized patches from three orthogonal views of selected cerebral portions to train CNN models for staging AD spectrum including preclinical AD, mild cognitive impairment due to AD, and dementia due to AD and normal controls. Three-view patches (TVPs) from the selected portions were fed to the CNN for training and found that the model gained 86.75% accuracy. Ren et al. in 2019 proposed three CNN-based frameworks to build an AD classification model, those are simple broaden plain CNNs (SBPCNNs major slice-assemble CNNs (SACNNs) a, and multi-slice CNNs (MSCNNs) [23]. Kim et al. in 2020 proposed a CNN-based method (GAP) with two gap layers, which is trained by FDG-PET/CT dataset collected from ADNI [24]. They found that their proposed model performed a 2.74% better base model of CNN.
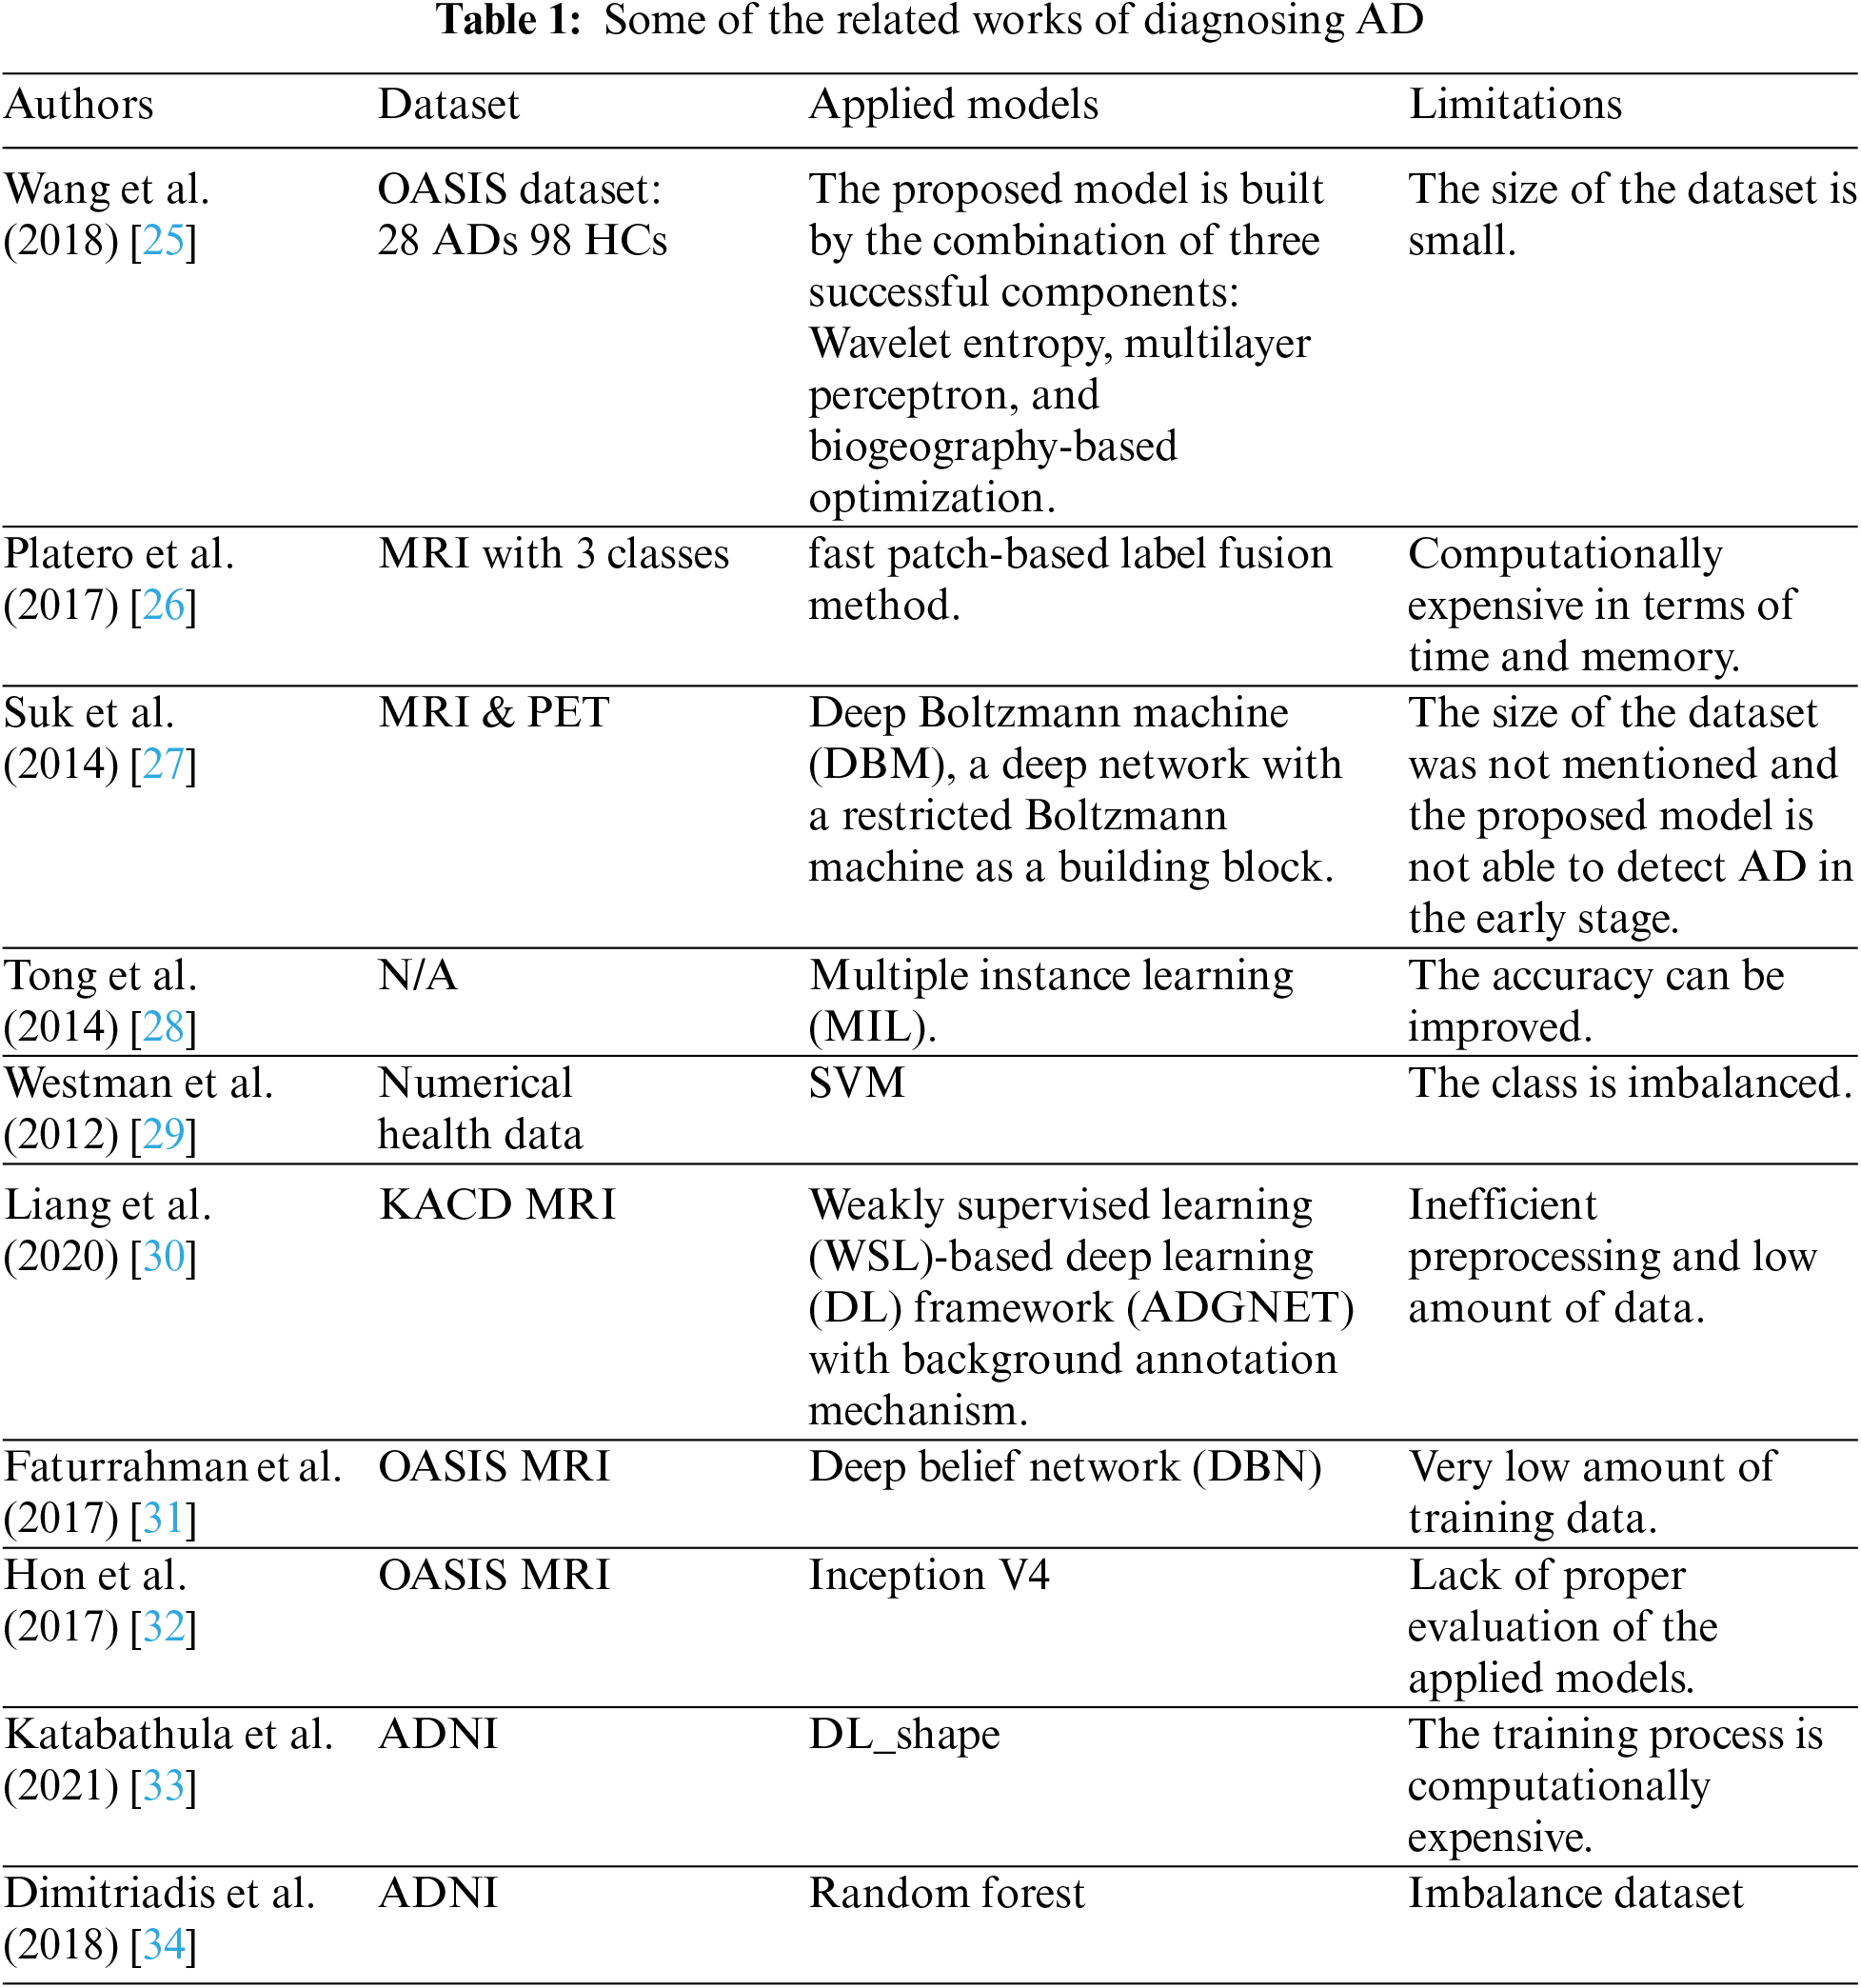
From the abovementioned discussion and Table 1, it is found that more advanced studies should be conducted to build a prediction to predict AD in an early stage with higher accuracy since it is a very sensitive disease. From that perspective, the study is designed based on machine learning and deep learning classifiers to build a predictive model that can predict AD in its early stages. Our contributions are as follows:
• First, to detect AD, we employed several efficient preprocessing techniques to allow images to accurately model analyzed by our DL model.
• Secondly, we considered oversampling data balancing method where Gaussian Smoothing Filter (GSF) was performed to produce smooth images for rapid AD identification with high accuracy.
• Finally, extracted images were fit with the three ML and two DL classifiers to evaluate the prediction performances of the model with five classes dataset. These all classifiers were filtered based on their accuracy to select the top classifier.
• The main contribution of this study is to explore the performance of a machine learning and deep learning model with a different number of classes. Based on performance, the most significant set of classes was proposed to predict AD with higher accuracy in the early stage of Alzheimer’s disease.
This research work is organized as follows: Section 2 presents the Material and Methodologies with dataset description used in these experiments. The tools and evaluation results with discussion are presented in Section 3. We present the conclusions and future direction of this work in Section 4.
In this study, Python programming language was employed in Google Collaboratory for applying all the approaches of image processing, machine learning, and deep learning. The entire flow chart of the study is mentioned in Fig. 1. The ADNI dataset is considered experimental MRI images for the binary and multi-classification for both model training and testing tasks. In the image pre-processing, we have done image resizing and converted them into bgr2rgb and then processed them into NumPy array. After that feature scaling was performed where we applied a normalization technique to the dataset. After augmentation, data balancing was considered to mitigate the imbalance ratio between majority and minority classes. Three ML and two DL well-known classifiers were trained with processed and balanced data to develop a prediction model with the best classifier as it performed better for identifying AD. The following sub-section of this part explains the necessary techniques of the proposed method.
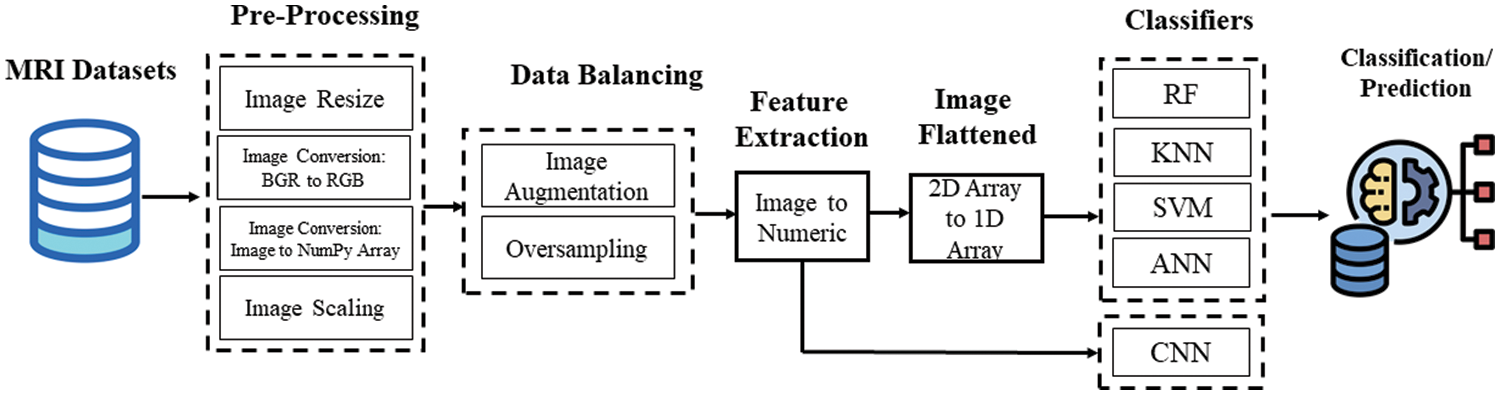
Figure 1: Pipeline of the research methodology
The dataset used in this study is derived from T1-weighted MRI images from ADNI 1 [35]. ADNI 1 is a subset of the MRI neuroimaging of the ADNI database. The original 3D images were converted to 2D images, preprocessed, and formatted into JPG images. The images are of the brain of different patients in different stages of AD. The dataset consists of five classes: Cognitive Normal (CN), Early Mild Cognitive Impairment (EMCI), Mild Cognitive Impairment (MCI), Late Mild Cognitive Impairment (LMCI), and AD (Alzheimer’s Disease). Each image is 256 × 256 pixels. In total, there are 1296 images with 171 AD images, 580 CN images, 240 EMCI images, 72 LMCI images, and 233 MCI images. The sample image of each class is mentioned in Fig. 2. Each class represents a stage of AD.
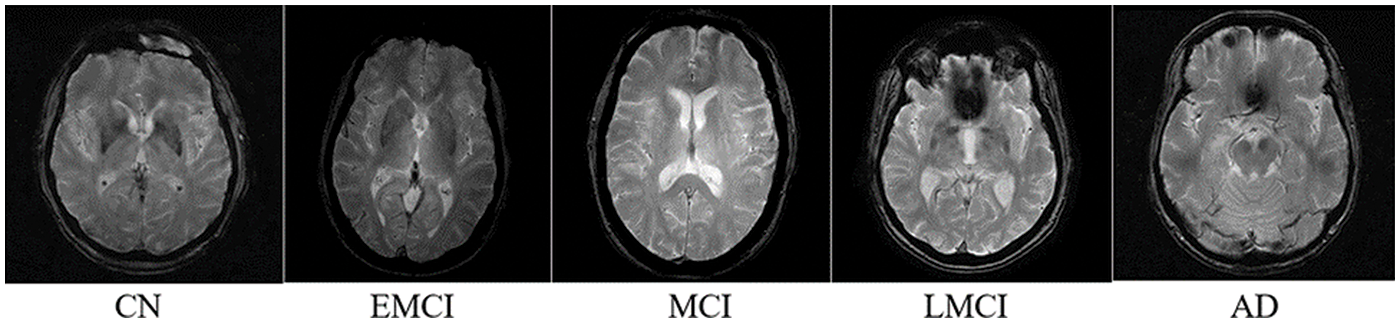
Figure 2: Sample image of each class of the dataset
The collected dataset was normalized. In the data preprocessing stage, at first, the images are converted from 3-channel RGB (Red, Green, and Blue) images to grayscale images to reduce computational expense. These are further downscaled to increase model efficiency. Then, downscaling is performed to decrease the dimension of the data and make it more feasible for the machine learning algorithm to train on. In this study, the data were downscaled and resized from 256 × 256 to 128 × 128 using OpenCV to attain this goal. The collected dataset was imbalanced. An imbalanced dataset results in poor performance of a model [36]. Consequently, the dataset is balanced using data augmentation techniques, which is a generative oversampling technique. Gaussian smoothing filter (GSF) is used to reduce noise in the image, making classification easier for training models. This noise reduction also often creates a blurry effect [36]. For this study, gaussian blur has been used to reduce noise from images using a 3 × 3-sized Gaussian smoothing kernel.
2.3 Applied Machine Learning & Deep Learning Classifiers
In this study, several machine learning algorithms were selected based on a literature review to compare their performances. Those algorithms that were mostly used in recent studies were included in this study. However, four machine learning algorithms and CNN were represented in this manuscript based on their performances.
2.3.1 K-Nearest Neighbor (KNN)
KNN is the abbreviation of K-Nearest Neighbor and is used for classification and regression. It is also known as a lazy learner algorithm because it does not instantly learn from the training set; rather, it saves the dataset on the run-time memory and then takes action on it during classification [37]. Based on the similarity, it classifies a new instance. The algorithm compares an instance’s features with previously labeled examples and calculates how close the features are [38]. The class with the least feature distance is then selected as the class of that instance. Since it often considers more than a single neighbor for classification, it is called K-NN, where k is the number of points it takes into account for classification [39]. To conduct this, the images are flattened and fed to the KNN classifier. The hyperparameters are tuned according to the applied for higher accuracy. The k value is set to 7 as higher values provide poor accuracy. For measuring the distances, Manhattan distance is used. The weights are evaluated concerning their distance from the instance, i.e., the nearest points weigh more in deciding the class. The leaf size for the resulting tree is set to 35.
Random forest is an ensemble model and builds multiple decision trees to train separately on separate datasets [38]. These datasets are generated from the original dataset using bootstrap aggregation or bagging. The created or “child datasets”, are created with randomized feature subset sampling and random oversampling of instances. This creates variety in datasets, and the many different decision trees that work with different child datasets converge and predict more accurately compared to a single decision tree that is sensitive to data changes and can show high variance. The model classifies a test instance by finding the majority class predicted by the decision trees [39]. Since a single instance can be repeated multiple times in a dataset, each dataset will not have all the instances of the parent dataset resulting in less correlation among the trees. These excluded instances are then used to calculate the error rate and identify important features to improve model accuracy further. “Out-of-bag samples” are a term used to describe the sample data that is used for testing [40] which are often one-third of the training dataset. The number of features for each child dataset as well as the number of trees to be trained is important hyperparameters to tune and better fit the model. In this study, the preprocessed and flattened images are used for training the RF classifier. In terms of hyperparameters, most of the parameters are set to default values, while the number of trees used is set to 150 while the depth of the tree is set to 25. This resulted in an overall satisfactory result.
2.3.3 Support Vector Machine (SVM)
Support vector machine (SVM) is a machine learning algorithm that works on training data instances to fit a generalized model that works well on testing instances [41]. This is done by constructing hyperplanes to divide the dataset into distinct groups. While SVM works well on linearly separable data, to tackle data that is not linearly separable, various kernels such as polynomial and radial basis function (RBF) kernels are used [42]. These kernels are used to map the data to higher dimensions and separate the instances using hyperplanes. While separating the data distribution, the hyperplane may separate the data in many ways [43]. In this study for the SVM classifier, some hyperparameters have been used as default while others have been slightly tuned. Since it is unknown whether the data distribution w be fit into the center, the interval is set to true. It is assumed that the number of examples is more than the number of features, so the dual value is set to False. By settequal
2.3.4 Convolutional Neural Network (CNN)
A convolutional neural Network (CNN) is a type of neural network that works based on a feedforward structure and is used widely in applications of Computer Vision, especially in image classification and recognition. Its biological inspiration is the complex visual processing of mammals [35]. In a CNN, the idea is to filter the images to extract meaningful features, and then the model works on the features to classify instances of images [36]. To control the convolutional layer, hyperparameters such as filter count, kernel shape, padding, and stride value in each dimension are modified to better tune the model [44]. Here, stride means how many pixels the filter will move in every convolution.
The output size of the convolution can be measured using the equation:
In the pooling layers, the dimension of the images is reduced. The maximum or average values are taken from sections of the input matrix, creating a new matrix. Maxpool takes the maximum value from a region, while avgpool takes the average value from the region. The region is the size of the pool. Often max-pooling is used as it takes the greater variant features, improving generalization performance, resulting in faster convergence and better image recognition. The architecture of the applied CNN model is illustrated in Fig. 3.
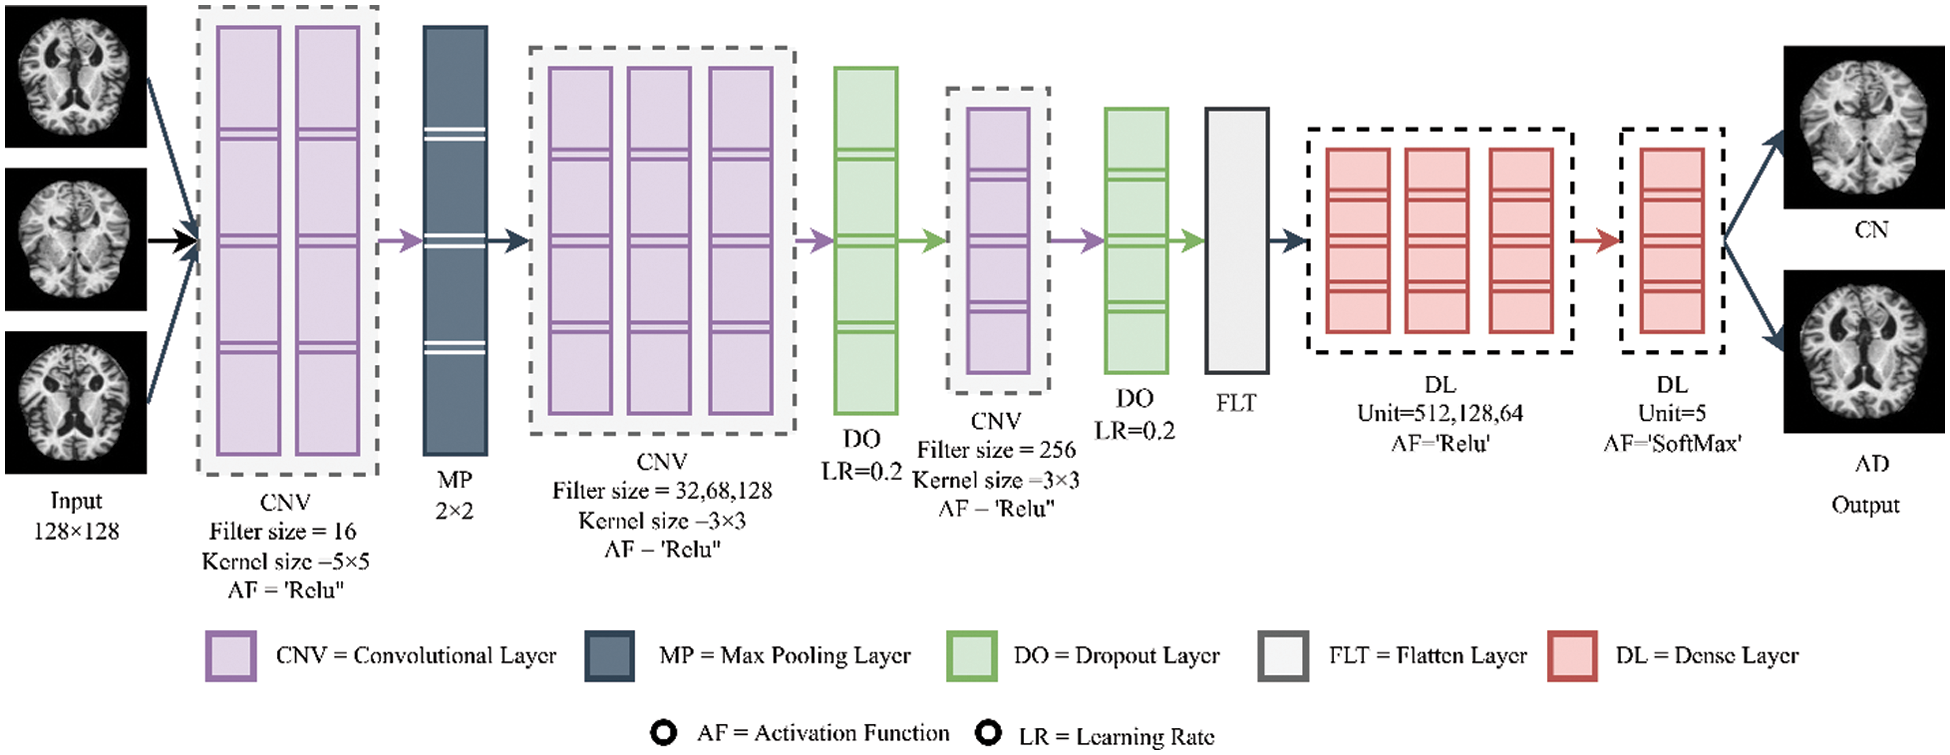
Figure 3: Building architecture of CNN
2.3.5 Artificial Neural Network (ANN)
Artificial neural networks are derived from machine learning that produces models for processing data and building effective and robust machine learning models. It is structured to mimic the complex structure of interconnecting neurons in brains [45,46]. Each unit of the network, often referred to as artificial neurons or nodes, takes inputs in the form of a real-valued number from other neurons to generate a real-valued output that can also be used as inputs for other neurons. These nodes are often structured in different layers, and nodes take input from a previous layer, process the values, and send the output to neurons of the next layer. While this process has similarities with the information transmission of neurons, there are some significant differences between biological neuron structures and artificial neural networks. ANN does not model all complex structures of brain networks, and ANN introduced methods that brain networks do not follow. ANN nodes often output a single value at a time, while brain neurons output a time series of spikes [47–49].
2.4 Performance Evaluation Metrics
It is a very crucial task to evaluate a model for a specific dataset based on its performance. This study calculated different evaluation metrics such as accuracy, accuracy, precision, and recall. All of these metrics’ values are estimated based on the following equations [39,40].
Here,
Python programming language (Version 3.8.5) was employed to carry out this study. Five different machine learning and deep learning algorithms were applied to the dataset. The dataset was prepared for 5 classes, three classes, and binary class classification. For comparing the performance of all the applied classifiers according to three different class labels, accuracy, precision, and recall were considered, and the result of the study is represented in this section.
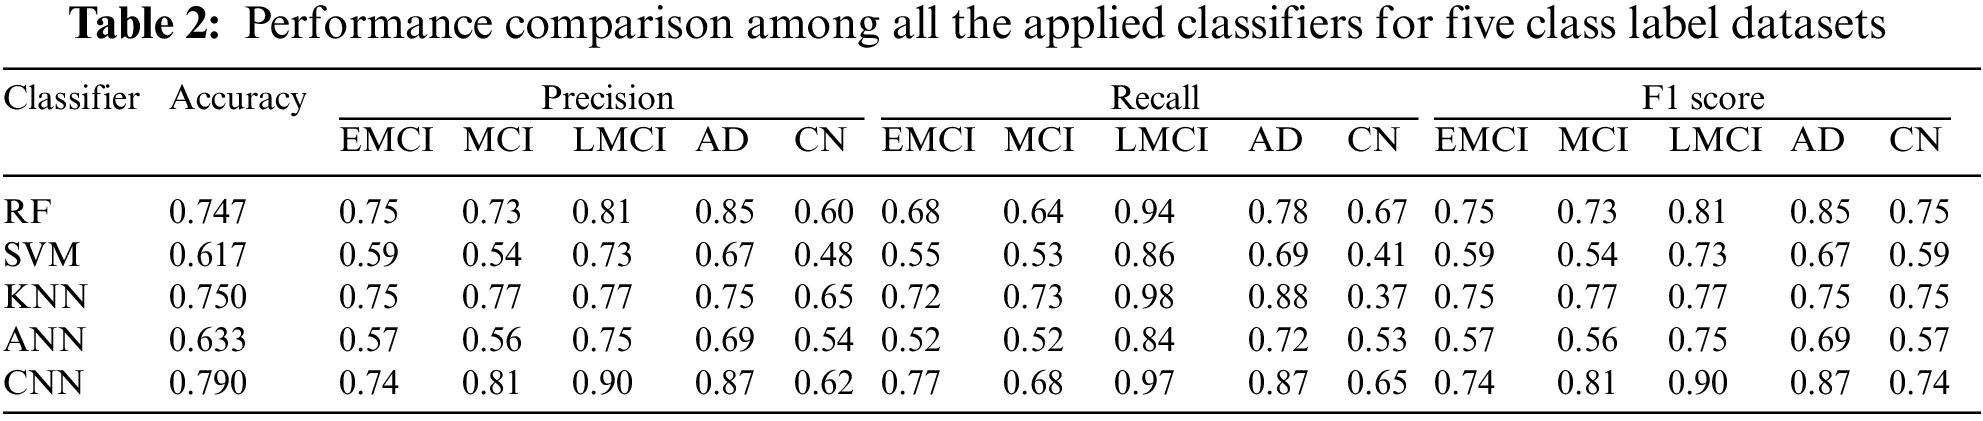
3.1 Performance of Five Class Labels
According to Table 2, CNN has generated the highest accuracy. However, for classifying instances as EMCI, KNN, and RF have the best precision value of 0.75, and CNN has the best recall value of 0.77. For classifying MCI, CNN has the highest precision value of 0.81, and KNN has the best recall value of 0.73. For classifying LMCI, CNN has the best precision value of 0.90, while KNN has the best recall value of 0.98. While classifying AD, CNN has the best precision value of 0.87, while KNN has the best recall value of 0.88. To classify CN, KNN has the best precision value of 0.65, while RF has the best recall value of 0.67. Overall, comparing all the parameters, it is found that CNN outperformed for 5 five class label classifications compared to other applied classifiers.
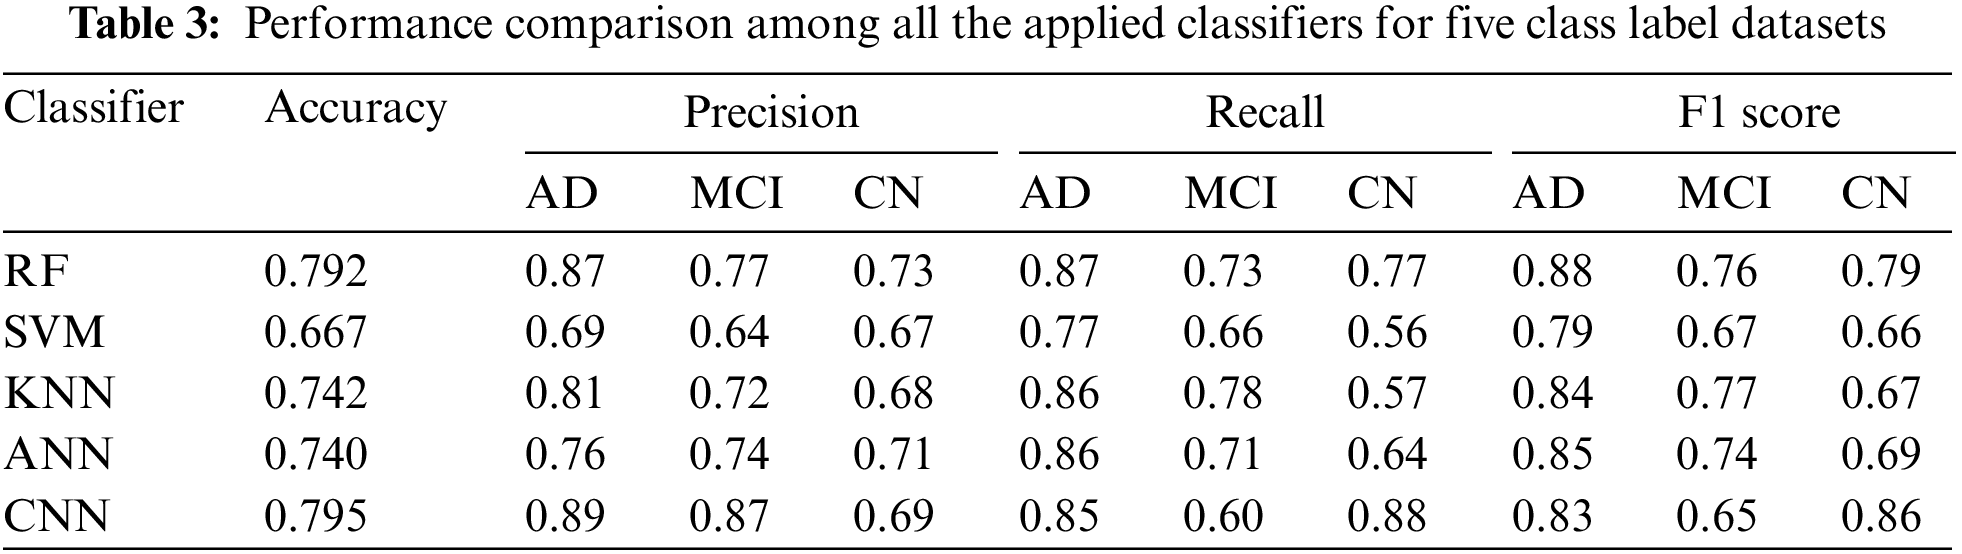
3.2 Performance of Three Class Labels
Table 3 demonstrates that CNN gained the highest accuracy. For AD, CNN has the highest precision (0.89) while RF has the highest recall (0.87). So, CNN can be used for scenarios where the false positive rate is more important than the false negative rate for AD. Similarly, RF can be used in scenarios where the false negative rate is more important than the false positive rate of AD. For MCI, CNN has the highest precision (0.87) and KNN has the highest recall (0.78). For CN, RF has the highest precision (0.87), while CNN has the highest recall (0.88). For three class classifications, CNN produced the highest performance.
3.3 Performance of Binary Class Levels
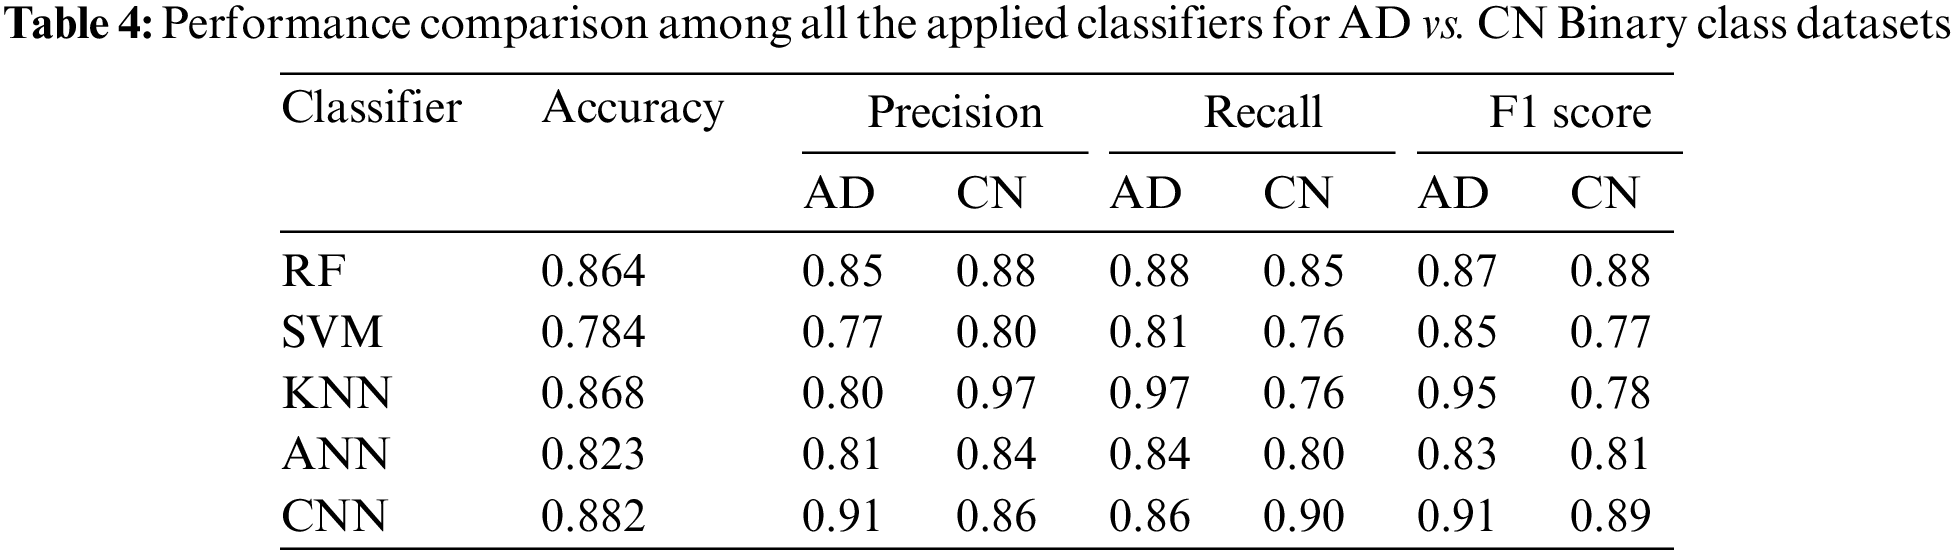
3.3.1 Performance Analysis of AD vs. CN
As represented in Table 4, CNN has the best classification accuracy of 88.2% for binary classification. For AD, CNN has the highest precision value (0.91) while KNN has the highest recall value (0.97). For CN, KNN has the highest precision value (0.97) while CNN has the highest recall value (90). This means that for cases that deal with a low false positive rate and high false negative rate as well as cases that deal with a high false positive rate and low false negative rate, both KNN and CNN can be used. Which method to use depends on the focus of the problem and on the target class for which the problem exists (AD/CN).
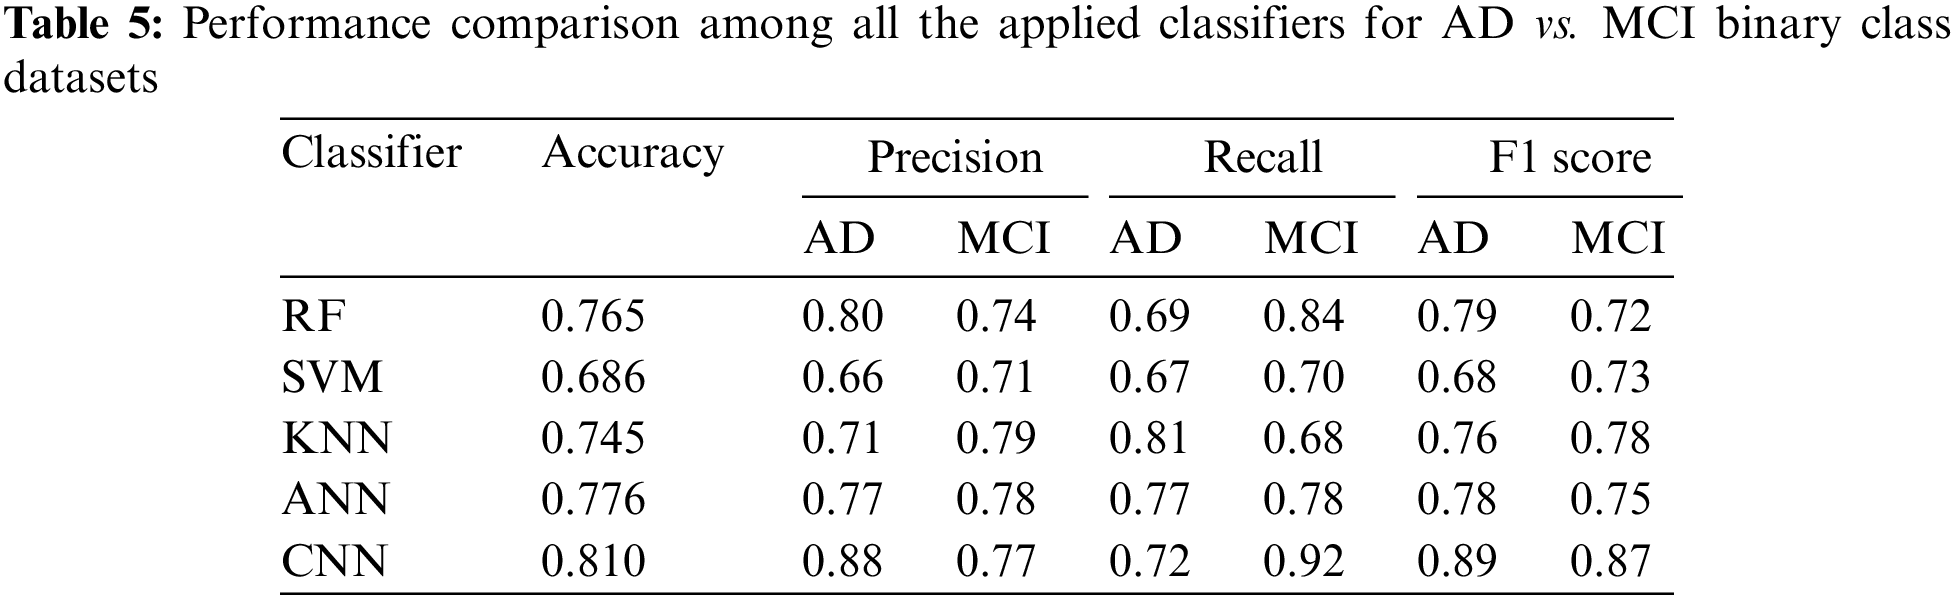
3.3.2 Performance Analysis of AD vs. MCI
According to the performance result of AD vs. MCI represented in Table 5, CNN gained the best accuracy, which is 0.810 in value. SVM’s performance was not satisfactory in diagnosing AD. For MCI, KNN provides the highest precision (0.79) and CNN provides the highest recall (0.90). For AD, CNN scores the highest in precision (0.88) and KNN scores the highest in recall (0.81).
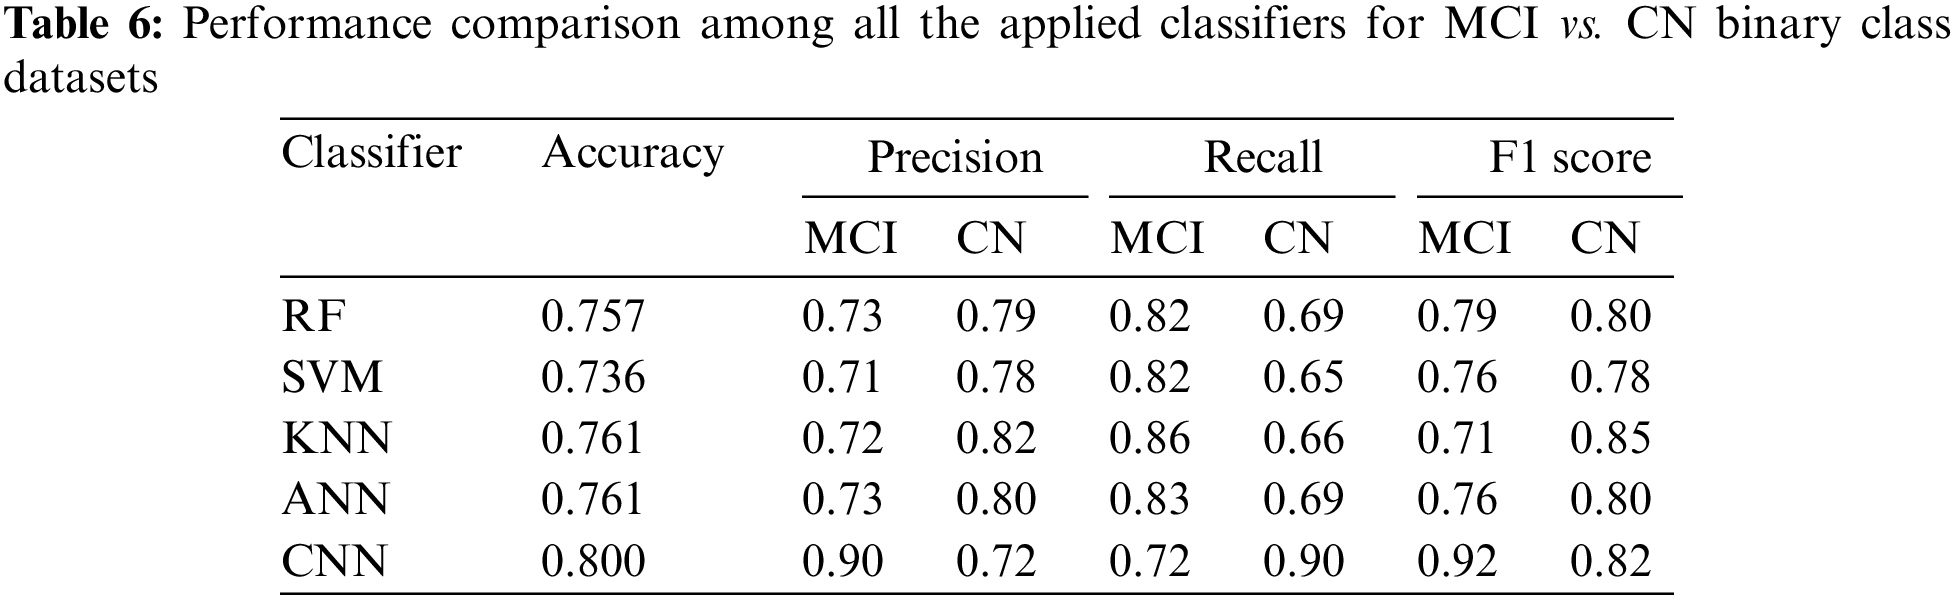
3.3.3 Performance Analysis of MCI vs. CN
Table 6 demonstrates that CNN provided lead accuracy (0.800). For MCI, CNN scored the highest precision value (0.90) while KNN scored the highest recall value (0.86). For CN, KNN scored the highest precision value (0.82) and CNN scored the highest recall value (0.90). This result continues the pattern of the binary classifications that if CNN is good in one matric, then KNN will be better in the other matric. This means for the three classes AD, MCI, and CN, for each binary classification combination, KNN, and CNN can be used to deal with needs that either require good precision or recall.
In terms of the binary classification dataset, it is found from Fig. 4A that the AD vs. CN dataset is more efficient compared to other datasets such as AD vs. MCI and MCI vs. CN. It can be claimed from the findings that AD vs. CN dataset is enough to build a predictive model to detect AD cases. Besides, Fig. 4B represents the performance of all the applied classifiers for all the binary datasets and found that CNN outperformed all the datasets.
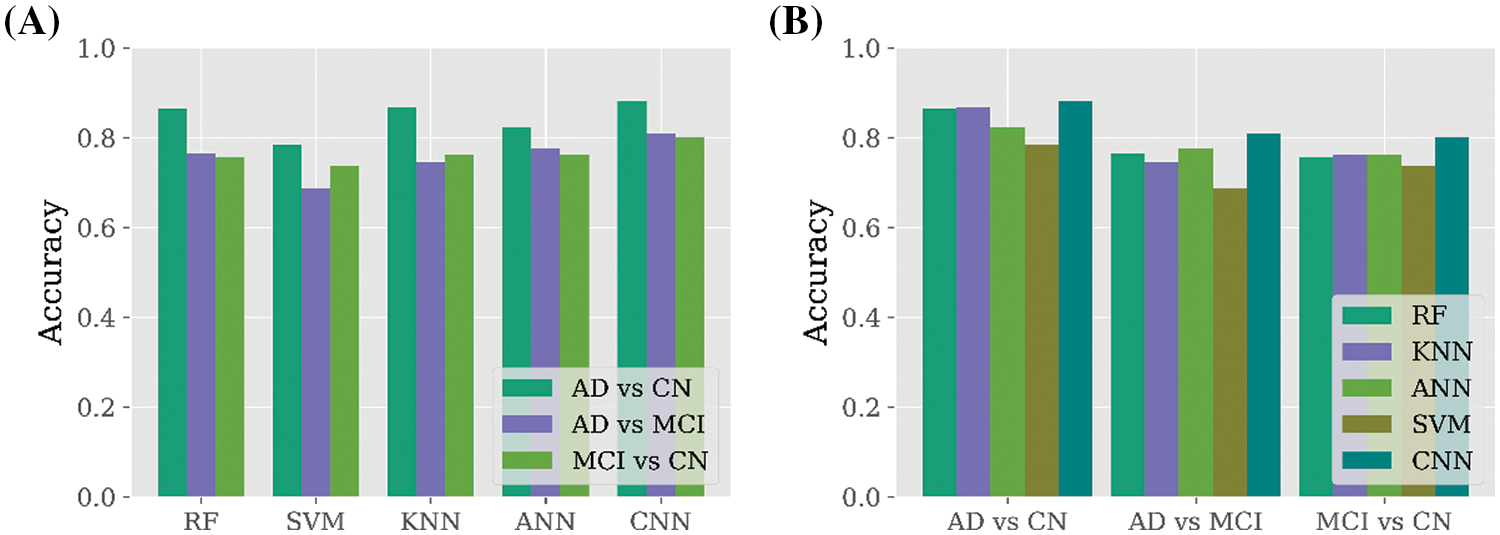
Figure 4: Performance comparison among all binary class datasets. (A) Performance comparison among three binary class datasets for all the applied classifiers. (B) Performance comparison among all the classifiers for each binary class dataset
3.4 Overall Performance Analysis
After analyzing all the study results, the overall findings are summarized in Fig. 5. According to Fig. 5A, it is visible that the binary class dataset is performing well compared to three-class and five-class datasets in all the applied classifiers. While the performance of all the applied classifiers is considered according to the number of class labels, it is found that SVM performed comparatively low among all the applied classifiers. However, CNN performed significantly better for all types of data, which is represented in Fig. 5B. While overall performance is considered, it is found that CNN is the best classifier for binary class datasets to predict AD in the early stage.
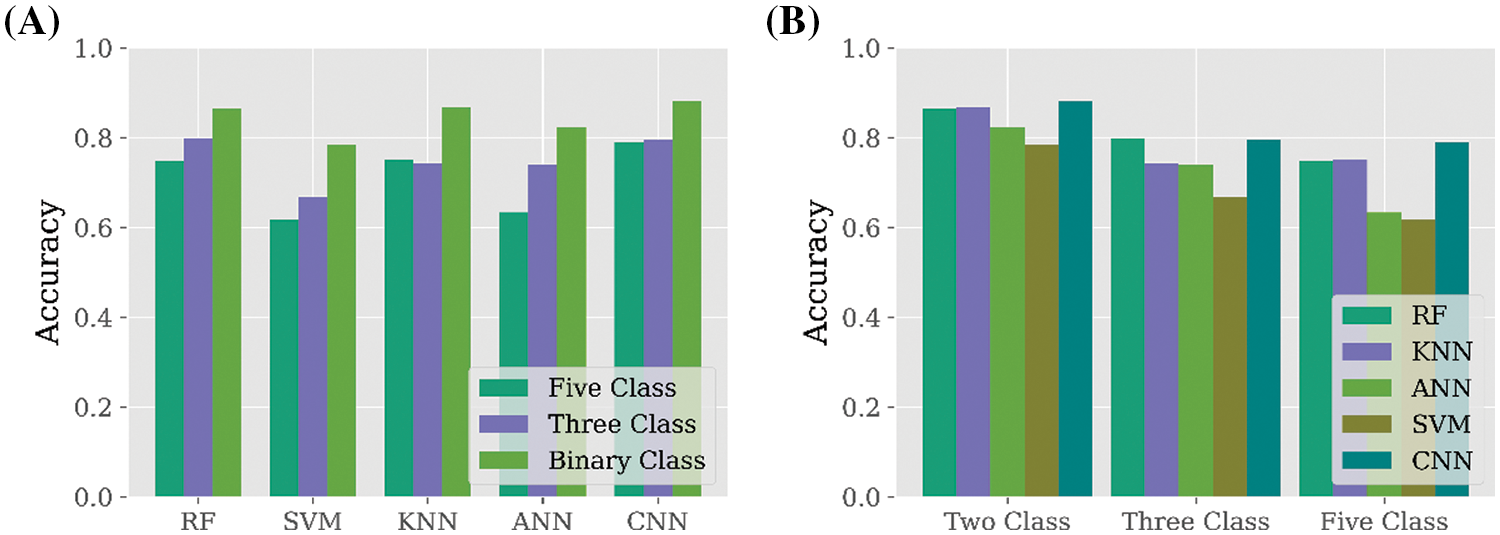
Figure 5: Overall performance of all the applied classifiers. (A) Performance comparison among binary class, three class, and five class for each applied classifier. (B) Performance comparison among all the applied classifiers for all class label datasets
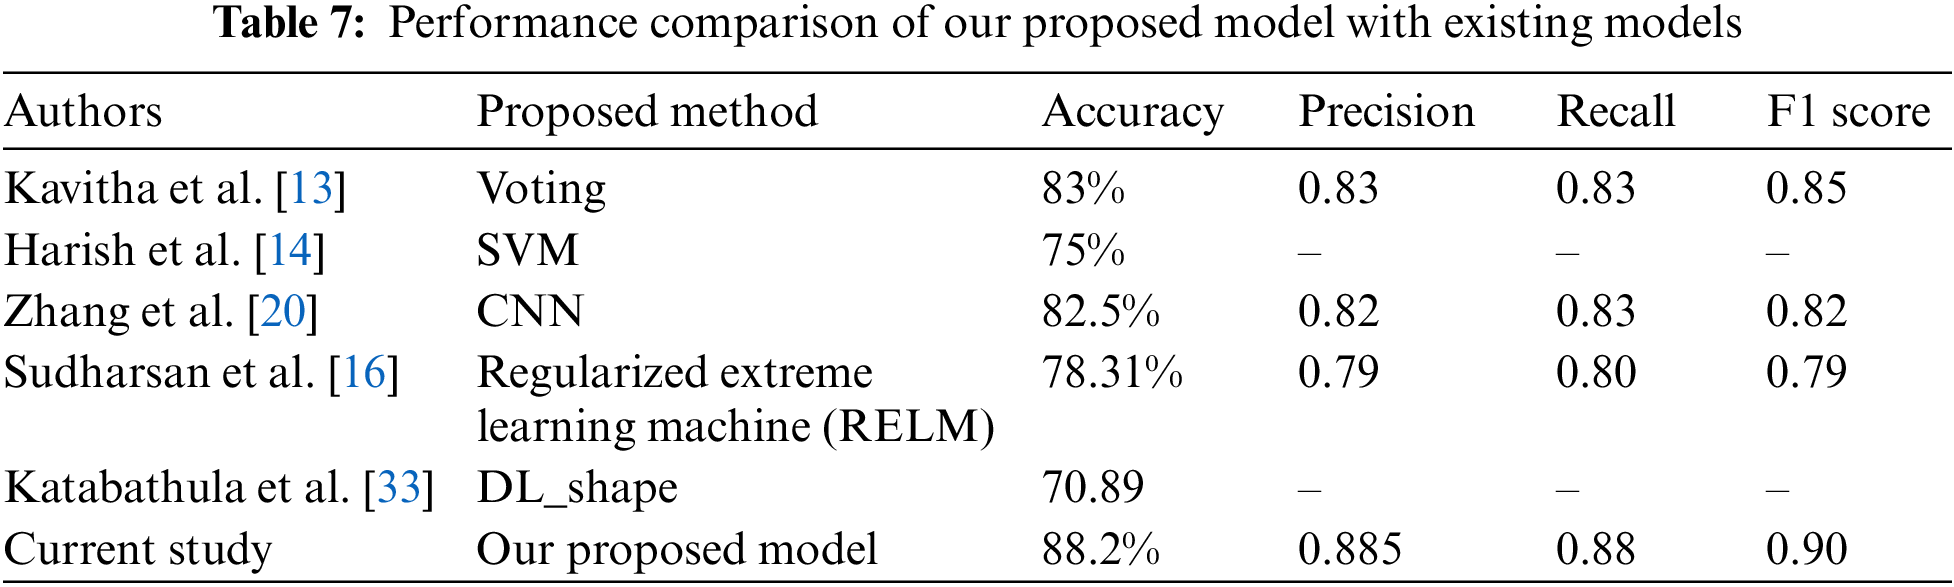
In this study, having gathered an AD dataset derived from T1-weighted MRI images from ADNI 1, the preprocessing is performed to make the prepared for machine learning and deep learning classifiers. The dataset contained three different types of datasets: five class labels, three class labels, and binary class labels. In preprocessing steps, image normalization and downscale techniques are performed to prepare the data, and a data augmentation technique is used to balance the class label since it was imbalanced. Thereafter, the smoothening technique is applied to remove noise and unnecessary points from the images. After removing the noises and preparing the data, feature extractions are performed to fit the dataset for machine learning classifiers such as RF, KNN, and SVM. Deep learning techniques such as CNN and ANN are also applied. The performances of the applied classifiers are compared based on accuracy, precision, and recall. After analyzing all the performances, it is found that the binary class dataset outperforms with CNN classifier compared to other classifiers with 88.20% accuracy. The overall findings and performances of all the applied classifiers indicate that the proposed model is a potential solution to predict AD in the early stage with significant accuracy. The performance of our proposed model has been compared with some other recent proposed models and is represented in Table 7.
Alzheimer’s disease (AD) is a growing concern in recent years worldwide, and it should be a quick treatment for recovery. However, quick treatment needs to detect AD in the early stage. From that perspective, the study applied five state-of-the-art deep learning and machine learning models on an AD dataset and found that SVM gained the least accuracy for all the collected datasets. In contrast, CNN outperformed all types of datasets. In this research work, we performed various image preprocessing techniques with an augmentation process to identify AD efficiently. It integrates a random oversampling technique to handle the imbalance problem from target classes, mitigating the model overfitting and biases. Different ML and DL classifiers were considered for the prediction tasks. Overall, the CNN model outperformed for binary class AD dataset with 88.20% accuracy. So, overall findings indicate that it is a highly potential model to predict early-stage AD. The study will enable physicians, doctors, and clinicians to provide better treatment through early-stage AD detection. The number of images in this study was poor, which will be overcome in the future by gathering the latest and quality images.
Acknowledgement: The authors extend their appreciation to the Deputyship for Research & Innovation, Ministry of Education in Saudi Arabia for funding this research work.
Funding Statement: This research work was funded in part by the Natural Sciences and Engineering Research Council of Canada (NSERC) through Project Number: IFP22UQU4170008DSR0056.
Author Contributions: Study conception and design: SMH Mahmud, K Ahmed; data collection: MM Ali, MF Shahriar; analysis and interpretation of results: SMH Mahmud, MM Ali, MF Shahriar, K Ahmed, FM Bui; draft manuscript preparation: SMH Mahmud, MM Ali, MF Shahriar, FA Al-Zahrani, K Ahmed, D Nandi, FM Bui. All authors reviewed the results and approved the final version of the manuscript.
Availability of Data and Materials: Data available on request from the authors. The data that support the findings of this study are available from the corresponding author, K. Ahmed and S M Hasan Mahmud, upon reasonable request.
Conflicts of Interest: The authors declare that they have no conflicts of interest to report regarding the present study.
References
1. Earlier Diagnosis. 2021. [Online]. Available: https://www.alz.org/alzheimers-dementia/research_progress/earlier-diagnosis [Google Scholar]
2. C. Lyketsos, M. Carrillo, J. Ryan, A. Khachaturian, P. Trzepacz et al., “Neuropsychiatric symptoms in Alzheimer’s disease,” Alzheimer’s & Dementia, vol. 7, no. 5, pp. 532–539, 2011. [Google Scholar]
3. P. Tiraboschi, L. A. Hansen, L. J. Thal and J. Corey-Bloom, “The importance of neuritic plaques and tangles to the development and evolution of AD,” Neurology, vol. 62, no. 11, pp. 1984–1989, 2004. [Google Scholar] [PubMed]
4. C. R. Jack, D. S. Knopman, W. J. Jagust, R. C. Petersen, M. W. Weiner et al., “Tracking pathophysiological processes in Alzheimer’s disease: An updated hypotheticcal model of dynamic biomarkers,” The Lancet Neurology, vol. 12, no. 2, pp. 207–216, 2013. [Google Scholar] [PubMed]
5. Alzheimer’s Association. 2021. [Online]. Available: https://www.alz.org/alzheimers-dementia/what-is-alzheimers/causes-and-risk-factors/genetics [Google Scholar]
6. ADNI, Study Design. 2021. [Online]. Available: http://adni.loni.usc.edu/study-design/#background-container [Google Scholar]
7. M. S. Albert, S. T. DeKosky, D. Dickson, B. Dubois, H. H. FeldmanFox et al., “The diagnosis of mild cognitive impairment due to Alzheimer’s disease: Recommendations from the national institute on aging-Alzheimer’s association workgroups on diagnostic guidelines for Alzheimer’s disease,” Alzheimer’s and Dementia, vol. 7, no. 3, pp. 270–279, 2011. [Google Scholar] [PubMed]
8. E. W. Radue, M. Weigel, R. Wiest and H. Urbach, “Introduction to magnetic resonance imaging for neurologists,” Continuum: Lifelong Learning in Neurology, vol. 22, no. 5, pp. 1379–1398, 2016. [Google Scholar] [PubMed]
9. M. W. Bondi, E. C. Edmonds and D. P. Salmon, “Alzheimer’s disease: Past, present, and future,” Journal of the International Neuropsychological Society, vol. 23, no. 9–10, pp. 818–831, 2017. [Google Scholar] [PubMed]
10. M. W. Weiner, D. P. Veitch, P. S. Aisen, L. A. Beckett, N. J. Cairns et al., “The Alzheimer’s disease neuroimaging initiative: A review of papers published since its inception,” Alzheimer’s and Dementia,vol. 9, no. 5, pp. e111–e194, 2013. [Google Scholar] [PubMed]
11. J. C. Morris, M. Storandt, D. W. McKeel, E. H. Rubin, J. L. Price et al., “Cerebral amyloid deposition and diffuse plaques in “normal” aging: Evidence for presymptomatic and very mild Alzheimer’s disease,” Neurology, vol. 46, no. 3, pp. 707–719, 1996. [Google Scholar] [PubMed]
12. L. Berg, D. W. McKeel, J. P. Miller, J. Baty and J. C. Morris, “Neuropathological indexes of Alzheimer’s disease in demented and nondemented persons aged 80 years and older,” Archives of Neurology, vol. 50, no. 4, pp. 349–358, 1993. [Google Scholar] [PubMed]
13. C. Kavitha, V. Mani, S. R. Srividhya, O. I. Khalaf and C. A. T. Romero, “Early-stage Alzheimer’s disease prediction using machine learning models,” Frontiers in Public Health, vol. 10, pp. 240, 2022. [Google Scholar]
14. M. V. Harish, C. Dinesh, S. Sasikala and A. Kumar, “Alzheimer’s disease prediction using machine learning methodologies,” in 2022 Int. Conf. on Computer Communication and Informatics, Coimbatore, India, pp. 1–6, 2022. [Google Scholar]
15. J. Neelaveni and M. G. Devasana, “Alzheimer disease prediction using machine learning algorithms,” in 2020 6th Int. Conf. on Advanced Computing and Communication Systems, Coimbatore, India, pp. 101–104, 2020. [Google Scholar]
16. M. Sudharsan and G. Thailambal, “Alzheimer’s disease prediction using machine learning techniques and principal component analysis (PCA),” Materials Today: Proceedings, vol. 1, no. 1, pp. 1–9, 2021. [Google Scholar]
17. J. H. Park, J. H. ChoKim, M. M. Wall, Y. Stern, H. Lim et al., “Machine learning prediction of incidence of Alzheimer’s disease using large-scale administrative health data,” NPJ Digital Medicine, vol. 3, no. 1, pp. 1–7, 2020. [Google Scholar]
18. M. B. Antor, A. H. M. Jamil, M. Mamtaz, M. M. Khan, S. Aljahdali et al., “A comparative analysis of machine learning algorithms to predict Alzheimer’s disease,” Journal of Healthcare Engineering, vol. 2021, no. 1, pp. 1–12, 2021. [Google Scholar]
19. S. Grueso and R. Viejo-Sobera, “Machine learning methods for predicting progression from mild cognitive impairment to Alzheimer’s disease dementia: A systematic review,” Alzheimer’s Research and Therapy,vol. 13, no. 1, pp. 1–29, 2021. [Google Scholar]
20. Y. Zhang, Q. Teng, Y. Liu, Y. Liu and X. He, “Diagnosis of Alzheimer’s disease based on regional attention with sMRI gray matter slices,” Journal of Neuroscience Methods, vol. 365, pp. 109376, 2022. [Google Scholar] [PubMed]
21. T. Lee and H. Lee, “Prediction of Alzheimer’s disease using blood gene expression data,” Scientific Reports, vol. 10, no. 1, pp. 1–13, 2020. [Google Scholar]
22. S. Ahmed, B. C. Kim, K. H. Lee and H. Y. Jung, “Ensemble of ROI-based convolutional neural network classifiers for staging the Alzheimer disease spectrum from magnetic resonance imaging,” PLoS One, vol. 15, no. 12, pp. e0242712, 2020. [Google Scholar] [PubMed]
23. F. Ren, C. Yang, Q. Qiu, N. Zeng, C. Cai et al., “Exploiting discriminative regions of brain slices based on 2D CNNs for Alzheimer’s disease classification,” IEEE Access, vol. 7, pp. 181423–181433, 2019. [Google Scholar]
24. H. W. Kim, H. E. Lee, K. Oh, S. Lee, M. Yun et al., “Multi-slice representational learning of convolutional neural network for Alzheimer’s disease classification using positron emission tomography,” BioMedical Engineering OnLine, vol. 19, no. 1, pp. 1–15, 2020. [Google Scholar]
25. S. H. Wang, Y. Zhang, Y. J. Li, W. J. Jia, F. Y. Liu et al., “Single slice based detection for Alzheimer’s disease via wavelet entropy and multilayer perceptron trained by biogeography-based optimization,” Multimedia Tools and Applications, vol. 77, no. 9, pp. 10393–10417, 2018. [Google Scholar]
26. C. Platero and M. C. Tobar, “Combining a patch-based approach with a non-rigid registration-based label fusion method for the hippocampal segmentation in Alzheimer’s disease,” Neuroinformatics, vol. 15, no. 2, pp. 165–183, 2017. [Google Scholar] [PubMed]
27. H. I. Suk, S. W. Lee and D. Shen, “Hierarchical feature representation and multimodal fusion with deep learning for AD/MCI diagnosis,” NeuroImage, vol. 101, pp. 569–582, 2014. [Google Scholar] [PubMed]
28. T. Tong, R. Wolz, Q. Gao, R. Guerrero, J. V. Hajnal et al., “Multiple instance learning for classification of dementia in brain MRI,” Medical Image Analysis, vol. 18, no. 5, pp. 808–818, 2014. [Google Scholar] [PubMed]
29. E. Westman, J. S. Muehlboeck and A. Simmons, “Combining MRI and CSF measures for classification of Alzheimer’s disease and prediction of mild cognitive impairment conversion,” Neuroimage, vol. 62, no. 1, pp. 229–238, 2012. [Google Scholar] [PubMed]
30. S. Liang and Y. Gu, “Computer-aided diagnosis of Alzheimer’s disease through weak supervision deep learning framework with attention mechanism,” Sensors, vol. 21, no. 1, pp. 220, 2020. [Google Scholar] [PubMed]
31. M. Faturrahman, I. Wasito, N. Hanifah and R. Mufidah, “Structural MRI classification for Alzheimer’s disease detection using deep belief network,” in 2017 11th Int. Conf. on Information & Communication Technology and System, Surabaya, Indonesia, pp. 37–42, 2017. [Google Scholar]
32. M. Hon and N. M. Khan, “Towards Alzheimer’s disease classification through transfer learning,” in 2017 IEEE Int. Conf. on Bioinformatics and Biomedicine, Kansas City, MO, USA, pp. 1166–1169, 2017. [Google Scholar]
33. S. Katabathula, Q. Wang and R. Xu, “Predict Alzheimer’s disease using hippocampus MRI data: A lightweight 3D deep convolutional network model with visual and global shape representations,” Alzheimer’s Research & Therapy, vol. 13, no. 1, pp. 1–9, 2021. [Google Scholar]
34. S. I. Dimitriadis, L. Dimitris and N. T. Magda, “Random forest feature selection, fusion and ensemble strategy: Combining multiple morphological MRI measures to discriminate among healhy elderly, MCI, cMCI and Alzheimer’s disease patients: From the Alzheimer’s disease neuroimaging initiative (ADNI) database,” Journal of Neuroscience Methods, vol. 302, pp. 14–23, 2018. [Google Scholar] [PubMed]
35. Alzheimer’s Data, 2017. [Online]. Available: https://adni.loni.usc.edu/data-samples/access-data/ [Google Scholar]
36. N. Faruqui, M. A. Yousuf, M. Whaiduzzaman, A. K. M. Azad, A. Barros et al., “LungNet: A hybrid deep-CNN model for lung cancer diagnosis using CT and wearable sensor-based medical IoT data,” Computers in Biology and Medicine, vol. 139, pp. 104961, 2021. [Google Scholar] [PubMed]
37. N. F. Aurna, M. A. Yousuf, K. A. Taher, A. K. M. Azad and M. A. Moni, “A classification of MRI brain tumor based on two stage feature level ensemble of deep CNN models,” Computers in Biology and Medicine, vol. 146, pp. 105539, 2022. [Google Scholar] [PubMed]
38. S. Uddin, L. Haque, H. Lu, M. A. Moni and E. Gide, “Comparative performance analysis of K-nearest neighbour (KNN) algorithm and its different variants for disease prediction,” Scientific Reports, vol. 12, no. 1, pp. 1–11, 2022. [Google Scholar]
39. M. M. Ali, B. K. Paul, K. Ahmed, F. M. Bui, J. M. Quinn et al., “Heart disease prediction using supervised machine learning algorithms: Performance analysis and comparison,” Computers in Biology and Medicine, vol. 136, pp. 104672, 2021. [Google Scholar] [PubMed]
40. M. M. Ali, K. Ahmed, F. M. Bui, B. K. Paul, S. M. Ibrahim et al., “Machine learning-based statistical analysis for early stage detection of cervical cancer,” Computers in Biology and Medicine, vol. 139, pp. 104985, 2021. [Google Scholar] [PubMed]
41. B. S. Yang, X. Di and T. Han, “Random forests classifier for machine fault diagnosis,” Journal of Mechanical Science and Technology, vol. 22, no. 9, pp. 1716–1725, 2008. [Google Scholar]
42. W. S. Noble, “What is a support vector machine?” Nature Biotechnology, vol. 24, no. 12, pp. 1565–1567, 2006. [Google Scholar] [PubMed]
43. Y. Zhang, “Support vector machine classification algorithm and its application,” in Int. Conf. on Information Computing and Applications, Berlin, Germany, pp. 179–186, 2012. [Google Scholar]
44. C. Aroef, Y. Rivan and Z. Rustam, “Comparing random forest and support vector machines for breast cancer classification,” Telkomnika (Telecommunication Computing Electronics and Control), vol. 18, no. 2, pp. 815–821, 2020. [Google Scholar]
45. T. Kattenborn, J. Leitloff, F. Schieferand and S. Hinz, “Review on convolutional neural networks (CNN) in vegetation remote sensing,” ISPRS Journal of Photogrammetry and Remote Sensing, vol. 173, pp. 24–49, 2021. [Google Scholar]
46. S. Agatonovic-Kustrin and R. Beresford, “Basic concepts of artificial neural network (ANN) modeling and its application in pharmaceutical research,” Journal of Pharmaceutical and Biomedical Analysis, vol. 22,no. 5, pp. 717–727, 2000. [Google Scholar] [PubMed]
47. G. G. Wang, M. Lu, Y. Q. Dong and X. J. Zhao, “Self-adaptive extreme learning machine,” Neural Computing and Applications, vol. 27, no. 1, pp. 291–303, 2016. [Google Scholar]
48. Y. Wang, X. Qiao and G. G. Wang, “Architecture evolution of convolutional neural network using monarch butterfly optimization,” Journal of Ambient Intelligence and Humanized Computing, vol. 1, no. 1, pp. 1–15, 2022. [Google Scholar]
49. Z. Cui, F. Xue, X. Cai, Y. Cao, G. G. Wang et al., “Detection of malicious code variants based on deep learning,” IEEE Transactions on Industrial Informatics, vol. 14, no. 7, pp. 3187–3196, 2018. [Google Scholar]
Cite This Article
 Copyright © 2023 The Author(s). Published by Tech Science Press.
This work is licensed under a Creative Commons Attribution 4.0 International License , which permits unrestricted use, distribution, and reproduction in any medium, provided the original work is properly cited.
 Downloads
 Citation Tools