
 Submit a Paper
 Propose a Special lssue
 Open Access
ARTICLE

Explainable Conformer Network for Detection of COVID-19 Pneumonia from Chest CT Scan: From Concepts toward Clinical Explainability
1 Faculty of Computers and Informatics, Zagazig University, Zagazig, 44519, Egypt
2 Department of Computational Mathematics, Science, and Engineering (CMSE), Michigan State University, East Lansing, MI, 48824, USA
3 Department of Mathematics, Faculty of Science, Mansoura University, Mansoura, 35516, Egypt
4 Department of Statistics and Operations Research, College of Science, King Saud University, P.O. Box 2455, Riyadh, 11451, Saudi Arabia
* Corresponding Author: Mohamed Abouhawwash. Email:
Computers, Materials & Continua 2024, 78(1), 1171-1187. https://doi.org/10.32604/cmc.2023.044425
Received 30 July 2023; Accepted 29 November 2023; Issue published 30 January 2024
 View Full Text
 Download PDF
Abstract
The early implementation of treatment therapies necessitates the swift and precise identification of COVID-19 pneumonia by the analysis of chest CT scans. This study aims to investigate the indispensable need for precise and interpretable diagnostic tools for improving clinical decision-making for COVID-19 diagnosis. This paper proposes a novel deep learning approach, called Conformer Network, for explainable discrimination of viral pneumonia depending on the lung Region of Infections (ROI) within a single modality radiographic CT scan. Firstly, an efficient U-shaped transformer network is integrated for lung image segmentation. Then, a robust transfer learning technique is introduced to design a robust feature extractor based on pre-trained lightweight Big Transfer (BiT-L) and finetuned on medical data to effectively learn the patterns of infection in the input image. Secondly, this work presents a visual explanation method to guarantee clinical explainability for decisions made by Conformer Network. Experimental evaluation of real-world CT data demonstrated that the diagnostic accuracy of our model outperforms cutting-edge studies with statistical significance. The Conformer Network achieves 97.40% of detection accuracy under cross-validation settings. Our model not only achieves high sensitivity and specificity but also affords visualizations of salient features contributing to each classification decision, enhancing the overall transparency and trustworthiness of our model. The findings provide obvious implications for the ability of our model to empower clinical staff by generating transparent intuitions about the features driving diagnostic decisions.Keywords
Recently, new species of the Coronaviridae recognized as “severe acute respiratory syndrome coronavirus 2 (SARS-CoV-2)”, have spread throughout the human population and been identified as a non-partitioned positive-strand ribonucleic acid (RNA) [1]. Over the past few decades, two beta-coronaviruses have caused widespread devastation: Middle East respiratory syndrome coronavirus (MERS-CoV) and severe acute respiratory syndrome coronavirus (SARS-CoV). Possible further zoonotic impacts of coronaviruses, beyond those, presently recognized, lie just beneath the surface. Therefore, early detection of infected individuals is crucial for the implementation of preventative containment measures and medical treatment processes [2–4].
Virus nucleic acid sequencing and Reverse-transcription-polymerase (RT-PCR) are used in clinical laboratories, but these methods have many limitations and drawbacks. For instance, nucleic acid checks rely on several rate-limiting factors, such as the availability and size of testing equipment in the targeted regions [5]. Even more importantly, there is debate about whether or not the testing equipment is superior, consistent, and reproducible [6]. Radiological imaging methods, including a chest X-ray, are widely used in the diagnosis of COVID-19 [7,8]. Characteristic Ground Glass Opacities (GGOs) in X-rays of COVID-19 lung tissue reveal partial filling of Alveoli by fluid rather than the usual black color of air [9]. Although unique CT scans could aid in the early investigation of possible COVID-19 cases, the pictures produced by several viral kinds of pneumonia are nearly comparable, which can lead to confusion with other infectious and deadly lung diseases [10,11]. As a result, radiologists have a hard time telling COVID-19 from other viral causes of pneumonia [12].
Different viral pathogens require various pathogenesis characteristics to be detected through diagnostic imaging representation. Ground Glass Opacities (GGOs) and bilateral allocation of irregular shadows are considered the most prominent features of viral pneumonia [13]. Therefore, recent advancements in deep learning techniques for medical imaging have demonstrated superior capabilities for fusing different image features, including spatial and surface relation features. In particular, Convolutional Neural Networks (CNNs) and Vision Transformers (ViTs) have shown significant improvements in various medical imaging tasks, such as identifying podiatric pneumonia and detecting pulmonary nodules [14–16]. However, determining the discriminant features of viral pneumonia remains an open challenge that is yet to be fully addressed. Motivated by that, this study contributes to the body of knowledge by proposing a novel multi-level deep learning framework for the accurate and interpretable diagnosis of viral pneumonia from CT scans of patients. The workflow of the proposed framework consists of three main steps. First, an intelligent lung segmentation module is introduced for the early extraction of the lung region of interest and elimination of irrelevant parts of the scan, which extensively facilitates the learning process. Accordingly, a transformer-based approach is designed [17–19] for efficient segmentation of input images. The structure of the lung segmentation network consists of an intelligent encoder and decoder module designed based on an elegant window-based regional attention strategy. Secondly, a big transfer-based convolutional architecture [20,21] is finetuned in the medical domain to extract a feature from generated lung segmentation. To experiment with this intention, we retrospectively augmented the CT images of different viral pneumonia-infected cases in addition to formerly identified traditional viral pneumonia.
The remaining parts of the paper are organized as described below: In the second section, a literature review and connected studies are presented about the topic of medical image fusion for viral pneumonia. In this section, you will find in-depth explanations and facts that correlate to our proposed frameworks and the principles that have been implemented. In Section 4, the paper examines not only the recommended experimental settings but also the comparison studies and the results that were obtained. In the fifth and final section of this report, the findings and implications of the research are discussed with an eye toward the future.
Diagnostic image fusion was recently considered a valuable method that has a noteworthy role in different medical image classification tasks. In [14], for example, Wang et al. adopted a modified two-stage inception model for the discovery of COVID-19 from CT images: where the first stage is responsible for fusing the ROI features using transfer learning and producing a reduced features vector that followingly passed for the second stage with two fully connected layers (FCL) for final classification decision. Gozes et al. [15] introduced a novel system for analyzing CT images of PUI at two different levels: in the first subsystem, authors utilized software for spotting small opacities and nodules from a three-dimensional (3D) lung representation and also for obtaining some numerical measurements such as volumetric and axial values, texture description, and limited focal GGO. Concurrently, the second subsystem takes out two-dimensional (2D) slices, where a U-net architecture is employed for image segmentation and extraction of lung ROI patterns which in turn remove image fragments irrelevant for the recognition of within-lung pneumonia and facilitates the subsequent training process using pre-trained ResNet-50 adopted for detecting viral pneumonia associated abnormalities.
In [16], Li et al. modified U-net for CT image segmentation and then introduced a 3D deep learning approach named COVNet (based on RestNet-50) for the extraction and identification of viral pneumonia-related 2D local and 3D global demonstrative features corresponding to input slices. Which is later combined with a max-pooling layer and passed to FCL with SoftMax function to calculate a probability score for each disease class. Besides, Xu et al. [22] proposed two architectures for the diagnosis of viral pneumonia from CT images, The first architecture utilized the ResNet-18 for feature fusion and the output was computed later at three FCL with SoftMax operation. In contrast, in the second architecture, the normalized distance-from-edge was concatenated with FCL input. In [23], a deep learning model, called Deep Pneumonia, is presented for viral pneumonia detection from CT images. Firstly, primary regions of the lungs are captured with segmentation to evade noises generated with diverse lung outlines. After that, the relation of a detail extraction network (DRE-Net) was adopted to learn the top-K characteristics in the CT images and perform image-related predictions which have lately been collected to accomplish PUI diagnosis. DRE-Net was created on the pre-trained ResNet-50 for learning the top-K features along with the attention module employed to determine the significance of each feature. Besides, Narin et al. [24] utilized three pre-trained models for the detection of viral pneumonia from X-ray images. However, they just classified viral pneumonia cases from standard cases and did not consider any other pneumonia. Zhou et al. [25] developed a multistage system in which they first applied a predefined segmentation model to get lung regions from CT images, then trained ResNet-151 to classify the 2D slices. Yet they rely on handcrafted annotation for lung segmentation.
Latterly, the task of image segmentation has become indispensable in medical image classification [26,27], where pixel-level labeling is more essential than image-level labeling. Various versions of full CNN are applied for image segmentation; among them, U-net has gained increased attention with many adoptions proposed. In [17], Aghbolaghi et al. introduced an adapted architecture of U-net that yields excellent results using a tremendous amount of training samples. In the encoding path of their network, a sequence of feature maps corresponds to VGG-16, which is captured with decreased dimensionality. In the decoding path, they generate segmentation maps by conducting upsampling; they also, adopted ConvLSTM for U-net skip connection. However, employing the Longest Short-Term Memory (LSTM) adds much burden to network training, and their proposal did not consider surface-level interrelationships in the decoding path. Besides, Song et al. [18] extended U-net with additional up convolutional for rescaling but their performance primarily relies on manually annotated seabed images. In [19], Weng et al. addressed segmentation using a modified U-net based on a triple-operation neural architecture search and replaced the standard skip link with a weight function. Yet, the processing conducted on the feature maps is simply concatenated without considering spatial-temporal dependency. The main drawback of CNN-based segmentation is that the learned spatial characteristics of the image vanish when they are passed into the full connection layer layers.
Generally, the above-mentioned studies proposed the use of deep learning approaches for medical image feature extraction or classification without considering the importance of individual features. Additionally, current research on lung segmentation has focused on learning from image patches centered around infections but has disregarded the differences in features present in CT scans of regions affected by different types of pneumonia. Despite the great success of CNN-based approaches, irrelevant noisy zones present in the whole volume and local patches [16] can have a significant impact on the network’s decision. Furthermore, these approaches are often used as blurred black box architectures, where the outcomes are unexplained and therefore difficult to interpret.
A variety of activation maps have been widely leveraged by researchers to provide an interpretation of the findings generated by the model [23–26]. In [20–22], the authors proposed to use the error backpropagation techniques to visualize the relevant regions that are supportive of final class prediction. The authors of [16] introduced a class activation map (CAM) that uses an average pooling layer to produce activation maps representing task-relevant regions. The authors of [22] extended CAM to gradient CAM (Grad-CAM) to provide a more informative model decision explanation. The areas of noise widely affect the network training either using global images or patches like images [16]. This noisy area exhibits a high correlation that could attract network bias and hence degrade the generalization performance test instances that do not have a similar correlation as the training samples. A method that makes use of the superfine variations in local structures by calling attention to the area of interest and suppressing the unnecessary areas is essential to finetune the learning system performance. Deep models accompanied by an attention mechanism (AM) can assist in revealing the noisy regions from the last decision-making procedure. Hence, makes the model’s outcomes more translucent and interpretable, thus increasing model reliability and trustworthiness. Some studies [10–12] applied attention as a post-processing phase in order to comprehend the decision procedure of the model for visual recognition.
Several studies applied unsupervised AM for different tasks of medical imaging. The authors of [12] addressed thorax disease classification on chest X-ray images using a three-channel attention-guided CNN (AG-CNN) to capture salient regions of particular diseases and evade noisy areas. Nevertheless, only a single prominent lesion or ROI was extracted and the technique is restricted to applications that exhibit various separated ROIs. Ioffe et al. [28] introduced an attention gate (AG) architecture that unswervingly learns to concentrate on target patterns, and is applied for pancreas segmentation. Similarly, the AG is exploited to guide the model on target patterns with different shapes and sizes by inhibiting irrelevant areas in the input image. However, there is no observed accuracy enhancement of AG-CNN over the standard vanilla network. Additionally, Unsupervised AM [27,28] originated from either global images or first-place attention maps and could be affected by the irrelevant noisy regions causing improper attention.
Building upon the aforementioned deficiencies, this study presents the notion of clinical explainability in the diagnosis of COVID-19 through the analysis of lung CT images. The augmentation of the diagnosis choice with visual explanations of anatomical positions facilitates the achievement of this outcome. The suggested architecture is conceptualized as a comprehensive framework for the integration of CT information, which may be utilized and enhanced for the purposes of pneumonia diagnosis activities, including visualization, classification, and segmentation. In order to assess the efficacy of the suggested model, a series of experimental comparisons were conducted with state-of-the-art diagnostic techniques.
This section provides a detailed explanation of the proposed model. It exploits the advantages of deep learning techniques for fast and accurate diagnosis of viral pneumonia from CT scans, as shown in Fig. 1. This paper provides visualization for different adopted methods and building blocks. Particularly, given the input radiographic CT image we formerly prepared it and extracted the lung ROI of the lung using the proposed contextual aware segmentation method. Then captured images followingly passed to pre-trained deep learning architecture for learning disease-related features. Besides, an additional output layer is proposed to evaluate and make the final diagnosis decision, as shown in Fig. 1. The following subsections describe, in detail, each of these stages.
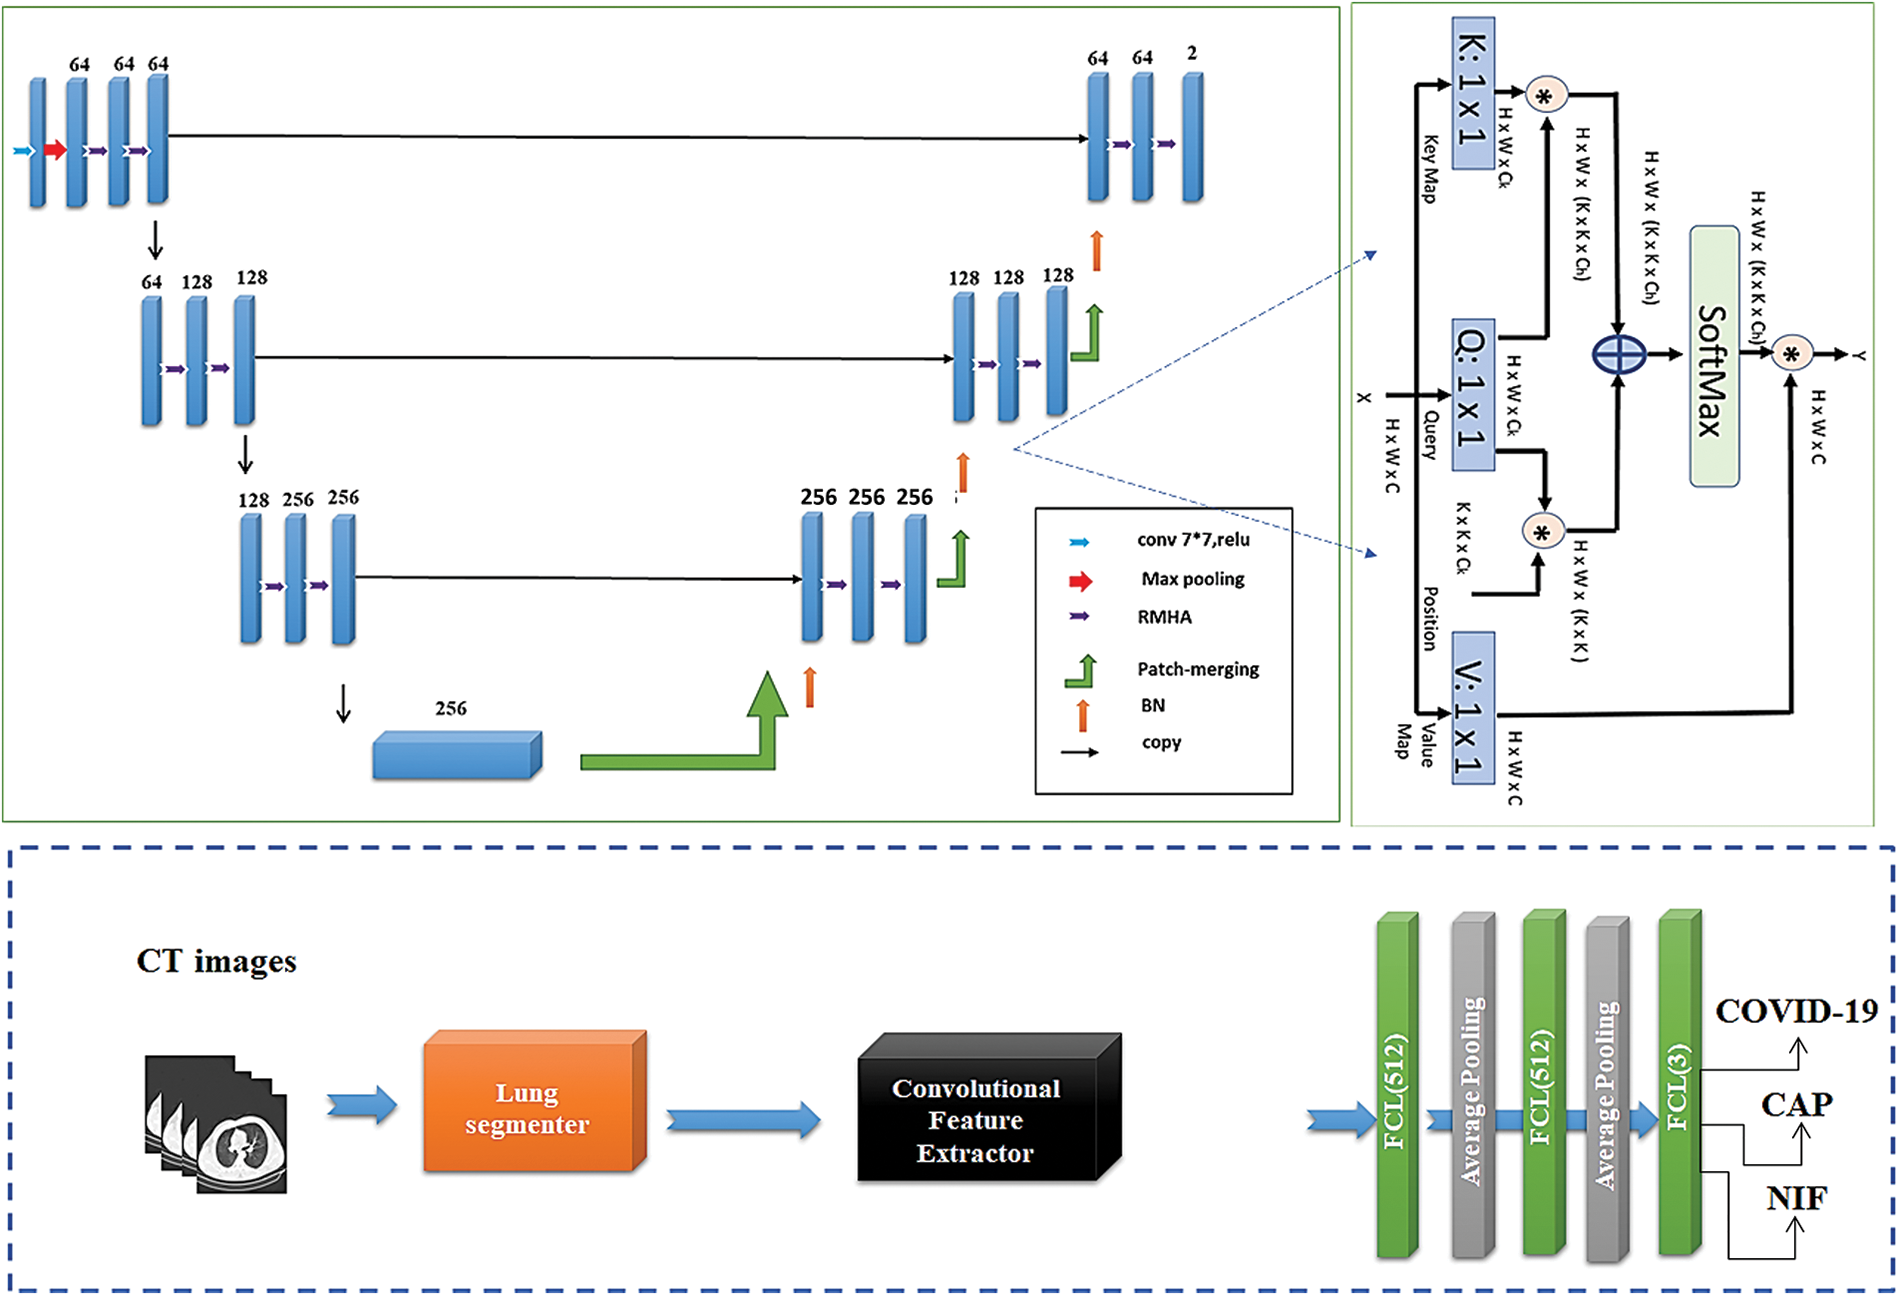
Figure 1: The general structure of our Conformer Network. The upper-left subfigure indicates the segmentation network build with RMHA layer presented upper-right subfigure. The lower part indicates the classification subnetwork to determine the class of pneumonia
This section explains the proposed U-shaped transformer architecture for efficient segmentation of input lung images through two stacked tracks (See upper-left part of Fig. 1). In the segmentation model, the encoder and decoder modules are designated with contextual multiheaded self-attention (MHA), as shown in Fig. 1. The encoder receives a sequence of embeddings
Three matrices Query q, Key k, and Value v, are generated by multiplication of the element against three learned matrices
with
Modules begin with layer normalization (LN), and MHA and FNN layers receive residual connections. For many patches, the global SA computation is irrational, whereas the local SA can be dealt with. Nonetheless, the representational capacity is constrained by local attention because of the lack of linkages between windows [16]. Fixing the network calls for implementing a cross-window connection while still allowing for the efficient computations of non-intersecting windows. This can be handled by constructing two concurrent attention units, where the initially utilizes Window-based regional MHA (WRMHA), and the other uses cross-window-regional MHA (CwRMHA). Significant inputs in the initial encoder modules can be theoretically expressed as follows:
Similarly, the learned representations propagate through the concurrent transformer block as follows:
Inspired by the original transformers [30], the patched inputs are fed into a learnable embedding layer that generates embedded patches
Herein, the segmented image undergoes processing to extract pathology-related details. There are two main ways in which deep learning algorithms in computer vision might acquire new knowledge: either by starting from scratch or by leveraging transfer learning (TL) from already-trained algorithms. This paper concludes that a learning-from-scratch approach is inadequate for the underlying condition because it necessitates a significant quantity of data, thus this paper employs the TL concept by creating a sophisticated feature extractor relying on a potent pre-trained model, i.e., Big Transfer network (BiT).
The first adopted architecture is BiT proposed by Tan et al. [31]. BiT architecture attains superior performance on multiple image classification including ImageNet [32]. It was different from other pre-trained architectures that ultimate on underlying task data. The most remarkable thing about BiT is that it performs pre-training just, while succeeding in finetuning to downstream tasks is easy, owing to an efficient heuristic for transferring hyperparameters for functions, which in turn simplify the process of pre-training and transferring and obtaining superior performance across a wide range of classification tasks.
Applying the concept of TL using BiT architecture for constructing a pre-trained network could be implemented with two tasks: upstream and downstream tasks, which respectively represent pre-training procedures and finetuning for a new task. In the upstream task (Pre-Training), based on the fact that more massive architectures need huge datasets to reveal their performance. Three versions of the BiT model were trained on three massive datasets. The architecture of BiT-L utilizes the use of ResNet-101 architecture, where overall Batch Normalization layers are replaced with the Group Normalization layer as well as adopting weight standardization for all convolutional layers to maintain stable generalization performance. In contrast, each layer is widened by a factor of three. This paper selects lightweight BiT (BiT-L) architecture trained with 14 M images from ImageNet-21k [33] with 21k classes for 90 epochs and decays the learning rate by a factor of 10, the learning rate of 0.003, and batch size of 512.
In the downstream task (finetuning), BiT-L adopts the BiT-hyperparameters selection heuristic to enable a cheap finetuning strategy that facilitates learning transfer for a variety of tasks by avoiding the exhaustive search for hyperparameters for the new task and dataset size. This heuristic specifies the training configuration on dataset characteristics, which makes it achieve competitive performance in many tasks.
The transferred knowledge of both BiT-L came from a non-medical background. This work finetunes the performance of BiT-L by separately training each model on the Lung image database [34] for 50 epochs, using an Adam optimizer and a learning rate of 0.0001. Then the finetuned architecture proposed to act as a disease-relevant feature extractor by removing its final FCL layer. Finally, the produced feature maps are fed into the output layer for final decision calculation in case of a single modality.
The third stage of our proposed model is the decision layer, in which the outcome of the previous stage is received and processed with a dense layer to calculate the pneumonia class to which the input image belongs. Given that we have multiple classes of pneumonia, SoftMax is applied to calculate the probability of each class as follows:
Typically, the training of the model requires careful selection of cost function at the end of the decision layer. Hence, a hybrid loss function is presented here to integrate pairwise Gaussian loss (PGL) [35] into categorical entropy loss as follows:
In the above formulas, the term
The gradient activation mapping has played a powerful role in delivering insightful visual explanations. The design of the interpretability module is based on polishing their gradient into Grad-CAM++ [36] to enable efficient visualization of convolutional feature maps with enhanced visual allure, localization, and class object catching. Polishing involves integrating noise into intended the lung CT slice and calculating the mean of all gradient matrices made from each noised input. Grad-CAM++ computes the gradients of the output with respect to a certain specific location in the feature map on a pixel-by-pixel basis. To what extent a given pixel in a feature map contributes to the final CNN judgment is quantified by this metric. In mathematical terms, the localization map can be calculated as below:
whereas the factor
where
When
This section introduces the experimental configurations of the experimentations performed in this work in terms of the adopted dataset, performance indicators, and other settings.
In the experiments of lung segmentations, the proposed segmentation network is trained and evaluated using the CT dataset publicly available on the Kaggle data store1. The dataset encompasses two-dimensional and three-dimensional CT scans along with their annotation. The data is divided into train and test subsets with a proportion of 80% and 20%, respectively. The input images are randomly augmented and resized to the dimension
For classifying the type of infection, the 3DLSC-COVID dataset is employed in our experiments. The dataset comprises 570,000 CT slices belonging to 1,805 3D chest CT scans aggregated from two common CT scanners of Liyuan Hospital, i.e., GE Optima CT600 and UIH uCT 510. The CT scans contain 794 COVID-19 patients validated by RT-PCR check in early 2020. Moreover, it contains 540 scans for CAP patients and 471 scans for non-infected cases.
Discriminating viral pneumonia from different cases of pneumonia is considered a multi-classification problem. Thus, common performance indicators are applied to evaluate the classification performance of our model.
For evaluating the segmentation performance, the above metrics can also be used in addition to the dice score coefficient (DSC), and Jaccard index (JI).
This section describes and analyzes the experimental results obtained from the experiments of the proposed network and competing methods.
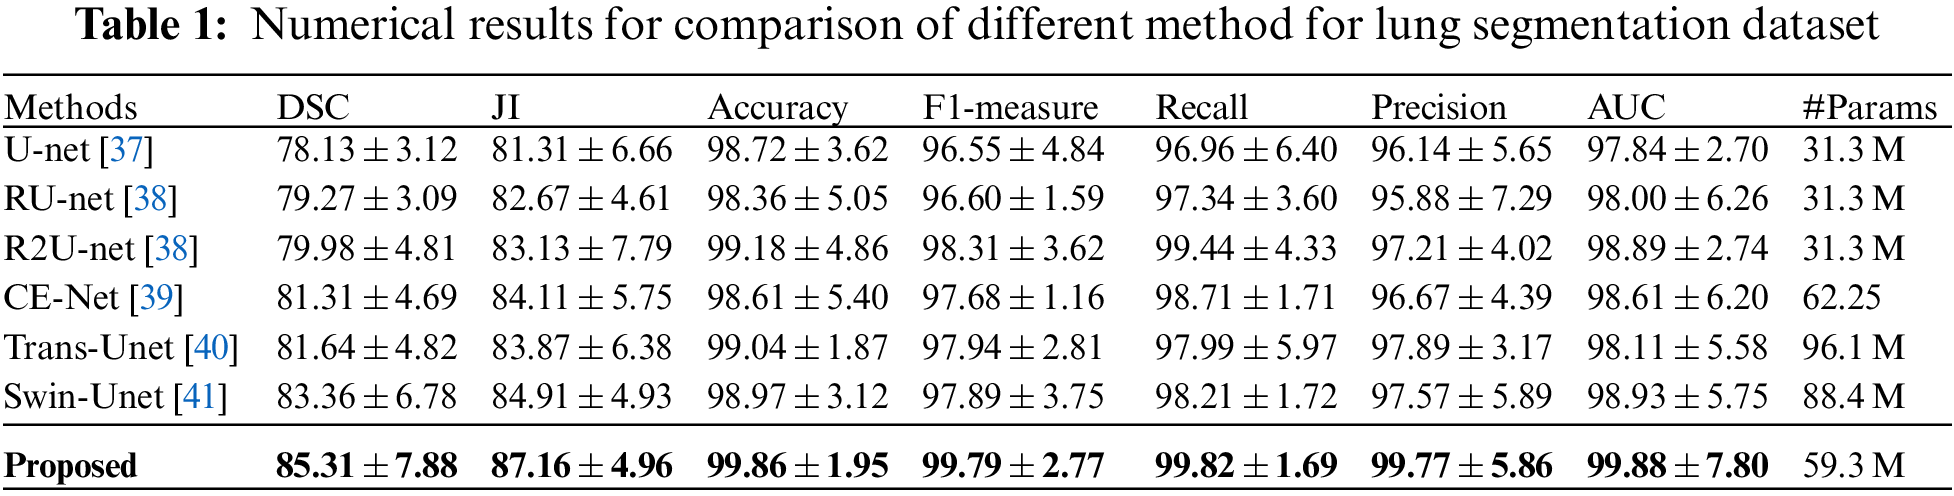
In our experiments, for the purpose of demonstrating the proposed segmentation technique, this paper conducts comparative experiments against other studies, and the obtained quantitative results are shown in Table 1. It could be observed that the proposed segmentation network achieves the highest DSC of 85.31% and JI of 87.16%, which outperforms the existing cutting-edge approaches on both metrics. Also, our method yields a precision that beats the current studies by 2.56%. This, in turn, demonstrates the efficiency of the proposed segmentation network in detecting the lung region with the highest possible precision.
4.3.2 Pneumonia Classification
Again, they utilize the segmented image from the proposed segmentation network for learning embedded image representation and conducted multiple experiments to determine the effectiveness and efficiency of the proposed Conformer Network, Fair comparatively experiments are performed to analyze and contrast the performance of the Conformer Network against the following cutting-edge approaches as the baselines on five performance measures, as shown in Table 2.
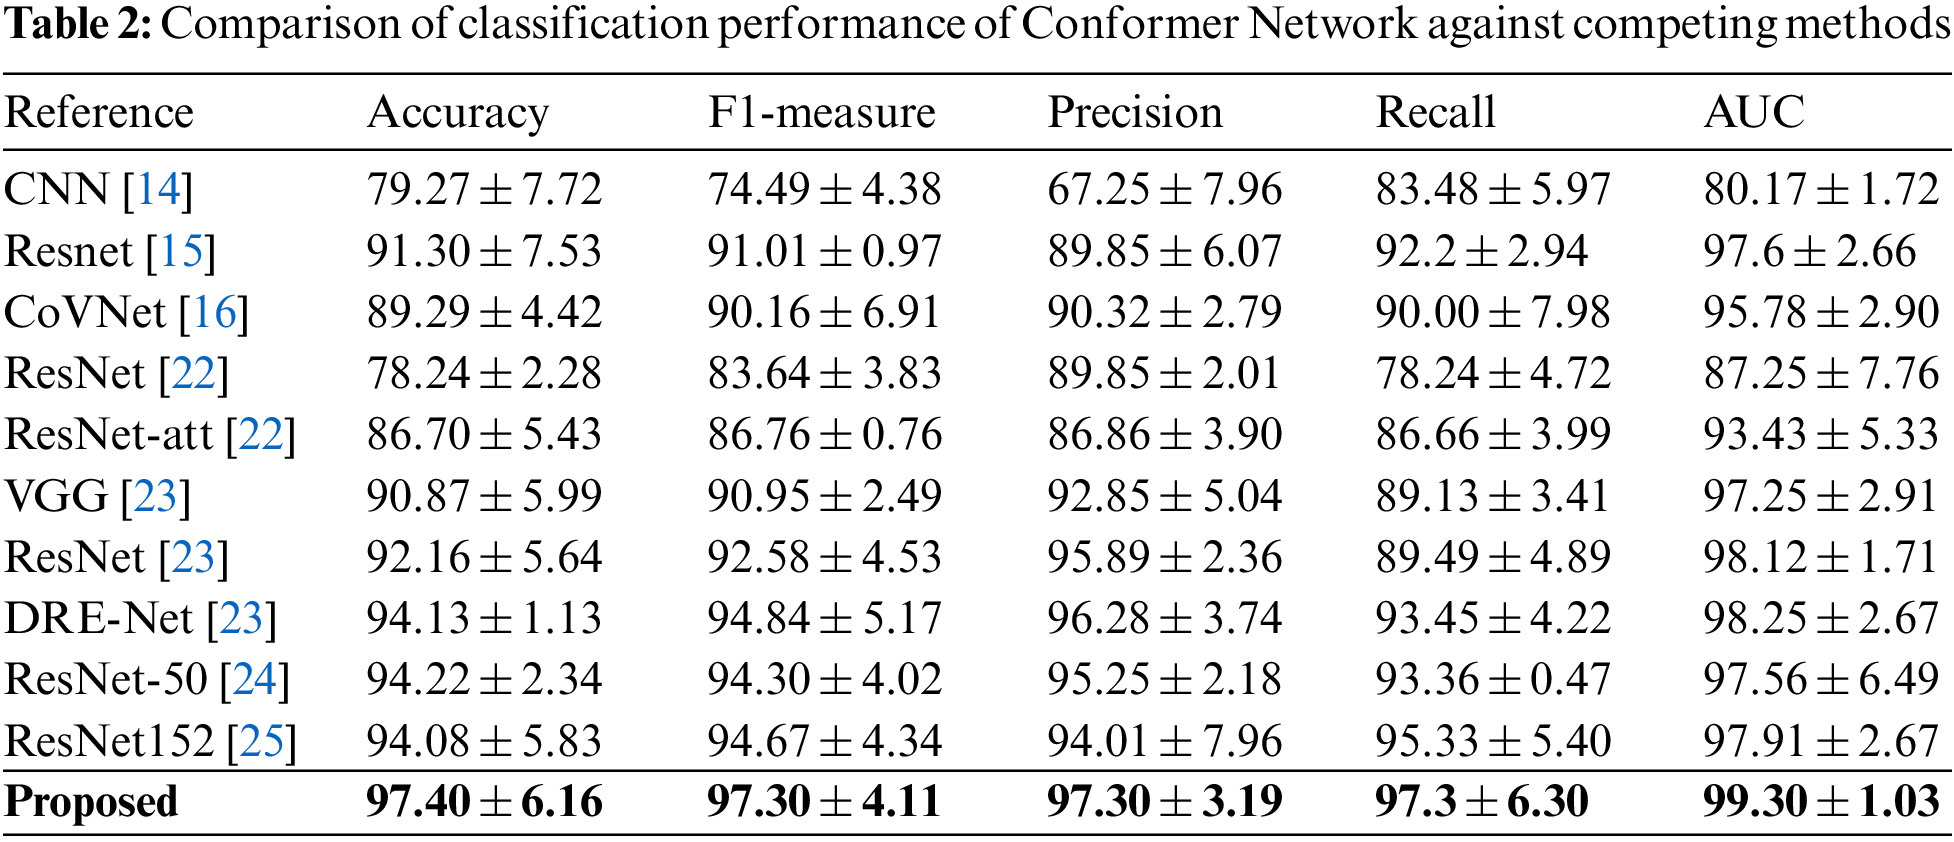
It could be observed that our approach extensively overcomes other models across all matrices, Conformer Network achieved an accuracy of 97.4% and an F1-measure of 97.4%, which beats the best-reported results with 3% and 2.6%, respectively. This indicates that our proposed Conformer Network technique provides an effective segmentation of lung abnormalities that subsequently improves the performance of TL models in learning disease characteristics and accordingly improves overall model performance. Also, this paper introduces the confusion matrix of our models with recall, precision, and F1-measure corresponding to each disease class in Table 3. It can be noticed that the Conformer Network detects viral pneumonia with 97.3% sensitivity; meanwhile, patients who are co-infected with COVID-19 and CAP account for the vast majority of misclassifications.
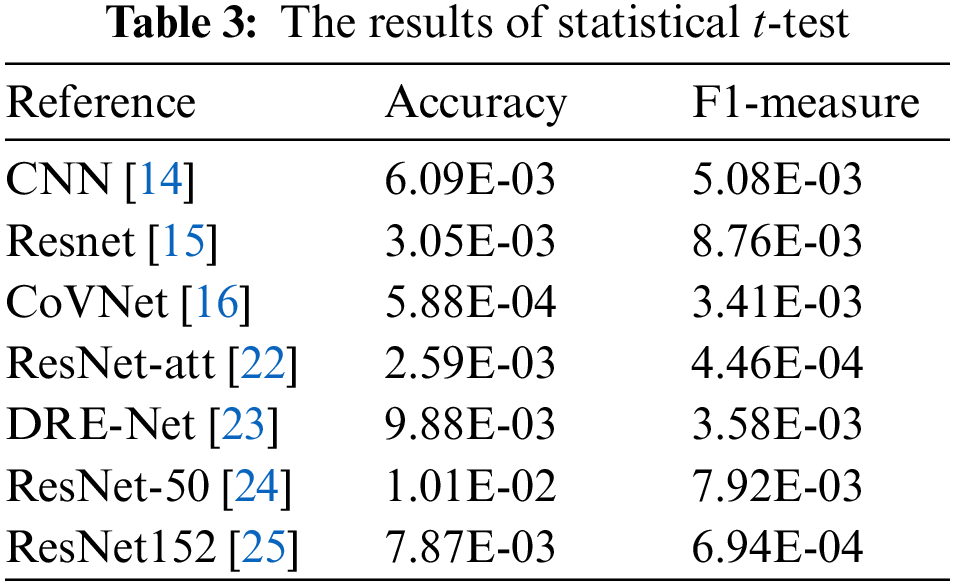
Furthermore, to further validate the competitiveness of the Conformer Network, statistical t-test experiments are performed to estimate the statistical difference between the results from the Conformer Network and competing ones. In this setting, the p-value is estimated under 95% confidence intervals. The results of statistical experimentations are presented in Table 4. It could be distinguished that the majority of statistical results are kept under the significance threshold. This further supports the findings of comparative analysis by demonstrating that the Conformer Network is overcoming its counterparts with statistical significance.

In an attempt to obtain proper convergence of our approach, this paper presents the loss diagram and accuracy diagram corresponding to the training and testing of our Conformer Network model, as depicted in Figs. 2a and 2b. It could be noticed that the model converges rapidly, after the 50th epoch. This paper also can observe the training accuracies are always higher than test accuracies; the training loss is always less than the test loss, and both reach 10% after the 100th epoch. To illustrate the total performance of the Conformer Network on our collected data, this paper introduces ROC curves corresponding to each model, as displayed in Fig. 3. In which, it could be seen that the Conformer Network got 99.44% of the AUC.
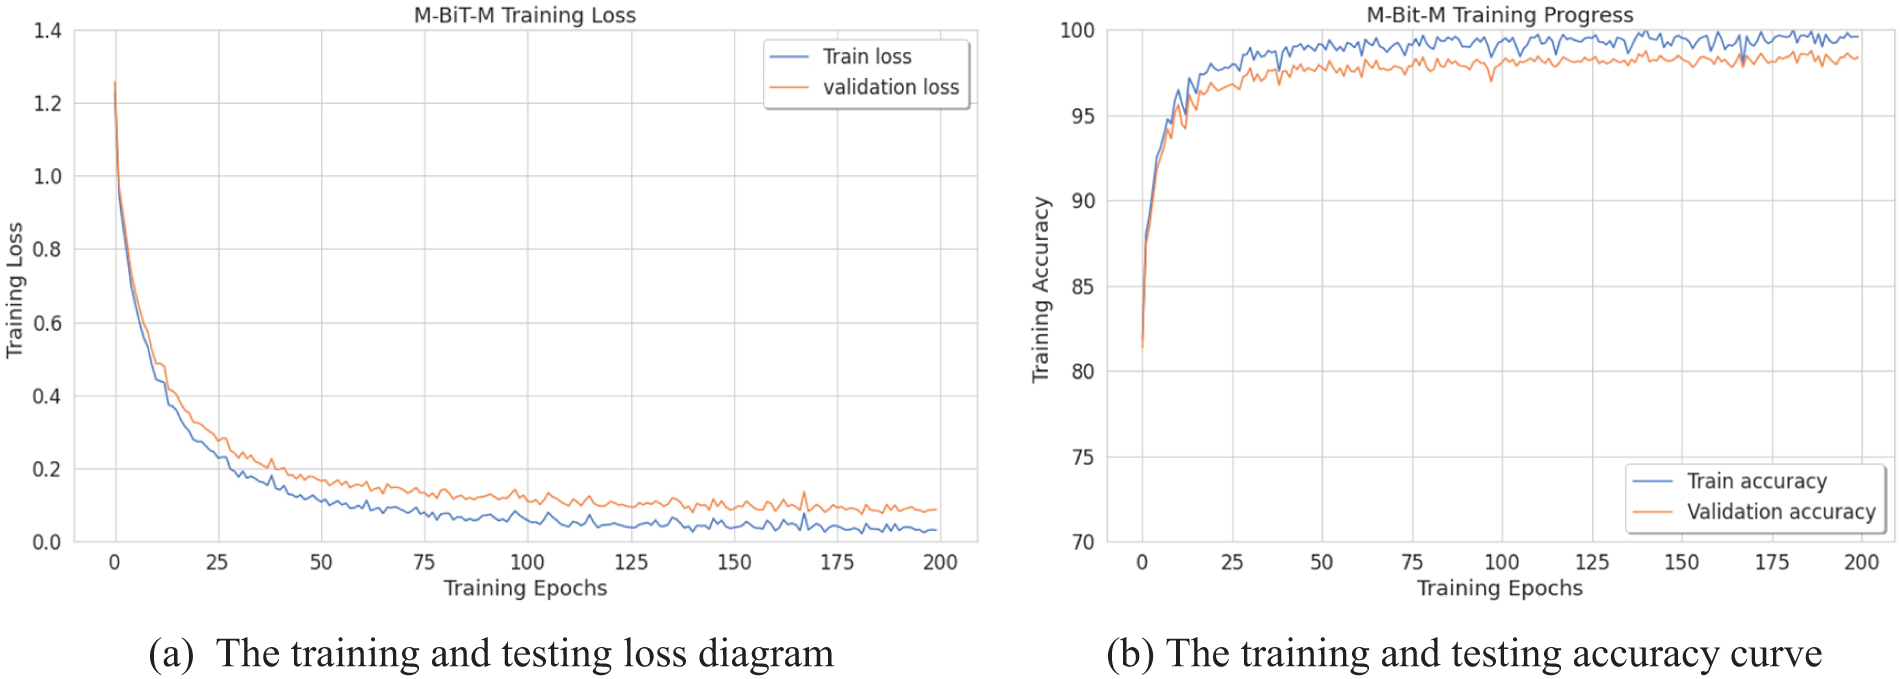
Figure 2: The training curves of Conformer Network (with BiT-L extractor)
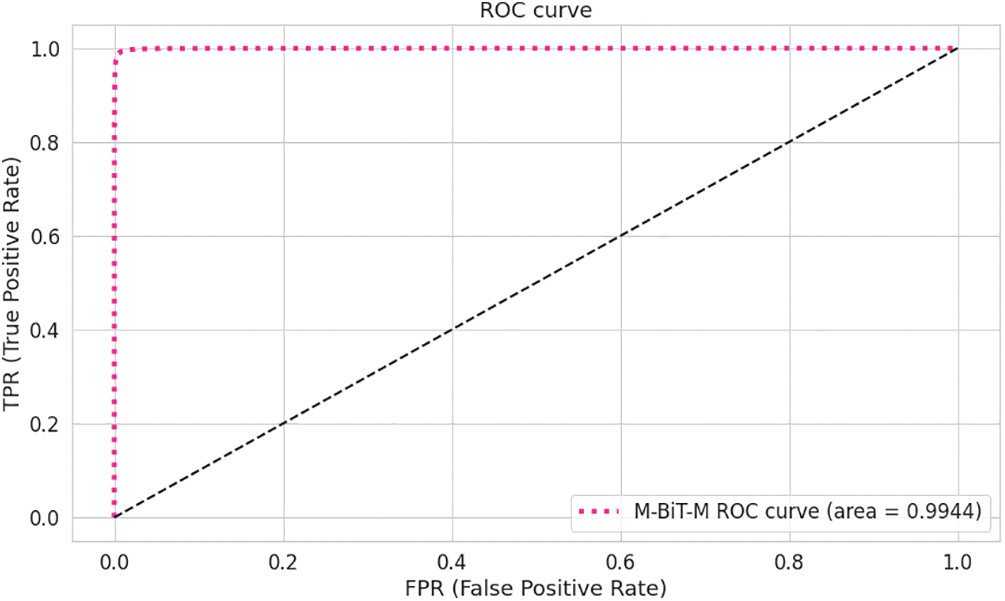
Figure 3: The AUC ROC curve of the transolution
Interpretability Analysis: To experimentally evaluate the ability of the proposed to explain the classification decision it makes, this paper provides some visualizations of the activation heatmap for COVID-19 and pneumonia cases as displayed in Figs. 4 and 5, correspondingly. As noted, the results from the proposed PG-CAM++ demonstrate its ability to precisely illustrate the regions that helped drive the current decision [42–45].
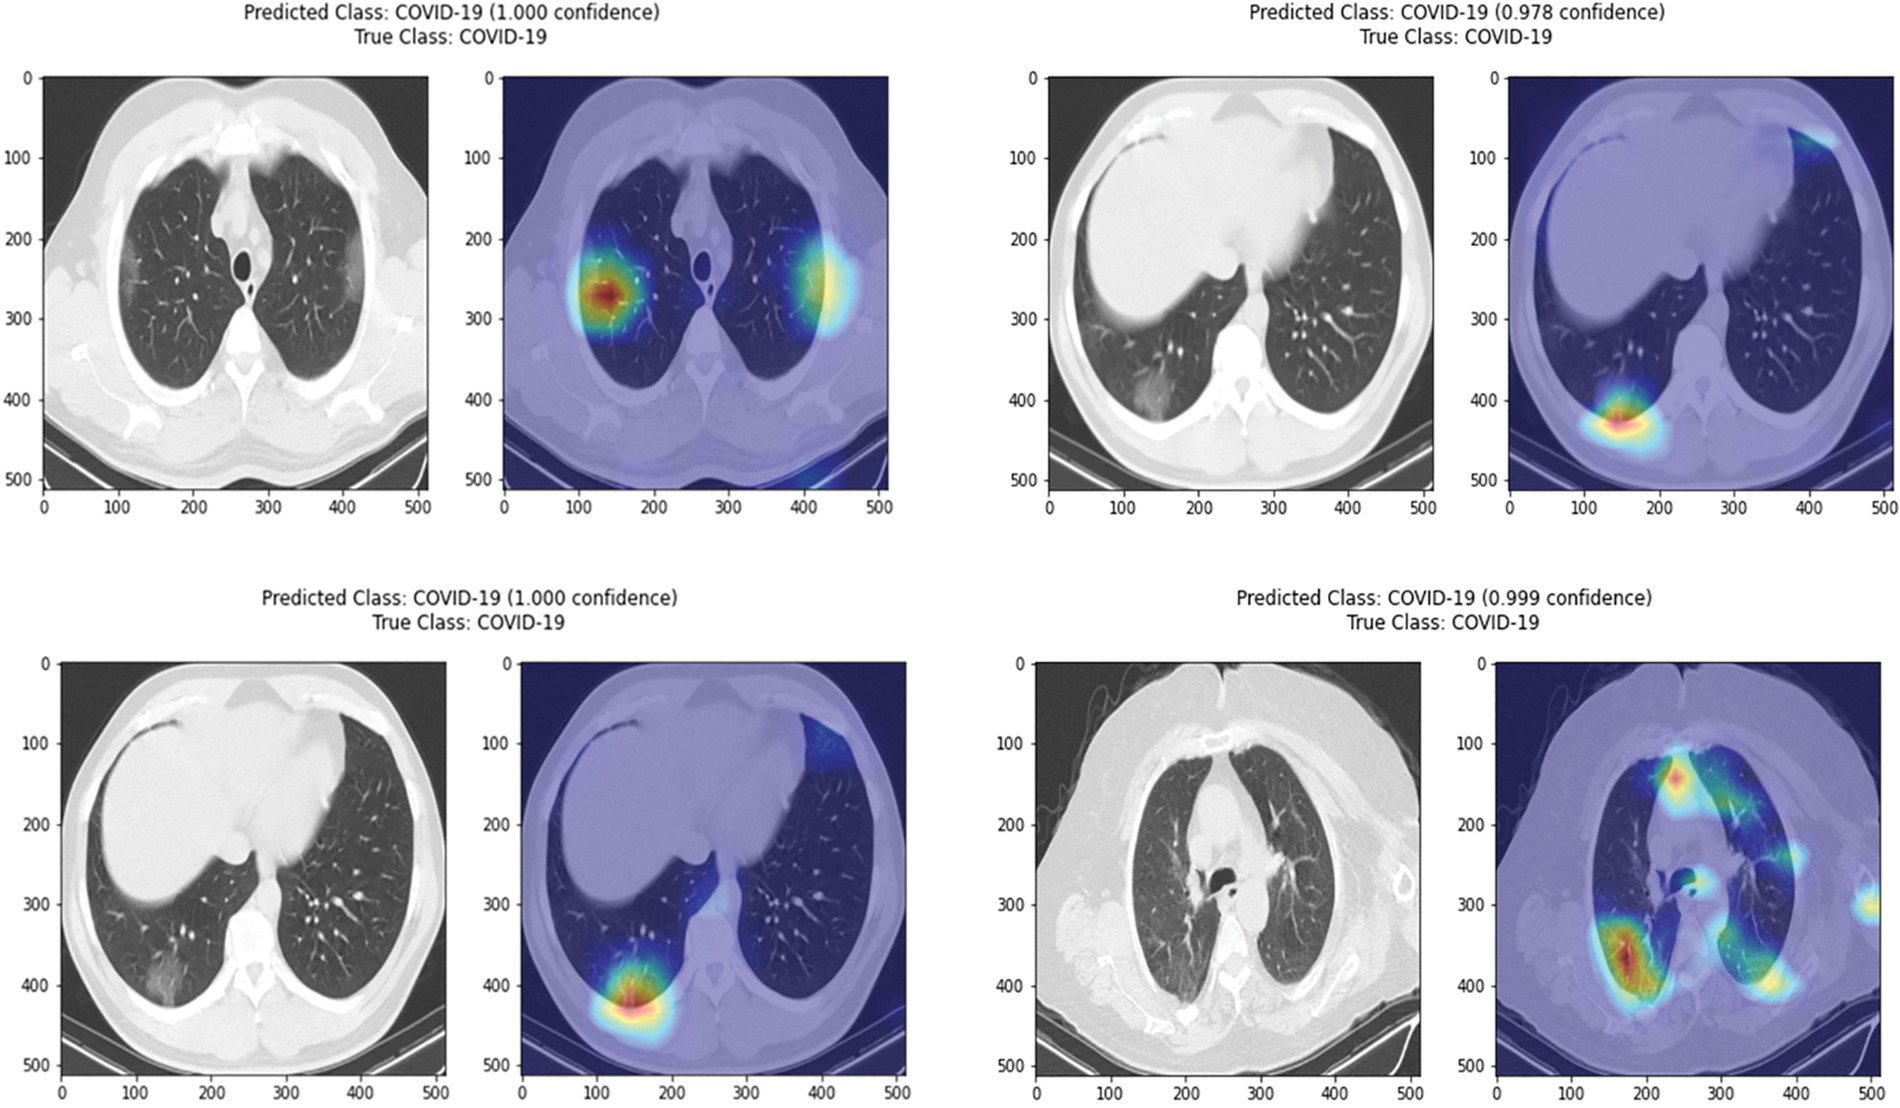
Figure 4: Illustration of activation maps generated via the polished PG-CAM++ for correctly classified COVID-19 cases (without segmentation)

Figure 5: Illustration of activation maps generated via the PG-CAM++ for correctly classified
This paper presents a Conformer Network for pneumonia diagnosis from CT scans to support clinicians with an accurate and interpretable decision about the class. The efficient lung segmentation algorithm proposed can precisely segment the lung area using an encoding path and a decoder layer designed with an intelligent multi-headed attention module. The Conformer Network is then empowered with a robust feature extractor (BiT-L) to enable the learning of important knowledge from the input images. The experimental results demonstrate the feasibility of our proposed approach in accurately recognizing viral pneumonia from CT data. The findings demonstrate our model as an automated diagnostic tool to help radiologists and clinicians by providing rapid preliminary assessments, that can alleviate their workload, allowing them to focus on complex cases and treatment planning. The high complexity of our model is still an open challenge, which might limit the ability to deploy and use our model in a resource-constrained environment. Thus, future work may include investigating making our model lighter and faster. The scalability and adaptability of our model to large-scale scenarios in the existing healthcare systems is a promising direction to explore shortly.
Acknowledgement: Researchers Supporting Project Number (RSP2024R167), King Saud University, Riyadh, Saudi Arabia.
Funding Statement: This project is funded by King Saud University, Riyadh, Saudi Arabia. Researchers Supporting Project Number (RSP2024R167), King Saud University, Riyadh, Saudi Arabia.
Author Contributions: Conceptualization, M.A.-B., H.H.; methodology, M.A.-B., H.H., M.A.; software, M.A.-B., H.H., A.A.T. M.A.; validation, M.A.-B., H.H. and M.A.; formal analysis, M.A.-B., H.H., A.A.T. and M.A.; investigation, M.A.-B., S.S.A. and M.A.; resources, M.A.-B., M.A. and H.H.; data curation, M.A.-B., H.H. and M.A.; writing—original draft preparation, M.A.-B., H.H. and M.A.; writing—review and editing, M.A.-B., S.S.A., A.A.T, H.H. and M.A.; visualization, M.A.-B., A.M.A., M.A. and H.H.; supervision, M.A.-B.; funding, S.S.A.; project administration, M.A.-B., H.H. and M.A. All authors have read and agreed to the published version of the manuscript.
Availability of Data and Materials: Not applicable.
Conflicts of Interest: The authors declare that they have no conflicts of interest to report regarding the present study.
1https://www.kaggle.com/kmader/finding-lungs-in-ct-data.
References
1. C. Devaux, J. Rolain, P. Colson and D. Raoult, “New insights on the antiviral effects of chloroquine against coronavirus: What to expect for COVID-19,” International Journal of Antimicrobial Agents, vol. 12, no. 2, pp. 105938, 2020. [Google Scholar]
2. D. K. Aldana, Y. Rivera, I. Bonilla, M. Trujillo, A. Barco et al., “Coronavirus infections reported by proMED, February 2000–January 2020,” Travel Medicine and Infectious Disease, vol. 3, no. 4, pp. 101575, 2020. [Google Scholar]
3. Y. Liu, A. Gayle, A. Smith and J. Rocklöv, “The reproductive number of COVID-19 is higher compared to SARS coronavirus,” Journal of Travel Medicine, vol. 14, no. 4, pp. 1–15, 2020. [Google Scholar]
4. S. P. Priyadharshini and F. N. Irudayam, “An analysis of obesity in school children during the pandemic COVID-19 using plithogenic single valued fuzzy sets,” Neutrosophic Systems with Applications, vol. 9, no. 1, pp. 24–28, 2023. https://doi.org/10.61356/j.nswa.2023.51 [Google Scholar] [CrossRef]
5. F. Song, N. Shi, F. Shan, Z. Zhang, J. Shen et al., “Emerging 2019 novel coronavirus (2019-nCoV) pneumonia,” Radiology, vol. 295, no. 3, pp. 210–217, 2020. [Google Scholar] [PubMed]
6. H. X. Bai, B. Hsieh, Z. Xiong, K. Halsey, J. W. Choi et al., “Performance of radiologists in differentiating COVID-19 from viral pneumonia on chest CT,” Radiology, vol. 12, no. 4, pp. 200823, 2021. [Google Scholar]
7. H. Guo, U. Kruger, G. Wang, M. K. Kalra and P. Yan, “Knowledge-based analysis for mortality prediction from CT images,” IEEE Journal of Biomedical and Health Informatics, vol. 24, no. 2, pp. 457–464, 2019. [Google Scholar] [PubMed]
8. K. Mechlem, T. Sellerer, M. Viermetz, J. Herzen and F. Pfeiffer, “Spectral differential phase contrast x-ray radiography,” IEEE Transactions on Medical Imaging, vol. 39, no. 4, pp. 578–587, 2019. [Google Scholar] [PubMed]
9. Y. Fang, H. Zhang, J. Xie, M. Lin, L. Ying et al., “Sensitivity of chest CT for COVID-19: Comparison to RT-PCR,” Radiology, vol. 11, no. 3, pp. 200432, 2021. [Google Scholar]
10. A. Kumar, M. Fulham, D. Feng and J. Kim, “Co-learning feature fusion maps from PET-CT images of lung cancer,” IEEE Transactions on Medical Imaging, vol. 39, no. 5, pp. 204–217, 2019. [Google Scholar]
11. C. You, G. Li, Y. Zhang, X. Zhang, H. Shan et al., “CT Super-resolution GAN constrained by the identical residual and cycle learning ensemble,” IEEE Transactions on Medical Imaging, vol. 39, no. 6, pp. 188–203, 2019. [Google Scholar] [PubMed]
12. H. Wang, H. Jia, L. Lu and Y. Xia, “Thorax-Net: An attention regularized deep neural network for classification of thoracic diseases on chest radiography,” IEEE Journal of Biomedical and Health Informatics, vol. 24, no. 2, pp. 475–485, 2019. [Google Scholar] [PubMed]
13. T. Ai, Z. Yang, H. Hou, C. Zhan, C. Chen et al., “Correlation of chest CT and RT-PCR testing in coronavirus disease 2019 (COVID-19) in China: A report of 1014 cases,” Radiology, vol. 12, no. 8, pp. 200642, 2022. [Google Scholar]
14. S. Wang, B. Kang, J. Ma, X. Zeng, M. Xiao et al., “A deep learning algorithm using CT images to screen for corona virus disease (COVID-19),” medRxiv, vol. 12, no. 6, pp. 1–17, 2020. [Google Scholar]
15. O. Gozes, M. Adar, H. Greenspan, P. Browning, H. Zhang et al., “Rapid AI development cycle for the coronavirus (COVID-19) pandemic: Initial results for automated detection & patient monitoring using deep learning CT image analysis,” arXiv preprint arXiv:2003.05037, vol. 12, no. 7, pp. 1–20, 2020. [Google Scholar]
16. L. Li, L. Qin, Z. Xu, Y. Yin, X. Wang et al., “Artificial intelligence distinguishes COVID-19 from community acquired pneumonia on chest CT,” Radiology, vol. 15, no. 9, pp. 200905, 2022. [Google Scholar]
17. M. Aghbolaghi, R. Azad, M. Fathy and S. Escalera, “Multi-level context gating of embedded collective knowledge for medical image segmentation,” arXiv preprint arXiv:2003.05056, vol. 4, no. 5, pp. 1–20, 2020. [Google Scholar]
18. W. Song, N. Zheng, X. Liu, L. Qiu and R. Zheng, “An improved U-net convolutional networks for seabed mineral image segmentation,” IEEE Access, vol. 7, no. 4, pp. 82744–82752, 2019. [Google Scholar]
19. Y. Weng, T. Zhou, Y. Li and X. Qiu, “NAS-Unet: Neural architecture search for medical image segmentation,” IEEE Access, vol. 7, no. 4, pp. 44247–44257, 2019. [Google Scholar]
20. K. He, X. Zhang, S. Ren and J. Sun, “Deep residual learning for image recognition,” in Proc. of the IEEE Conf. on Computer Vision and Pattern Recognition, Vancover, BC, Canada, pp. 770–778, 2016. [Google Scholar]
21. O. Russakovsky, J. Deng, H. Su, J. Krause, S. Satheesh et al., “ImageNet large scale visual recognition challenge,” International Journal of Computer Vision, vol. 115, no. 4, pp. 211–252, 2015. [Google Scholar]
22. X. Xu, X. Jiang, C. Ma, P. Du, X. Li et al., “Deep learning system to screen coronavirus disease 2019 pneumonia,” arXiv preprint arXiv:2002.09334, vol. 6, no. 5, pp. 1–22, 2020. [Google Scholar]
23. Y. Song, S. Zheng, L. Li, X. Zhang, X. Zhang et al., “Deep learning enables accurate diagnosis of novel coronavirus (COVID-19) with CT images,” medRxiv, vol. 3, no. 4, pp. 1–10, 2020. [Google Scholar]
24. A. Narin, C. Kaya and Z. Pamuk, “Automatic detection of coronavirus disease (COVID-19) using X-ray images and deep convolutional neural networks,” arXiv preprint arXiv:2003.10849, vol. 20, no. 4, pp. 1–17, 2020. [Google Scholar]
25. Z. Zhou, M. Siddiquee, N. Tajbakhsh and J. Liang, “UNet++: Redesigning skip connections to exploit multiscale features in image segmentation,” IEEE Transactions on Medical Imaging, vol. 4, no. 3, pp. 1–17, 2019. [Google Scholar]
26. J. Hu, L. Shen and G. Sun, “Squeeze-and-excitation networks,” in Proc. of the IEEE Conf. on Computer Vision and Pattern Recognition, Calfornia, USA, pp. 7132–7141, 2018. [Google Scholar]
27. G. Huang, Z. Liu, L. Maaten and K. Weinberger, “Densely connected convolutional networks,” in Proc. of the IEEE Conf. on Computer Vision and Pattern Recognition, Munich, Germany, pp. 4700–4708, 2017. [Google Scholar]
28. S. Ioffe and C. Szegedy, “Batch normalization: Accelerating deep network training by reducing internal covariate shift,” in Int. Conf. on Machine Learning, East Lansing, USA, pp. 448–456, 2015. [Google Scholar]
29. L. Tian, X. Li, Y. Ye, P. Xie and Y. Li, “A generative adversarial gated recurrent unit model for precipitation nowcasting,” IEEE Geoscience and Remote Sensing Letters, vol. 17, no. 4, pp. 601–605, 2019. [Google Scholar]
30. A. Kolesnikov, L. Beyer, X. Zhai, J. Puigcerver, J. Yung et al., “Large scale learning of general visual representations for transfer,” arXiv preprint arXiv:1912.11370, vol. 4, no. 3, pp. 1–15, 2019. [Google Scholar]
31. M. Tan and Q. V. Le, “EfficientNet: Rethinking model scaling for convolutional neural networks,” arXiv preprint arXiv:1905.11946, vol. 12, no. 4, pp. 1–24, 2019. [Google Scholar]
32. Q. Xie, E. Hovy, M. Luong and Q. Le, “Self-training with noisy student improves ImageNet classification,” arXiv preprint arXiv:1911.04252, vol. 23, no. 7, pp. 1–15, 2019. [Google Scholar]
33. S. Armato, G. McLennan, L. Bidaut, M. Gray, C. R. Meyer et al., “The lung image database consortium (LIDC) and image database resource initiative (IDRIA completed reference database of lung nodules on CT scans,” Medical physics, vol. 38, no. 3, pp. 915–931, 2011. [Google Scholar] [PubMed]
34. D. Kermany, K. Zhang and M. Goldbaum, “Labeled optical coherence tomography (oct) and chest X-ray images for classification,” Mendeley Data, vol. 2, no. 3, pp. 1–15, 2018. [Google Scholar]
35. Y. Qin, G. Liu, Z. Li, C. Yan and C. Jiang, “Pairwise Gaussian loss for convolutional neural networks,” IEEE Transactions on Industrial Informatics, vol. 23, no. 3, pp. 1–9, 2020. https://doi.org/10.1109/TII.2019.2963434 [Google Scholar] [CrossRef]
36. Z. Gu, J. Cheng, H. Fu, K. Zhou, H. Hao et al., “CE-Net: Context encoder network for 2D medical image segmentation,” IEEE Transcations Medical Imaging, vol. 12, no. 3, pp. 1–12, 2019. [Google Scholar]
37. M. Alom, M. Hasan, C. Yakopcic, T. Taha and V. Asari, “Recurrent residual convolutional neural network based on U-Net (R2U-Net) for medical image segmentation,” arXiv preprint arXiv:1802.06955, vol. 11, no. 4, pp. 1–10, 2018. [Google Scholar]
38. C. Feichtenhofer, A. Pinz and A. Zisserman, “Convolutional two stream network fusion for video action recognition,” in IEEE Conf. on Computer Vision and Pattern Recognition, Las Vegas, USA, pp. 1933–1941, 2016. [Google Scholar]
39. A. Chattopadhay, A. Sarkar, P. Howlader and V. N. Balasubramanian, “Grad-CAM++: Generalized gradient-based visual explanations for deep convolutional networks,” in Proc. of 2018 IEEE Winter Conf. on Applications of Computer Vision, WACV 2018, Lake Tahoe, NV, USA, pp. 1–10, 2018. https://doi.org/10.1109/WACV.2018.00097 [Google Scholar] [CrossRef]
40. J. Chen, Y. Y. Lu, Q. Yu, X. Luo, E. Adeli et al., “TransUNet: Transformers make strong encoders for medical image segmentation,” arXiv preprint arXiv:2102.04306, vol. 23, no. 3, pp. 1–15, 2021. [Google Scholar]
41. C. Hu, Y. Wang, J. Chen, D. Jiang, X. Zhang et al., “Swin-Unet: Unet-like pure transformer for medical image segmentation,” arXiv preprint arXiv:2105.05537, vol. 4, no. 23, pp. 1–17, 2021. [Google Scholar]
42. A. M. Ali and A. Abdelhafeez, “DeepHAR-Net: A novel machine intelligence approach for human activity recognition from inertial sensors,” Sustainable Machine Intelligence Journal, vol. 1, no. 1, 2022. https://doi.org/10.61185/SMIJ.2022.8463 [Google Scholar] [CrossRef]
43. A. K. Jain, A. Yadav, M. Kumar, F. J. García-Peñalvo, K. T. Chui et al., “A cloud-based model for driver drowsiness detection and prediction based on facial expressions and activities,” International Journal of Cloud Applications and Computing (IJCAC), vol. 12, no. 1, pp. 1–17, 2022. [Google Scholar]
44. M. Muthuswamy, A. M. Ali and A. Abdelhafeez, “Breaking the silence: Convolutional neural networks for sign language recognition in the deaf community,” Sustainable Machine Intelligence Journal, vol. 1, no. 1, 2022. https://doi.org/10.61185/SMIJ.2022.7844 [Google Scholar] [CrossRef]
45. P. H. Dinh, “A novel approach based on marine predators algorithm for medical image enhancement,” Sensing and Imaging, vol. 24, no. 1, pp. 6–12, 2023. [Google Scholar]
Cite This Article
 Copyright © 2024 The Author(s). Published by Tech Science Press.
This work is licensed under a Creative Commons Attribution 4.0 International License , which permits unrestricted use, distribution, and reproduction in any medium, provided the original work is properly cited.
 Downloads
 Citation Tools