
 Submit a Paper
 Propose a Special lssue
 Open Access
ARTICLE
Nodule Detection Using Local Binary Pattern Features to Enhance Diagnostic Decisions
1 Faculty of Computer Science and Information Technology, The Superior University, Lahore, 54600, Pakistan
2 Intelligent Data Visual Computing Research (IDVCR), Lahore, 54600, Pakistan
3 Department of Computer Science, National University of Technology, Islamabad, 45000, Pakistan
4 Department of Radiological Sciences and Medical Imaging, College of Applied, Medical Sciences, Prince Sattam Bin Abdulaziz University, Al-Kharj, 16278, Saudi Arabia
5 Information Systems Department, College of Computer and Information Sciences, Imam Mohammad Ibn Saud Islamic University (IMSIU), Riyadh, 12571, Saudi Arabia
* Corresponding Author: Umar Rashid. Email:
(This article belongs to the Special Issue: Deep Learning in Medical Imaging-Disease Segmentation and Classification)
Computers, Materials & Continua 2024, 78(3), 3377-3390. https://doi.org/10.32604/cmc.2024.046320
Received 26 September 2023; Accepted 28 December 2023; Issue published 26 March 2024
 View Full Text
 Download PDF
Abstract
Pulmonary nodules are small, round, or oval-shaped growths on the lungs. They can be benign (noncancerous) or malignant (cancerous). The size of a nodule can range from a few millimeters to a few centimeters in diameter. Nodules may be found during a chest X-ray or other imaging test for an unrelated health problem. In the proposed methodology pulmonary nodules can be classified into three stages. Firstly, a 2D histogram thresholding technique is used to identify volume segmentation. An ant colony optimization algorithm is used to determine the optimal threshold value. Secondly, geometrical features such as lines, arcs, extended arcs, and ellipses are used to detect oval shapes. Thirdly, Histogram Oriented Surface Normal Vector (HOSNV) feature descriptors can be used to identify nodules of different sizes and shapes by using a scaled and rotation-invariant texture description. Smart nodule classification was performed with the XGBoost classifier. The results are tested and validated using the Lung Image Consortium Database (LICD). The proposed method has a sensitivity of 98.49% for nodules sized 3–30 mm.Keywords
The National Center for Health and Science claims that 150,000 human deaths are due to lung cancer [1]. In 2020, the US had 228,820 new cases of lung cancer were 135,270 lung cancer-related fatalities [2]. They described the current advancement and assessment of computer-aided diagnosis (CAD) for detecting lung nodules in CT [3]. A CT scan, however, provides a high number of images. To determine the nodule’s diameter, the doctor visualizes it with his naked eye. In some cases, the results could be incorrect and even lead to death. A CAD system can assist in diagnosing pulmonary nodules. In modern medicine, CAD technology has become a major research topic. To assist doctors in the early detection of cancer [4]. Lung cancer requires automatic lung nodule detection, which can provide classification and 3D information [5]. In CAD systems, image segmentation plays a very important role in the detection of nodules. It extracts the area of interest and location of the nodule. This increases the accuracy of medical data and faster the result to detect nodule detection based on multiscale feature fusion [6]. The significance of chest CT scans in the process of diagnosing lung cancer and correcting anomalies discovered in chest radiography [7]. The procedure of identifying lung nodules can be broken down into three primary stages: first enhancing and processing the images second extracting features, and third carrying out the actual detection. During the first stage of the process, operators are used on CT scans to emphasize particular elements that are contained within the area of interest (ROI), with the primary goal of determining the curvature of the lung while avoiding any unnecessary regions. Because of this, the search area is effectively reduced, which speeds up the nodule detection process. After that, the lungs are cut up into a series of tiny rectangular pieces so that the features may be extracted from each specific portion. After the traits have been retrieved, they are entered into a decision-making system so that it can determine whether or not there is a tumor present in that particular unit [8]. Some research has been conducted to investigate a wide variety of nodule detection methods. Some people looked at how successful hierarchical bit plane histograms and cumulative distribution functions were, but they ran into difficulties when trying to determine the ideal number of bins for the different kinds of images. Others have presented methods for image segmentation that apply morphological operators and make use of histograms and wavelet coefficients as effective descriptors. In addition, some individuals utilized local kernel regression models, often known as LKRMs, for the purpose of classifying lung nodule [9]. In one study, an active counter modeling strategy was presented for the purpose of segmenting and detecting lung nodules. This method utilized a support vector machine (SVM) for the purpose of classifying the nodules found in each lung. This article provides a detailed review of contemporary nodule detection approaches, with the goal of summing up current trends and forecasting upcoming issues in this domain [10]. The contribution of our proposed research work is:
• A new pulmonary nodule detection method was developed by combining a histogram of surface normal vectors with a scale-dependent textural description and improved local binary pattern features.
• An optimal thresholding method is used to segment lung volume, followed by Ant Colony optimization, label masking, background removal, and contour correction. 2D and 3D ROIs are used to detect candidate nodules.
• A classifier based on eXtreme Gradient Boosting (XGBoost) has been used to classify proposed features Novel Ensemble Shape Gradient Features (NESGF).
• Using a sampling of extracted nodules from the Lung Image Database Consortium (LIDC) dataset, we tested classifiers, extracted features, and extracted nodules for segmentation, nodule extraction, and feature extraction.
The manuscript is organized into five chapters, the second of which presents a detailed Literature Review. Suitable research and theories are discussed in detail. The third chapter offers a discussion of the Methodology, prefacing research approaches, and techniques; Chapter four enters into an examination of results with concise data analysis. The final fifth chapter draws together the main points, leaving readers with four key conclusions of this research and further areas for future exploration.
One common intensity-based detection method is the use of a threshold to define a nodule region of interest. The threshold is typically selected manually or automatically using a training set of images [11]. To further segment the nodule region from the surrounding lung parenchyma, region-growing or watershed segmentation methods are used. The study found that the 3D Automatic Lung Parenchyma Extraction and Border Repair (ALPEBR) method, which includes an Automatic Single Seeded Region Growing (ASSRG) and a 3D Spherical region-growing method (SPRG) [12]. There have been several traditional approaches to lung tumor segmentation before deep learning techniques were developed, such as thresholding, region-growing, and machine learning-based techniques [13] Nodule identification has been presented by [14] using single feed-forward approaches. Convolutional neural networks (CNNs) with dense connections were designed as one end-to-end 3D network. Neither post-processing nor user guidance is required to refine detection results using S4ND. Using 3D Deep Convolutional Neural Network (DCNNs) in computer vision and lung nodule detection, they show how the network compares with the current state-of-the-art object detection networks using U-Net and LSTM networks [15]. A decision-level technique was used to improve the classification of nodules using support vector machine (SVM) and Random Forest CNN architectures were used for the classification of nodules [16]. They presented a multi-task deep learning framework in which segmentation and physical location were identified using image bands [17]. Furthermore, they used the baseline approach and deep learning methods like Region-based Convolutional Network (RCNN) and U-net for the analysis of solar images and hole identification [18]. To solve many computational problems a probabilistic technique is required. ANT colony optimization algorithm solves problems like multitargeting and vehicle targeting [19]: The proposed method involves three steps: converting images into 3D, applying a blocking technique for informative block detection, segmenting the image for candidate selection of nodules, and performing classification [20]. They proposed the rolling ball algorithm to minimize the loss of juxtapleural nodules by applying the gray-level thresholding technique. Segmentation has been used to classify the nodule by removing the background which is separate from the thorax and lungs from the thorax to identify the candidate nodule detection [21]. They proposed the use of deep learning models, such as DeepLabV3+ and U-shaped networks, for lung segmentation and vessel segmentation in CT images [22]. They presented an ensemble method, which involves many classifiers to create and evaluate the predictive model. By employing the dataset on coronary artery disease, the present investigation showcases that the ensemble technique exhibits superior performance compared to other established methods for predicting the disease [23]. According to the evaluation of deep learning-based methods for multi-modal medical picture segmentation, the later fusion strategy has the potential to yield more accurate results than the early fusion strategy, provided that the fusion method is efficient enough [24]. They proposed an efficient approach for the categorization of gastrointestinal diseases by utilizing a pre-trained deep convolutional neural network [25]. This study presents a novel approach for the classification of gastrointestinal disorders by leveraging deep transfer learning and optimizing characteristics. The proposed technique demonstrates a notable enhancement in accuracy, obtaining a commendable rate of 96.43%. The utilization of Mask R-CNN for disease localization involves the implementation of fine-tuned ResNet-50 and ResNet-152 models to extract relevant features [26]. Firstly, classic techniques like thresholding and region-growing may face limitations in effectively delineating complex nodule boundaries or distinguishing them from surrounding tissues. Moreover, some strategies discussed might necessitate manual intervention or parameter adjustments, potentially yielding varied outcomes. The effectiveness of specific methods, particularly those predating deep learning advancements, may be influenced by factors like image quality and variations in nodule properties. Considering these limitations is imperative in real-world clinical applications, prompting a need to explore new directions for further refinement and improvement.
The number of pulmonary nodules in the right and left lungs are shown in Fig. 1. The proposed method is described below in a step-by-step manner:

Figure 1: The number of nodules in the right and left lungs
1. To segment the volume of the lungs, two-dimensional histograms are applied.
2. The ANT colony optimization algorithm is used to determine the optimal threshold.
3. To detect nodule candidates, the geometrical feature is used. For this purpose, a 2D images are used.
4. The histogram of oriented surface normal vectors (HOSNV) histogram is used to improve the feature for local binary patterns.
5. Nodules and non-nodules are distinguished using the XGBoost classifier.
In many applications, good threshold values have been selected to achieve high accuracy. Pulmonary nodules are classified into four components which are proposed in the methodology as shown in Fig. 2.

Figure 2: Proposed methodology
In the initial stage of the process, differential evolution optimization techniques are employed to obtain automatic threshold values for nodules, walls, and arteries within the lung volume. The method uses two-dimensional histogram technology, combining the steps of geometric feature extraction and arc delineation, along with extended arc extraction and ellipse detection to find all kinds of shapes in nodules from 3 mm up until about 20 mm. In addition, texture descriptions such as the histogram-oriented surface normal vectors (HOSNV) are introduced to differentiate between them. This makes use of intensity deviations in histograms from labeled CT scan images and plays into proposed intelligence-based statistical features.
Lung volume segmentation, crucial in medical imaging like CT and MRI, identifies and isolates lung regions for various purposes, such as detecting abnormalities and aiding in surgical planning. This process, emphasizing lung anatomy, involves extracting the candidate nodule and filtering extraneous areas for efficient nodule detection in CT examinations. The automated lung area segmentation involves the following steps:
1. The ANT optimization algorithm is utilized to obtain the initial mask with an optimal threshold value, referring to the refined version of the initial mask. This process enhances the original mask for improved results.
2. A 2D dimensional histogram method, based on thresholding, is employed to extract the lung region.
3. The full lung mask is acquired through lung outline enhancement.
The lung CT scan is divided into two main regions—low density (representing air) and high density (encompassing lung cavity) based on voxel density. Lung volume separation in the low-density area, essential for candidate nodule detection, necessitates adjusting the optimal threshold value due to variations in capturing machine images, with CT scans exhibiting −1000 Hounsfield Units (HU) for air attenuation. The dense region has a chest wall, bones, and blood with HU values of more than −500, and lung tissues range from −910 HU to −500 HU [27]. Initialize the threshold value T(0) and the optimal threshold value determined by initializing the threshold value of −500 HU which is changed recursively [28].
3.2 Two-Dimensional Histogram Based Thresh Holding Method
Pixels above the threshold are considered to be part of the foreground, while pixels below the threshold are considered to be part of the background. There is only one line and one dimension to this method. By maximizing the square difference between the mean projections,
In Fisher Linear Discriminant analysis, the difference between two classes and maximizing the square differences between the projected means did not work. Therefore, it simultaneously minimizes the project scatter within each class s1 and s2 as shown in Eq. (1). It maximizes the difference between projections and minimizes the scatter. Threshold holding can be determined by the Fisher linear optimal discriminant analysis function. To further utilize image part space information, threshold holding based on Fisher Criteria is proposed. This method is summarized in the following manner [30]. Since a 2D histogram will always have two apparent peaks, no matter what the signal-to-noise ratio is, it is easy to select the threshold that separates the object from the background to improve 2D histogram-based thresholding, a binary-coded ant colony algorithm is used. We will explain them briefly in the following section.
3.3 Ant Colony Optimization Algorithm
Computational problems are solved probabilistically using ant colony optimization (ACO). There is a comparison of the performance of ACO for both continuous and discrete optimization problems in [31]. According to the authors, the 2D Fisher criterion function is used as the thresholding criterion in an algorithm for thresholding images based on ant colony optimization. Parallel computing performance allows Ant Colony Optimization (ACO) to achieve optimal results. Some applications use Binary-coded Ant Colony Optimization (BACO) to solve continuous optimization problems in the continuous domain [32]. We have the following movement probability as a function of the ant “k”, which determines the direction and concentration of the pheromone in different routes [32].
The following are the steps of the ACO algorithm:
1. The starting model is produced randomly.
2. Input the optimal solution if the ending criteria are satisfied.
3. ANT search.
4. To calculate the optimal solution based on the result of the ant colony algorithm.
5. Update that phenomenon using the optimal solution or proceed to step 2.
The “
A 3D model is created for extracting nodule images, and the model is searched for objects similar to prismatic nodules. The 2D lung region dataset is stacked and transformed into a 3D lung volume dataset using the two-dimensional lung regions. To calculate the volume of each connected group, we count the pixels and convert their dimensions to cubic millimeters. Each lung has a pulmonary vessel tree composed of the longest connected structures. As part of this vessel group, juxtavascular nodules are also included. Nodules that are isolated or juxtapleural are categorized as non-vessels and stored. There are two types of nodules: vessel nodules and non-vessel nodules. There are three groups of tissue in the segmented lungs. The first is the vessel group, which includes nodules, juxtavascular nodules, and soft tissue structures. Nodules attached to vessels are known as juxtavascular nodules. Secondly, some nodules were isolated or juxtapleural that did not belong to the vessel group. A nodule has a maximum dimension of 2.43
Due to the discussed ranges of diameter and volume, nodules outside those specifications are relatively easy to exclude or separate. Depending on their location, isolated nodules, and juxtapleural nodules are described. Similarly, non-vessel groups perceive isolated and juxtapleural nodule candidates. Nodule-size, geometric, and shape constraints are satisfied when excluding non-nodule soft-tissue structures.
Feature values classify candidate nodules. An accurate, useable feature set is even more critical in this scenario. We provide a hybrid feature descriptor based on scale and rotation-invariant texture descriptions and a Histogram of Oriented Surface Normal Vectors. Fig. 3 illustrates the segmentation technique’s improvement. It allows direct comparison between the original and segmented lung parts, proving the approach accurately delineates lung components from the surrounding context.

Figure 3: Results of the proposed method for lung segmentation
3.5.1 Histogram of Oriented Surface Normal Vectors (HOSNV) Feature Descriptor
A histogram of orientation angles is combined into one HOSNV by concatenating the histograms. Tangent planes that correspond to objects encode surface information using normal vectors. An object’s surface corresponds to the tangent plane. The point
3.5.2 Scale and Rotation-Invariant Texture Description with Improved Local Binary Pattern Feature
The radius R defines the distance between central pixels. LBP has three additional parameters radius, the central pixel value, and the neighbor (X, Y). As a result, the original LBP features are not scale-invariant when rescaled. It is possible to measure local maxima using the Laplacian of Gaussian by measuring the pixels around the center pixel, which provide different LPB codes and those surrounding are invariant. The function L (x, y, σ) represents the various scale levels within an image. Which provides the convolution image I (x, y) as shown in the Eq. (4), where G (x, y, σ) represents the variable scale Gaussian. In Eq. (4), for every pixel (x, y) the maximum response of
In the LBP Eq. (4) circular neighboring
Circular neighbors of the image pixel in the LBP Eq. (5). LBP updated Eq. (6) is defined as follows:
The rotational invariance of LBP features can be demonstrated with a scale-adaptive descriptor. Codes derived from fixed points are common in traditional LBP [30] Fig. 5 shows that LBP codes are used in adjacent blocks. Scale-invariant computation is performed by creating Gaussian smoothed images with the characteristic scales of each central pixel,
3.6 Classification Using the XGBoost Method
There are some similarities between Gradient Boost and XGBoost, but there are also a few tricks up its sleeve that set it apart from the others. As far as performance and speed are concerned, it has proven itself to be an excellent choice. As one of the most effective and scalable machine learning systems for tree boosting.
To find the optimal tree structure for classification, Eq. (8) is used as a scoring function. It is not practicable, however, to search through every possible tree structure q. The following function can determine whether a split should be added to the existing tree structure:
where IL and IR are the instance sets of left and right nodes after the split in Eq. (9). XGBoost is a fast implementation of the GB algorithm, which has the advantages of fast speed and high accuracy.
We evaluate the proposed system using the LIDC database [34]. The evaluation was based on 59 CT scans. Per scan, there are approximately 200 slices, each with 512 pixels by 512 pixels and 4096 gray levels. The database has pixels between 0.5 and 0.76 mm in size and reconstruction intervals between 1 and 3 mm. A total of 389 nodules and 10,712 slices are included. There are nodules with diameters ranging from 3 to 30 millimeters and 3 to 30 mm. Some ratios have been tested, as well as different features, and then, classification has been conducted using the XGBoost classifier. To make sure that there is no bias toward overtraining or undertraining, we divided the data into 50–50 ratios that were used as training data and testing data to demonstrate our results. XGBoost and other classifiers were used to test the proposed features, as shown in Table 1. Compared to all other classifiers, XGBoost performs better. The performance of classifiers is assessed using three key measures: Accuracy, Sensitivity, and Specificity, calculated based on the counts of true positives (TP), false positives (FP), false negatives (FN), and true negatives (TN) in the classification of nodules. This shows that the proposed feature is best for classifying nodules as shown in Fig. 4.
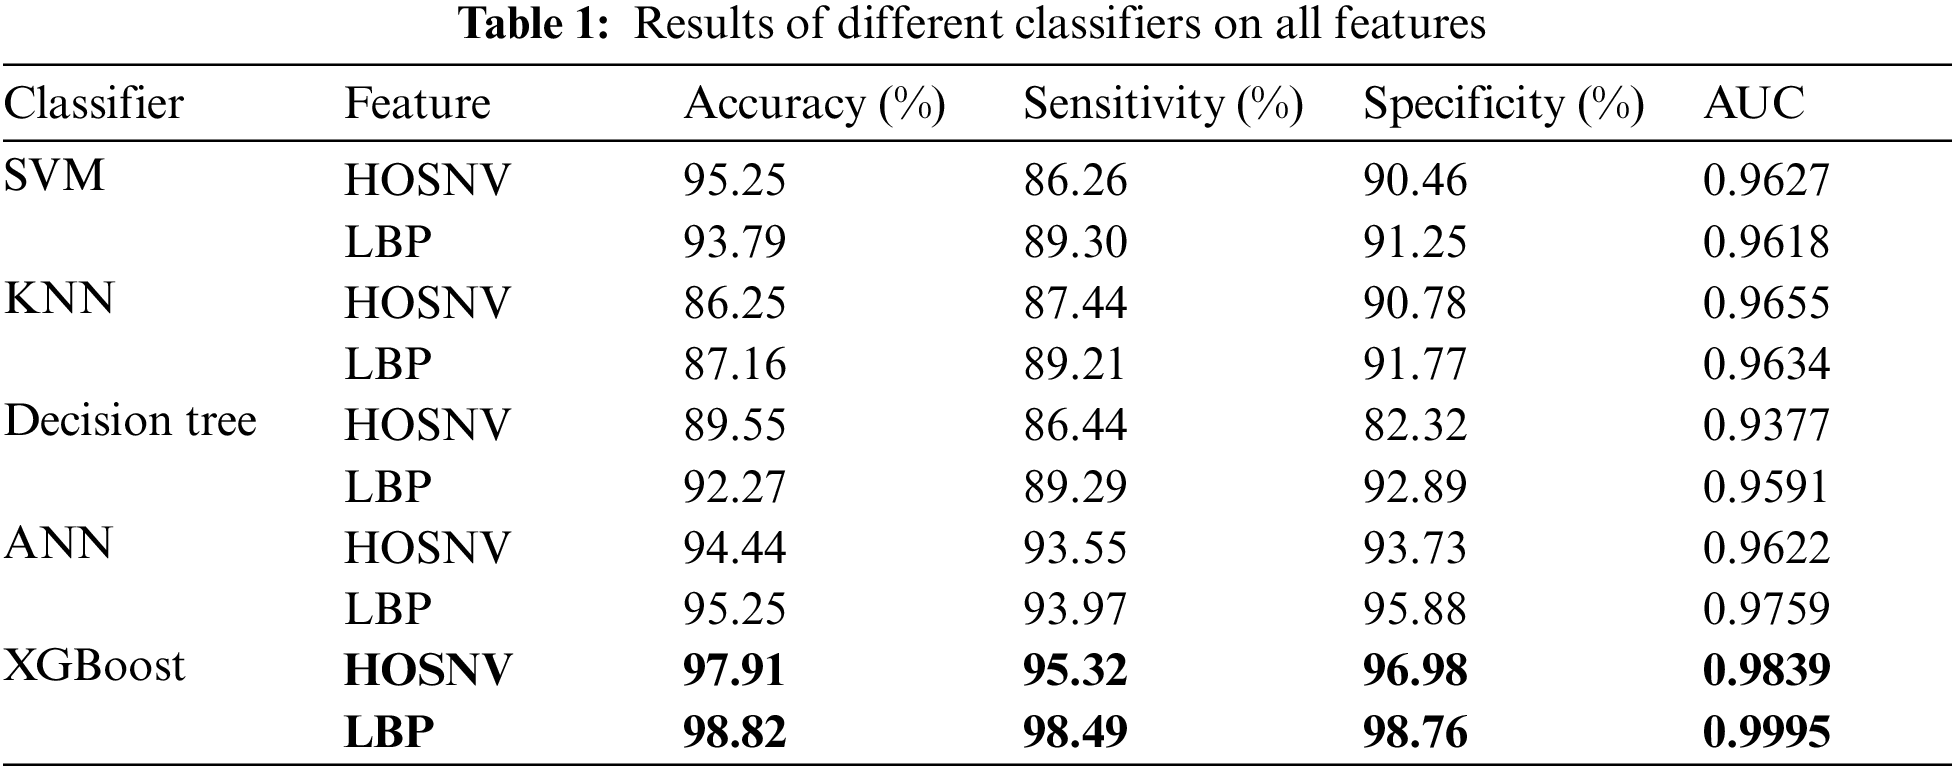

Figure 4: Results of different classifiers on all features
Using all three feature types and different classifiers, compared to earlier existing techniques, the proposed method has a sensitivity of 98.49 for nodules sized 3–30 mm. As a result of the HOSNV and LBP features proposed in the proposed method and random forest, the proposed method performs better as shown in Fig. 4.
Based on proposed NESGF features, random forest-based classification is used for comparison with other existing methods. From the results in Table 2 and Fig. 5, segmentation clearly plays a crucial role in improving performance. This proposed method distinguishes lung nodules from walls and vessels with fuzzy c-means (FCM) clustering by integrating 2D and 3D images. With a hybrid feature descriptor based on shape information, combined with gradient features in an NESGF format it is more effective than existing methods.
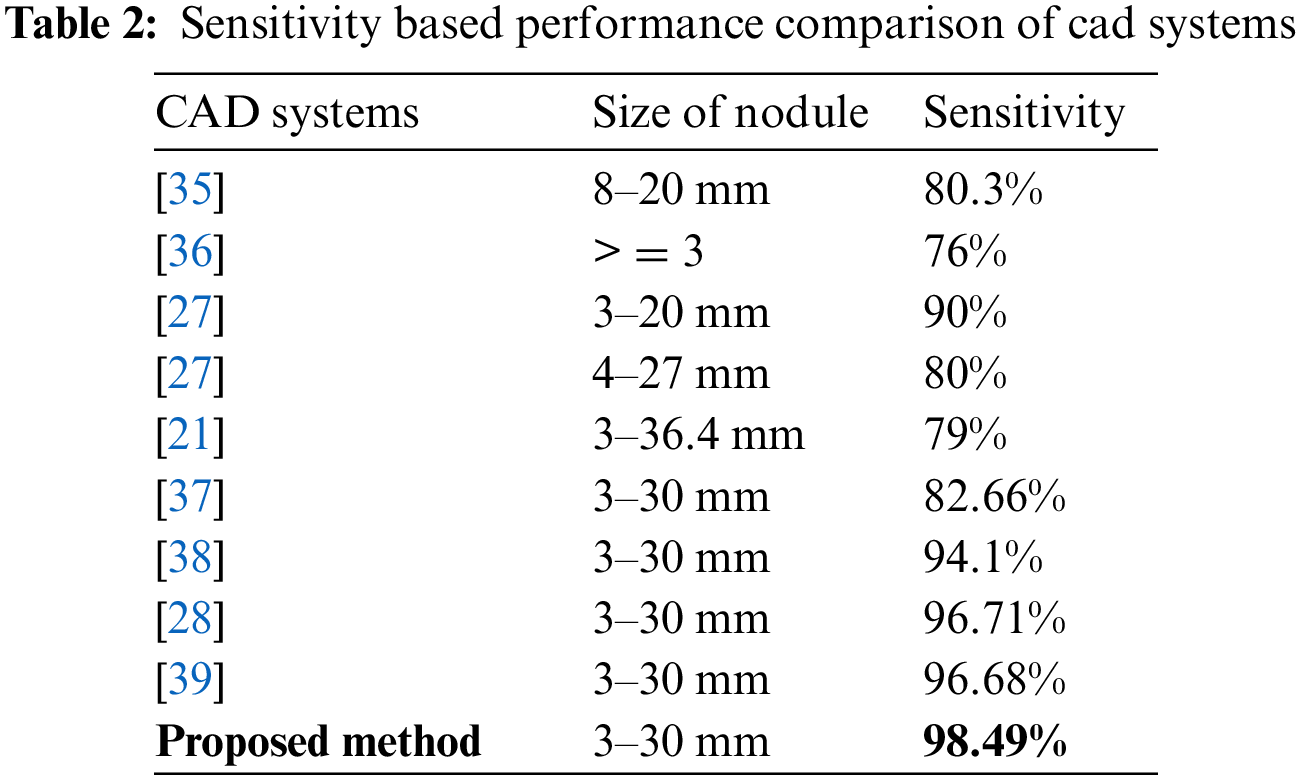

Figure 5: Sensitivity based performance comparison of cad systems
A novel method for detecting pulmonary nodules was developed by combining a histogram of surface normal vectors with a scale-dependent textural description and improved local binary pattern features. The proposed paradigm facilitates easier medical and diagnostic decisions. An optimal thresholding method is employed to segment lung volume, followed by Ant Colony optimization, label masking, background removal, and contour correction. 2D and 3D Regions of Interest (ROIs) are utilized for detecting candidate nodules. A classifier based on XGBoost is employed to classify proposed features NESGF. Testing involved classifiers, extracted features, and extracted nodules from the LIDC dataset for segmentation, nodule extraction, and feature extraction. The classifier results indicate 98.49% accuracy in category classification, with 98.82% sensitivity. In comparison with conventional descriptors, our proposed feature descriptor performs superiorly, as demonstrated by the results. We plan to explore deeper learning techniques in the future and test the proposed method on other datasets.
Acknowledgement: I acknowledge the facilitates provided by the Superior University to conduct this research.
Funding Statement: No funding available.
Author Contributions: The authors confirm contribution to the paper as follows: study concept and design: U. Rashid, A. Jaffer, M. Rashid, M. S. Alshuhri and S. Akram; data collection: U. Rashid, A. Jaffar and S. Akram; methodology: U. Rashid, A. Jaffar, M. Rashid, M. S. Alshuhri and S. Akram; analysis and interpretation of results: U. Rashid, A. Jaffar and S. Akram; draft manuscript preparation: U. Rashid, A. Jaffar, M. Rashid, M. S. Alshuhri and S. Akram. All authors reviewed the results and approved the final version of the manuscript.
Availability of Data and Materials: The dataset used in this research, sourced from LIDC, is available at https://wiki.cancerimagingarchive.net/pages/viewpage.action?pageId=1966254 for further examination and verification.
Conflicts of Interest: The authors declare that they have no conflicts of interest to report regarding the present study.
References
1. A. Sali and K. Ried, “Innovative cancer research and treatments at the national institute of integrative medicine,” J. Australas. Coll. Nutr. Environ. Med., vol. 41, no. 4, pp. 43–50, 2022. [Google Scholar]
2. K. W. Jung et al., “Cancer statistics in Korea: Incidence, mortality and survival in 2006–2007,” J. Korean Med. Sci., vol. 25, no. 8, pp. 1113–1121, 2010. doi: 10.3346/jkms.2010.25.8.1113. [Google Scholar] [PubMed] [CrossRef]
3. S. Zia, M. A. Jaffar, and T. Choi, “Morphological gradient based adapted selective filter for removal of rician noise from magnetic resonance images,” Microsc. Res. Tech., vol. 75, no. 8, pp. 1044–1050, 2012. doi: 10.1002/jemt.22029. [Google Scholar] [PubMed] [CrossRef]
4. A. A. Alsheikhy, Y. Said, T. Shawly, A. K. Alzahrani, and H. Lahza, “A CAD system for lung cancer detection using hybrid deep learning techniques,” Diagnostics, vol. 13, no. 6, pp. 1174, 2023. doi: 10.3390/diagnostics13061174. [Google Scholar] [PubMed] [CrossRef]
5. P. Dutande, U. Baid, and S. Talbar, “LNCDS: A 2D-3D cascaded CNN approach for lung nodule classification, detection and segmentation,” Biomed. Signal Process. Control, vol. 67, no. 6, pp. 102527, 2021. doi: 10.1016/j.bspc.2021.102527. [Google Scholar] [CrossRef]
6. Y. Zhao et al., “Pulmonary nodule detection based on multiscale feature fusion,” Comput. Math. Methods Med., vol. 2022, no. 41, pp. 1–13, 2022. doi: 10.1155/2022/8903037. [Google Scholar] [PubMed] [CrossRef]
7. J. Ferlay et al., “GLOBOCAN 2012 v1. 0, cancer incidence and mortality worldwide,” IARC Cancerbase, vol. 11, pp. 16–27, 2013. [Google Scholar]
8. P. Lobo and S. Guruprasad, “Classification and segmentation techniques for detection of lung cancer from CT images,” in 2018 Int. Conf. Invent. Res. Comput. Appl. (ICIRCA), IEEE, 2018, pp. 1014–1019. [Google Scholar]
9. G. Wei et al., “Lung nodule classification using local kernel regression models with out-of-sample extension,” Biomed. Signal Process. Control, vol. 40, no. 1, pp. 1–9, 2018. doi: 10.1016/j.bspc.2017.08.026. [Google Scholar] [CrossRef]
10. M. Keshani, Z. Azimifar, F. Tajeripour, and R. Boostani, “Lung nodule segmentation and recognition using SVM classifier and active contour modeling: A complete intelligent system,” Comput. Biol. Med., vol. 43, no. 4, pp. 287–300, 2013. doi: 10.1016/j.compbiomed.2012.12.004. [Google Scholar] [PubMed] [CrossRef]
11. R. J. Suji, S. S. Bhadouria, J. Dhar, and W. W. Godfrey, “Optical flow methods for lung nodule segmentation on LIDC-IDRI images,” J. Digit. Imaging, vol. 33, no. 5, pp. 1306–1324, 2020. doi: 10.1007/s10278-020-00346-w. [Google Scholar] [PubMed] [CrossRef]
12. S. N. A. M. Sabri and N. S. Mohamad, “Evaluation of thresholding and region growing techniques in segmenting lung nodules in computed tomography images: A systematic review,” Heal. Off. Res. B. Fac. Heal. Sci. UiTM, vol. 3, no. 3, pp. 1–5, 2020. [Google Scholar]
13. E. S. Biratu, F. Schwenker, Y. M. Ayano, and T. G. Debelee, “A survey of brain tumor segmentation and classification algorithms,” J. Imaging, vol. 7, no. 9, pp. 179, 2021. doi: 10.3390/jimaging7090179. [Google Scholar] [PubMed] [CrossRef]
14. N. Khosravan, “Collaborative artificial intelligence algorithms for medical imaging applications,” Ph.D. dissertation, Univ. of Central Florida, USA, 2019. [Google Scholar]
15. S. A. Agnes, J. Anitha, and A. A. Solomon, “Two-stage lung nodule detection framework using enhanced UNet and convolutional LSTM networks in CT images,” Comput. Biol. Med., vol. 149, no. 2S, pp. 106059, 2022. doi: 10.1016/j.compbiomed.2022.106059. [Google Scholar] [PubMed] [CrossRef]
16. Y. Gu et al., “A survey of computer-aided diagnosis of lung nodules from CT scans using deep learning,” Comput. Biol. Med., vol. 137, pp. 104806, 2021. doi: 10.1016/j.compbiomed.2021.104806. [Google Scholar] [PubMed] [CrossRef]
17. D. Yu et al., “Detection of peripherally inserted central catheter (PICC) in chest X-ray images: A multi-task deep learning model,” Comput. Methods Programs Biomed., vol. 197, no. 8, pp. 105674, 2020. doi: 10.1016/j.cmpb.2020.105674. [Google Scholar] [PubMed] [CrossRef]
18. M. Almahasneh, A. Paiement, X. Xie, and J. Aboudarham, “MLMT-CNN for object detection and segmentation in multi-layer and multi-spectral images,” Mach. Vis. Appl., vol. 33, no. 1, pp. 1–15, 2022. doi: 10.1007/s00138-021-01261-y. [Google Scholar] [CrossRef]
19. R. Singh and B. Bhushan, “Improved ant colony optimization for achieving self-balancing and position control for balancer systems,” J. Ambient Intell. Humaniz. Comput., vol. 12, no. 8, pp. 8339–8356, 2021. doi: 10.1007/s12652-020-02566-y. [Google Scholar] [CrossRef]
20. X. Jiang, Z. Hu, S. Wang, and Y. Zhang, “Deep learning for medical image-based cancer diagnosis,” Cancers, vol. 15, no. 14, pp. 3608, 2023. doi: 10.3390/cancers15143608. [Google Scholar] [PubMed] [CrossRef]
21. B. Sahiner et al., “Effect of CAD on radiologists’ detection of lung nodules on thoracic CT scans: Analysis of an observer performance study by nodule size,” Acad. Radiol., vol. 16, no. 12, pp. 1518–1530, 2009. doi: 10.1016/j.acra.2009.08.006. [Google Scholar] [PubMed] [CrossRef]
22. L. Zhi, W. Jiang, S. Zhang, and T. Zhou, “Deep neural network pulmonary nodule segmentation methods for CT images: Literature review and experimental comparisons,” Comput. Biol. Med., vol. 164, pp. 107321, 2023. doi: 10.1016/j.compbiomed.2023.107321. [Google Scholar] [PubMed] [CrossRef]
23. Y. Y. Ghadi, I. Akhter, S. A. Alsuhibany, T. al Shloul, A. Jalal and K. Kim, “Multiple events detection using context-intelligence features,” Intell. Autom. Soft Comput., vol. 34, no. 3, pp. 1455–1471, 2022. doi: 10.32604/iasc.2022.025013. [Google Scholar] [PubMed] [CrossRef]
24. T. Zhou, Q. Cheng, H. Lu, Q. Li, X. Zhang and S. Qiu, “Deep learning methods for medical image fusion: A review,” Comput. Biol. Med., vol. 160, pp. 106959, 2023. doi: 10.1016/j.compbiomed.2023.106959. [Google Scholar] [PubMed] [CrossRef]
25. M. N. Noor, M. Nazir, S. A. Khan, O. Y. Song, and I. Ashraf, “Efficient gastrointestinal disease classification using pretrained deep convolutional neural network,” Electron., vol. 12, no. 7, pp. 1557, 2023. doi: 10.3390/electronics12071557. [Google Scholar] [CrossRef]
26. M. Alhajlah, M. N. Noor, M. Nazir, A. Mahmood, I. Ashraf and T. Karamat, “Gastrointestinal diseases classification using deep transfer learning and features optimization,” Comput. Mater. Contin., vol. 75, no. 1, pp. 2227–2245, 2023. doi: 10.32604/cmc.2023.031890. [Google Scholar] [PubMed] [CrossRef]
27. J. Dehmeshki, X. Ye, X. Lin, M. Valdivieso, and H. Amin, “Automated detection of lung nodules in CT images using shape-based genetic algorithm,” Comput. Med. Imaging Graph., vol. 31, no. 6, pp. 408–417, 2007. doi: 10.1016/j.compmedimag.2007.03.002. [Google Scholar] [PubMed] [CrossRef]
28. W. J. Choi and T. S. Choi, “Automated pulmonary nodule detection system in computed tomography images: A hierarchical block classification approach,” Entropy, vol. 15, no. 2, pp. 507–523, 2013. doi: 10.3390/e15020507. [Google Scholar] [CrossRef]
29. H. S. Helm, W. Yang, A. de Silva, J. T. Vogelstein, and C. E. Priebe, “Approximately optimal domain adaptation with Fisher’s linear discriminant analysis,” arXiv Prepr. arXiv:2302.14186, 2023. [Google Scholar]
30. C. N. Li, Y. H. Shao, W. Yin, and M. Z. Liu, “Robust and sparse linear discriminant analysis via an alternating direction method of multipliers,” IEEE Trans. Neur. Netw. Learn. Syst., vol. 31, no. 3, pp. 915–926, 2019. doi: 10.1109/TNNLS.2019.2910991. [Google Scholar] [PubMed] [CrossRef]
31. M. G. H. Omran and S. Al-Sharhan, “Improved continuous ant colony optimization algorithms for real-world engineering optimization problems,” Eng. Appl. Artif. Intell., vol. 85, no. 2, pp. 818–829, 2019. doi: 10.1016/j.engappai.2019.08.009. [Google Scholar] [CrossRef]
32. H. Gezici and H. Livatyali, “An improved Harris Hawks optimization algorithm for continuous and discrete optimization problems,” Eng. Appl. Artif. Intell., vol. 113, no. 1, pp. 104952, 2022. doi: 10.1016/j.engappai.2022.104952. [Google Scholar] [CrossRef]
33. Q. Kou, D. Cheng, L. Chen, and Y. Zhuang, “Principal curvatures based local binary pattern for rotation invariant texture classification,” Optik, vol. 193, no. 11, pp. 162999, 2019. doi: 10.1016/j.ijleo.2019.162999. [Google Scholar] [CrossRef]
34. A. P. Reeves et al., “The lung image database consortium (LIDCA comparison of different size metrics for pulmonary nodule measurements,” Acad. Radiol., vol. 14, no. 12, pp. 1475–1485, 2007. doi: 10.1016/j.acra.2007.09.005. [Google Scholar] [PubMed] [CrossRef]
35. K. Suzuki, S. G. Armato III, F. Li, S. Sone, and K. Doi, “Massive training artificial neural network (MTANN) for reduction of false positives in computerized detection of lung nodules in low-dose computed tomography,” Med. Phys., vol. 30, no. 7, pp. 1602–1617, 2003. doi: 10.1118/1.1580485. [Google Scholar] [PubMed] [CrossRef]
36. G. D. Rubin et al., “Pulmonary nodules on multi-detector row CT scans: Performance comparison of radiologists and computer-aided detection,” Radiol., vol. 234, no. 1, pp. 274–283, 2005. doi: 10.1148/radiol.2341040589. [Google Scholar] [PubMed] [CrossRef]
37. T. Messay, R. C. Hardie, and S. K. Rogers, “A new computationally efficient CAD system for pulmonary nodule detection in CT imagery,” Med. Image Anal., vol. 14, no. 3, pp. 390–406, 2010. doi: 10.1016/j.media.2010.02.004. [Google Scholar] [PubMed] [CrossRef]
38. W. J. Choi and T. S. Choi, “Genetic programming-based feature transform and classification for the automatic detection of pulmonary nodules on computed tomography images,” Inf. Sci., vol. 212, pp. 57–78, 2012. doi: 10.1016/j.ins.2012.05.008. [Google Scholar] [CrossRef]
39. S. Akram, M. Javed, U. Qamar, A. Khanum, and A. Hassan, “Artificial neural network based classification of lungs nodule using hybrid features from computerized tomographic images,” Appl. Math. Inf. Sci., vol. 9, no. 1, pp. 183–195, 2014. doi: 10.12785/amis/090124. [Google Scholar] [CrossRef]
Cite This Article
 Copyright © 2024 The Author(s). Published by Tech Science Press.
This work is licensed under a Creative Commons Attribution 4.0 International License , which permits unrestricted use, distribution, and reproduction in any medium, provided the original work is properly cited.
 Downloads
 Citation Tools