
 Submit a Paper
 Propose a Special lssue
 Open Access
ARTICLE

Improving Thyroid Disorder Diagnosis via Ensemble Stacking and Bidirectional Feature Selection
1 Department of Computer and Information System, Cleveland State University, Ohio, 44115, USA
2 Department of Electrical, Electronics and Computer Systems, College of Engineering and Technology, University of Sargodha, Sargodha, 40100, Pakistan
3 Department of Mechanical Engineering, College of Engineering, King Faisal University, Al-Ahsa, 31982, Saudi Arabia
4 Department of Biomedical Engineering, Riphah International University, Islamabad, 44000, Pakistan
5 Department of Electrical Engineering, Riphah International University, Islamabad, 44000, Pakistan
6 Department of Information Technology, College of Computer and Information Sciences, Princess Nourah bint Abdulrahman University, P.O. Box 84428, Riyadh, 11671, Saudi Arabia
7 Department of Artificial Intelligence, College of Software and Convergence Technology, Sejong University, Seoul, 05006, Korea
* Corresponding Author: Maali Alabdulhafith. Email:
Computers, Materials & Continua 2024, 78(3), 4225-4241. https://doi.org/10.32604/cmc.2024.047621
Received 11 November 2023; Accepted 01 February 2024; Issue published 26 March 2024
 View Full Text
 Download PDF
Abstract
Thyroid disorders represent a significant global health challenge with hypothyroidism and hyperthyroidism as two common conditions arising from dysfunction in the thyroid gland. Accurate and timely diagnosis of these disorders is crucial for effective treatment and patient care. This research introduces a comprehensive approach to improve the accuracy of thyroid disorder diagnosis through the integration of ensemble stacking and advanced feature selection techniques. Sequential forward feature selection, sequential backward feature elimination, and bidirectional feature elimination are investigated in this study. In ensemble learning, random forest, adaptive boosting, and bagging classifiers are employed. The effectiveness of these techniques is evaluated using two different datasets obtained from the University of California Irvine-Machine Learning Repository, both of which undergo preprocessing steps, including outlier removal, addressing missing data, data cleansing, and feature reduction. Extensive experimentation demonstrates the remarkable success of proposed ensemble stacking and bidirectional feature elimination achieving 100% and 99.86% accuracy in identifying hyperthyroidism and hypothyroidism, respectively. Beyond enhancing detection accuracy, the ensemble stacking model also demonstrated a streamlined computational complexity which is pivotal for practical medical applications. It significantly outperformed existing studies with similar objectives underscoring the viability and effectiveness of the proposed scheme. This research offers an innovative perspective and sets the platform for improved thyroid disorder diagnosis with broader implications for healthcare and patient well-being.Keywords
Thyroid dysfunction mostly affects people over the age of 70 by affecting both genders with females as the primary affectees of this disease. Thyroid illness has become a major public health concern across the globe, impacting a significant number of individuals. About 42 million Indians are thought to have thyroid problems [1]. In the United States, 1.2% of the population, or one in every 100 people have hyperthyroidism, while 4.2% had hypothyroidism between 1976 and 1990. The corresponding figure for Germany was 6% in 2000 and later improved to 2.6% between 2005 to 2012. Similarly, positive cases were recorded at a rate of 7.6% in Iran from 2003 to 2006, rising to 18.5% between 2012 and 2014. In Wales, 20.8% (1997–2005) were diagnosed, which reduced to 6.5% from 2006 to 2007. From 2007 to 2011, 33.5% of hypothyroidism cases in Spain were recorded [2].
The butterfly-shaped thyroid gland near the base of the neck produces triiodothyronine (T3) and thyroxine (T4) to regulate heart rate, blood pressure, and body temperature. Iodine shortage or other factors can cause thyroid diseases, which release hormones into the bloodstream to maintain hydration, balance, and digestion. T3, thyroid-stimulating hormone (TSH), and T4 hormones are used to examine thyroid functionality with hypothyroidism and hyperthyroidism as two main thyroid diseases [3]. Weight increase and moderate pulse rate result from hypothyroidism, while weight loss and rapid heartbeat result from hyperthyroidism. TSH, T4, and T3 blood tests are common for diagnosis. Diagnosing hypothyroidism helps with joint discomfort, cardiac problems, and obesity. Cognitive and respiratory issues can result from late diagnosis [4]. It is frequent in women and can cause fertility troubles and myxedema which is a life-threatening illness. Thus, this study helps to detect hypothyroidism at an early stage for saving lives. It also motivates clinicians and doctors to use data to detect hypothyroidism-related health issues earlier [5]. There are multiple machine learning (ML)-based thyroid detection approaches in addition to clinical examination. In this effort, several studies have examined the effectiveness of ML-based techniques [1,2]. For example, k-nearest neighbors (KNN), Bayesian classifiers, and support vector machines (SVM) were used to diagnose thyroid diseases in thyroid nodule ultrasound images [6]. The radial basis function neural networks (RBFNN) and multi-layer perceptron (MLP) were employed to accurately classify thyroid diseases [7]. Much of the literature addresses binary classification problems like distinguishing thyroid patients and healthy individuals from the data. Few multiclass identification investigations have been done on thyroid datasets. Classifying problems by patient health status helps diagnose and treat thyroid diseases. The datasets were categorized as “normal”, “hypothyroid”, and “hyperthyroid”. ML and deep learning (DL) model optimization receive most of the research focus but feature selection approaches for thyroid ailment diagnosis are less explored. The stacking ensemble models are not employed for thyroid disease classification. This research addresses these issues with the following main contributions:
• A multilayer ensemble is introduced which combines the predictions from three popular ensemble classifiers. The proposed method achieved remarkable results on both employed datasets. Performance evaluation includes statistical testing, loss/error analysis, and confusion matrix-based indicators.
• This study assesses the effectiveness of three feature selection methods for addressing the issue. These methods use dataset feature-response relevance estimates to produce feature significance scores. Both datasets are preprocessed using Z-score-based Boruta-SHapley Additive exPlanations (BorutaSHAP) attribute importance to extract relevant feature information before feature selection. This study is examined in multiple ways; with sequential feature selection (WSFS), also known as forward attribute selection, with sequential feature backward elimination (WSFBE), and with bidirectional feature selection (WBDFS), as well as without attribute selection (WOAS).
• Since many studies only examined one dataset it is highly probabilistic that the models only perform well on that dataset. The literature rarely reports the suggested methodology’s consistent performance on numerous datasets. This study used diverse thyroid illness datasets and provided a technique that works across multiple datasets.
Previous studies have proven that classification is a crucial strategy for forecasting and identifying many illnesses, such as heart disease, breast cancer, lung cancer, and thyroid conditions [8,9]. The analysis of the literature showed that in comparison to other illnesses, thyroid conditions are comparatively under-addressed which requires further exploration in terms of intelligent diagnosis schemes [10,11]. Few studies have employed ML and DL methods for predicting thyroid illness because of recent developments in data processing and computing. Early diagnosis and categorization of this condition as either malignancy, hypothyroidism, or hyperthyroidism aid in prompt treatment and recovery.
The Toxicity Forecaster (ToxCast) database and pertinent research publications provided training datasets. Along with statistical methodologies and ML methods including random forest (RF), SVM, and artificial neural networks (ANN), three data-balancing procedures were tested. The models were calibrated using holdout data after molecular descriptor and fingerprint training. The classifiers had 83% and 81% F1-scores on the holdout dataset [12]. Another study used two thyroid datasets: One from Knowledge Extraction based on Evolutionary Learning (KEEL) repository and one from a Pakistani hospital. The new dataset had three new properties to distinguish it from earlier ones. KNN model performance was assessed on these two datasets using various distance measures. The use of ML models to identify hyperthyroid and hypothyroid-affected individuals was discussed. Predictions of hyperthyroidism and hypothyroidism were shown to have an accuracy of 93.8% and 90.9%, respectively, according to the data collected in this research [13]. Thyroid prediction on a dataset of the UCI-MLR using an XGBoost (XGB) model is shown in a study [14]. When compared to the prediction performance of KNN, decision trees (DT), and logistic regression (LR), the suggested model was shown to have the highest accuracy with XGB.
A research work [15] investigated multiple ML models for thyroid disease detection. It utilized Naive Bayes (NB), KNN, SVM, and LR to classify the data. The SVM was the most accurate approach. Another study [16] discussed a thorough examination of many classifiers, including KNN, SVM, NB, DT, and LR applied with L1 and L2 or without feature selection approaches. The results showed that classifiers with L1-based feature selection had greater overall efficiency (NB 100%, LR 100%). Another research [17] employed multiple ML models to classify the thyroid illness data using ANN, KNN, XGB, RF, DT, and NB. The highest results of thyroid prediction were achieved by ANN with 98.57% accuracy, 95.7% precision, 95.9% recall, and 95.7% F1-score. Few studies [10,18] focused on the necessary preprocessing of thyroid datasets, and three attribute selection approaches namely select K-best, select from model (SFM), and recursive feature elimination (RFE). As feature estimators, DT, gradient boost (GB), LR, and RF were employed. Homogeneous ensemble-activated boosting and bagging-based classifiers were evaluated using the voting ensemble namely soft and hard voting. These works achieved remarkable results with accuracies of 99.27% [10] and 100% [18]. In [19], ML methods such as DT, RF, KNN, and ANN are used to better predict illness based on dataset parameters. Both unsampled and sampled datasets were classified for better comparability. After dataset modification, RF achieved 94.8% accuracy and 91% specificity. In a study [20], the hypothyroid and hyperthyroid conditions were detected using SVM, DT, RF, LR, and NB classifiers. Principal component analysis (PCA), univariate feature selection, and RFE-based attribute selection approaches were applied. All the classifiers with RFE feature selection achieved an accuracy of 99.35% for the classification of thyroid disorders. Another research [21] was done to predict thyroid illness classification using dimensionality-reduced data. Data augmentation was used to create enough data to train deep neural network (DNN) models. The two-stage technique offers 99.95% accuracy. It has been observed that few studies have focused on feature engineering along with ML and DL-based classification models for thyroid prediction which shows the need for further investigation in this area.
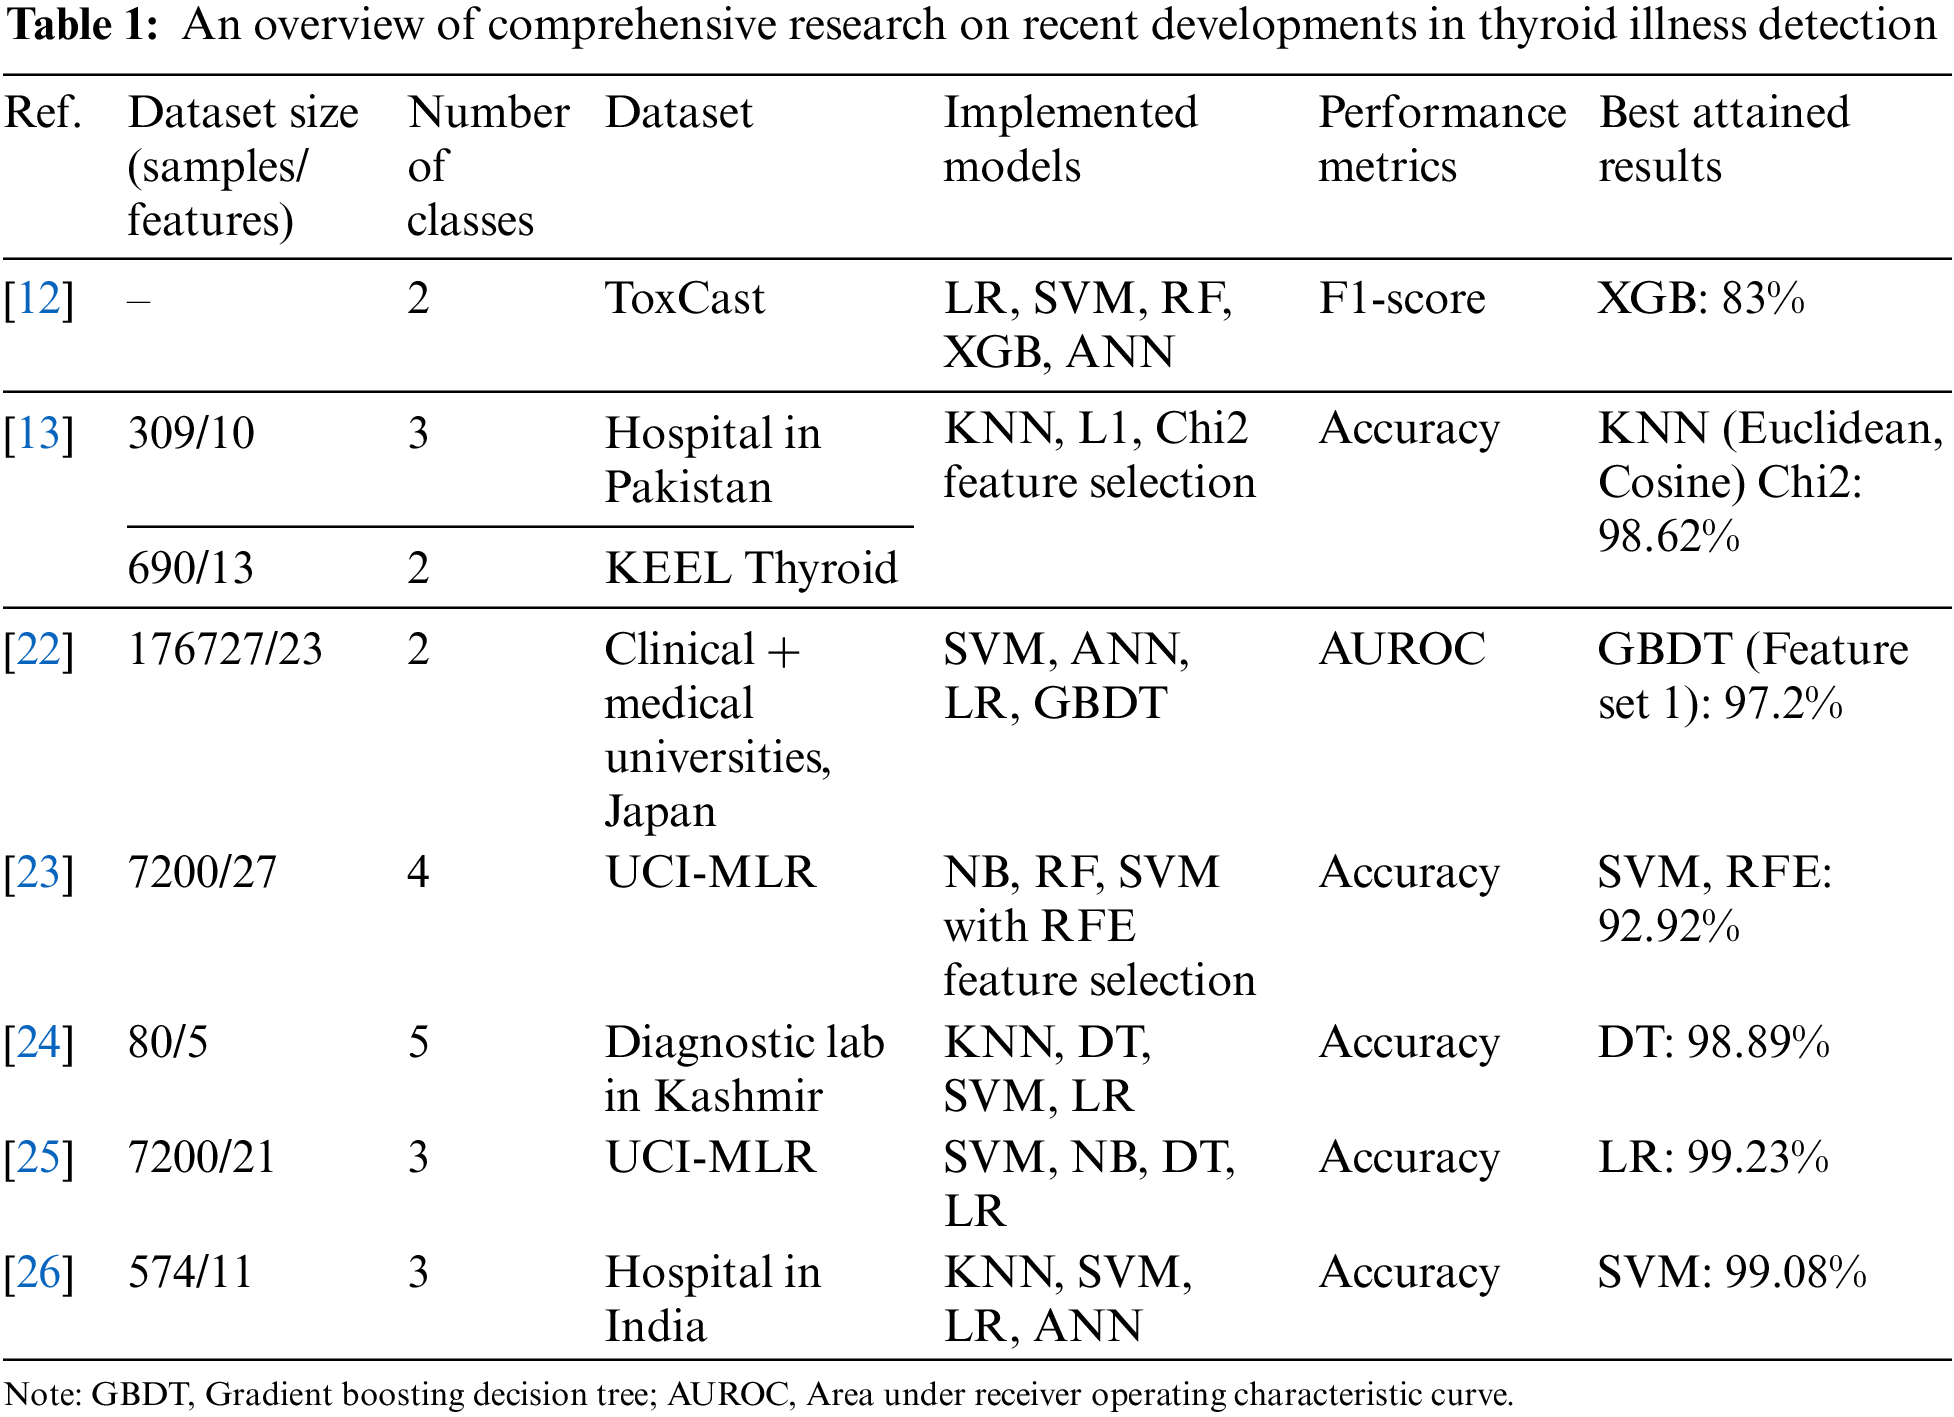
Table 1 compares published thyroid detection studies that used standard repositories and local hospital datasets with encouraging results. This study used standard thyroid datasets from UCI-MLR for wide applicability and technique investigation. Previous research has improved thyroid disorder classification accuracy. However, feature selection for thyroid illness diagnosis problems has not been well studied. The proposed stacking ensemble classifiers produced highly accurate results after crucial prepossessing, identification, removal of outliers, and feature selection. A multi-thyroid dataset and multi-class thyroid disease categorization have been implemented in this work. A thorough comparison of suggested methods with the past research on both datasets is also included.
In the remaining sections of the paper, information on thyroid datasets, data preprocessing, feature selection approaches, and the proposed ML diagnosis method are presented in Section 2. Section 3 provides the findings of using several attribute selection methods along with stacking the ensemble models, evaluating their efficiency with different metrics, and comparing and discussing their results with those of similar research. Section 4 summarizes the most important findings of this research work.
The structure and flow of the proposed method for predicting thyroid problems are shown in Fig. 1. Two thyroid illness datasets are obtained from the UCI-MLR. The initial step includes the necessary preprocessing while considering the deletion of the unimportant features and handling the missing values. The BorutaSHAP-based feature importance by using Z-score is also focused. Another contribution of this study includes the minimum covariance determinant (McovD) based outlier detection and removal from both datasets. The attributes selection process comes next which employs a variety of feature selection strategies. Several ensemble classifiers RF, bagging classifier (BGC), and AdaBoost (ADB) are used in this study by dividing the datasets in a train-to-test ratio of 70:30. Finally, the stacking of the ensemble classifiers with an LR meta-estimator has been implemented in this research work.
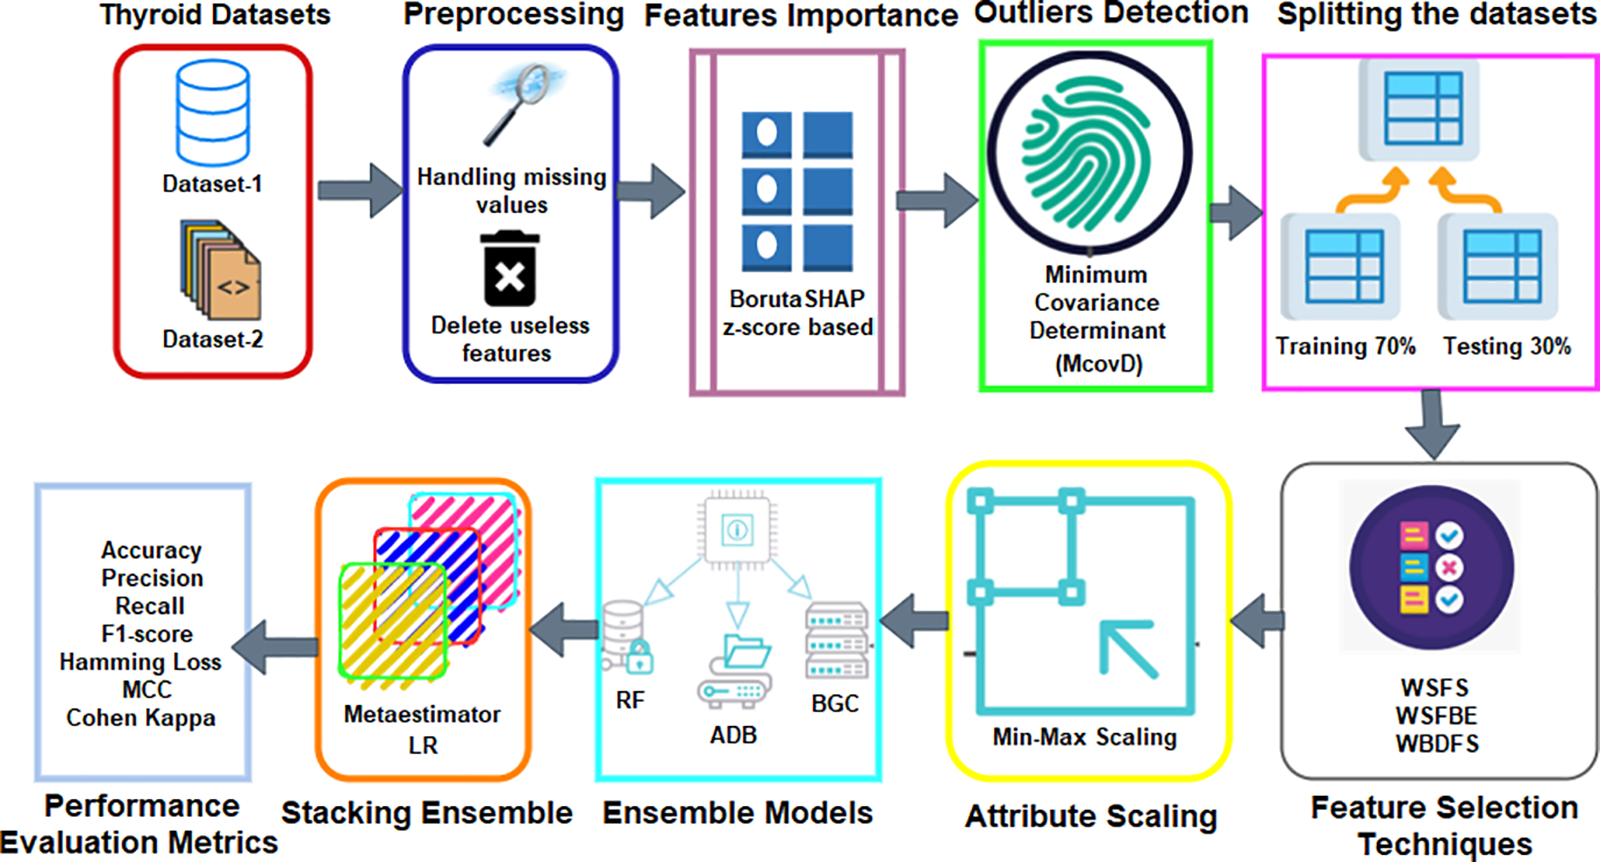
Figure 1: The block diagram of the suggested approach for diagnosing thyroid disease
The two datasets used in this research work have been taken from the UCI-MLR repository. The dataset-1 is named “hypothyroid”, and dataset-2 is known as the “new-thyroid” dataset.
It comprises 30 explanatory variables representing 3772 patients, 29 of which are objects and one with integer values. The dataset-1 contains a lot of missing data. Out of the 30 attributes, eight important features include the missing data. The features, total T4 (TT4), free T4 index (FTI), T4 uptake (T4U), age, sex, TSH and T3 includes 231, 385 387, 01, 150, 369, and 769 missing samples out of a total of 3772 instances, respectively. The other feature, thyroid-binding globulin (TBG) fully comprises the missing values. The total distribution of the target class is represented as a binary class consisting of 3481 samples as ‘P’ and 291 as ‘N’. The t-distributed stochastic neighbor embedding (t-SNE)-based projection for this target variable is shown in Fig. 2a.
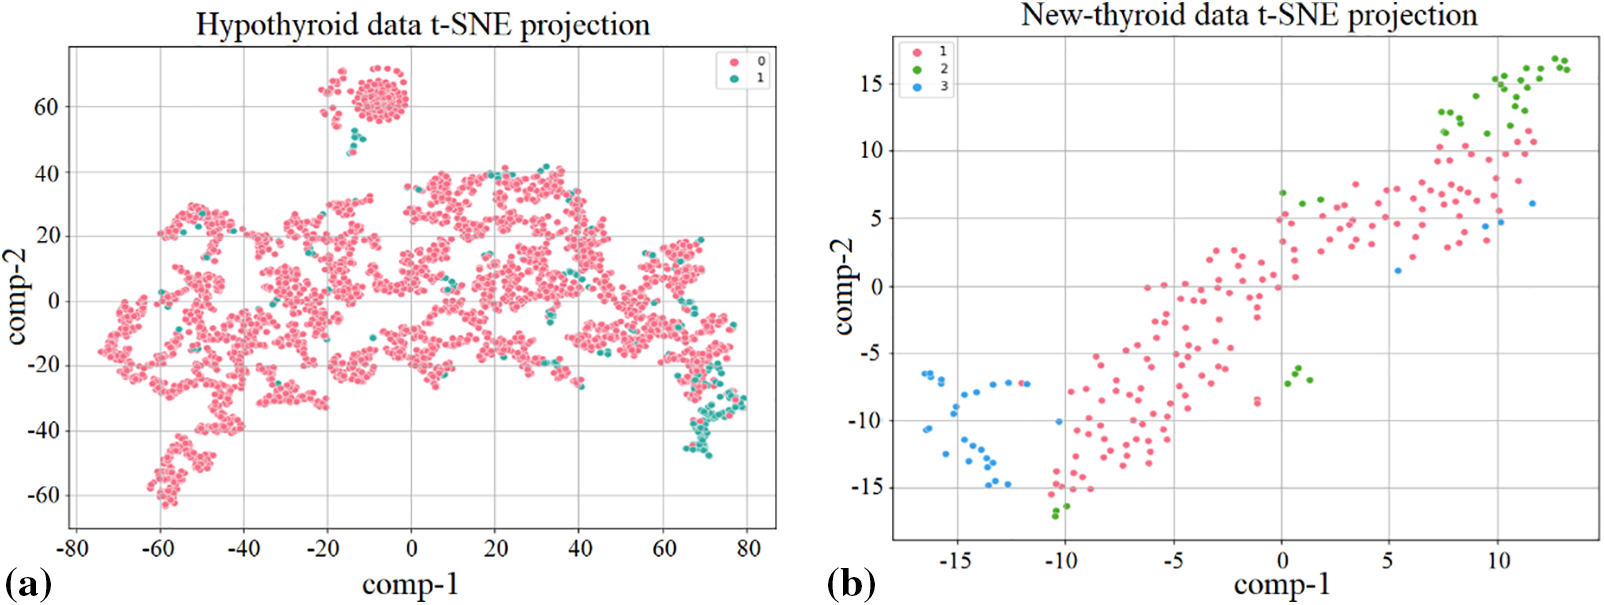
Figure 2: The t-SNE-based target variable data points projection on (a) dataset-1, (b) dataset-2
This dataset includes a total of 215 instances while considering a total of six attributes including the target variable. It consists of both the integer and float values with no missing samples involved. The target factors classify patients into three groups according to the well-being of their thyroid glands including normal thyroid function, hyperthyroidism, and hypothyroidism. The division of the class variable consists of 150 samples for “normal” as 1, 35 samples for “hyper” as 2, and 30 samples for “hypo” as 3. Fig. 2b shows the t-SNE-based target variable projection for this dataset.
The dataset-2 has no missing values or redundant attributes and the target variable comprising strings is converted to integers for further processing. The string “nan” represents missing values in dataset-1 features which are replaced with the mean values of neighbors. The dataset-1 additionally includes attribute values like ‘t’ and ‘f’ which are changed to ‘0’ and ‘1’, respectively, for further processing. The TBG feature includes a lot of missing values, so it is removed from the dataset since it highly affects the model performance and has no significant effect on the outcome. The dataset-1 has few numeric, and mostly objects, strings, or character-based attributes. These variables are difficult to process for ML libraries, so string or character objects are converted into integers. This data cleansing is performed in preprocessing for both datasets.
2.2.1 BorutaSHAP for Feature Importance
Feature importance refers to methods that evaluate input features based on their ability to predict output variables. In predictive modeling, feature relevance scores reflect the insights about the model attributes. It provides the foundation for attribute selection and dimensionality reduction for higher-dimensional data which may affect prediction model efficiency. The most common methods include statistical correlation scores, LR model coefficients, RF and DT-focused features scores, permutation-based scores, and F-score-based feature importance [10]. The SFM class converts a model into a subset with specified features for XGB-based feature significance [18]. Wrapper-based BorutaSHAP uses Boruta attribute selection and SHAP values. This combination outperforms the classic permutation importance technique in time and feature subset reliability. This method improves model inference by providing better attributes and the most consistent and accurate global feature rankings [27]. Fig. 3 shows BorutaSHAP-based attribute importance using the Z-score for both datasets.
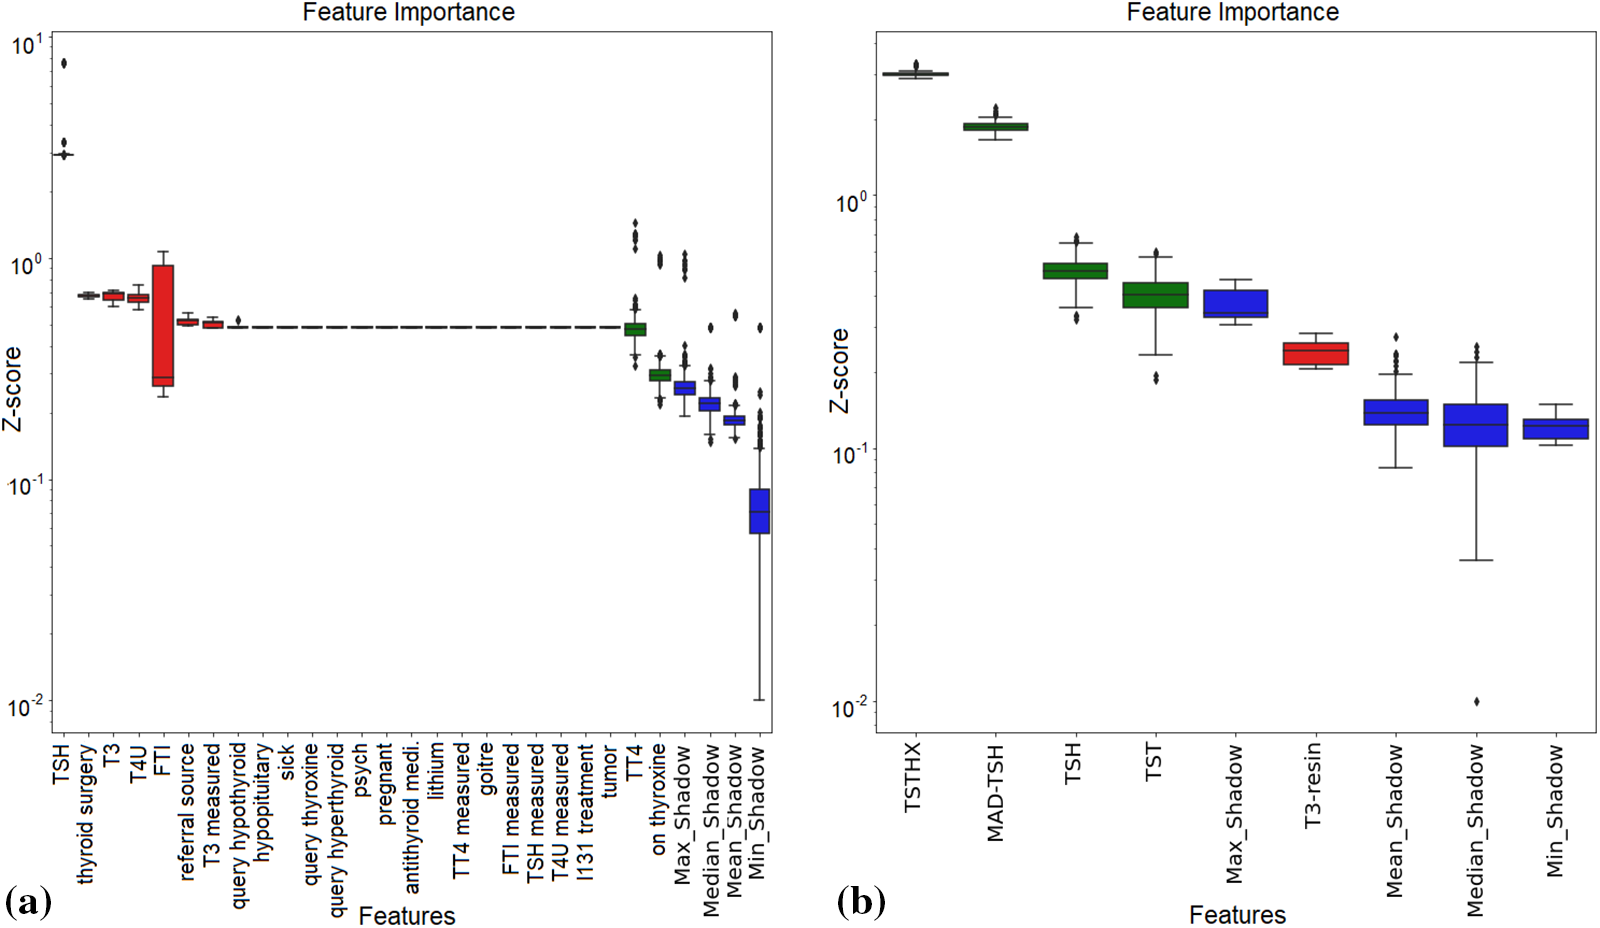
Figure 3: Z-score-based feature importance by using BorutaSHAP on (a) dataset-1, (b) dataset-2
2.2.2 Minimum Covariance Determinant-Based Outlier Detection
Multivariate data makes it more difficult to identify anomalies because multidimensional residuals may not be readily apparent in lower dimensional situations, and visual evaluation of the data is not necessarily reliable in higher dimensional data. A traditional method is to figure out how far each observation is from the center of the data, considering how the data is shaped. An outlier is a data point that is distant from the other data points beyond a certain cutoff. The traditional distance metrics are Euclidean, Manhattan, Chebyshev, Minkowski, hamming, or Mahalanobis distances, etc.
One of the most reliable methods for estimating the covariance matrix of a collection of multivariate data is the McovD [28]. When the covariance matrix is positive semi-definite and its diagonal entries are all equal to one, the inverse of the covariance matrix determinant is the minimum determinant. McovD is a helpful estimator because it is less susceptible to outliers than the covariance matrix. It is helpful for datasets with outliers or noise. A total of 264 and 15 outliers are detected in dataset-1 and dataset-2 with WOAS, achieving the mean absolute error (MAE) value of 2.5 × 10⁻² and 1 × 10⁻⁴, respectively. These outliers are detected with MAE values of 2.4 × 10⁻², 2.5 × 10⁻², 2 × 10⁻² for dataset-1, and 6.2 × 10⁻², 1 × 10⁻⁴, 2 × 10⁻⁴ for dataset-2, with WSFS, WSFBE, WBDFS-based selected features, respectively.
2.3 Feature Selection Approaches
This study used two datasets having 30 and five features, respectively. ML requires an essential and significant number of attributes for learning models to train them well for better prediction capabilities. Feature selection strategies like WSFS, WSFBE, and WBDFS are used in this study to select the important features from the dataset for the effective development of the proposed ML model.
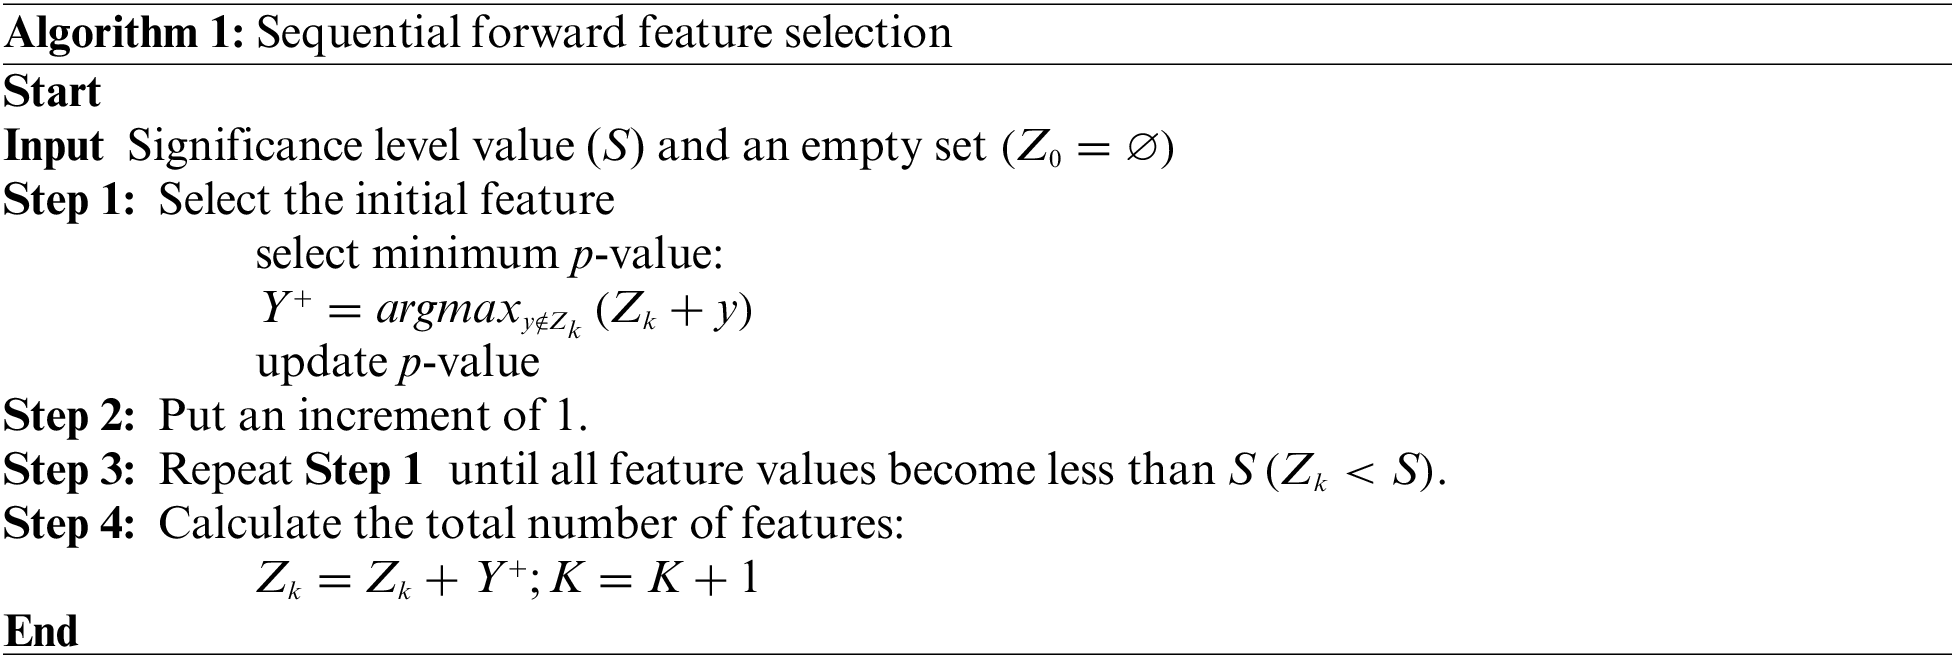
2.3.1 Sequential Forward Feature Selection
A technique for choosing a smaller subset of features from a larger collection of features in a dataset is called sequential feature selection. “Sequential” means that features are added or removed in a sequence based on predetermined performance criteria until a subset of desired features is found. Sequential feature selection may be done in various ways, including recursive feature removal, backward elimination, and forward selection. These approaches vary in the procedure and criteria for feature addition or removal from the subset. All techniques proceed to identify the subset of features that give the highest model performance as measured by the selected performance criteria. The WSFS technique is detailed in Algorithm 1.
Dimensionality reduction of datasets is a valuable technique for improving the performance of ML models and making them simpler to understand. Additionally, it might be useful to determine the key characteristics of a dataset that can emphasize the underlying connections between the features and the desired variable. In this study, the Scikit learn package [29] has been used to select the most important and essential attributes in both datasets. Fig. 4 illustrates the feature performance scores against the number of selected features by all the feature selection techniques on both datasets. The WSFS achieved performance scores of 0.25 and 0.46 with 20 and four number of selected features in dataset-1 and dataset-2, respectively.
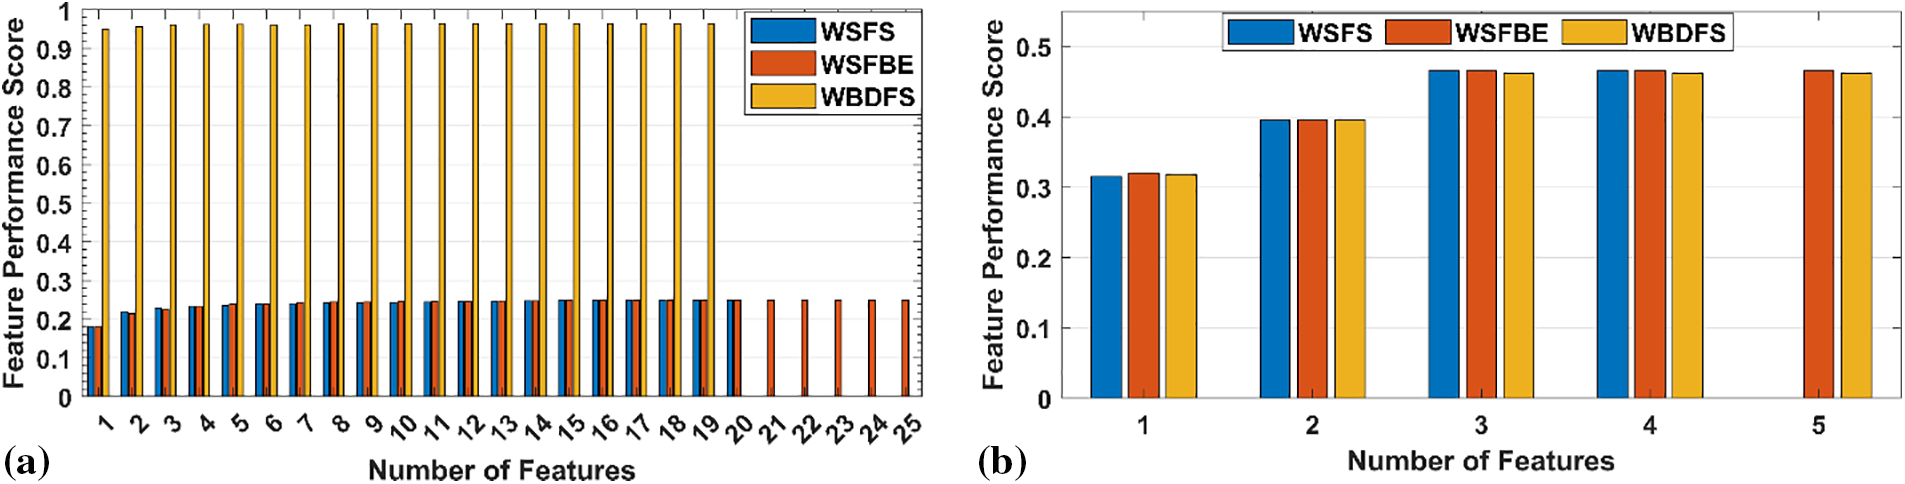
Figure 4: Performance scores of selected features with selection techniques on (a) dataset-1, (b) dataset-2
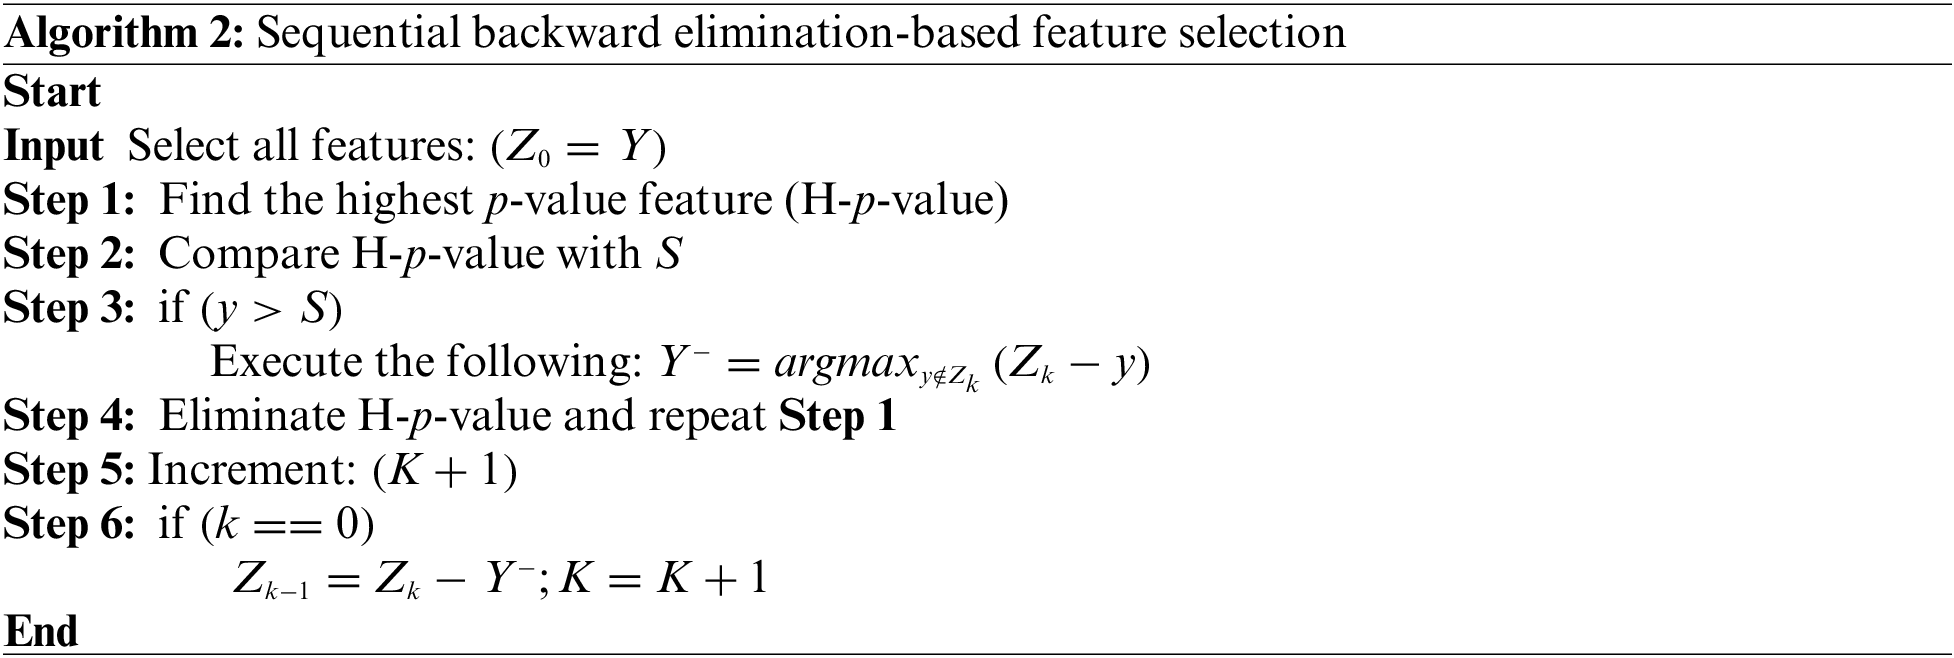
2.3.2 Sequential Backward Elimination
The term “Backward” refers to the continuous removal of features based on pre-established performance criteria until the desired subset is found. It adds or removes model features sequentially like WSFS. Sequential backward elimination is computationally more efficient than training a new model for each feature addition or removal. The WSFBE technique is detailed in Algorithm 2. The WSFBE achieved performance scores of 0.25 and 0.46 with 22 and five selected features in dataset-1 and dataset-2, respectively, as shown in Fig. 4.
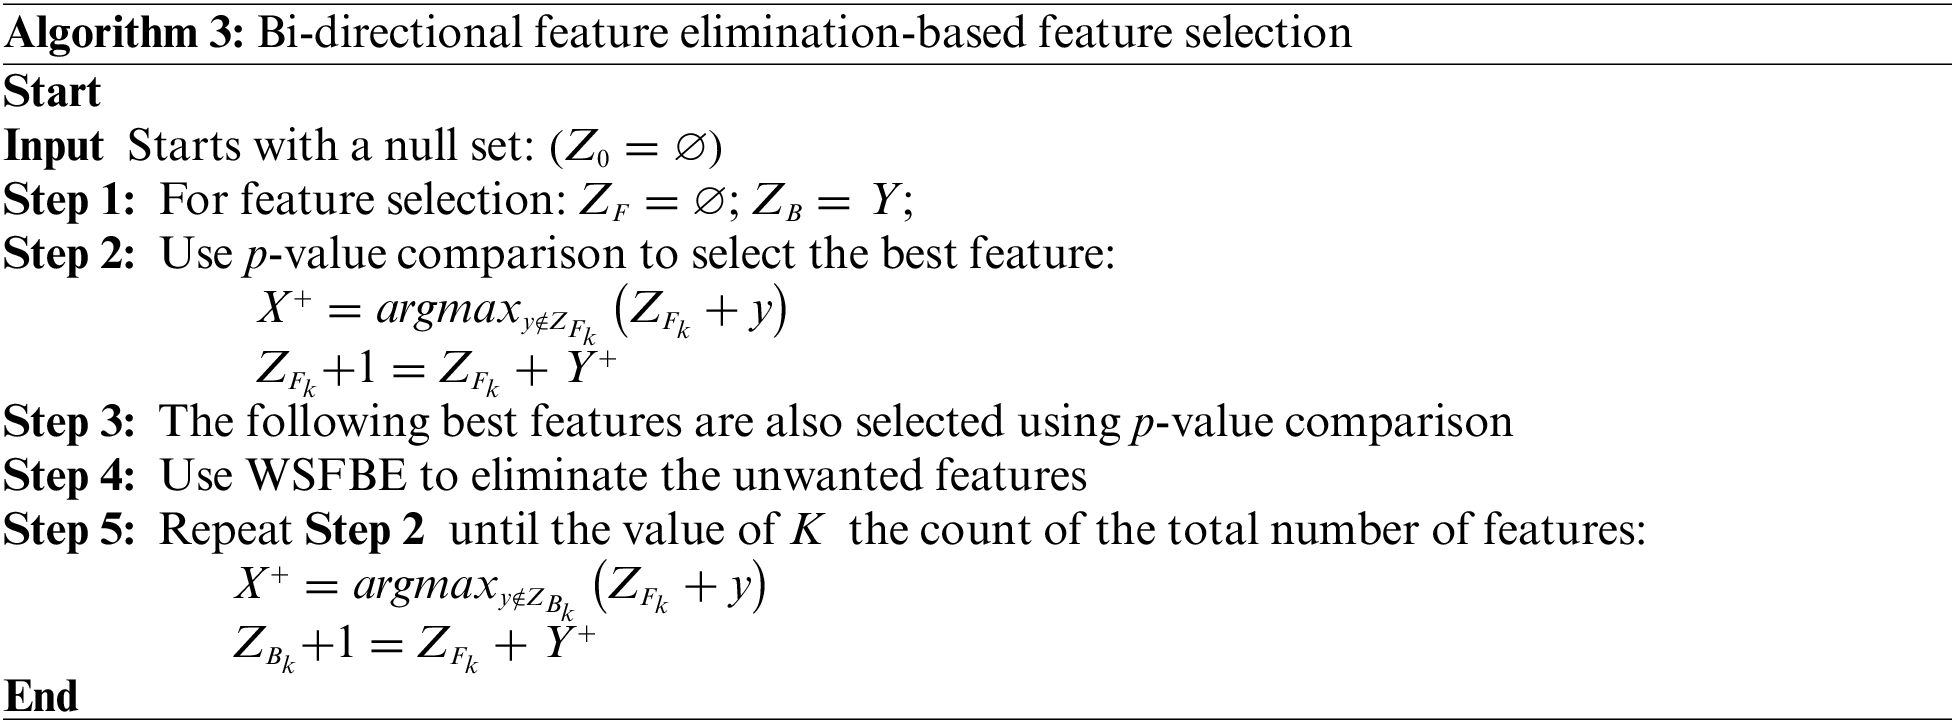
2.3.3 Bi-Directional Feature Elimination
The most significant ML model properties are chosen using bidirectional feature reduction. It involves the gradual removal of model features with the evaluation of its performance. Feature elimination can be performed from the complete or reduced feature set. The model performance is checked by eliminating each feature one by one, and the checked feature is permanently removed from the selected feature set if its removal improves the model performance. If the performance drops with the removal of any feature, then it is added back to the selected feature set. This procedure is repeated until the model’s performance is plateaued out. In the reverse process, all the features are checked sequentially by including them in the initially null feature set, and they are added to the selected feature set permanently if their inclusion improves the model performance or vice versa until the performance plateaus.
Due to its consideration of both the effects of individual features on the performance of the model and the interactions between features, bi-directional feature elimination is a beneficial strategy for feature selection. A model’s interpretability and risk of overfitting may both be improved by reducing the number of unimportant features in the model. The WBDFS technique is detailed in Algorithm 3. The WBDFS achieved performance scores of 0.965 and 0.465 with 16 and five selected features in dataset-1 and dataset-2, respectively, as shown in Fig. 4.
2.4 Ensemble Classification Models
Ensemble classifiers improve prediction accuracy by using many base models. The same or different base models are trained separately on the same dataset in an ensemble. The final prediction of the classifier is made by combining the base model predictions which can be performed in multiple ways. In majority voting, the most frequently predicted class by the base models is selected as the final prediction. In weighted voting, weighted averaging of base models’ performance is done for the final prediction. The proposed approach employed stacking classifiers for early predictions, and meta-estimators for final predictions. Stacking may reduce overfitting and improve generalization surpassing base models. They are beneficial for complex problems where model selection is challenging [30]. The ensemble classifiers are ADB, GB, RF, BGC, etc., which can perform both the classification and regression tasks.
Random Forests ensembles are DTs that work together to predict. Each tree in an RF ensemble learns from a distinct sample of the dataset and averages its predictions to make a final prediction. This method reduces overfitting and may improve model accuracy compared to a single DT. RF tends to train quickly and handle large datasets, making them popular for many applications [31].
Classification problems are commonly solved with Adaptive Boosting ensemble learning. DT and other weak learners are combined to create a powerful classifier. The weak learners are trained sequentially with training data weights modified to learn those samples that are misclassified by previous learners. Therefore, the final classifier is more accurate than each weak learner alone. ADB is widely used since it is easy to set up and improves several classifiers [32].
A Bagging ensemble refers to a collection of classifiers that collectively output predictions. Bagged ensemble learning approaches include training individual classifiers using random samples from the entire dataset [33]. Each classifier contributes to the prediction, but the final prediction is made by a majority vote. This technique may enhance model accuracy over a single classifier due to reduced overfitting [34]. BGC is popular because it learns quickly and handles large datasets.
Ensemble Stacking is an ensemble learning technique that uses the “stacking” strategy by training each ensemble classifier on a different subset of the training data. Meta-classifiers combine all classifier findings to generate a final prediction. Since many classifiers can focus on distinct data points, this method may improve model accuracy [35]. Stacking ensembles can improve many classifiers and are adaptable [36]. In this study, LR is employed as a meta-estimator to produce the final prediction. Fig. 5 shows the flow diagram of the homogeneous ensemble stacking-based classification model.
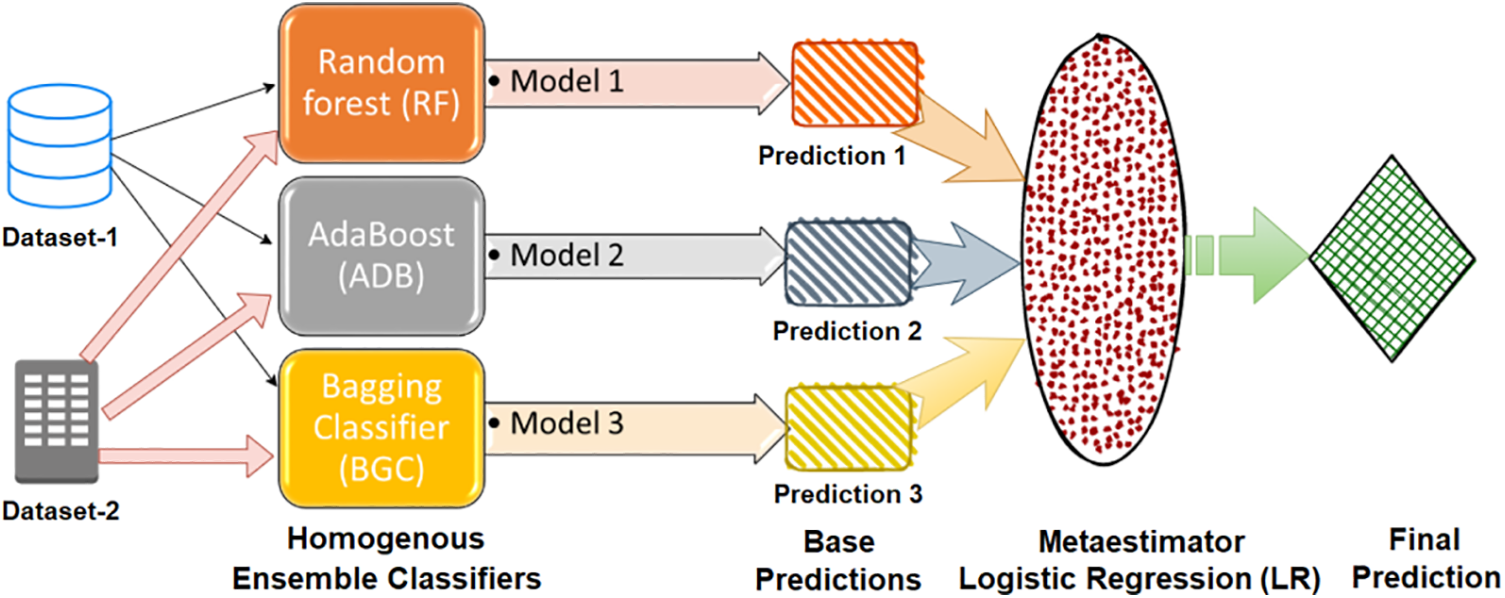
Figure 5: Ensemble stacking approach-based meta-classification model
2.5 Performance Assessment Metrics
The confusion matrix is used to evaluate the model’s accuracy in making predictions of respective classes and to assess the model’s performance by identifying any anomalies [37,38]. The metrics are based on the number of true positives, false positives, true negatives, and false negatives in the model predictions. The number of positive outcomes that were correctly identified, the number of positive outcomes that were misidentified, the number of negative outcomes that were correctly identified, and the number of negative outcomes that were misidentified are referred to as true positives (TP), false positives (FP), true negatives (TN), and false negatives (FN), respectively. Precision, recall, accuracy, F1-score, and the Matthews correlation coefficient (MCC) are some of the measures that can be determined by using these indicators according to the following relationships.
Cohen kappa is a statistical measure used to find out how much the two evaluators agree with each other. It can also be used to see the efficiency of a model for gathering samples into groups in the real world.
where OA is the observed agreement and EA relates to the expected agreement.
Hamming loss is a way to measure how often mistakes happen in classification tasks with more than two labels. It is the number of wrongly predicted labels as a percentage of all the labels in the dataset. It is used to measure how well a multiclass classifier works. It is found by subtracting the fractional accuracy of the classifier from one for binary classification problems.
whereas forecasted and the target values are represented as
The results of this study involving ensemble learning and the prediction of thyroid illness are presented in this section. The outcomes of using each feature selection strategy as well as without attribute selection are described by employing the stacking ensemble strategy for the classification. The dataset was randomly divided into training and testing sets using the train-to-test ratio of 70:30 with 70% of the data samples (2640 and 150 samples for dataset-1 and dataset-2, respectively) being used for model training and 30% of the data samples being used for model testing. The effectiveness of the model is assessed by using multiple performance evaluation indicators including accuracy, MCC, precision, Cohen Kappa, recall, F1-score, and hamming loss.
The results of the stacking ensemble classifier used on dataset-1 are shown in Table 2. All performance assessment measures are computed with original preprocessed features (WOAS) and with feature selection approaches-based selected attributes. The dataset-1 has a total of 30 features out of which a few had missing values which are not included in the evaluation. In a comparative analysis, the WBDFS methodology used the fewest features and achieved the highest accuracy of 99.86% with the lowest computational cost after the deployment of various feature selection algorithms.
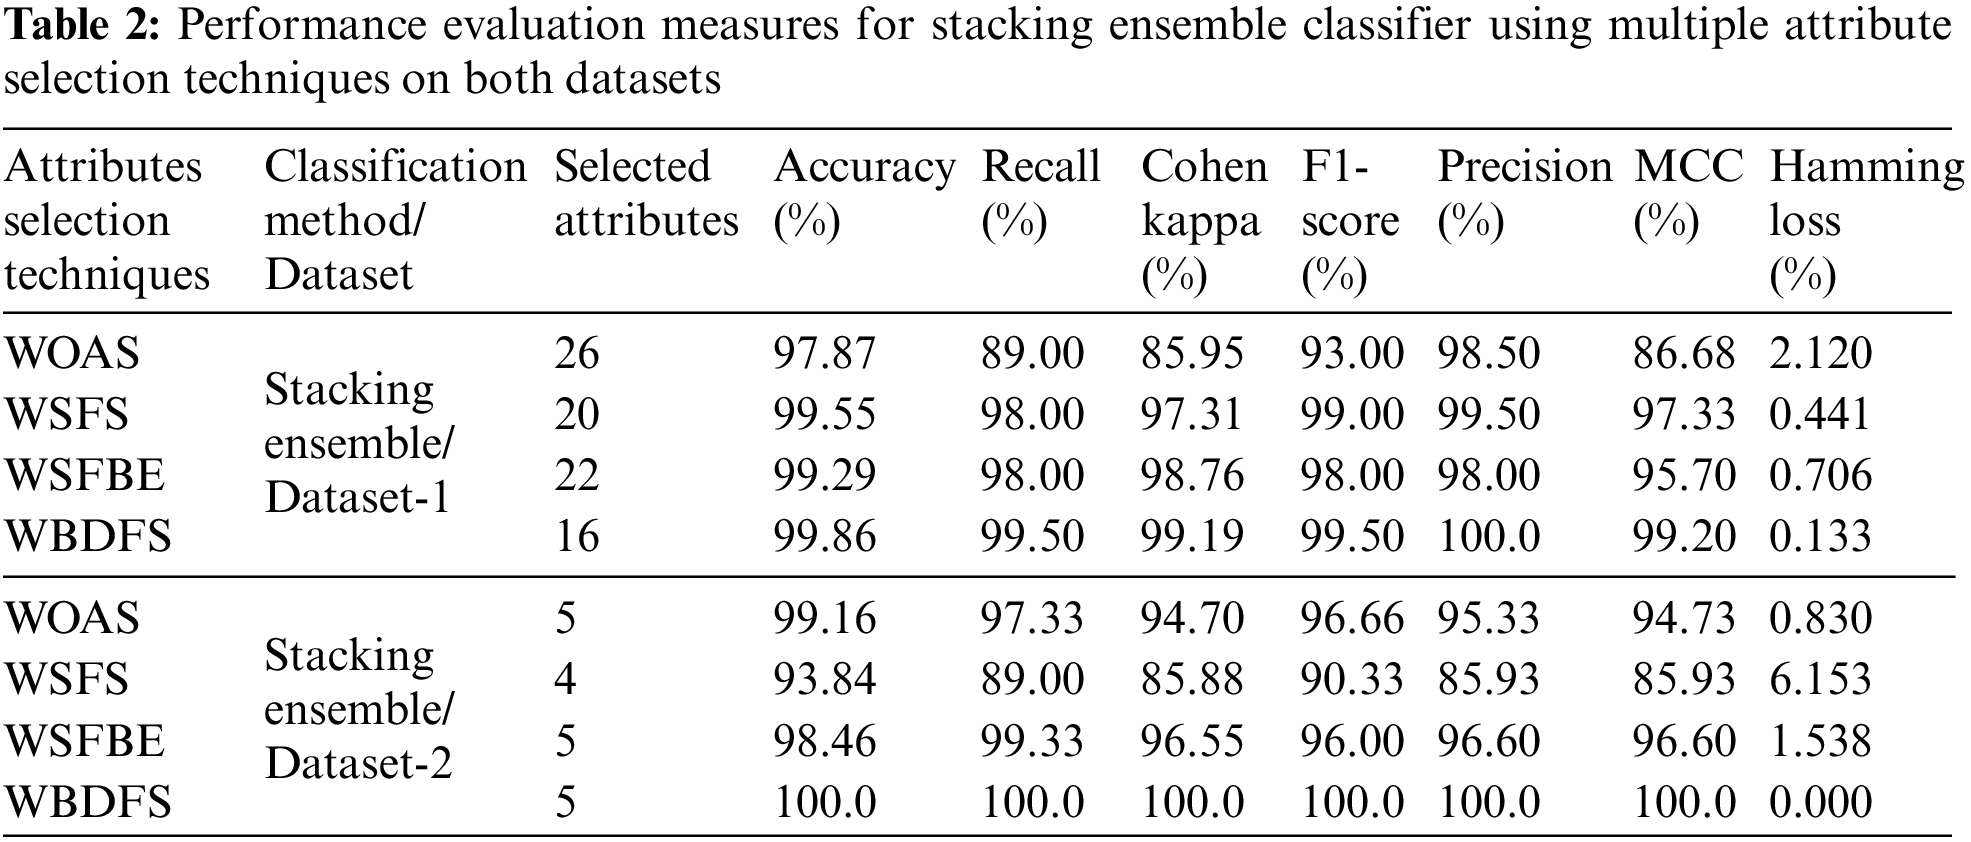
From Table 2, it is found that dataset-1 has many outliers since the accuracy reduced and the computational complexity of the suggested approach increased as the number of features increased in the testing feature set. As a result, the WBDFS and stacking ensemble produced the best performance, whereas the WOAS and stacking ensemble produced the worst performance with an accuracy of 97.87%. Overall, the WBDFS is regarded as the most efficient attribute selection strategy for thyroid disease prediction. The confusion matrices obtained by using stacking ensemble and various feature selection techniques for dataset-1 are shown in the top row of Fig. 6.
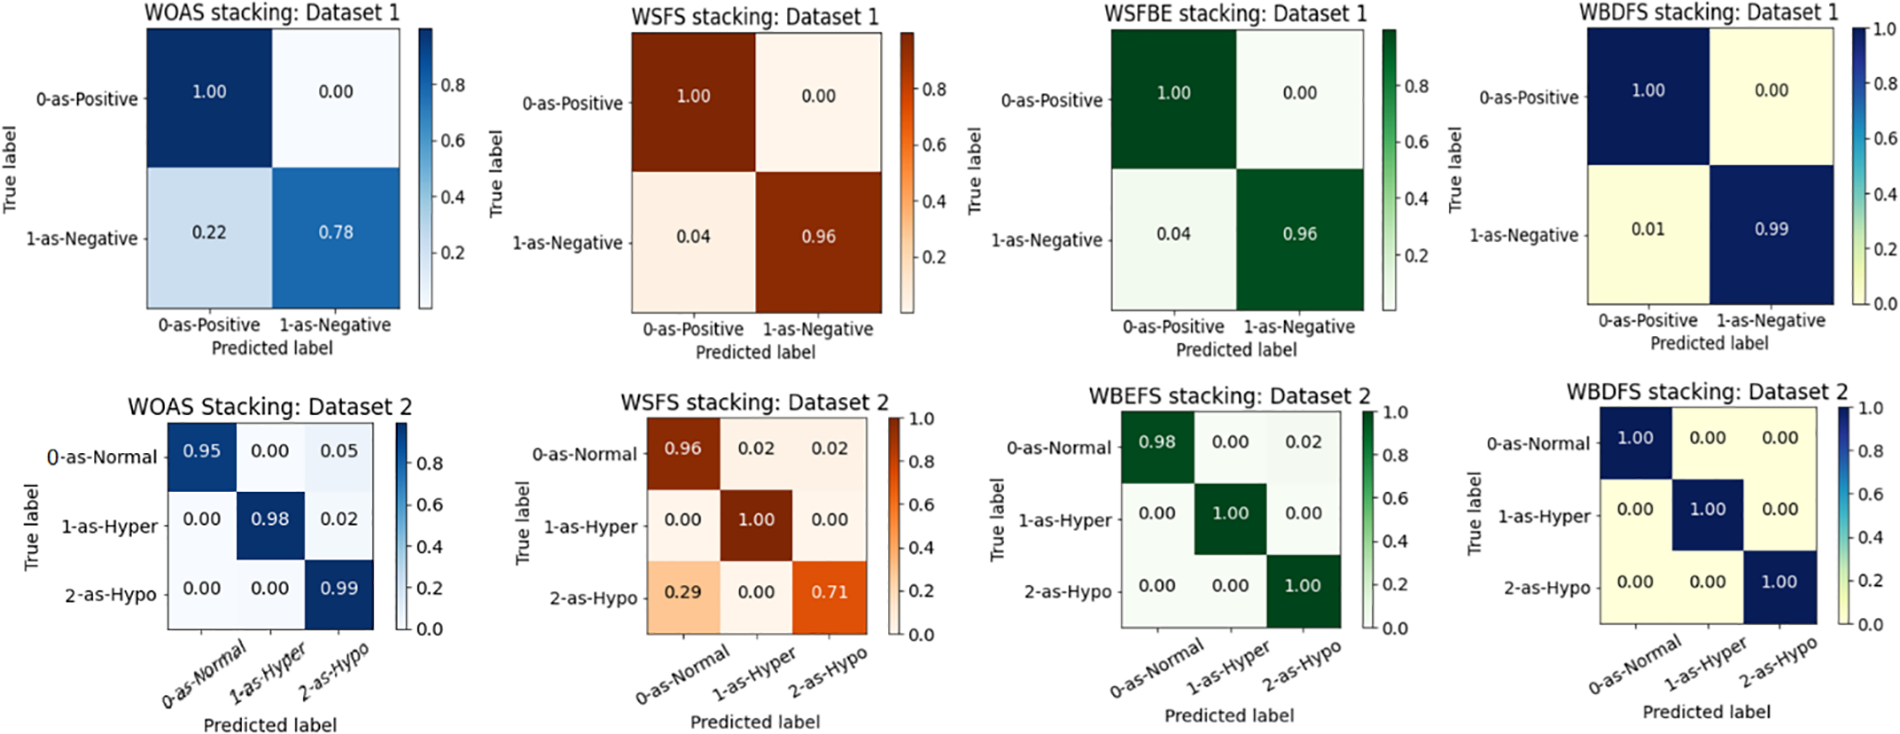
Figure 6: Confusion matrices for stacking ensemble and feature selection techniques on dataset-1 (top row) and dataset-2 (bottom row)
Table 2 presents the results of employing the stacking ensemble method on dataset-2 with feature selection approaches as well as with the original feature set. All the performance assessment metrics results validate the effectiveness of the proposed model for multiclass thyroid disease classification. Although dataset-2 contains a limited number of features and training samples, it does not contain missing values which indicate that each attribute possesses essential information, and hence is critical to achieving high-end results.
It is shown in Table 2 that WBDFS achieved a score of 100% in accuracy as well as other evaluation metrics while keeping its hamming loss at 0.00%. The results obtained using WSFS attained the lowest performance with an accuracy of 93.84% because the total number of selected features was reduced by one compared to the original feature set. A significant amount of vital information was lost in terms of the removed feature which resulted in the lowest performance of the WSFS method. The WBDFS emerged as the clear winner among all by achieving the maximum accuracy of 100% with the lowest computational time of 0.040 s. The bottom row of Fig. 6 shows the confusion matrix results of the stacking ensemble in combination with the feature selection techniques on dataset 2.
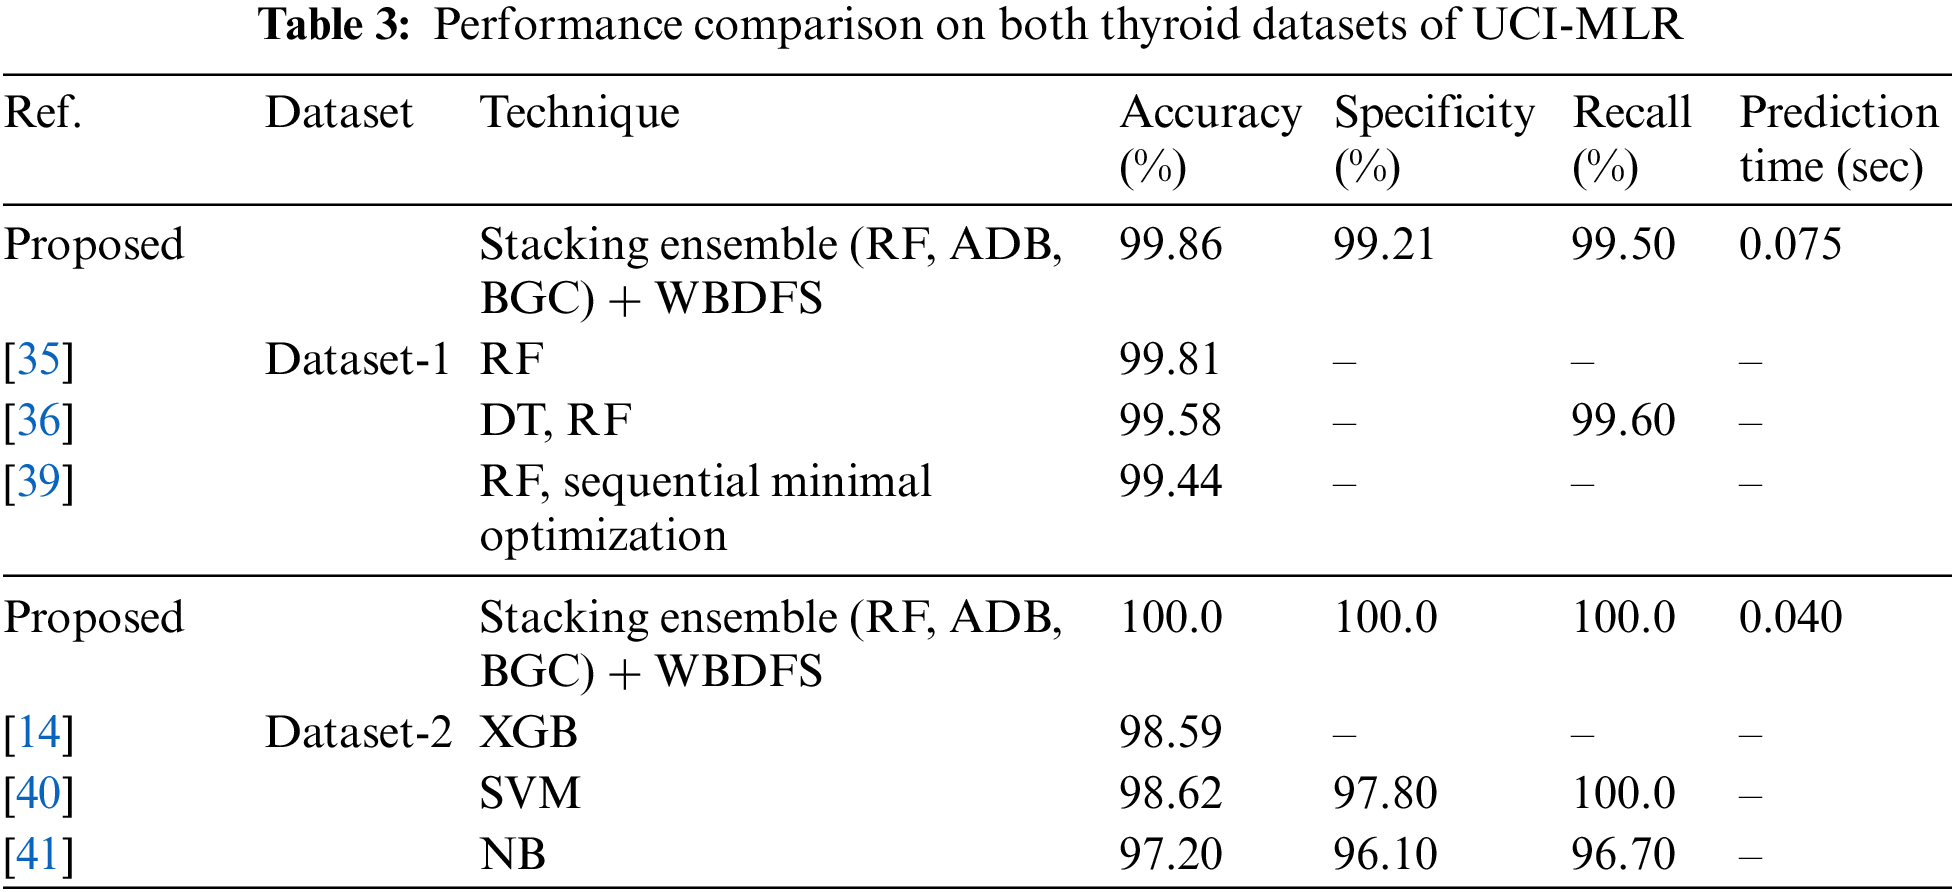
3.3 Comparison with Existing Studies
To demonstrate the effectiveness of the proposed methodology, its results were compared with those of the recently published studies that employed experimental methods on the same datasets. In Table 3, the accuracy, specificity, and recall values from the published research models were assessed against the proposed stacking ensemble method with attribute selection on the employed thyroid datasets of UCI-MLR. The proposed approach of stacking the common homogeneous ensemble classifiers (RF, ADB, BGC) with the WBDFS feature selection technique achieved the highest accuracy of 100% and 99.86% on both the UCI-MLR (New-thyroid) dataset-2 and (Hypothyroid) dataset-1, respectively. This comparison ascertains the viability of the proposed method in detecting binary as well as multiclass thyroid disorders for real-world smart healthcare applications.
The human life of a thyroid patient depends on efficient thyroid disorder detection and diagnosis. Machine learning (ML) methods improve disease recognition and identification accuracy. Thyroid disease is hard to diagnose as its symptoms are often misinterpreted. Current research focuses on model optimization and ML classifier implementation, but few studies have discussed feature engineering and attribute selection. The availability of a single method that is effective for multiple thyroid datasets is limited as most of the studies are validated over a single dataset. The evaluation and validation of the attribute selection-based ensemble learning combination are also not presented widely. In this preface, this study proposed a stacking ensemble model encompassing multiple homogenous ensemble classifiers combined with attribute selection methods, which are employed on the significantly preprocessed feature set before classifier training. Three attribute selection approaches namely sequential forward feature selection, sequential backward elimination, and bi-directional feature elimination are implemented. Random forests, adaptive boosting, and bagging ensemble classifiers are efficient thyroid prediction ML classifiers with low computational complexity, so they are stacked together in the proposed classification model. Ensemble models help us to overcome weak learners’ drawbacks by increasing prediction accuracy. The final meta-estimator in ensemble stacking is the logistic regression. The performance of the proposed approach is consistent across multiple thyroid datasets and hence is independent of dataset features. Bi-directional feature elimination and stacking ensemble produced 99.86% and 100% accuracy with reduced computational cost in terms of prediction time of 0.075 and 0.040 s for dataset-1 and dataset-2, respectively. Other performance evaluation metrics results are promising with the implementation of the proposed model. The proposed method surpasses the results obtained with the earlier research on both thyroid disease datasets. The feature reduction and class imbalance in the target variable pose a few limitations of this study. Future work will focus on data augmentation and sampling procedures to balance the class distribution with improved performance.
Acknowledgement: This work was supported by the Institute of Information & communications Technology Planning & Evaluation (IITP) Grant funded by the Korean government (MSIT) (2021-0-00755, Dark Data Analysis Technology for Data Scale and Accuracy Improvement). The authors would like to express their gratitude to Princess Nourah bint Abdulrahman University Researchers Supporting Project Number (PNURSP2024R407), Princess Nourah bint Abdulrahman University, Riyadh, Saudi Arabia.
Funding Statement: This work was supported by the Institute of Information & communications Technology Planning & Evaluation (IITP) grant Funded by the Korean government (MSIT) (2021-0-00755, Dark Data Analysis Technology for Data Scale and Accuracy Improvement). This research was funded by Princess Nourah bint Abdulrahman University Researchers Supporting Project Number (PNURSP2024R407), Princess Nourah bint Abdulrahman University, Riyadh, Saudi Arabia.
Author Contributions: The authors confirm contribution to the paper as follows: Conceptualization, methodology, M. A. Latif, Z. Mushtaq, and S. Arif; validation, formal analysis, investigation, S. Arif, S. Rehman, and M. F. Qureshi; writing—original draft preparation, M. A. Latif, Z. Mushtaq, S. Arif, and M. F. Qureshi; writing—review and editing, S. Arif, S. Rehman, N. A. Samee, M. Alabdulhafith, Y. H. Gu, and M. A. Al-masni; supervision, resources, funding acquisition, N. A. Samee, M. Alabdulhafith, Y. H. Gu, and M. A. Al-masni. All authors reviewed the results and approved the final version of the manuscript.
Availability of Data and Materials: Publicly available datasets were analyzed in this study. This data can be found here: https://archive.ics.uci.edu/datasets.
Conflicts of Interest: The authors declare that they have no conflicts of interest to report regarding the present study.
References
1. L. Aversano, M. L. Bernardi, M. Cimitile, A. Maiellaro, and R. Pecori, “A systematic review on artificial intelligence techniques for detecting thyroid diseases,” PeerJ Comput. Sci., vol. 9, no. 1, pp. e1394, Jun. 2023. doi: 10.7717/peerj-cs.1394. [Google Scholar] [PubMed] [CrossRef]
2. J. M. C. Busch, J. Cozzi, H. Li, L. Lan, M. L. Giger, and X. M. Keutgen, “Role of machine learning in differentiating benign from malignant indeterminate thyroid nodules: A literature review,” Health Sci. Rev., vol. 7, no. 1, pp. 100089, Jun. 2023. doi: 10.1016/j.hsr.2023.100089. [Google Scholar] [CrossRef]
3. R. Chaganti, F. Rustam, I. D. L. T. Díez, J. L. V. Mazón, C. L. Rodríguez, and I. Ashraf, “Thyroid disease prediction using selective features and machine learning techniques,” Cancers, vol. 14, no. 16, pp. 3914, Aug. 2022. doi: 10.3390/cancers14163914. [Google Scholar] [PubMed] [CrossRef]
4. S. Anari, N. T. Sarshar, N. Mahjoori, S. Dorosti, and A. Rezaie, “Review of deep learning approaches for thyroid cancer diagnosis,” Math. Probl. Eng., vol. 2022, no. 1, pp. 1–8, Aug. 2022. doi: 10.1155/2022/5052435. [Google Scholar] [CrossRef]
5. J. C. Naafs et al., “Cognitive and motor outcome in patients with early-detected central congenital hypothyroidism compared with siblings,” J. Clin. Endocrinol. Metab., vol. 106, no. 3, pp. e1231–e1239, Mar. 2021. doi: 10.1210/clinem/dgaa901. [Google Scholar] [PubMed] [CrossRef]
6. J. Li et al., “Multiclassifier radiomics analysis of ultrasound for prediction of extrathyroidal extension in papillary thyroid carcinoma in children,” Int. J. Med. Sci., vol. 20, no. 2, pp. 278–286, Jan. 2023. doi: 10.7150/ijms.79758. [Google Scholar] [PubMed] [CrossRef]
7. A. M. Mendoza and R. M. Hernandez, “Application of data mining techniques in diagnosing various thyroid ailments: A review,” in 2021 13th Int. Conf. Info. Comm. Tech. Sys., Surabaya, Indonesia, Oct. 20–21, 2021. doi: 10.1109/ICTS52701.2021.9608400. [Google Scholar] [CrossRef]
8. S. Khalil et al., “Enhancing ductal carcinoma classification using transfer learning with 3D U-Net models in breast cancer imaging,” Appl. Sci., vol. 13, no. 7, pp. 4255, Mar. 2023. doi: 10.3390/app13074255. [Google Scholar] [CrossRef]
9. M. H. Alshayeji, “Early thyroid risk prediction by data mining and ensemble classifiers,” Mach. Learn. Knowl. Extr., vol. 5, no. 3, pp. 1195–1213, Sep. 2023. doi: 10.3390/make5030061. [Google Scholar] [CrossRef]
10. T. Akhtar et al., “Ensemble-based effective diagnosis of thyroid disorder with various feature selection techniques,” in 2022 2nd Int. Conf. Smar. Sys. Emer. Tech., Riyadh, Saudi Arabia, May 9–11, 2022, pp. 14–19. doi: 10.1109/SMARTTECH54121.2022.00019. [Google Scholar] [CrossRef]
11. K. Salman and E. Sonuç, “Thyroid disease classification using machine learning algorithms,” in 2021 2nd Int. Conf. Phy. App. Sci., Baghdad, Iraq, May 26–27, 2021. doi: 10.1088/1742-6596/1963/1/012140. [Google Scholar] [CrossRef]
12. M. G. Lomana et al., “In silico models to predict the perturbation of molecular initiating events related to thyroid hormone homeostasis,” Chem. Res. Toxicol., vol. 34, no. 2, pp. 396–411, Nov. 2020. doi: 10.1021/acs.chemrestox.0c00304. [Google Scholar] [PubMed] [CrossRef]
13. H. A. Rehman, C. Y. Lin, and Z. Mushtaq, “Effective k-nearest neighbor algorithms performance analysis of thyroid disease,” J. Chin. Inst. Eng., vol. 44, no. 1, pp. 77–87, Jan. 2021. doi: 10.1080/02533839.2020.1831967. [Google Scholar] [CrossRef]
14. S. Sankar, A. Potti, G. N. Chandrika, and S. Ramasubbareddy, “Thyroid disease prediction using XGBoost algorithms,” J. Mob. Multimed., vol. 18, no. 3, pp. 1–18, Feb. 2022. doi: 10.13052/jmm1550-4646.18322. [Google Scholar] [CrossRef]
15. M. Shahajalal, M. M. Rahman, S. A. Pranto, R. R. Ema, T. Islam and M. Raihan, “Utilization of machine learning algorithms for thyroid disease prediction,” in Int. Conf. Inno. Comp. Comm., Delhi, India, Feb. 2021. doi: 10.1007/978-981-16-2594-7_5; [Google Scholar] [CrossRef]
16. H. A. Rehman, C. Y. Lin, Z. Mushtaq, and S. F. Su, “Performance analysis of machine learning algorithms for thyroid disease,” Arab. J. Sci. Eng., vol. 46, no. 10, pp. 9437–9449, Jan. 2021. doi: 10.1007/s13369-020-05206-x. [Google Scholar] [CrossRef]
17. S. S. Islam, M. S. Haque, M. S. U. Miah, T. B. Sarwar, and R. Nugraha, “Application of machine learning algorithms to predict the thyroid disease risk: An experimental comparative study,” PeerJ Comput. Sci., vol. 8, no. 1, pp. e898, Mar. 2022. doi: 10.7717/peerj-cs.898. [Google Scholar] [PubMed] [CrossRef]
18. T. Akhtar et al., “Effective voting ensemble of homogenous ensembling with multiple attribute-selection approaches for improved identification of thyroid disorder,” Electronics, vol. 10, no. 23, pp. 3026, Dec. 2021. doi: 10.3390/electronics10233026. [Google Scholar] [CrossRef]
19. T. Alyas, M. Hamid, K. Alissa, T. Faiz, N. Tabassum, and A. Ahmad, “Empirical method for thyroid disease classification using a machine learning approach,” Biomed Res. Int., vol. 2022, no. 1, pp. 9809932, Jun. 2022. doi: 10.1155/2022/9809932. [Google Scholar] [PubMed] [CrossRef]
20. M. Riajuliislam, K. Z. Rahim, and A. Mahmud, “Prediction of thyroid disease (Hypothyroid) in early stage using feature selection and classification techniques,” in 2021 Int. Conf. Info. Comm. Tech. Sust. Dev., Dhaka, Bangladesh, Feb. 27–28, 2021, pp. 27–28. doi: 10.1109/ICICT4SD50815.2021.9397052. [Google Scholar] [CrossRef]
21. R. Jha, V. Bhattacharjee, and A. Mustafi, “Increasing the prediction accuracy for thyroid disease: A step towards better health for society,” Wirel. Pers. Commun., vol. 122, no. 2, pp. 1921–1938, Jan. 2022. doi: 10.1007/s11277-021-08974-3. [Google Scholar] [CrossRef]
22. M. Hu et al., “Development and preliminary validation of a machine learning system for thyroid dysfunction diagnosis based on routine laboratory tests,” Commun. Med., vol. 2, no. 1, pp. 1–8, Jan. 2022. doi: 10.1038/s43856-022-00071-1. [Google Scholar] [PubMed] [CrossRef]
23. P. Duggal and S. Shukla, “Prediction of thyroid disorders using advanced machine learning techniques,” in 2020 10th Int. Conf. Clo. Comp. Data Sci. Eng., Noida, India, Jan. 29–31, 2020, pp. 29–31. doi: 10.1109/Confluence47617.2020.9058102. [Google Scholar] [CrossRef]
24. A. Nagaratnam, B. Deepika, S. Ameer, T. Sharoon, and C. Ajay, “Diagnosis of various thyroid ailments using data mining classification techniques,” Int. J. Sci. Res., vol. 10, no. 5, pp. 984–987, May 2020. doi: 10.29322/IJSRP.10.05.2020.p101117. [Google Scholar] [CrossRef]
25. S. Razia, P. S. Prathyusha, N. V. Krishna, and N. S. Sumana, “A Comparative study of machine learning algorithms on thyroid disease prediction,” Int. J. Eng. Technol., vol. 7, no. 2. 8, pp. 315–319, Mar. 2018. doi: 10.14419/ijet.v7i2.8.10432. [Google Scholar] [CrossRef]
26. V. S. Vairale and S. Shukla, “Classification of hypothyroid disorder using optimized SVM method,” in 2019 Int. Conf. Smar. Sys. Inv. Tech., Tirunelveli, India, Nov. 27–29, 2019, pp. 27–29. doi: 10.1109/ICSSIT46314.2019.8987767. [Google Scholar] [CrossRef]
27. H. Wang, E. Doumard, C. S. Dupuy, P. Kémoun, J. Aligon, and P. Monsarrat, “Explanations as a new metric for feature selection: A systematic approach,” IEEE J. Biomed. Health Inform., vol. 27, no. 8, pp. 4131–4142, May 2023. doi: 10.1109/JBHI.2023.3279340. [Google Scholar] [PubMed] [CrossRef]
28. B. Magyar, A. Kenyeres, S. Tóth, I. Hajdu, and R. Horváth, “Spatial outlier detection on discrete GNSS velocity fields using robust Mahalanobis-distance-based unsupervised classification,” GPS Solutions, vol. 26, no. 4, pp. 145, Sep. 2022. doi: 10.1007/s10291-022-01323-2. [Google Scholar] [CrossRef]
29. O. Kramer, “Scikit-learn,” in Machine Learning for Evolution Strategies, 1st ed. Heidelberg, Germany: Springer Charm, 2016, vol. 1, pp. 45–53. [Google Scholar]
30. R. Diao, F. Chao, T. Peng, N. Snooke, and Q. Shen, “Feature selection inspired classifier ensemble reduction,” IEEE Trans. Cybern., vol. 44, no. 8, pp. 1259–1268, Sep. 2013. doi: 10.1109/TCYB.2013.2281820. [Google Scholar] [PubMed] [CrossRef]
31. H. M. Gomes et al., “Adaptive random forests for evolving data stream classification,” Mach. Learn., vol. 106, no. 1, pp. 1469–1495, Jun. 2017. doi: 10.1007/s10994-017-5642-8. [Google Scholar] [CrossRef]
32. G. Ciaburro, “An ensemble classifier approach for thyroid disease diagnosis using the AdaBoostM algorithm,” in Machine Learning, Big Data, and IoT for Medical Informatics, Academic Press, 2021, pp. 365–387. [Google Scholar]
33. B. Sun, H. Chen, J. Wang, and H. Xie, “Evolutionary under-sampling based bagging ensemble method for imbalanced data classification,” Front. Comput. Sci., vol. 12, no. 2, pp. 331–350, Apr. 2018. doi: 10.1007/s11704-016-5306-z. [Google Scholar] [CrossRef]
34. H. Kour, B. Singh, N. Gupta, J. Manhas, and V. Sharma, “Bagged based ensemble model to predict thyroid disorder using linear discriminant analysis with SMOTE,” Biomed. Eng. Res., vol. 39, no. 3, pp. 733–746, Aug. 2023. doi: 10.1007/s42600-023-00307-6. [Google Scholar] [CrossRef]
35. R. Das, S. Saraswat, D. Chandel, S. Karan, and J. S. Kirar, “An AI driven approach for multiclass hypothyroidism classification,” in Conf. Adv. Net. Tech. Intel. Comp., vol. 1534, Dec. 17–18, 2021. doi: 10.1007/978-3-030-96040-7_26. [Google Scholar] [CrossRef]
36. K. Guleria, S. Sharma, S. Kumar, and S. Tiwari, “Early prediction of hypothyroidism and multiclass classification using predictive machine learning and deep learning,” Meas.: Sens., vol. 24, no. 1, pp. 100482, Sep. 2022. doi: 10.1016/j.measen.2022.100482. [Google Scholar] [CrossRef]
37. W. Ahmad, A. Ahmad, C. Lu, B. A. Khoso, and L. Huang, “A novel hybrid decision support system for thyroid disease forecasting,” Soft Comput., vol. 22, no. 1, pp. 5377–5383, Jan. 2018. doi: 10.1007/s00500-018-3045-9. [Google Scholar] [CrossRef]
38. A. H. Butt, T. Alkhalifah, F. Alturise, and Y. D. Khan, “Ensemble learning for hormone binding protein prediction: A promising approach for early diagnosis of thyroid hormone disorders in serum,” Diagnostics, vol. 13, no. 11, pp. 1940, Jun. 2023. doi: 10.3390/diagnostics13111940. [Google Scholar] [PubMed] [CrossRef]
39. S. Mishra, Y. Tadesse, A. Dash, L. Jena, and P. Ranjan, “Thyroid disorder analysis using random forest classifier,” in Int. Conf. Intel. Cloud Comp., Bhubaneswar, India, Aug. 2021. doi: 10.1007/978-981-15-6202-0_39. [Google Scholar] [CrossRef]
40. V. Kaur and R. Kaur, “An elucidation for machine learning algorithms used in healthcare,” in Machine Learning for Edge Computing, 1st edition, Boca Raton, FL, USA: CRC Press, 2022, vol. 1, pp. 25–36. [Google Scholar]
41. M. A. M. Ibarra, Y. V. Rey, M. D. Lytras, C. Y. Márquez, and J. C. S. Ramírez, “Classification of diseases using machine learning algorithms: A comparative study,” Mathematics, vol. 9, no. 15, pp. 1817, Jul. 2021. doi: 10.3390/math9151817. [Google Scholar] [CrossRef]
Cite This Article
 Copyright © 2024 The Author(s). Published by Tech Science Press.
This work is licensed under a Creative Commons Attribution 4.0 International License , which permits unrestricted use, distribution, and reproduction in any medium, provided the original work is properly cited.
 Downloads
 Citation Tools