
 Submit a Paper
 Propose a Special lssue
 Open Access
ARTICLE

IoT-Deep Learning Based Activity Recommendation System
1 Department of Electronics and Communication Engineering, Nandha Engineering College, Perundurai, 638052, Tamilnadu, India
2 Department of Computer Science, Sona College of Arts and Science, Salem, 636005, Tamilnadu, India
3 Department of Artificial Intelligence and Machine Learning Engineering, Gokaraju Rangaraju Institute of Engineering and Technology, Hyderabad, 500090, Telangana, India
4 Department of Computer Science and Engineering, Kongu Engineering College, Perundurai, 638060, Tamilnadu, India
* Corresponding Author: Sharmilee Kannan. Email:
Computer Systems Science and Engineering 2023, 45(2), 2001-2016. https://doi.org/10.32604/csse.2023.031965
Received 02 May 2022; Accepted 08 June 2022; Issue published 03 November 2022
 View Full Text
 Download PDF
Abstract
The rising use of mobile technology and smart gadgets in the field of health has had a significant impact on the global community. Health professionals are increasingly making use of the benefits of these technologies, resulting in a major improvement in health care both in and out of clinical settings. The Internet of Things (IoT) is a new internet revolution that is a rising research area, particularly in health care. Healthcare Monitoring Systems (HMS) have progressed rapidly as the usage of Wearable Sensors (WS) and smartphones have increased. The existing framework of conventional telemedicine’s store-and-forward method has some issues, including the need for a nearby health centre with dedicated employees and medical devices to prepare patient reports. Patients’ health can be continuously monitored using advanced WS that can be fitted or embedded in their bodies. This research proposes an innovative and smart HMS, which is built using recent technologies such as the IoT and Machine Learning (ML). In this study, we present an innovative and intelligent HMS based on cutting-edge technologies such as the IoT and Deep Learning (DL) + Restricted Boltzmann Machine (RBM). This DL + RBM model is clever enough to detect and process a patient’s data using a medical Decision Support System (DSS) to determine whether the patient is suffering from a major health problem and treat it accordingly. The recommended system’s behavior is increasingly investigated using a cross-validation test that determines various demographically relevant standard measures. Through a healthcare DSS, this framework is clever enough to detect and analyze a patient’s data. Experiment results further reveal that the proposed system is efficient and clever enough to deliver health care. The data reported in this study demonstrate the notion. This device is a low-cost solution for people living in distant places; anyone can use it to determine if they have a major health problem and seek treatment by contacting nearby hospitals.Keywords
To a greater extent, residents in modern society are contributing to chronic diseases such as high Blood Pressure (BP), coronary heart disease, and stroke by living unhealthy lifestyles such as staying up late, excessive weight loss, overeating, etc. In India, more than 300 million people are suffering from chronic diseases, according to the 2022 Health Survey [1]. The three chronic diseases, cancer, diabetes, and heart and cerebrovascular, are responsible for 11%, 15%, and 22%, respectively. India’s mortality rate is still increasing in proportions. In general, therapies for chronic diseases take longer to remedy than non-chronic diseases. The patient should be monitored in real-time so that if the disease starts to worsen, the patient can get medical help in time [2].
As a result of the widespread outbreak of Coronavirus Disease 2019 (COVID ‘19), the health care system has been impacted dramatically, along with everyday human lives. Healthcare Systems (HS) in developing and developed countries have been troubled by the slow production and distribution of vaccines. Although most countries have taken collaborative steps, deploying the vaccine and sanitising the environment has allowed the world economy to recover smoothly [3]. Moreover, removing the restrictions could trigger a new wave of mutations, which has been seen in the recent transformations of the Omicron virus. Healthcare service providers are also profoundly concerned about monitoring infected and recovered patients. Disability often prevents patients from adapting to long-term disease conditions, regardless of the type of illness. Those suffering from these diseases must be monitored continually and treated appropriately. Unfortunately, due to stressful working conditions, many family members cannot accompany the patient and provide real-time care, so the patient faces the risk of not receiving timely treatment when the disease occurs [4]. Traditionally, glucose levels, BP levels, and Heart Rate (HR) were measured in specialized healthcare centers using traditional methods. Nowadays, there is a different range of sensors that can be used to read vital signs, such as BP cuffs, glucose meters, HR monitors, and electrocardiograms, which make it possible to monitor patients’ vital signs day-to-day.
According to existing medical experimental reviews, the clinical use of telemedicine has been found effective in treating patients with cardiac diseases, diabetes, hypertension, and hypothermia. It has been termed “telemedicine” in the literature since the integration of mobile devices with Wearable Sensors (WS) facilitated the adaption of healthcare services from clinic-centric to patient-centric [5]. The most promising application is wireless monitoring systems for authentic-time monitoring of chronic illnesses such as cardiopulmonary disease, asthma, and heart failure in patients who are far from medical care facilities [6]. The IoT is an emerging technology that is being increasingly integrated into all aspects of human life. Astute homes, automated industries, schools, oil refineries, environmental monitoring systems, astute cities, and other applications of IoT are the most prevalent. Using an IoT-predicated perspicacious HMS, the challenge of authentic-time patient monitoring can be abbreviated. This could be wearable smart devices, homogeneous to a smartwatch, or it could be embedded in the patients’ beds. Biomedical signals can provide information about a person’s health; there is a plethora of data that can be amassed and necessary inferences drawn from it. HR, Oxygen saturation (SPO2), Carbon dioxide (CO2), Body Temperature (BT), BP, and other biomedical signals could be randomly chosen to find out how the patient is doing [7].
The IoT can be viewed through three paradigms: Internet-oriented middleware, things sensors, and cognizance-oriented semantics. Due to the interdisciplinary nature of the subject, such a delimitation is felicitous. When crossing between the three paradigms in the development of real-time applications, however, the IoT’s utility is reflected [8]. There are several issues with the IoT that are still being worked out. Its purpose, like that of the hardware layer, is to enable the interconnection of physical objects via sensors and related technologies. While there are contrivances with storage, processing, and internal components that should be more minuscule and efficient, the challenges associated with this layer are cognate to miniaturization. Sensors used to quantify diabetes, ECG, BP, and other conditions are not very accurate, their size is colossal, and they consume an abundance of potency. Another issue is the communications layer, which is responsible for billions of contrivances connected to the network and is responsible for amending bandwidth and the electromagnetic spectrum. When faced with the above from the application layer and accommodations, a plethora of options are presented that authorization patients’ ability to obtain, process, and recommend valuable information for disease treatment and lifestyle improvement. According to those mentioned earlier, it is imperative to capitalize on the benefits that come with advances in technology, such as the IoT, as they have become a powerful medium for the transfer of data from any hardware platform, sanctioning complete communication Person-to-Person (P2P) and Machine-to-Machine (M2 M), to ameliorate HS for chronic patients.
By quantifying health parameters and storing them on the cloud with the availability of IoT, ML techniques could be habituated to identifying patients from a substantial quantity of data. In many ways, combining ML and IoT will be salutary. IoT technology would assist health officials in disuniting patients who require immediate treatment from those who could be quarantined at home, obviating a massive patient bubble at hospitals and community health centers. This research proposes an innovative and smart healthcare system, which is built using recent technologies such as the IoT and ML. Through a healthcare DSS, this framework is clever enough to detect and analyze a patient’s data. This device is a low-cost solution for people living in distant places; anyone can use it to determine if they have a major health problem and seek treatment by contacting nearby healthcare centers.
In recent years, technology has been expeditiously integrated into the monitoring, diagnosis, and treatment of patients remotely and in situ in the field of health. As a result, patients’ quality of life is improved, and their information is more traceable. HMS for patients has been developed and is widely utilized. [9]: An amended lightweight elliptic bend cryptography-predicated end-to-end verification convention is proposed in [9]. The proposed model ameliorates security while truncating overall intricacy, according to the performance analysis. For a closed-circuit IoT medical services climate, [10] proposed an older patients’ wellbeing checking design predicated on an expeditiously perspicacious errand orchestrating approach. Internal temperature, Pulse Rate (PR), blood glucose level, and patient body position are all monitored utilizing wearable biomedical sensors. To detect irregularities in the wellbeing detection data, limit and AI-predicated methodologies were utilized. The results show that in IoT conditions, the engineering of older patient wellbeing checks can provide solid answers for rudimental errands.
[11] proposed a solution to the quandary of reading and storing data on the IoT platform. Most IoT-predicated systems, as we all know, include reading authentic-time data at conventional intervals, and healthcare is one of them. Due to various types of data and the conventional clinical data input, it becomes more arduous to interpret and store the data in a felicitous sequence in this scenario. As a result, this paper provides a method for doing so. Several IoT-predicated health cares real-time applications have optically discerned significant advancements in the last decade. Researchers have been working on a reference model for IoT execution. Kindred to perspicacious healthcare, Islam et al. (2015) [12] proposed a standard model for ameliorating IoT applications. According to this research article, three essential elements of view guide the design of an IoT application: IoT with a cloud and a network-based approach.
Many studies [13] looked into the real-time clinical applications of WS in cardiovascular, neurological, asthma, and hypertension diseases. For example, [14] developed a system to monitor patients with congestive heart failure that includes a biosensor in the form of a ring that monitors heart data. Similarly, systems for monitoring respiratory diseases have been developed that record acoustic signals by placing a microphone on the patient’s neck while breathing. The framework included a band-pass filter to minimize noise and other signal distortions, which achieved a quantification precision of around 90%. The research was then expanded to include algorithms for detecting apneas [15]. WS technology can be adapted to solve issues with kineticist artifact monitoring by cumulating multiple sensors on a single chip. Another application is the integration of multiple sensors on the same platform (tight-fitting in garments) to monitor respiratory diseases. Even though these systems are better than spirometry, they still need to be changed to reduce kineticism artefacts as much as possible.
The accumulation of WS technologies and mobile networks has the potential to open up incipient avenues for expeditious, dependable, and secure data transfer from patients to doctors. Furthermore, while WS technology has enabled the advancement of HMS, there are concerns that HMS’ performance may be harmed. These concerns include (1) failing to utilize authentic-time data on HMS during application testing; (2) battery issues; (3) security and privacy of patient data; (4) requiring professional medical recommendations at each stage of development; (5) clinical validation and expert acceptability; and (6) patient and healthcare professional utilizer-amicableness.
3 Proposed Model for Real-Time Healthcare Monitoring System
The proposed smart HMS can make decisions predicated on the patient’s optically canvassed conditions, such as BT, PR, and heartbeats. This model is ideal for energy-efficient solutions because it does not turn on all of the sensors all of the time. The system’s algorithm will manage how the sensors are utilized, as well as their cost and lifespan. The proposed system addresses the issue of remote patient monitoring and provides compulsory treatment through hospital experts. Communication channels, embedded internal and external sensors, an IoT server, and cloud storage are all part of the perspicacious HMS and patient management system proposed in this study, which is backed up by a gateway. The application, management, network, and contrivance layers are the different calibers of refinement where these activities are carried out. Fig. 1 depicts the architecture of the proposed system. In telemedicine, the utilisation of sensors and DSS is a novel concept that ameliorates telemedicine’s working performance in rural areas.

Figure 1: Proposed HMS model
As shown in Fig. 1, the system architect is multi-tiered, with
(a) A patient interface, or wearable biosensors’ tier,
(b) An Arduino device,
(c) An IoT Server which holds the fuzzy Neural Network (NN) model
(d) A portable smart device, such as a smartphone, reports the status of the patient along with recommendations.
(e) Cloud Gateway and server
The patient’s interface is the first tier of the system, which consists of multiple WS that accumulate medical data from the patient. This tier uses Bluetooth low energy to send genuine-time data from the patient’s WS devices to the second tier of the system. The Arduino is in the second tier and is utilised to extract patient data from WS. The Arduino contrivance has built-in wireless networking and can communicate with a web portal over General Packet Radio Services (GPRS), Third Generation (3G), and Wireless Fidelity (Wi-Fi) networks. In the third tier, the server extracts data from an internal SQLite database and sends it to an online My Structured Query Language (MySQL) database via GPRS/3G or Wi-Fi. ML is a platform that accumulates data from multiple patients wearing WS, applies a cognition model to the extracted data, and then sends the recommendation to the utilizer’s smartphone via healthcare applications. Six types of sensors were utilised in this research study to extract data on the patients’ HR, BP, stress level, PR, SpO2, and BT. The proposed system can utilise multiple sensors, enabling them to monitor multiple parameters from multiple patients simultaneously. The facility to obtain critical data utilising multiple sensors at the same time expands the applicability of the developed system and aids in comparing the precision of different sensors. Using WS to measure vital signs, the goal of this research is to make a real-time diagnostic system for patients who are far away.
(a) Heart Rate Sensor: It has been used to extract HR data from patients requiring continuous monitoring using Zephyr BT-WS. The Zephyr BT was chosen because of its accuracy, reliability, cost, availability, and comfort. Due to Bluetooth low energy technology, this sensor can be operated for a more extended period, thereby increasing its durability and minimising false alarms. Furthermore, Zephyr BT is compatible with Android version 4.4 and above.
(b) BP Sensor: An Omron wireless upper arm BP monitor is used to extracting and wirelessly transmit BP data. Unlike some other upper arm BP monitors, this sensor was selected for easy handling, lightweight, and long-term battery life. In addition, it can store up to 200 previous BP readings and send them to a portable listener.
(c) Body Temperature Sensor: BT is monitored using a Google Plus (G-plus), Bluetooth-based sensor. Wireless data is transmitted from the sensor to the handheld listener.
(d) Stress Level Sensor: Electrodermal Activity (EDA) sensors from Biosignalplux can detect changes in the electrical properties of the skin. Sweating is affected by changes in sympathetic nervous system activity, which alter sweat gland activity. Low–noise signal conditioning and amplification can make it possible to pick up even the faintest electrodermal skin response.
(e) SpO2 Sensor: The sensor solution MAX30100 includes a pulse-oximeter and a PR monitor. Through the use of two Light-Emitting Diodes (LEDs)–one red and one infrared–the sensor detects two wavelengths of light and measures the absorbance of pulsing blood via a photodetector. One can read the data with the tip of a finger using this particular LED color combination. A 16-deep First-In-First-Out (FIFO) within the device stores digital output data that is fully configurable through software registers. A host microcontroller can communicate with it via an I2C digital interface.
(f) Arduino Uno: Different Arduino boards are available in different designs, such as the Arduino Uno, Arduino Due, Arduino Mega, and Arduino Leonardo. In addition, there are six analog I/O pins, and 14 digital Input and Output (I/O) pins on the Arduino Uno. Aside from 54 digital I/O pins, the Arduino Due has 12 analog input pins and two analog output pins. The Arduino Mega has 54 digital I/O pins, 16 analog inputs, and ‘0’ output pins. The Arduino Leonardo has 20 digital I/O pins, 12 analog inputs, and ‘0’ output pins. To implement the system, we utilized the Arduino Uno because the pin configuration of this module consummates the requisites of our system and is the primary controller of the system. It is one of the most famous open-source microcontroller boards predicated on the ATmega328p. This microcontroller is programmable, utilizing the Arduino Integrated Development Environment (IDE). In this system, it plays a crucial role and works as an interface between the sensors and the other IoT devices.
3.1 Model of Deep Learning + Restricted Boltzmann Machine
In this section, we introduce the prototype and design of the proposed DL + RBM model. The architecture of the proposed model is shown in Fig. 2. DL + RBM is a subfield of ML algorithms in AI inspired by the Human Activity Recommendation (HAR). A DL + RBM model network topology consists of the input, output, and multiple hidden layers. The hidden layers are essential elements of the DL + RBM model and are actively engaged in learning. Using more hidden layers in the model training process may increase the model efficiency. However, it may come at the cost of computational complexity and overfitting. The DL + RBM model can be mathematically expressed in Eq. (1).

Figure 2: Deep leaning + RBM model
The ‘Pi’ represents output at a layer ‘i’, the ‘X’ represents bias value, and the ‘
For various reasons, we chose the DL + RBM model over other conventional ML algorithms. (a) Conventional learning algorithms use a single stack processing layer, which is insufficient for dealing with a complex natural dataset with high nonlinearity. (b) Traditional ML algorithms rely on HAR to extract the best features for successful prediction.
3.2 Data Transmission from Wearable Sensors
Fig. 3 depicts the data transmission process from sensors to the Arduino, heedfully perceiving the port via Bluetooth. By delimiting the message, Smarter Technology eXtension (STX) denotes the commencement of text in American Standard Code for Information Interchange (ASCII) characters. Message-ID is a binary number that is utilised to identify the message type. Zephyr BT’s standard message ID for heart monitoring is 0 × 26. The data length code designates the number of bytes in the data payload. The actual data transferred from Zephyr BT to the smartphone’s heedfully audibly perceiving port is contained in the data payload, which ranges from 0 to 128 bytes. Cyclic Redundancy Check (CRC)-8 is an 8-bit CRC polynomial with a value of 0 × 8C (CRC-8). Before beginning the CRC calculation, the accumulator is set to ‘0’. An End-of-Text character (ETX) is an ASCII control character that betokens the cessation of a message. Bluetooth is a short-wavelength radio transmission that operates in the Industrial, Scientific, and Medical (ISM) band between 2400 MHz and 2480 MHz and is utilised for standard data transmission over short ranges. In the current study, this technology is being used as a 115200 bps serial port transmission.

Figure 3: Communication message format
3.3 Algorithm for Data Extraction and Filtering
One of the most widely used methods for data dimensionality reduction and data de-noising is Principal Component Analysis (PCA). Multi-dimensional features are mapped to m-dimensional features to reduce data dimensionality. Noise space can be defined as the discarded dimensions in the new space, Eqs. (3) and (4).
STEP 1: Assume the mean value of the ith feature to find a new example, Eq. (5):
STEP 2: Assess the covariance of D1 to construct matrix (M), Eq. (6)
V(D1, D2) to find, Eq. (7)
STEP 3: Find the Eigen Value (EV) of ‘M’ and EV = (EV1, EV2,…,EVN) of the matrix ‘M’; Then, filter the first ‘M’ EV as the base, and work the original features onto the new EV to obtain dimensionality reduction. Data after ‘N’, Eq. (8)
STEP 4: Select the ‘M’ values with maximum EV.
3.4 Creating Interphase for Arduino Listening Port
The Arduino receives data from the system’s first-tier via Bluetooth Low Energy (BLE). Once the connection is established, the system’s heedfully aurally perceiving port uses Start_Le_Scan() to commence scanning for BLE sensors, and it ceases as soon as the process is consummated (the connection is established utilising the Connect)Gatt() approach). The HR data accumulated utilising Generic Attribute Profile (GATT) attributes in the system’s heedful auricular discerning port is in hexadecimal code, which is then converted to an integer value to measure the average HR. The Close() function closes the heedfully audibly perceiving port application once data from the sensor has been accumulated. eXtensive Messaging and Presence of Protocol (XMPP) networks are then used to transfer heart data from the smartphone to the data processing server. The smartphone preserves the history of the records on SD card recollection for data security. The data were preprocessed before being analysed by the server to determine the average HR over time.
Furthermore, when eccentric conditions occur, the data preprocessing server engenders alarms to alert the medico. Furthermore, the smartphone’s built-in Global Positioning System (GPS) is helpful in locating the patient’s GPS location. Fig. 4 shows screenshots of the heedfully auricularly discerning port interface. The heedfully auricularly discerning port’s first interface is a registration form that accumulates personal information from the patient such as denomination, age, gender, and contact information. The second interface exhibits the sensors and perceives the port’s connectivity status. An authentic-time HR data stream concerning time appears in the third interface.

Figure 4: Structure of RBM Port interface
4 Proposed Restricted Boltzmann Machine Based Recommendation System
4.1 Experimental Data with Deep Learning + Restricted Boltzmann Machine on Internet of Things
HMS can be improved by using Wireless WS networking technologies. It is widely used in improving the quality of HMS, HMS management, improving health and service costs, medical follow-up practices during surgery, as well as in performing the task of digital communication with medical experts. After the process, the connection is created through a unique program called “HMS,” and real-time healthcare data transmission is initiated. The data flow of the “HMS” is shown in Fig. 5.

Figure 5: Flow of data HMS
4.2 Restricted Boltzmann Machine
A Restricted Boltzmann Machine (RBM) is an Artificial Neural Network (ANN) with two layers (input and hidden layer) that learns a probability distribution from a set of inputs. It is stochastic (non-deterministic), and it is available in the resolution of sundry coalescence-predicated quandaries. Dimensionality abbreviation, relegation, regression, collaborative filtering, feature learning, and topic modeling are all possible with RBMs. An RBM is a type of Boltzmann Machine (BM), as the denomination implicatively insinuates. However, when considering the connections between the input and the obnubilated nodes of the Neural Network (NN), they are circumscribed in specific ways, making an RBM easier to implement than a BM. Each node in the input layer is connected to every node in the output layer, but no node in each layer is connected—constraint sanctions for more efficient training algorithms than those found in BM. As you can optically discern, all of the nodes in the input layer are connected to each node in the output layer. Because one input layer can utilise many obnubilated layers for training, the NN’s structure makes it efficient when it comes to training. Multiple RBMs can also be stacked on, resulting in a Deep Credence Network (DBF) that sanctions DL of the NN as well as supplemental learning. When visually examining how an RBM works, there are two steps: multiple inputs and reconstruction.
When training a NN, multiple inputs are considered the first step Fig. 6. The inputs are integrated into the partialness after being multiplied by the weights in the input layer. The activation function (sigmoid) is then applied, and the outputs determine whether the obnubilated state is activated. The NN’s weights are stored in a matrix, with the number of input nodes corresponding to the number of rows and the number of obnubilated nodes corresponding to the number of columns. The vector multiplication of the inputs is obtained by the primary obnubilated node, which is then multiplied by the first column of weights before the corresponding partialness term is integrated.

Figure 6: Multi-Input framework of RBM
And if you are wondering what a sigmoid function is, here is the Eqs. (9) and (10)
So the equation that we get in this step would be,
where
The logic of reconstruction is relatively straightforward. The activations are the inputs at this point, and they are passed to the obnubilated layer, which is then passed to the input later. Incipient biases are obtained as a result, and the reconstruction is the incipient output. These two steps follow one another: first, you engender activations utilizing the multiple inputs phase and then reconstruct them. This provides you with a more precise prognostication. When reconstructing in an epoch, the main goal is to reduce the reconstruction error as much as possible. This is done by adjusting the weights with each iteration of the algorithm.
Fig. 7 shows the reverse/reconstruction phase. It is similar to the first pass but in the opposite direction. Eq. (11) comes out to be:
where

Figure 7: Reconstruction framework of RBM
Now, the difference
And in the backward pass, while reconstructing the input, we are calculating the probability of output
The weights used in both the forward and the backward pass are the same. Together, these two conditional probabilities lead us to the joint distribution of inputs and the activations, Eq. (14)
Reconstruction is different from regression or classification in that it estimates the probability distribution of the original input instead of associating a continuous or discrete value to an input example. This means it is trying to guess multiple values at the same time. This is known as generative learning as opposed to the discriminative learning that happens in a classification problem (mapping input to labels).
4.6 The Proposed Restricted Boltzmann Machine Based Recommendation Algorithm
Step 1: We use
Step 2: In the visible layer, the input ‘
Step 3: It is possible to specify the number of hidden nodes to generally be less than the number of visible nodes to ensure the hidden layer learns the most salient aspects of the original input much more efficiently.
Step 4: This
Step 5: Activating the hidden layer generates outputs that are generated stochastically when we use a process known as Gibbs sampling. An improved generative model can be created with this level of randomness.
Step 6: After Gibbs sampling, the output known as h0 is passed in the opposite direction back to the visible layer, known as a backward pass. The activations from the forward pass are fed into the hidden layer and multiplied ‘
Step 7: As a result of an activation function, we a new
The information accumulated by the sensors was sent to the server. The outcomes are exhibited in the Arduino app.
Dataset
In telemedicine, utilising sensors and DSS is a novel concept. The proposed system is a low-cost and efficacious solution for people living in rural areas; they can utilise it to determine whether they are suffering from an acute health quandary and, if so, seek treatment from nearby hospitals. Tab. 1 shows a patient report sample that is engendered on the server after data is amassed via sensors and forwarded via astute contrivance. The report is divided into three sections: patient data, sensor data, and patient symptoms.

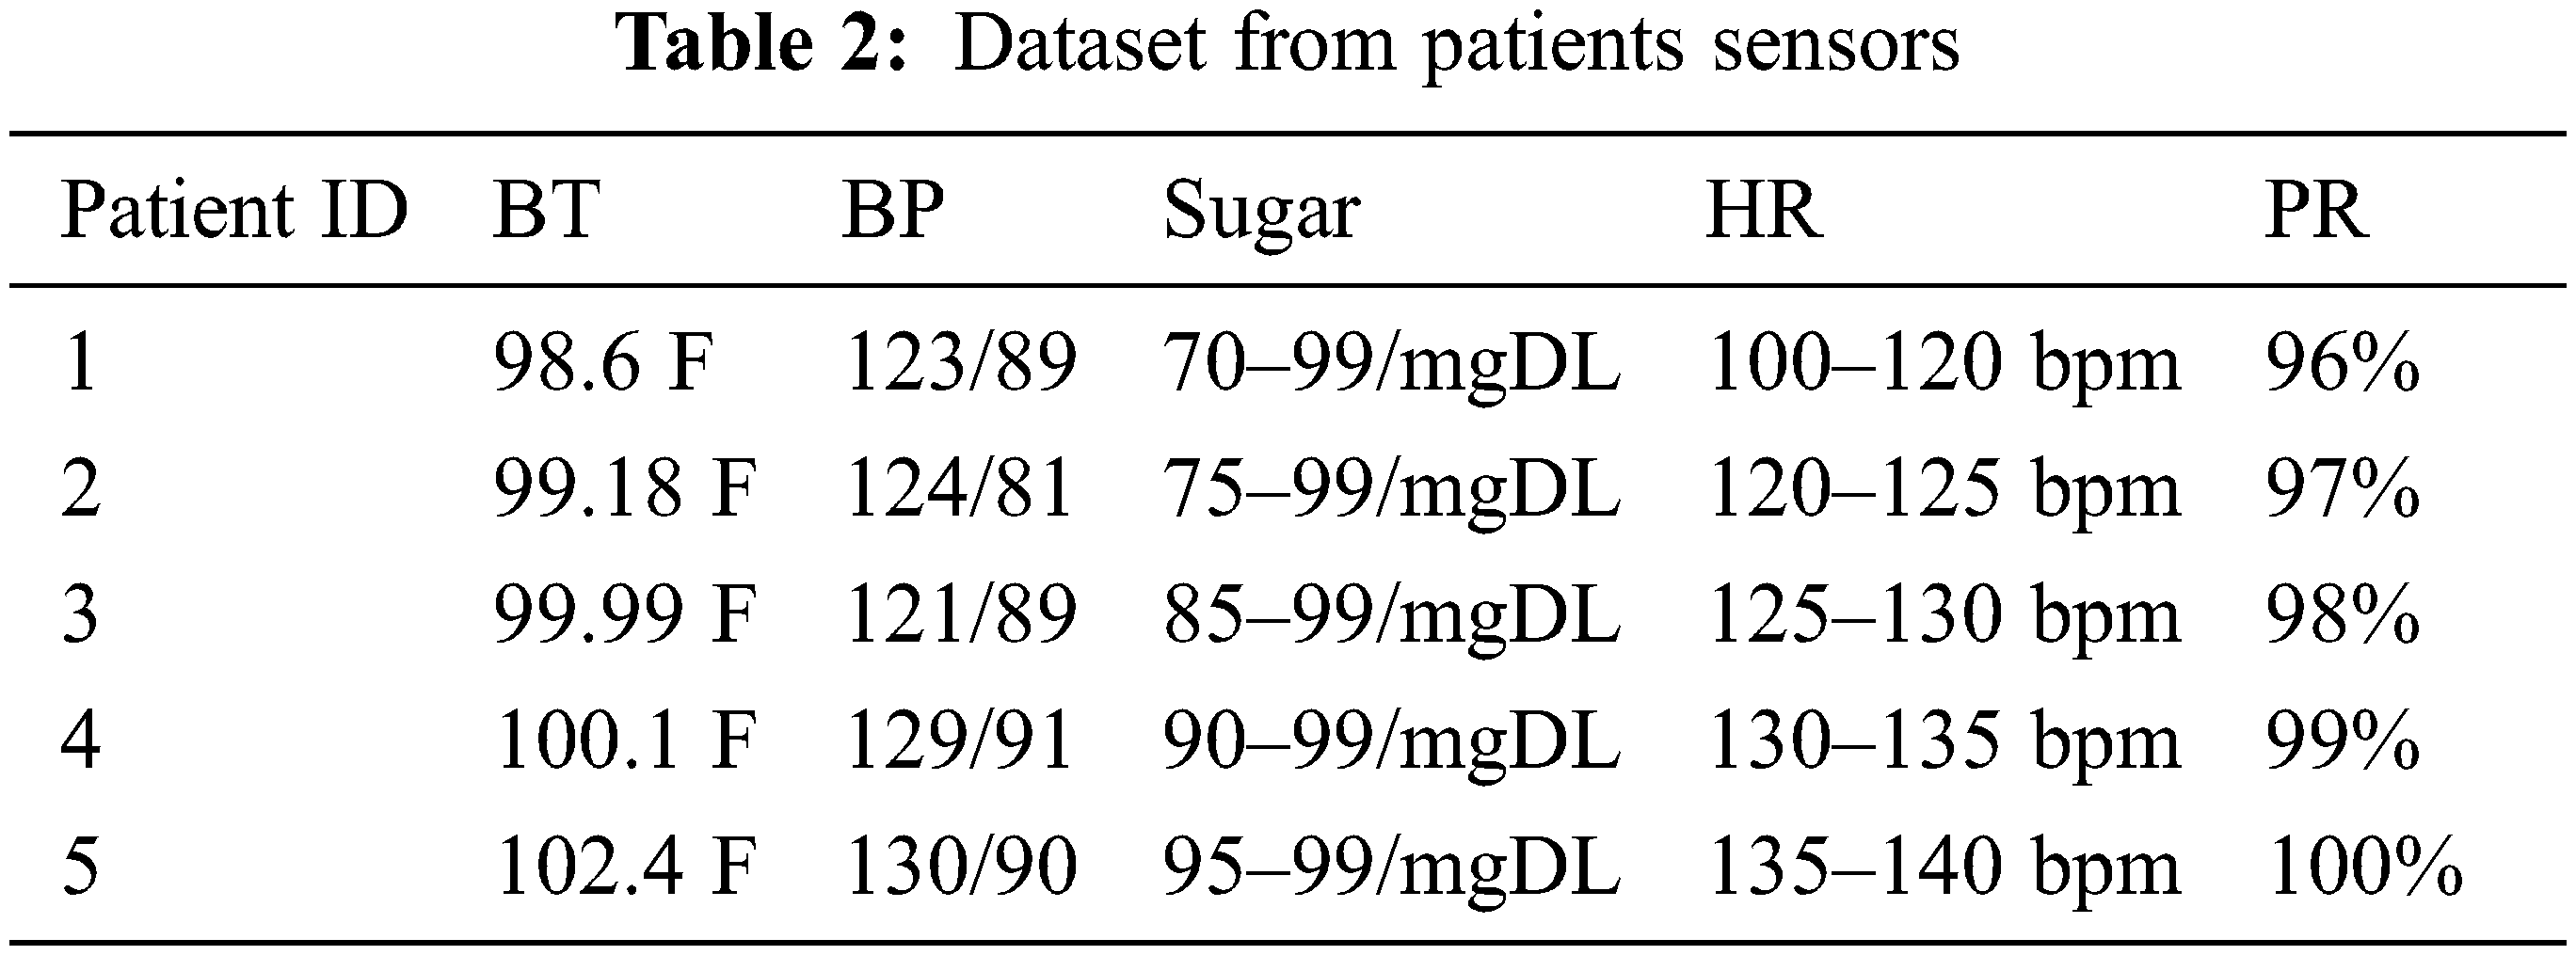
Four patient parameters were quantified for performance analysis: HR, BT, BP, and SPO2. By comparing the quantification data to commercially available sensors, the system’s efficacy can be resolved. The comparison of measured data of HR, BP, BT, and SPO2 with the commercial sensor is shown in Fig. 8 and Tab. 2. The relative error was between 0.00 and 2.89 for HR. The MLX90614 sensor was accustomed to quantifying the patient’s BT, which was compared to a commercial non-contact sensor. The maximum relative error was calculated to be 3.03, with the value varying depending on environmental factors such as sultriness and the sensor’s precise placement. In the case of temperature quantification, the relationship between relative error and the number of subjects. The BP is quantified using a handcuff system that has been developed. The developed system uses a separate SPO2 sensor. The maximum relative error was found to be 1.05, which means that the system for measuring Oxygen (O2) is very accurate.

Figure 8: Relative error vs. No. of subjects in HR, BP, SPO2, and temperature
The formulae in the proposed RS are used to assess its precision. The decision is made by the RBM system, and the precision of the decision is quantified Fig. 9. The figure shows that the system’s precision ranges from 94% to 100% for the proposed system. This shows that the proposed system works the way the rules for patient care and DSS say it should.

Figure 9: Decision model results
The proposed system’s precision is tenacious to Eq. (15). μ(ai) is the percentage precision for the data in the experiment, and n is the number of experiments. In this dataset, the average precision is 97%. The experimental results show that sensor-predicated IoT systems are convenient and feasible thanks to perspicacious and DSS. The IoT methodology is available to ameliorate the system’s performance and throughput. Utilizing the formula shown in, the percentage error of the results is calculated, Eq. (16). The accepted value is the required precision, while the experimental precision is the higher level of the tests.
The data in Figs. 10 and 11 demonstrate the precision and consistency of the obtained results. The designed methodology is a patient HMS and management system that employs an RBM system to assess patient status and provide remedies. Figs. 8 and 9 show that using sensors and decision support systems improves our approach’s performance. The DSS of the RBM improves the utility and accuracy of the suggested system. This technology is unique in that it makes smart decisions using sensors and an IoT-based system. The results indicate that the RBM-based system is more accurate, saves time, is less expensive, and is more superficial.

Figure 10: Accuracy of a fuzzy-based Decision Model

Figure 11: Reliability of a fuzzy-based decision model
We used weight balance to prepare for the analysis. The effect of some parameters, i.e., learning rate and activation functions, on accuracy is summarised in Tab. 3: The performance of different phenotypes. We have optimized the parameters set for all the learning algorithms for accuracy-based analysis Tab. 3.

The IoT is increasingly regarded as one of the practical alternatives for any remote value tracking, predominantly in the sphere of HMS. It makes it possible for individual prosperity parameter data to be stored in the cloud, hospital stays for standard routine examinations to be reduced, and, most importantly, health can be tracked and disease detected by any physician at any location. Wireless and WS technology improvements enable the possibility of real-time HMS. A real-time HMS for patients in remote places has been proposed in this study. Sensors for BT, HR and BP are used in the suggested approach to determine the status of the patient during monitoring. The system used a knowledge base and an RBM framework for DSS for patient care, monitoring, and supervision to determine possible conditions and cures. In terms of time, cost, and labor consumption, the suggested method aims to increase the model’s performance for medical care and monitoring. The results also show that the proposed ML is a good choice for an intelligent DSS and that it provides a cheap hardware and software solution.
Funding Statement: The authors received no specific funding for this study.
Conflicts of Interest: The authors declare that they have no conflicts of interest to report regarding the present study.
References
1. M. Ilyas, “IoT applications in smart cities,” in Int. Conf. on Electronic Communications, Internet of Things and Big Data, Yilan County, Taiwan, pp. 44–47, 2021. [Google Scholar]
2. X. Boyi, D. X. Li, C. Hongming, X. Cheng, H. Jingyuan et al., “Ubiquitous data accessing method in IoT-based information system for emergency medical services,” IEEE Transactions on Industrial Informatics, vol. 10, no. 2, pp. 1578–1586, 2014. [Google Scholar]
3. S. B. Baker, W. Xiang and I. Atkinson, “Internet of things for smart healthcare: Technologies, challenges, and opportunities,” IEEE Access, vol. 5, pp. 26521–26544, 2017. [Google Scholar]
4. Z. U. Ahmed, M. G. Mortuza, M. J. Uddin, M. H. Kabir, M. Mahiuddin et al., “Internet of things based patient health monitoring system using wearable biomedical device,” in Int. Conf. on Innovation in Engineering and Technology, Dhaka, Bangladesh, pp. 1–5, 2018. [Google Scholar]
5. A. Bekkanti, Y. Suganya, P. Valarmathi, S. Ganesan and C. Z. Basha, “Novel approach of internet of things (IoT) based smart ambulance system for patient’s health monitoring,” in 2nd Int. Conf. on Smart Electronics and Communication, Trichy, India, pp. 29–34, 2021. [Google Scholar]
6. A. Joy, T. H. Hafsiya and G. King, “A review on glucose monitoring using enabling technologies of internet of things,” in 7th Int. Conf. on Advanced Computing and Communication Systems, Coimbatore, India, pp. 270–273, 2021. [Google Scholar]
7. P. Verma and S. K. Sood, “Fog assisted-IoT enabled patient health monitoring in smart homes,” IEEE Internet of Things Journal, vol. 5, no. 3, pp. 1789–1796, 2018. [Google Scholar]
8. M. A. Rahmat, E. L. M. Su, M. M. Addi and C. F. Yeong, “GluQo: IoT-based non-invasive blood glucose monitoring,” Journal of Telecommunication Electronic and Computer Engineering, vol. 9, no. 3–9, pp. 71–75, 2017. [Google Scholar]
9. S. K. Kharroub, K. Abualsaud and M. Guizani, “Medical IoT: A comprehensive survey of different encryption and security techniques,” in Int. Wireless Communications and Mobile Computing, Limassol, Cyprus, pp. 1891–1896, 2020. [Google Scholar]
10. A. Kumar, R. Krishnamurthi, A. Nayyar, K. Sharma, V. Grover et al., “A novel smart healthcare design, simulation, and implementation using healthcare 4.0 processes,” IEEE Access, vol. 8, pp. 118433–118471, 2020. [Google Scholar]
11. N. Park, J. Park and H. Kim, “Inter-authentication and session key sharing procedure for secure M2 M/IoT environment,” International Information Institute (Tokyo). Information, vol. 18, no. 1, pp. 261, 2015. [Google Scholar]
12. P. V. Oorschot and S. Smith, “The internet of things: Security challenges,” IEEE Security & Privacy, vol. 17, no. 5, pp. 7–9, 2019. [Google Scholar]
13. M. Jan, I. Weber, W. V. D. Aalst, J. V. Brocke, C. Cabanillas et al., “Blockchains for business process management-challenges and opportunities,” ACM Transactions on Management Information Systems, vol. 9, no. 1, pp. 4–12, 2018. [Google Scholar]
14. S. Tanwar, Q. Bhatia, P. Patel, A. Kumari, P. K. Singh et al., “Machine learning adoption in blockchain-based smart applications: The challenges and a way forward,” IEEE Access, vol. 8, pp. 474–488, 2020. [Google Scholar]
15. P. Mamoshina, L. Ojomoko, Y. Yanovich, A. Ostrovski, A. Botezatu et al., “Converging blockchain and next-generation artificial intelligence technologies to decentralize and accelerate biomedical research and healthcare,” Oncotarget, vol. 9, no. 5, pp. 5665, 2018. [Google Scholar]
Cite This Article
 Copyright © 2023 The Author(s). Published by Tech Science Press.
This work is licensed under a Creative Commons Attribution 4.0 International License , which permits unrestricted use, distribution, and reproduction in any medium, provided the original work is properly cited.
 Downloads
 Citation Tools