
 Submit a Paper
 Propose a Special lssue
 Open Access
ARTICLE

Performance Analysis of Hybrid RR Algorithm for Anomaly Detection in Streaming Data
1 Department of Computer Science and Engineering, K. Ramakrishnan College of Engineering, Trichy, Tamilnadu-621112, India
2 Department of Information Technology, PSNA College of Engineering and Technology, Dindigul, Tamilnadu-624622, India
* Corresponding Author: L. Amudha. Email:
Computer Systems Science and Engineering 2023, 45(3), 2299-2312. https://doi.org/10.32604/csse.2023.031169
Received 11 April 2022; Accepted 14 June 2022; Issue published 21 December 2022
 View Full Text
 Download PDF
Abstract
Automated live video stream analytics has been extensively researched in recent times. Most of the traditional methods for video anomaly detection is supervised and use a single classifier to identify an anomaly in a frame. We propose a 3-stage ensemble-based unsupervised deep reinforcement algorithm with an underlying Long Short Term Memory (LSTM) based Recurrent Neural Network (RNN). In the first stage, an ensemble of LSTM-RNNs are deployed to generate the anomaly score. The second stage uses the least square method for optimal anomaly score generation. The third stage adopts award-based reinforcement learning to update the model. The proposed Hybrid Ensemble RR Model was tested on standard pedestrian datasets UCSDPed1, USDPed2. The data set has 70 videos in UCSD Ped1 and 28 videos in UCSD Ped2 with a total of 18560 frames. Since a real-time stream has strict memory constraints and storage issues, a simple computing machine does not suffice in performing analytics with stream data. Hence the proposed research is designed to work on a GPU (Graphics Processing Unit), TPU (Tensor Processing Unit) supported framework. As shown in the experimental results section, recorded observations on frame-level EER (Equal Error Rate) and AUC (Area Under Curve) showed a 9% reduction in EER in UCSD Ped1, a 13% reduction in ERR in UCSD Ped2 and a 4% improvement in accuracy in both datasets.Keywords
Intelligent analytics on video streams is made easy with the emerging ample deep learning models. With the plentiful growth in innovations and facilities, recent days reveal that more and more people rely on CCTV cameras to monitor and ensure the safety of the house, shops, office, building, schools, hospitals, restaurants, banks, malls and so on. These changes reveal the fact that human race has undergone such a civilization alteration in the last decade. Every sector has shown marvellous growth, and hence the financial condition of most of the people in the country has enhanced. Everybody knows all are under surveillance wherever they go–may it be a supermarket, temple and hospital etc. It is also a fact that now in many houses, to ensure the safety of the aged and children, surveillance systems have been mounted. But, in reality, it is not possible for any person to sit and watch the complete video every day. Once again it needs manual monitoring and analysis to identify any abnormal scenes. There are scientific facts that reveal that human observers become fatigued in about 12 to 15 min and start overlooking a reasonable percentage of the activities, which could lead to missing the target. In another way, we can say that it is of no use to sit and watch very late after a crime has occurred. Surveillance systems can be only completely meaningful if it is completely autonomous and if they can identify an abnormal situation as and when something happens differently. A lot about autonomous systems has been discussed by Plamen et al. [1]. The prescriptive measures for detecting a deviation must also be well defined in advance, So that manual intervention is not needed at all times when handling real-time streams [2].
Extensive research has been done on anomaly detection on surveillance video data. Krizhevsky et al. and Girshick et al. discuss the deep learning techniques for image classification and computer vision tasks for object detection [3,4]. One of the best deep learning methods to find abnormalities is found to be an autoencoder that tries to regenerate the original image in doing the validation process. Based on the availability of labels the available anomaly detection methods can be classified as three methods: i) Supervised, ii) Semi-supervised and iii) Unsupervised anomaly detection [5]. The supervised method necessitates the availability of both normal and anomaly samples with labels. But this method is practically not feasible since in real-world scenario, abnormal events are unexpected and every anomaly cannot be completely predefined. It is not always possible to collect all types of anomaly images well ahead during model creation. Hence supervised model can be used only for minimum types of applications where all kinds of anomalous situations are completely available. The second method is the Semi-supervised method where the training can be done with normal behaviour. During testing, any scene that deviates from the normal image would be classified as abnormal activity. Even though semi-supervised methods are widely applicable, the decision of feature selection with the low level or high-level features is still a great challenge. The third method is the unsupervised method, where the training phase does not use any labels. The unsupervised method detects anomalies by analyzing the data completely and identifies normal and abnormal data based on the characteristics and behaviour of the available data [6]. Unsupervised learners are best suited to explore tons of unlabeled data. This learner acts like a regularizer and optimizer and provides a structured output. Particularly these methods use local change detection to identify anomalies in images. However, to improve the accuracy, Wang et al. (2018) discuss a two-stage unsupervised method to detect anomalies by using an autoencoder framework [7].
The survey reveals that among other deep learning models Autoencoders gives the greatest accuracy for anomaly detection [8]. While Autoencoders are designed to find anomalies with an image frame, their performance on real-time streaming video is still unexplored. Though, autoencoders proved to be a successful method for anomaly detection, the major issue was the computational complexity, high cost and slow-learning process [9]. The model took a lot of time in the training phases. Considering these issues, this paper formulates a novel and efficient method to identify abnormal behaviors in video scenes using an ensemble of classifiers. One of the key properties of video analytics is the resource: accuracy relationship. For any vision-based model generation, the key parameters are frame resolution, frame sampling, incoming data rate and a number of CPU cores. Therefore the accuracy of the system is proportional to the quality and availability of the above parameters. The speed of video analysis can be calculated by the number of frames processed by the algorithm per second. Each frame shall be reproduced with the information about that scene [10]. This paper proposes a hybrid ensemble model that uses the combined features of autoencoders, recurrent neural networks and reinforcement networks to build a novel and robust model. This model is trained using the ensemble method to generate set of anomaly scores. The anomaly index for every frame is calculated using Multivariate Gaussian distribution. The suspicious behavior in the scene is recognized by applying least square method on a series of anomaly scores.
The remaining paper is organized as follows: Section 2 narrates the related work by different people in the area of anomaly detection under three main categories–supervised, unsupervised and ensemble learners [11]. Section 3 provides the methodology and working of our proposed HERR Algorithm. Section 4 shows the experimental results with the steps in our proposed method, the datasets that are used for validation of our model, the results obtained and the performance analysis of the system. Section 5 presents the conclusion and summary of the proposed work.
The issues and need for anomaly detection are extensively discussed in the literature. In recent years, deep learning has played a major part in finding world-wide solutions to data analytical problems. Every business uses deep learning methods to improve profit and delight the customer with better insights. While traditional machine learning algorithms struggled to handle the analytical solutions for the exponential data generated by numerous data sources, deep learning algorithms handled the voluminous data at ease. The most popular methods in anomaly detection are 1. Model-based approach, 2. Proximity-based approach, 3. Classification based approach, 4. Prediction based approach, 5. Reconstruction based approach and Clustering-based approaches. The proposed work is a combination of model-based approach and a reconstruction based method.
Autoencoders are a special type of deep learning model applied to images to identify outliers and anomalous behaviors [12]. Variational, deep autoencoders and stacked auto-encoders are variants of the basic model to apply on 52 specific problems. All these methods follow the 2 step process of encodes and decoding to reconstruct the original image. If reconstruction fails then the input can be considered an anomaly. Convolutional Neural Network (CNN) is a feature learning model used mainly for object detection and image classification and recognition. It was first introduced by Fukushima in the year 1988. CNN is usually used as surface area anomaly detection in images. Usually, a Convolutional Neural Network is designed with 3 subsequent layers. The first comes the Convolutional Layer, the second one being a Pooling or subsampling layer where dimensionality reduction is done for the process of subsampling [13]. The last level of a CNN would be a fully connected pool max layer. The convolutional equation is given as a part of analysis, y = f(∑Kij%
As complementary to feedforward networks, Recurrent Neural Networks (RNN) use backpropagation. RNNs are powerful dynamic systems that can be applied for real-time streaming data that are temporal in nature [14]. The earlier models like CNN, and autoencoders are models that work well with data that does not have any time-dependencies. But most of the real-time data like finance based stock data streams, surveillance video streams, smart traffic streams and data from fraud detection systems are time-series in nature [15]. RNN is the best model for real-time time series data that has the capability to keep track of previous data in memory to compute the next output sequence [16]. If the input of the model is defined as X = {x0, x1, x2, …, xn}, the state function of the output sequence at the next layer is in terms of St = Fθ(St−1, xt).
Unlike supervised or unsupervised, the reinforcement learning method makes much use of automation of machine decisions based on earlier conditions or actions. However, reinforcement algorithm does not use training and test data sets. They analyze real-world circumstances and update their model on their own. Based on positive or negative reinforcement, the rewards are adjusted and model is updated. Adam et al. [17] modelled the real-time approach using Multiple Location (ML) Monitors to collect the low-level features in video frames. He used exponential distribution to characterize the flow probability matrix. Kim et al. [18] used the Mixture of Probabilistic Principal Component Analysis (MPPCA) to get low-level measures and model the local activity patterns with optical flow. They used space-time MRF (Markov Random Fields) to model video frames and used MPPCA to identify abnormalities in the scenes. Mehran et al. [19] proposed a method called the SF model to detect deviations in the image features. Marchi et al. [20] tested LSTM neural networks to identify Anomaly. Xu et al. [21] applied Variational autoencoders to detect anomalies in crowded scenes.
However, all these algorithms face the following difficulties, i) most of the methods are supervised, by providing the label very well in advance, ii) most of the existing methods concentrate on feature identification and object detection using traditional machine learning algorithms. iii) Very recently research are made towards deep learning approaches, ensembles, multi-core computation and parallelization. Hence the proposed method uses an unsupervised method where feature identification is eliminated. Also, considering the time-series nature of video streams, all experiments are carried out on a GPU-TPU supported environment.
3 Model Building of the Proposed Methodology
The proposed HERR algorithm makes use of the self-learning methodology of reinforcement learning with the object detection methods of deep neural networks. The proposed model uses Global Matching Hidden Markov Model (GM-HMM) which is density aware motion detection method that can be applied in images to identify anomalies. HMM uses ORB (Oriented FAST and Rotated BRIEF) detectors to generate the foreground mask and perspective mask. In the first step Global Matching (GM) is used to identify the foreground pixels in the image and aids in generating the blobs generation. In one step2, feature extraction is done using HOG (Histogram of Oriented Gradients) to accurately identify objects in the image. Automatic detection of pedestrians with HOG is easier since all the persons are mostly upright in the image.
Anomaly detection is a type of video analytics and our proposed method implements anomaly detection in 4 stages–Dataset selection, model building, anomaly score calculation and optimal anomaly detection. The workflow of the proposed model is shown in Fig. 1. The model building is proposed as a 2 stage unsupervised approach to identify abnormalities in the input video. Preprocessing of input is done in stage 1 and in stage 2 we calculate the reconstruction loss function to discover the anomaly in the input image. If the reconstruction loss is smaller, it indicates a normal frame. If in contrast, the loss function is greater than a relative amount, then that frame is considered as an anomaly. This loss function is considered as the deciding factor in our proposed model to indicate the probability of normal and anomaly images.
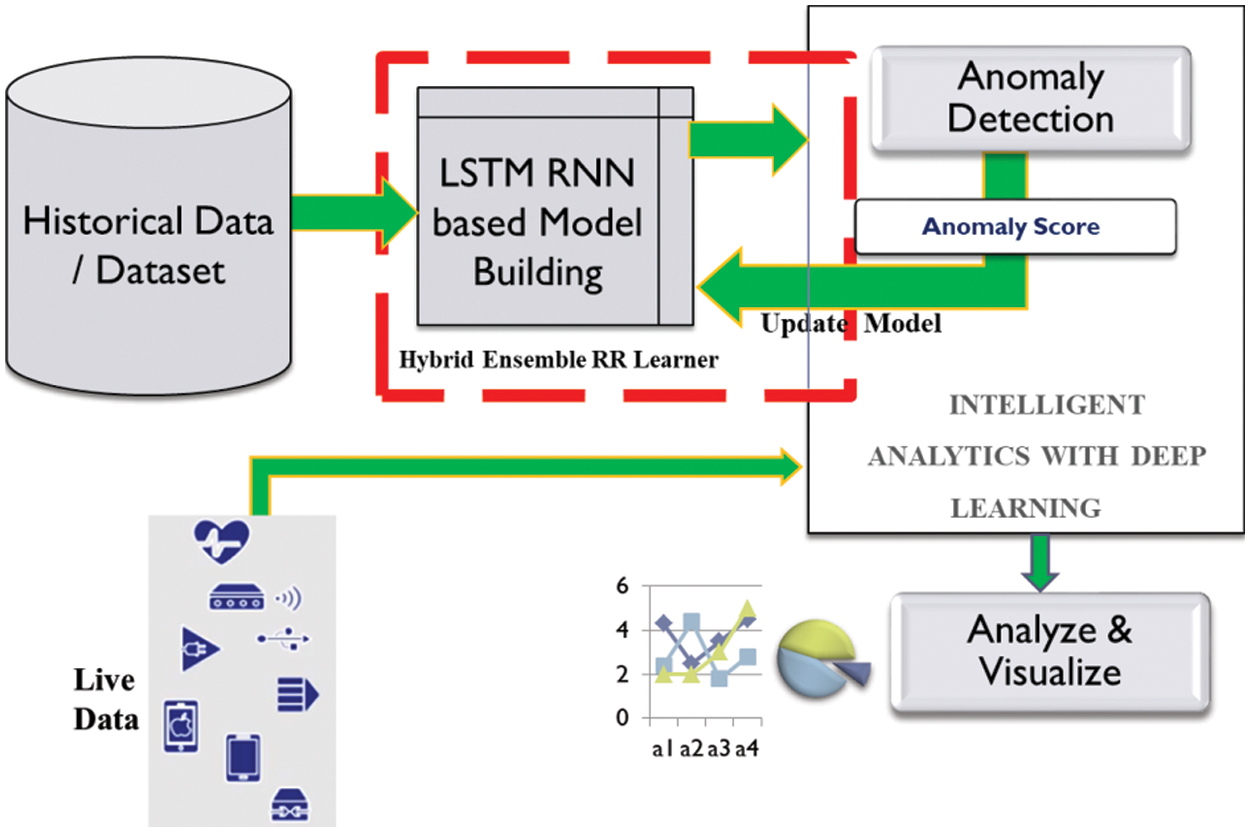
Figure 1: Proposed ensemble recurrent reinforcement model
Best results are obtained as a combination of more classifiers thus producing a classifier with better performance than might have been produced from a single classifier. The type of classifier used is LSTM (Long Short Term Memory) Networks since they give better performance in processing real-time video streams. Ensemble learning is supported by two concepts bagging and boosting. In deep learning, it is difficult to develop a strong learner. But it is easy to develop a set of weak learners and these sets of weak learners can be boosted into strong learners. The ensemble learning method is the best solution to handle the problems of concept drifting in streaming data. Our model with 7 ensembles is shown in Fig. 2.
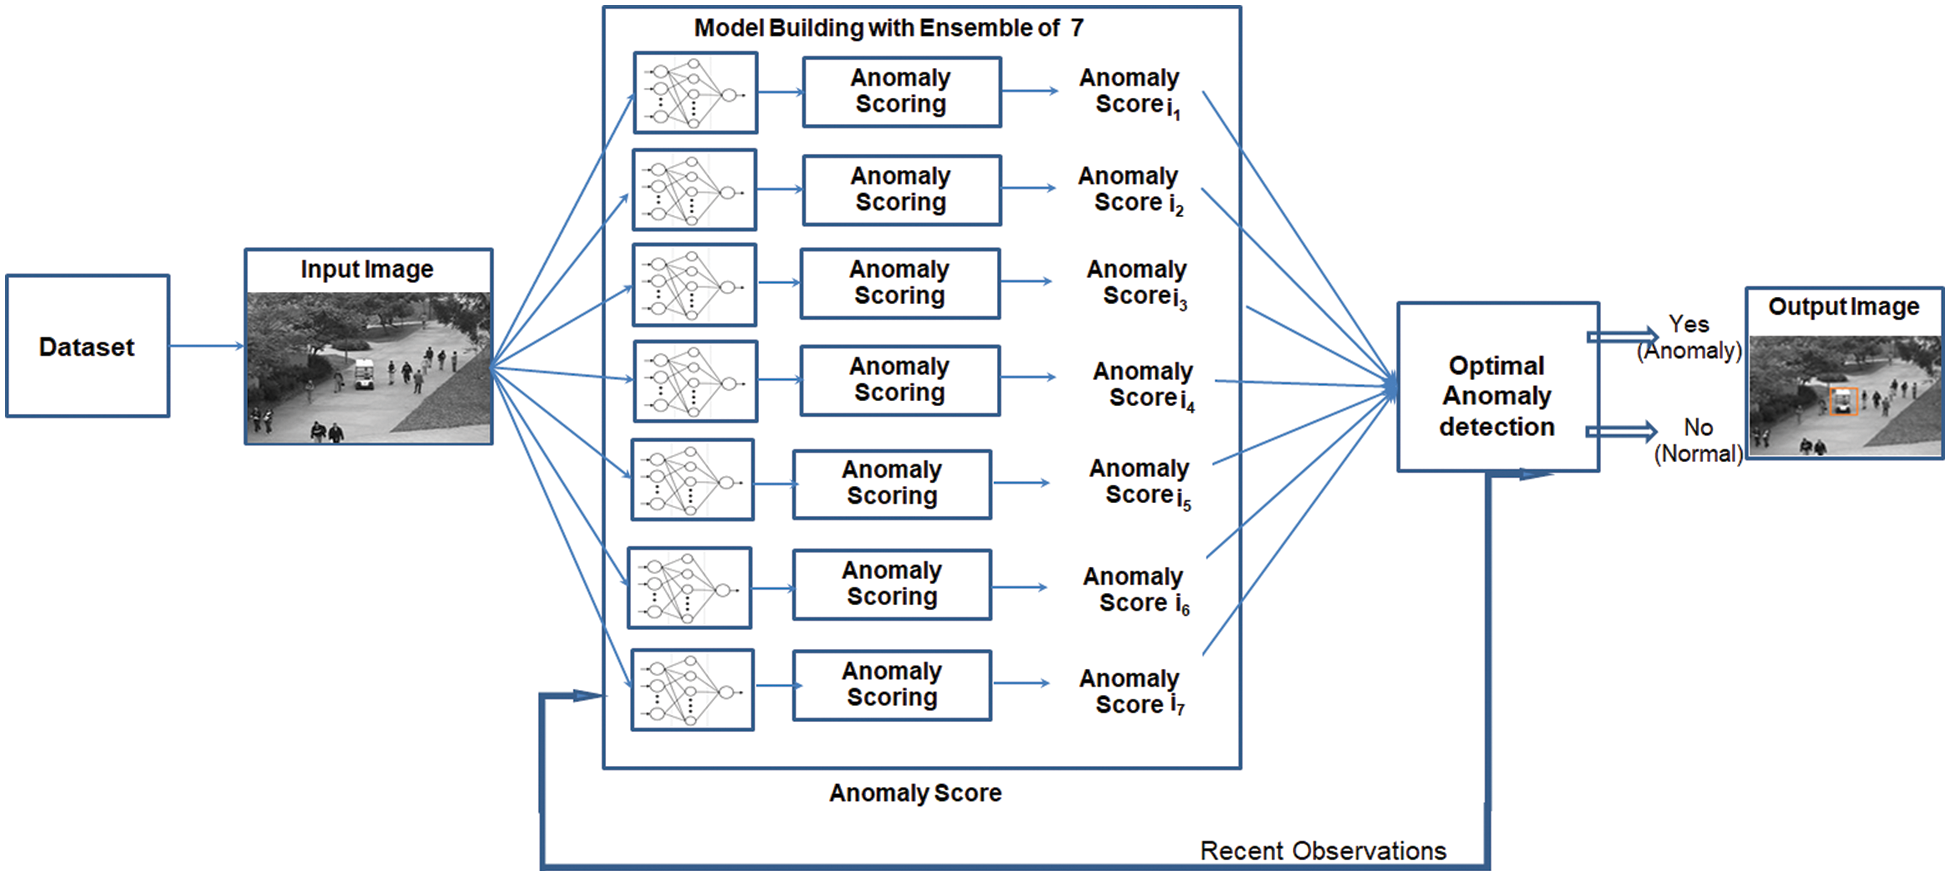
Figure 2: Proposed deep ensemble framework for anomaly score generation
3.2 Working Principle of LSTM-RNN Learner
LSTM based networks are best suited for time series applications since it uses a forget to layer and remembers only the information necessary for the classifier. LSTMs consider the current input and previously hidden state information at that time instant t. The computations done by the LSTM are given by the equations (1) through (6). In each step, the LSTM unit updates the cell state, ct and hidden state vector ht. This process is done recursively each step for every timestamp t = 1 to T, where T defines the timestamp of a sequential data x1, x2, x3, …, xT. The output of an LSTM unit is defined by the sequence y1, y2, y3,…, yT. The proposed LSTM unit calculates and generates a score for each frame separately. The benefit of feature learning methods like RNN-LSTM is the automatic classification of frames as normal and abnormal frames by working on the hierarchical features. The problem of vanishing gradients is overcome by augmenting with the recurrent forget gates ft.
Input Gate: i–a neural network with sigmoid activation
Output Gate: o-a neural network with sigmoid activation
Forget Gate: f-a neural network with sigmoid activation function
Candidate layer: c–a neural network with tanh activation function
Hidden state: h
Memory state: c
The input gate it and forget gates ft acts as a level controller during the learning process. yt is the output gate, which defines the anomaly index Reconstruction error is obtained by finding the Euclidean distance between the original and reconstruction image. These three equations (Eqs. (1)–(3)) describing it, ft and yt are called gating equations.
An LSTM cell at time step t is represented in Fig. 3.
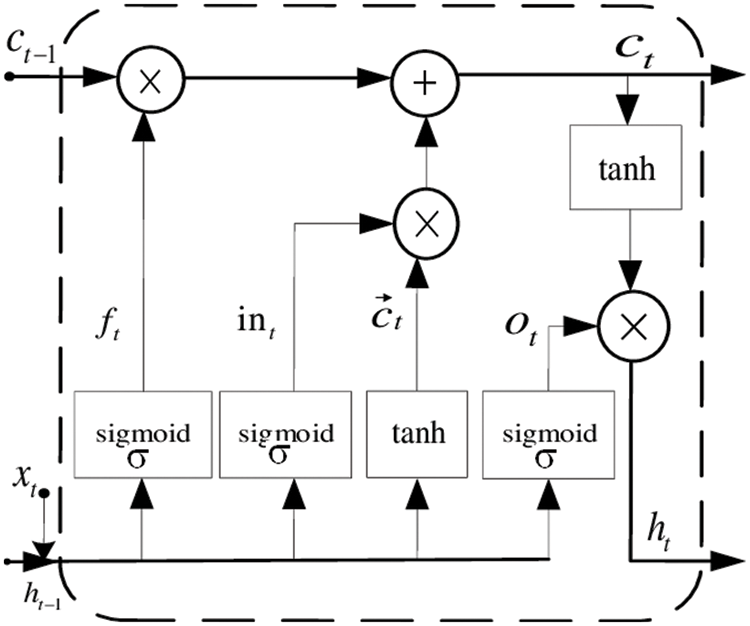
Figure 3: LSTM network
The Deep Neural Algorithm-Hybrid Ensemble Recurrent Learner
The parameter wj is the weight of the jth classifier. The optimal weight vector
Prescriptive Reinforcement Learning with Reward Penalty System
As a final stage of our proposed work, we applied a deep reinforcement learning approach on the unlabelled input instances and compared them with the labelled instances to generate the penalty/reward score.
In this module, we applied our Prescriptive Alert Generation and Repair algorithm to real-time video streams. Prescriptive analytics can be defined as the final frontier of analytic capability. It is one step ahead of predictive analysis and more action-oriented. In the current work, Prescriptive analytics is implemented with a Reinforcement learning algorithm that sits on top of the RNN model. Our Reinforcement algorithm works as the UI (User Interface) framework of the proposed autonomous anomaly handling system. The fitness function is calculated periodically to evaluate the performance of the underlying RNN network. Our model is designed to generate a series of tasks and Alerts in case of each specific anomaly.
This module is built as an autonomous intelligent Turing Machine with specific states and actions. Bellman’s equation is used to find the value of Q(s, a) for all states and actions in the environment. Eq. (7) defines the collective reward of the action starting from state ‘S’ with action ‘a’. The long term reward starting from state S and performing action ‘a’, is, therefore, sum of the current reward ‘r’ and the maximum of the long term rewards obtained from the next state
In this method, we experiment on the standard UCSD pedestrian data set. It consists of 2 sets of video data sets-UCSD Pedestrian 1 and UCSD Pedestrian 2. UCSD dataset was created with a stationary camera mounted at a certain height in a pedestrian walkway. The frame resolution of Pedestrian 1 is 158 × 238 pixels and the frame resolution of Pedestrian 2 is 240 × 360 pixels. UCSD Ped1 consists of 34 training video samples and 36 testing video samples. UCSD Ped2 has 16 training video samples and 12 testing video samples. Each dataset has both training and testing frames separately. The training set has normal images with only pedestrians in the walkway. The testing set has both normal frames and abnormal frames. The abnormal frame has objects like skaters, truck, cycles, and small carts.
Anomaly Detection:
All experiments are carried out with the machine learning library Tensor flow in a dedicated GPU environment on a Intel(R) Core(TM) i5 with 2.5 GHz and 128 GB RAM. We ran our experiments in a We make use of Python libraries for implementing the anomaly detection. Since we follow the unsupervised learning method, all the data labels were discarded before fitting in the model. Our proposed model is evaluated on the testing videos using the parameter AUC (Area Under ROC curve) and EER (Equal Error Rate). Our Anomaly detection model is designed to focus on frame-level comparisons.
Training phase:
Our HERR model learns the patterns of normal events without any supervision. The training set consists of only the normal images. Training is done with 500 epochs starting with the learning factor of η = 0.0001. Being a hyperparameter, η plays a key role in improving the performance of the model. Initially, for the first 40 epochs, the learning factor was kept at 0.0001, choosing a smaller value of η slows down the stochastic gradient. The model learns for better approximations and stops by comparing η with the threshold value. Hence the learning rate was modified in successive iterations by gradually increasing epochs. Regularization parameter λ is initially taken as 0.0, and for subsequent learning steps, it is increased by a factor of 10 until the model fits with better precision and performance in the validation data.
Testing Phase:
Validating the Model is done by finding the accuracy of Anomaly detection in a testing phase. In a deep learning model anomalies are learned from experience. The anomaly score can be measured by Sπ, where π is the anomaly detector. dπ(s) is the probability of the target system in states on applying the algorithm for anomaly detector π. The collective reward started from state’s with action ‘a’ is defined by a function with 2 tuples Q(s, a).
The original frames and corresponding anomalies of bus and bicycle are shown in Fig. 4.
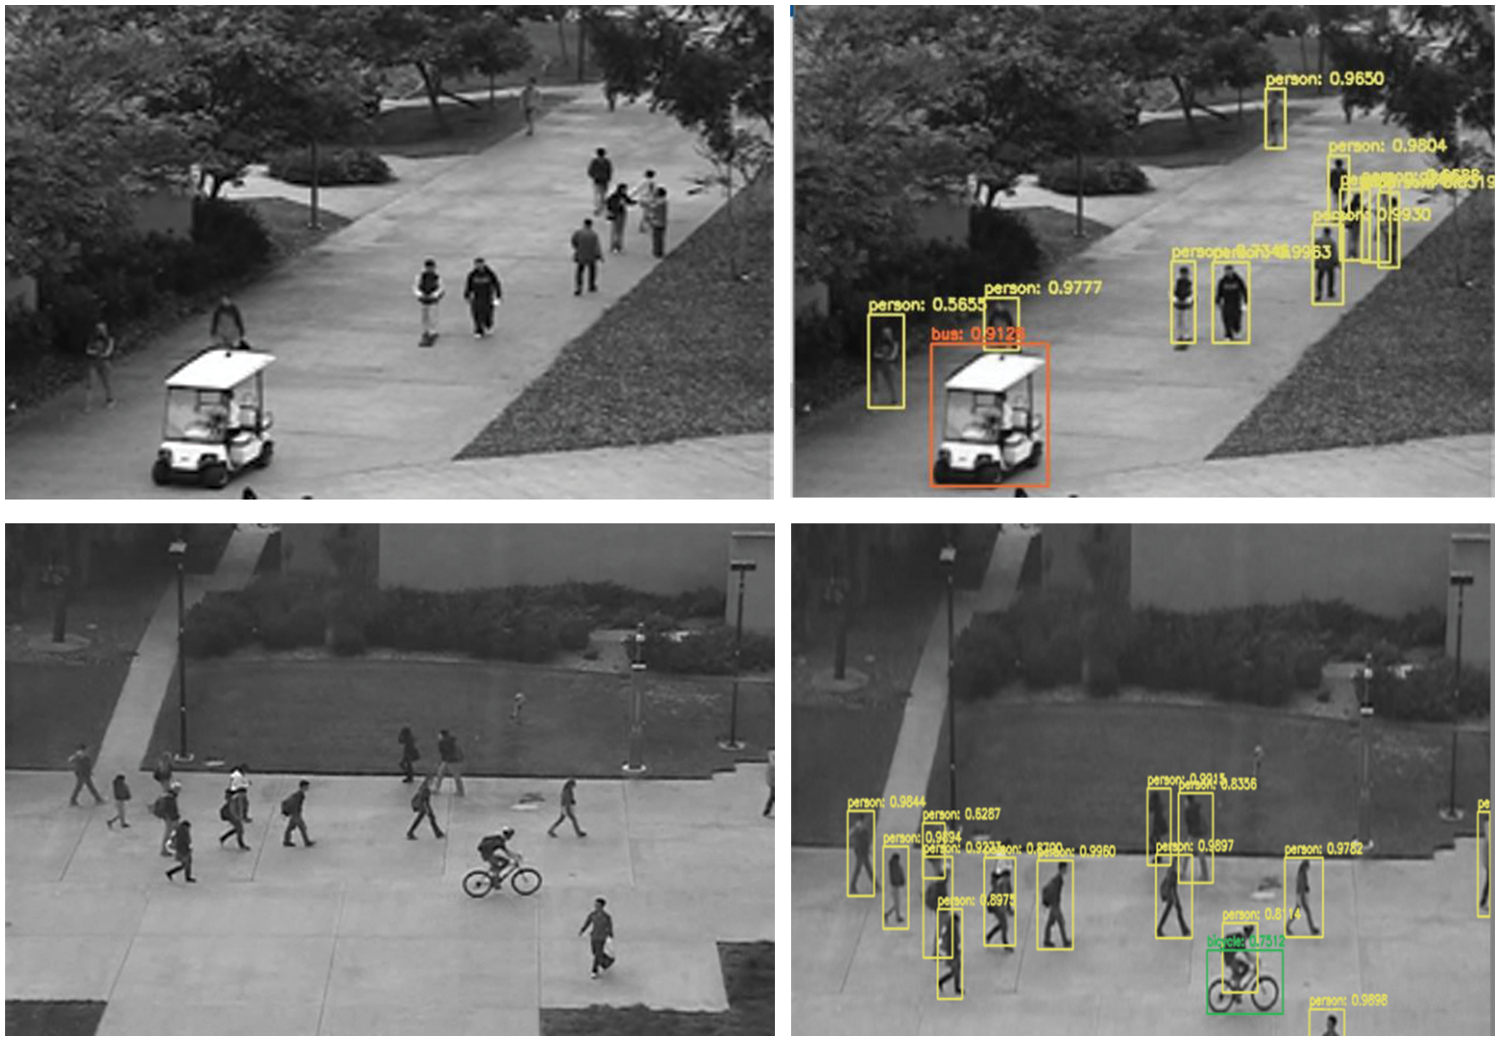
Figure 4: Original frame and frame with anomaly after applying HERR algorithm
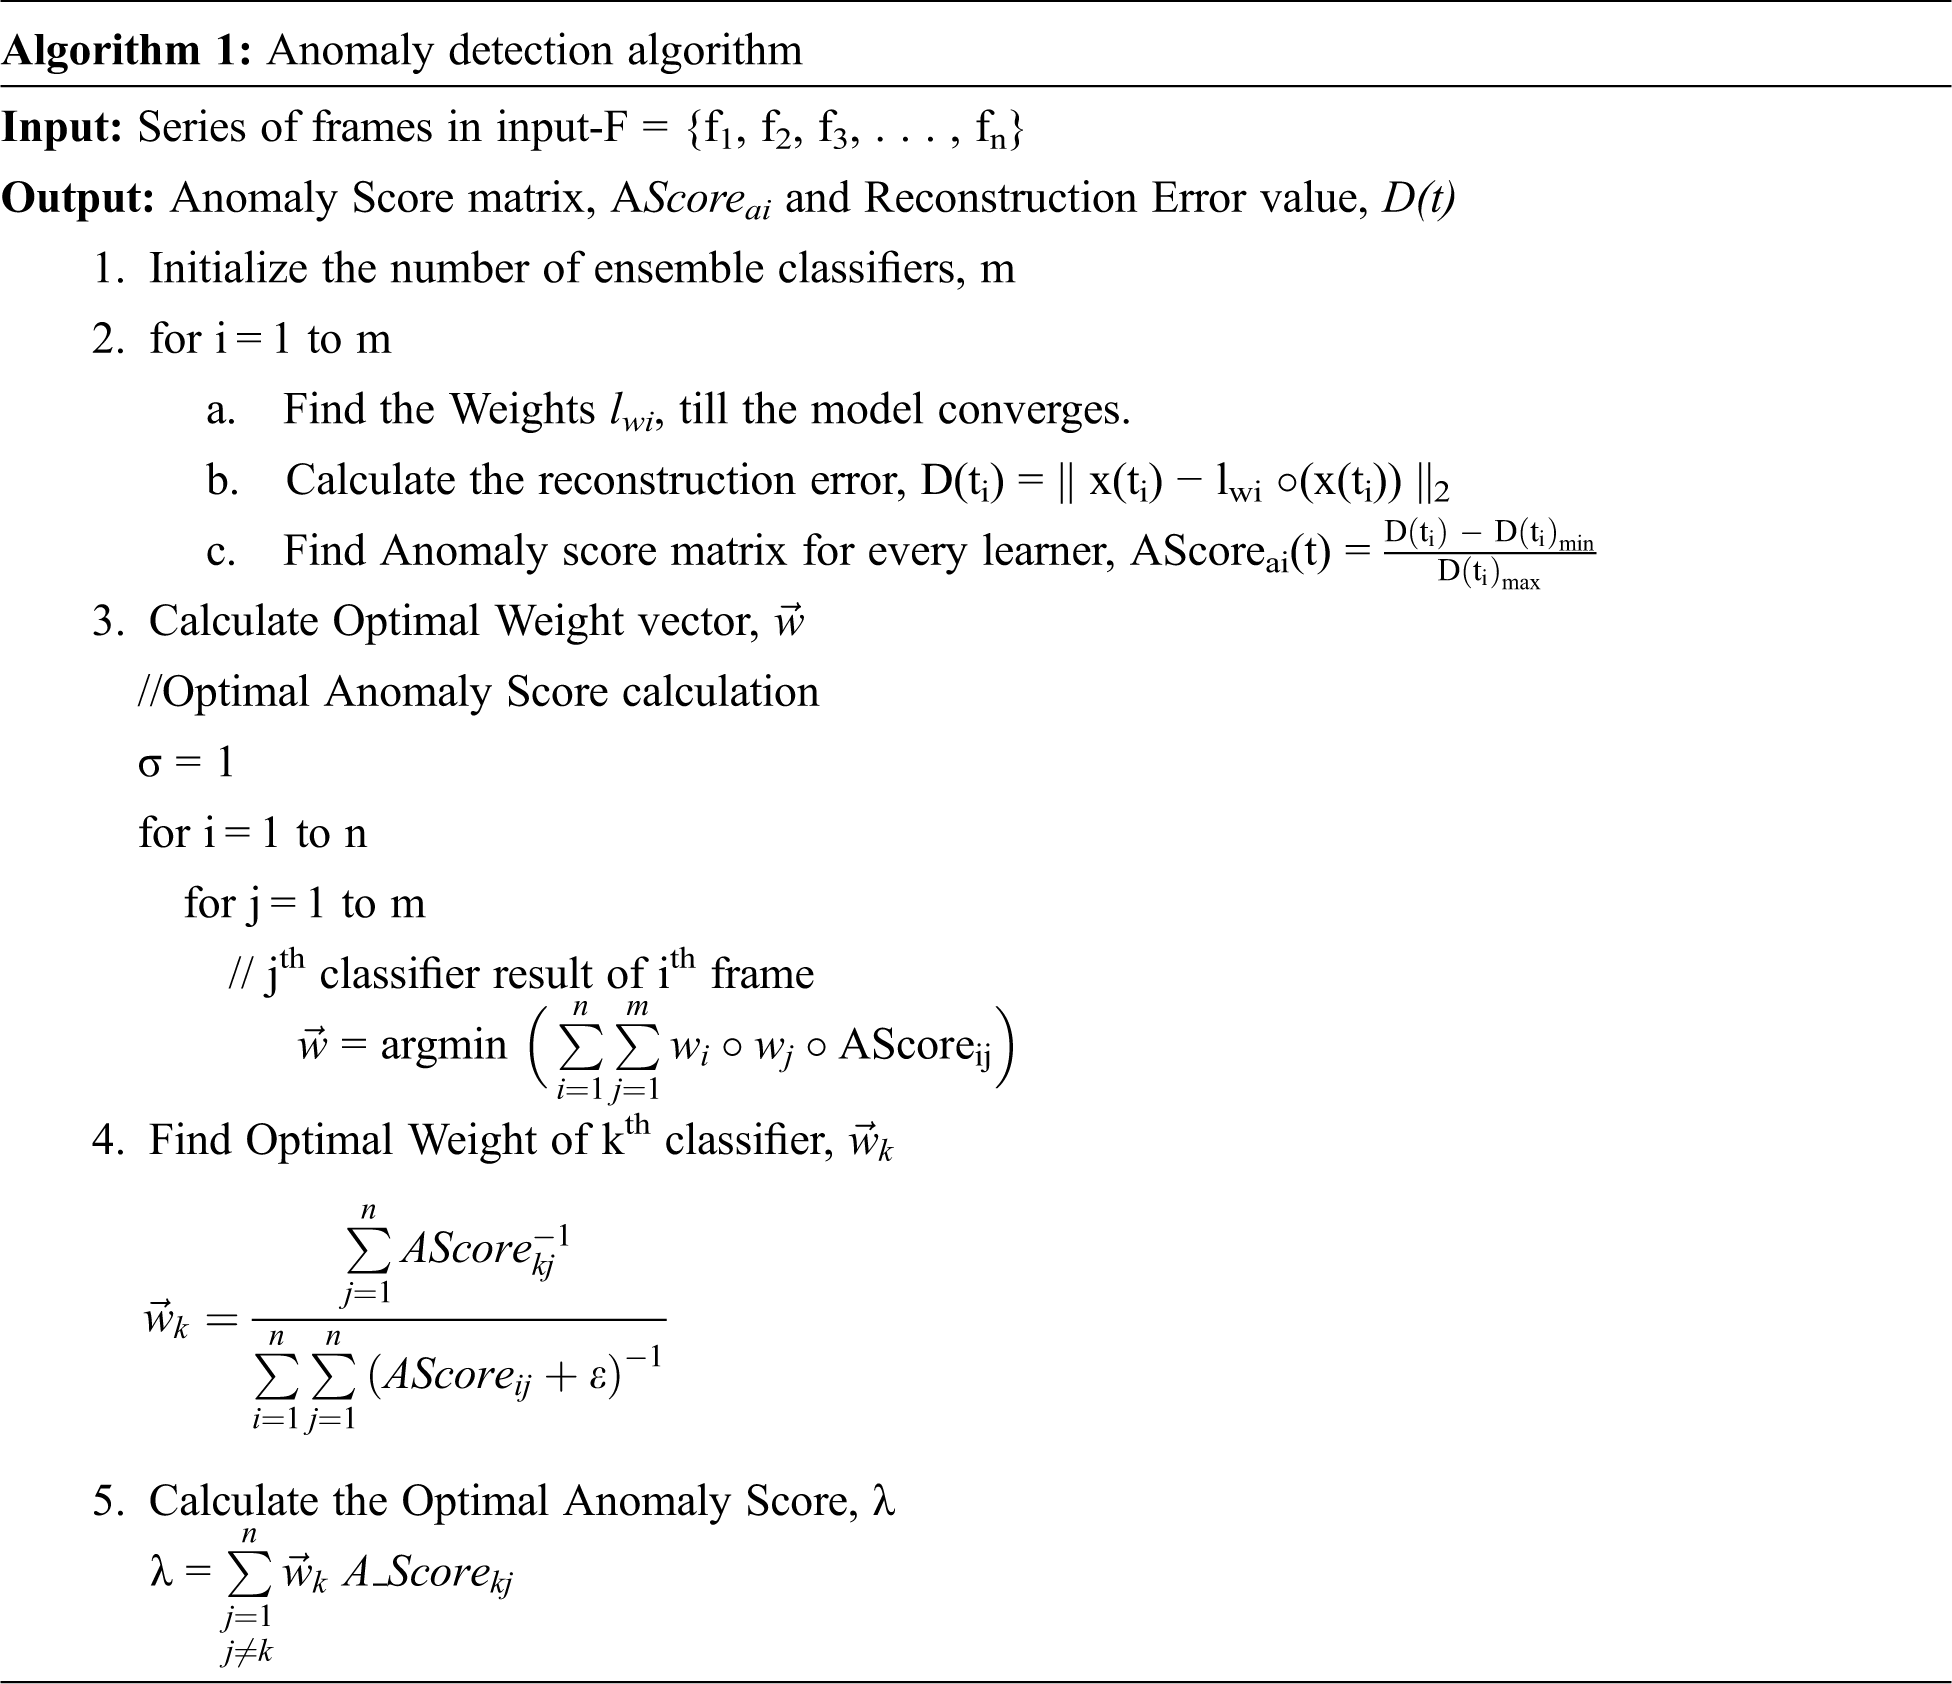
This paper uses an ensemble of anomaly detectors πi, and the optimal anomaly detector can be measured using the formula π* = argmaxπ (Vπ). The current work uses an ensemble of learners to identify an optimal solution to the anomaly detection problem. Each learner computes the anomaly score independently and the final decision is taken by considering the combined learning effect, where
The larger the values of γ, the network becomes unstable. Till learning stabilizes the momentum is set to 0.5 and then it is increased to 0.9. Setting the value for η is the greatest challenge in training the learners since larger values of η may cause the network to diverge instead of converging. Setting lower values to η will take more time to converge or the network may get stuck in local minima.
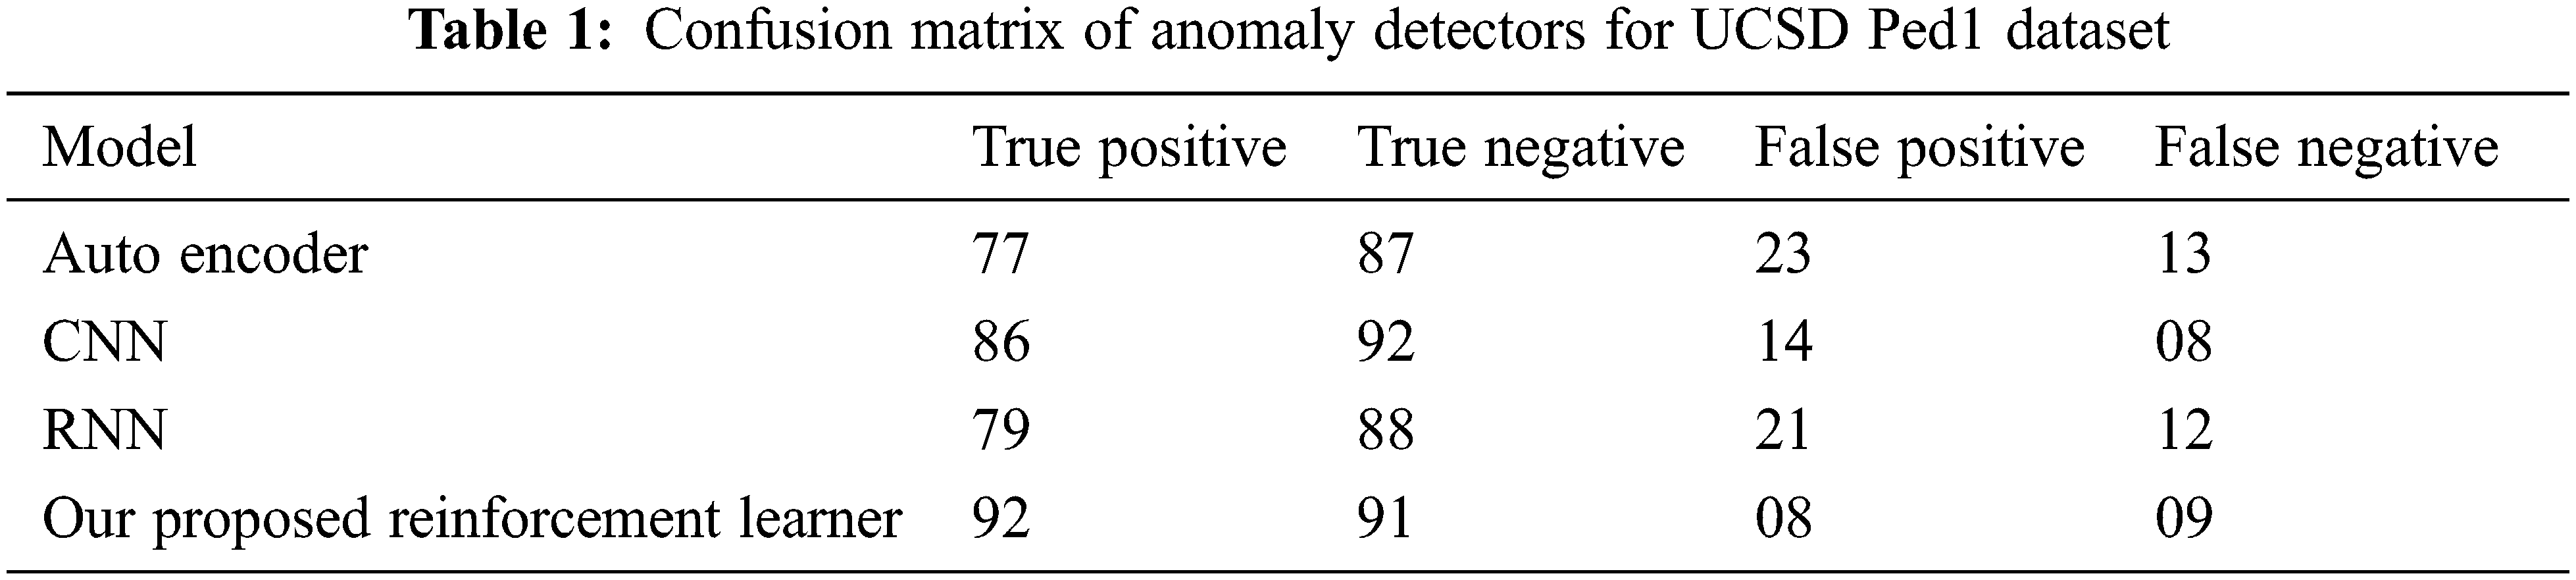
The accuracy of anomaly detection is calculated by finding the balanced accuracy BAcc. BAcc equation provides an optimal balanced result during performance evaluation. Tab. 1 shows the confusion matrix of the anomaly detection accuracy rates with True positives representing Anomaly and True Negative representing normal images.
Here the learning rate at round t is obtained using the following equation
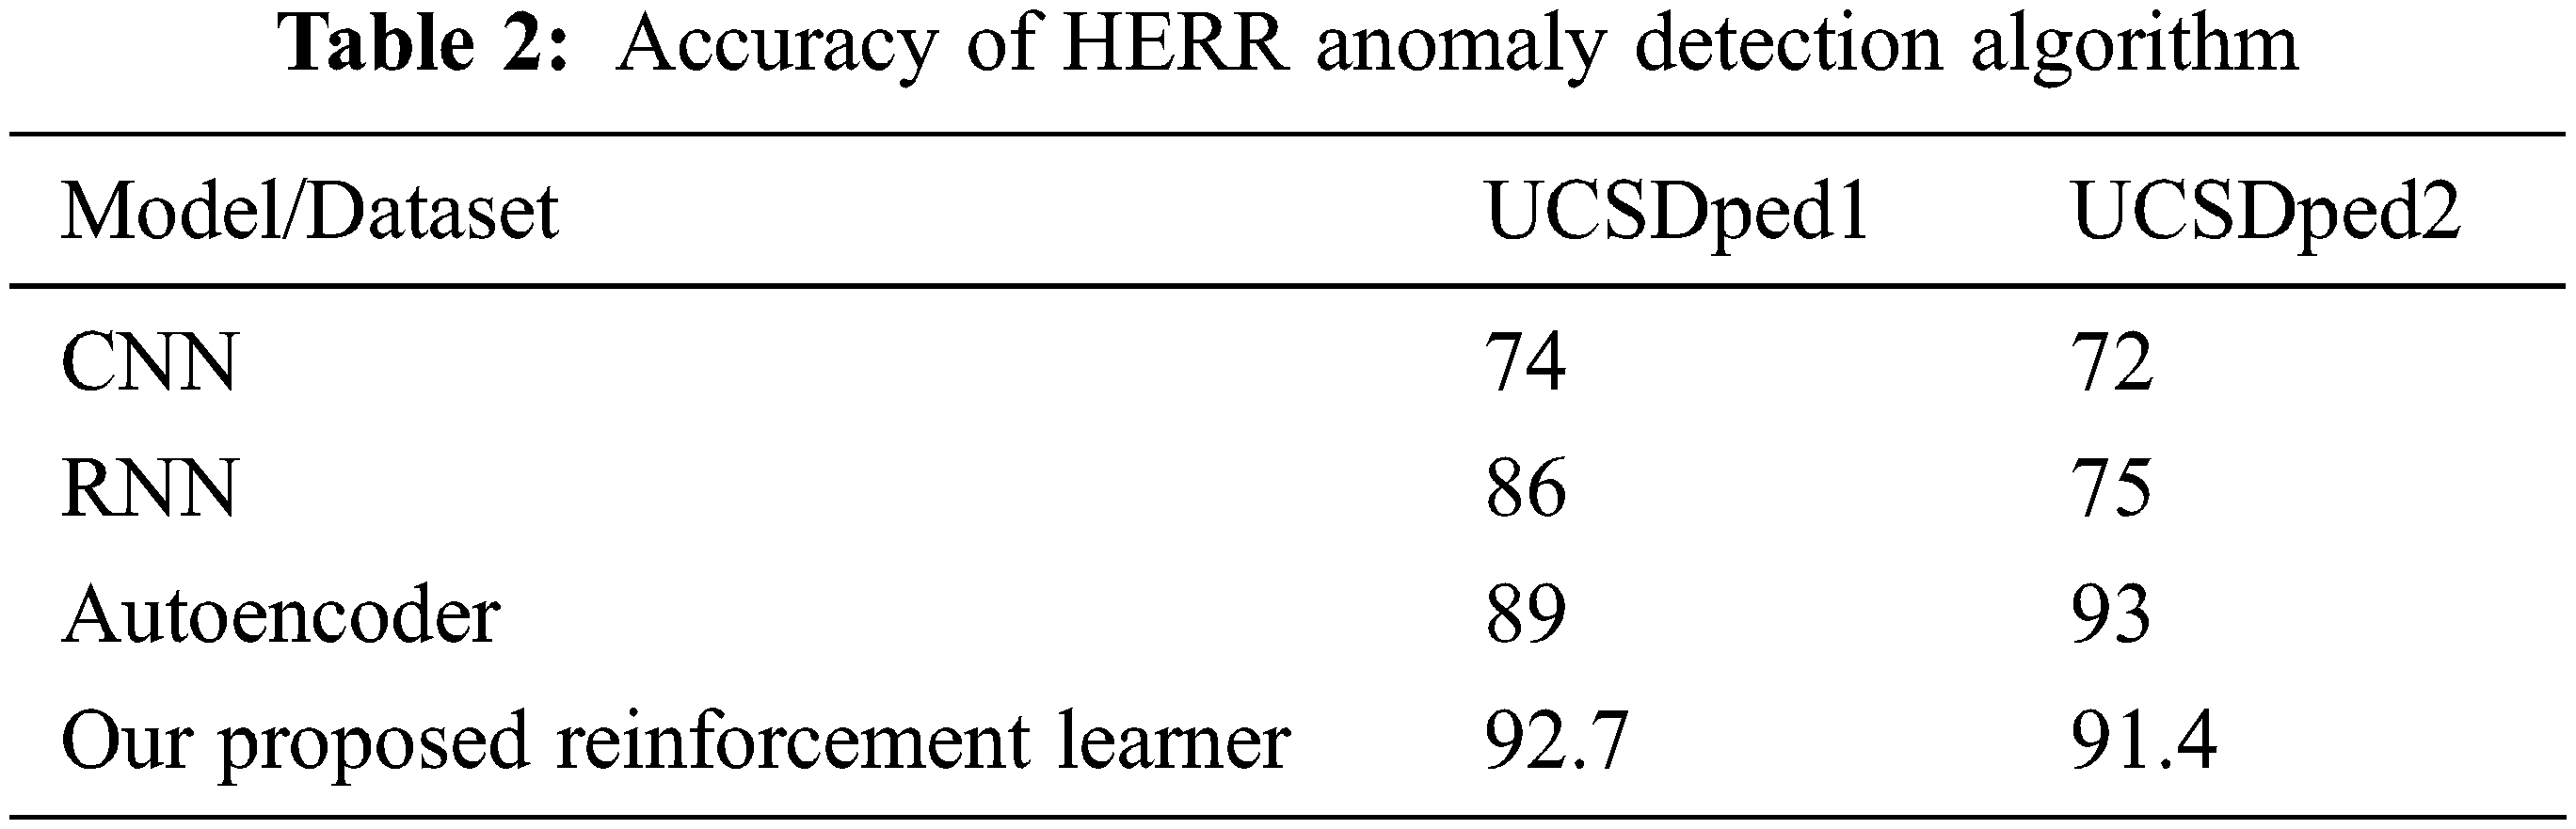
The performance of the model can also be measured by considering the volume of data as a parameter. A comparison shows that the deep learning model gives higher performance for larger volumes of data compared to other traditional machine learning algorithms. Tab. 2 shows the accuracy of the HERR algorithm for anomaly detection.
The running time of the proposed model was recorded and the comparison with Wang et al. is given in Fig. 5.
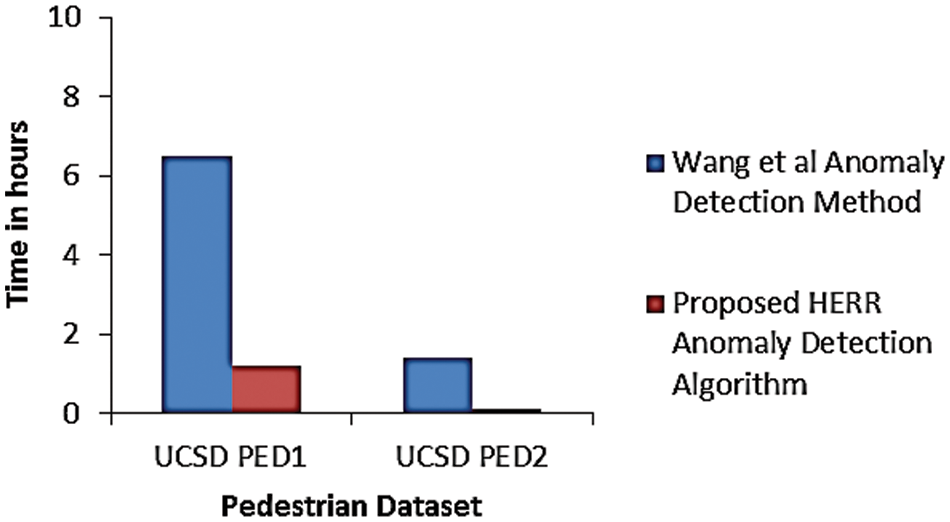
Figure 5: Running time comparison using benchmark datasets TIME (hours)
The performance of the model is measured by analyzing frame-level EER, AUC. Tab. 3 shows the percentages of EER and AUC in both UCSD Pedestrian1 and UCSD Pedestrian2 datasets observed for standard benchmark models and our proposed HERR anomaly model. We compared the performance of our method with classical methods like Adam method, the Social Force model (SF), the Mixture of Dynamic Texture (MDT), SF + Mixture of Probabilistic Component Analyzers and the statistical comparison of all the methods is visualized in Fig. 6.
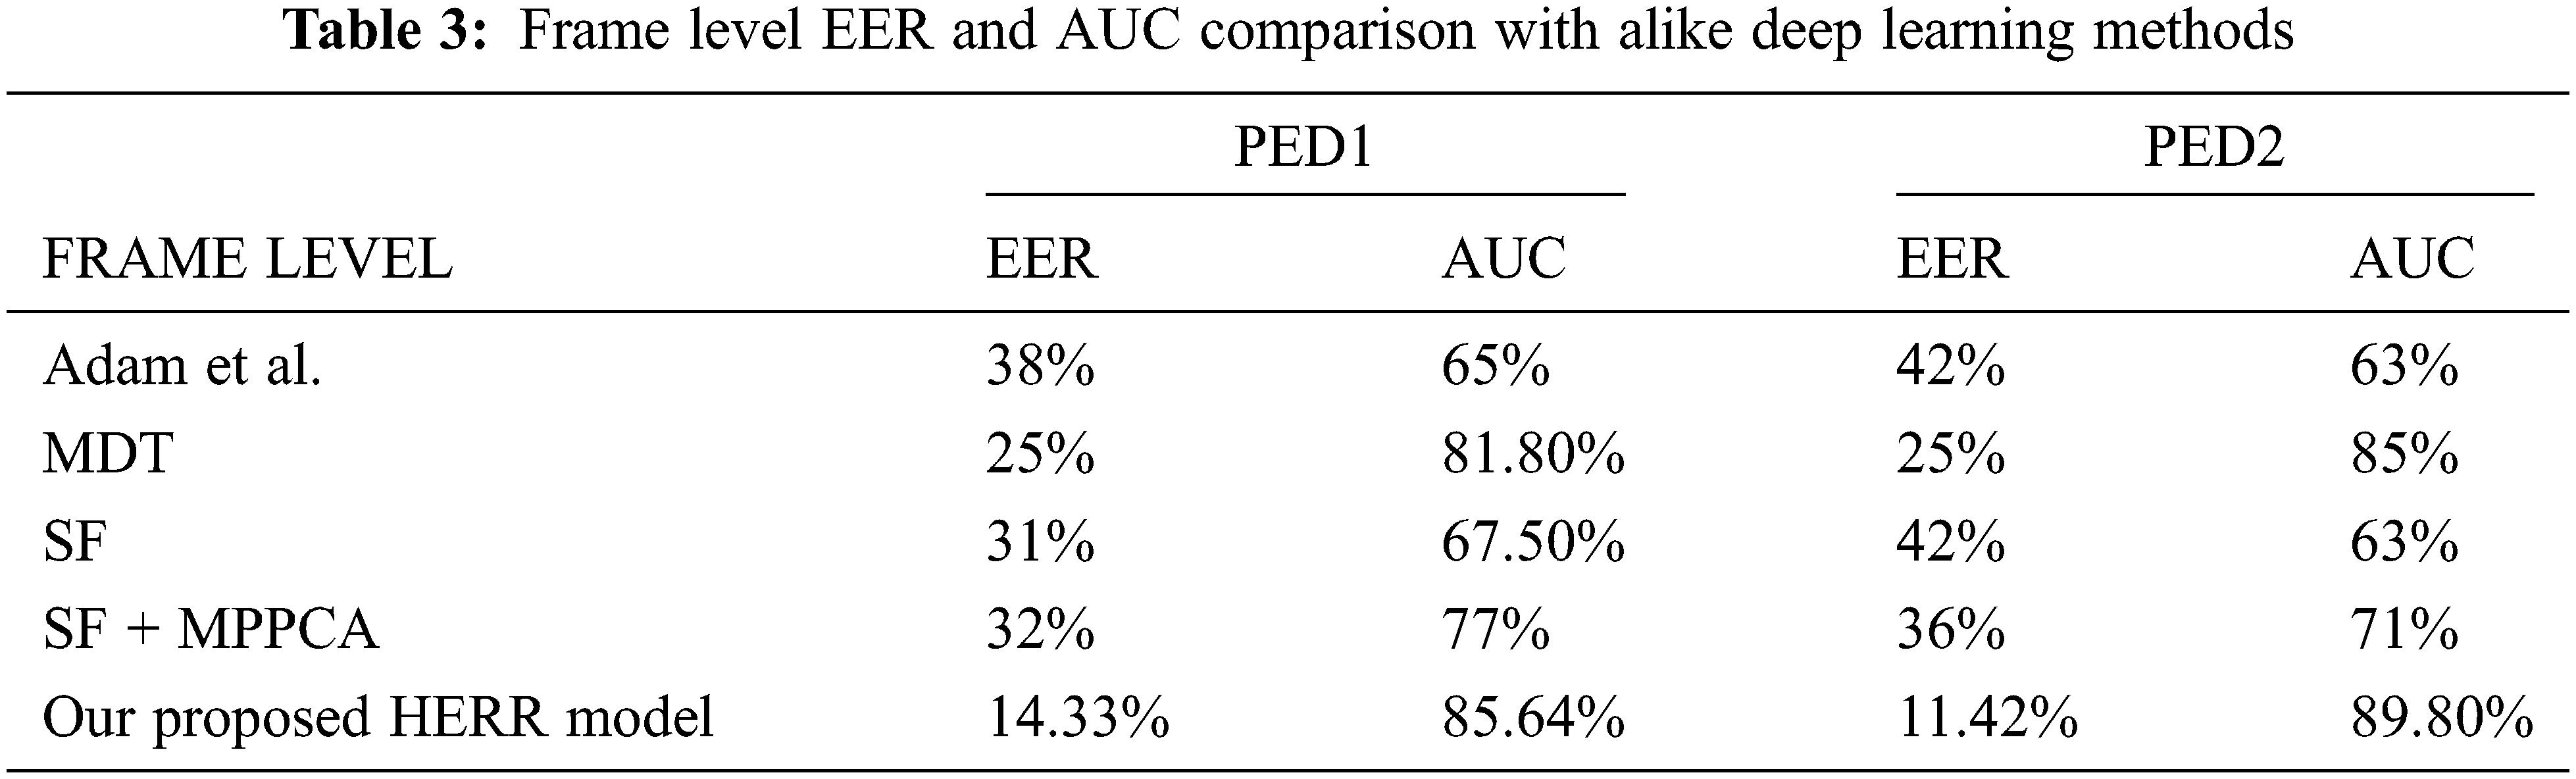
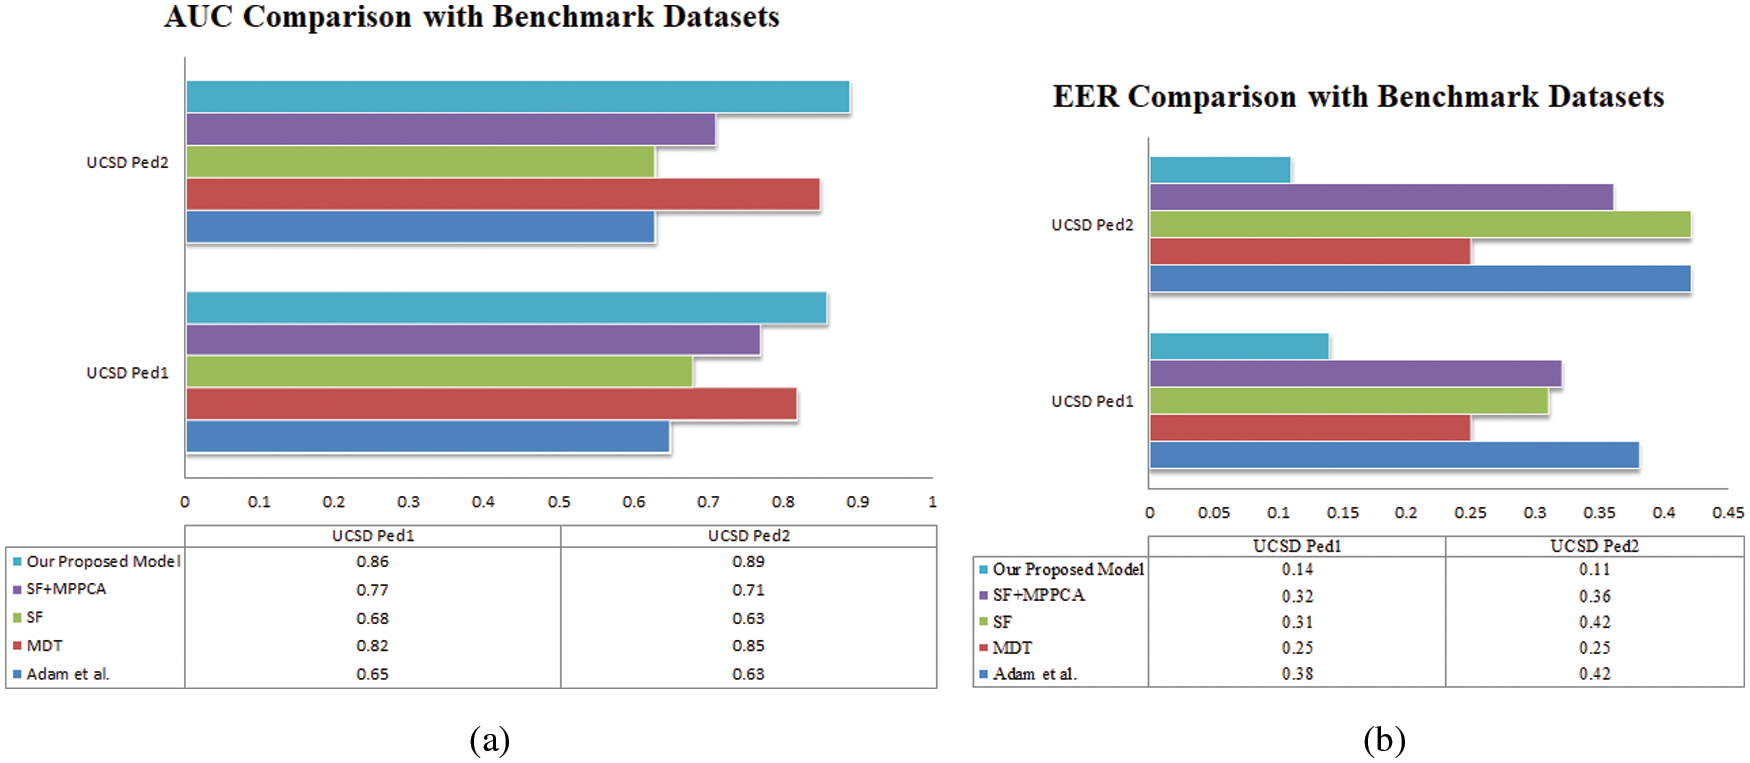
Figure 6: (a) AUC (Area Under Curve) and b) Equal error rate (EER) Comparison of proposed HERR model with benchmark datasets
To prove the effectiveness of our system, we conducted experiments with an ensemble of classifiers. Instead of calculating a single anomaly score, we generated a number of anomaly scores each with different sets of training and test samples. We fixed the number of ensembles as n = 1, n = 4, n = 7 and n = 10 to test the robustness of the system as given in Tab. 4. The selection of a number of ensembles also plays a key factor in performance. Too many ensembles will slow down the network. Very few ensembles will go down in terms of accuracy. The observations revealed stable and better performance compared with the non-ensemble method. As the number of ensembles increased AUC increased and EER reduced as in Figs. 7 and 8.
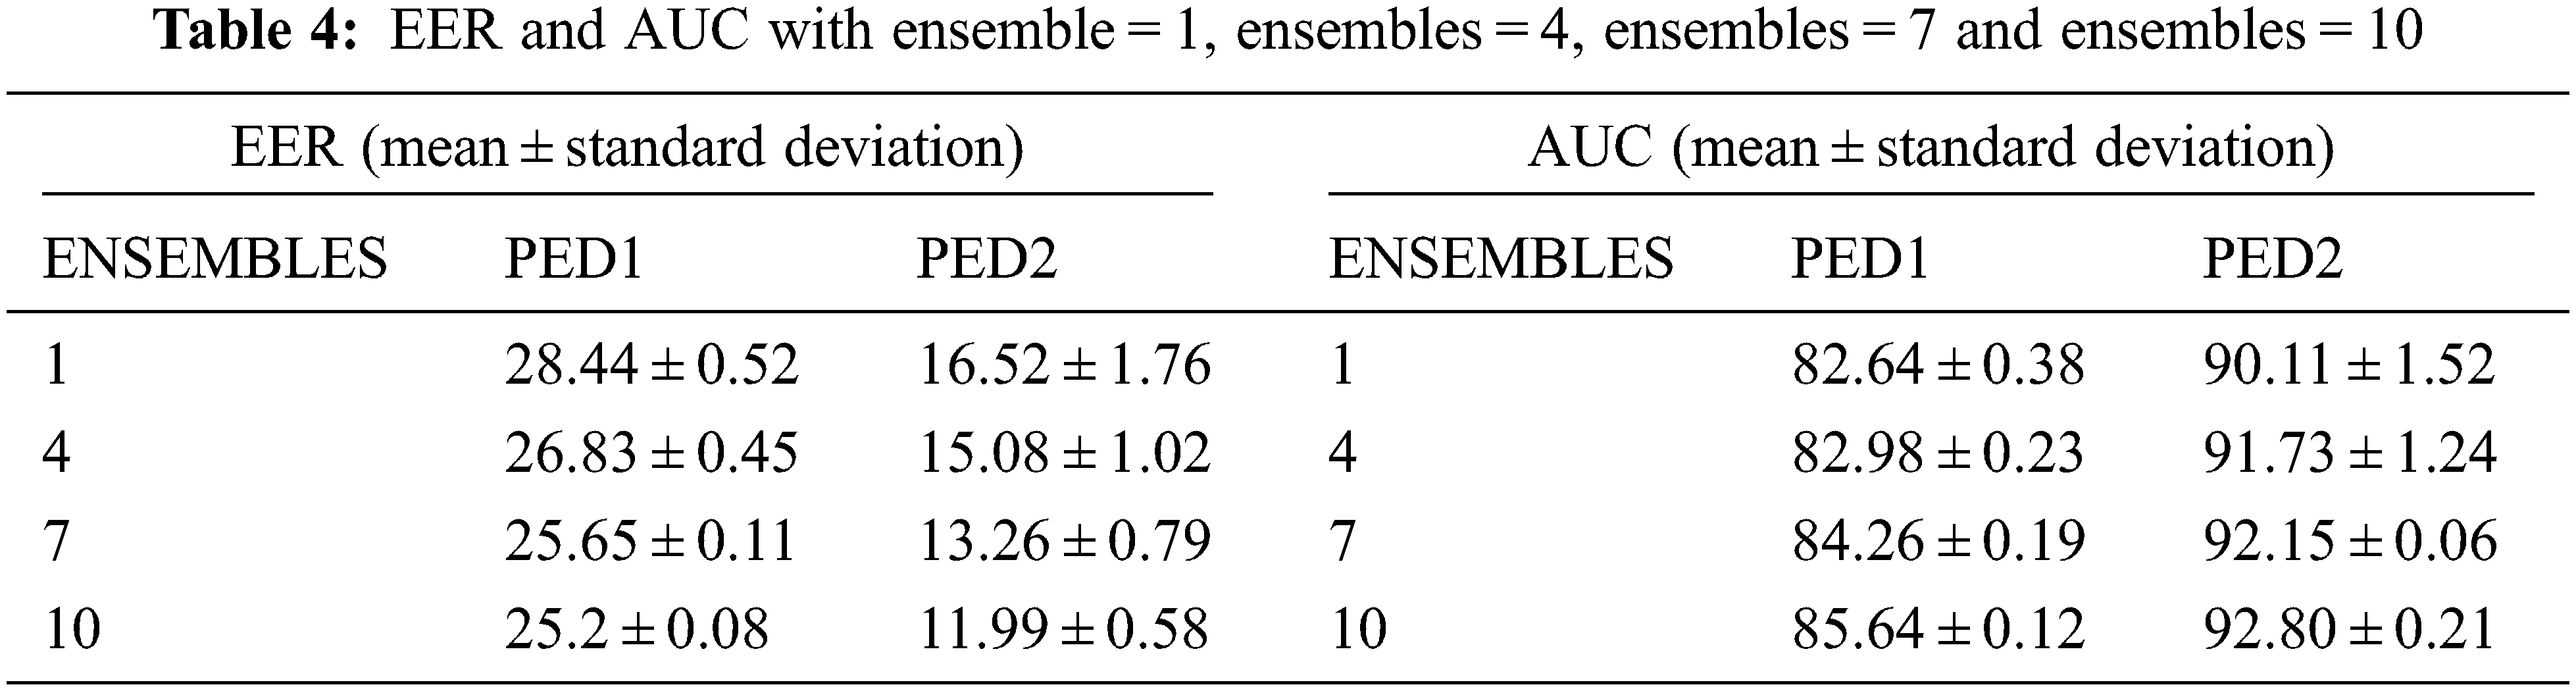
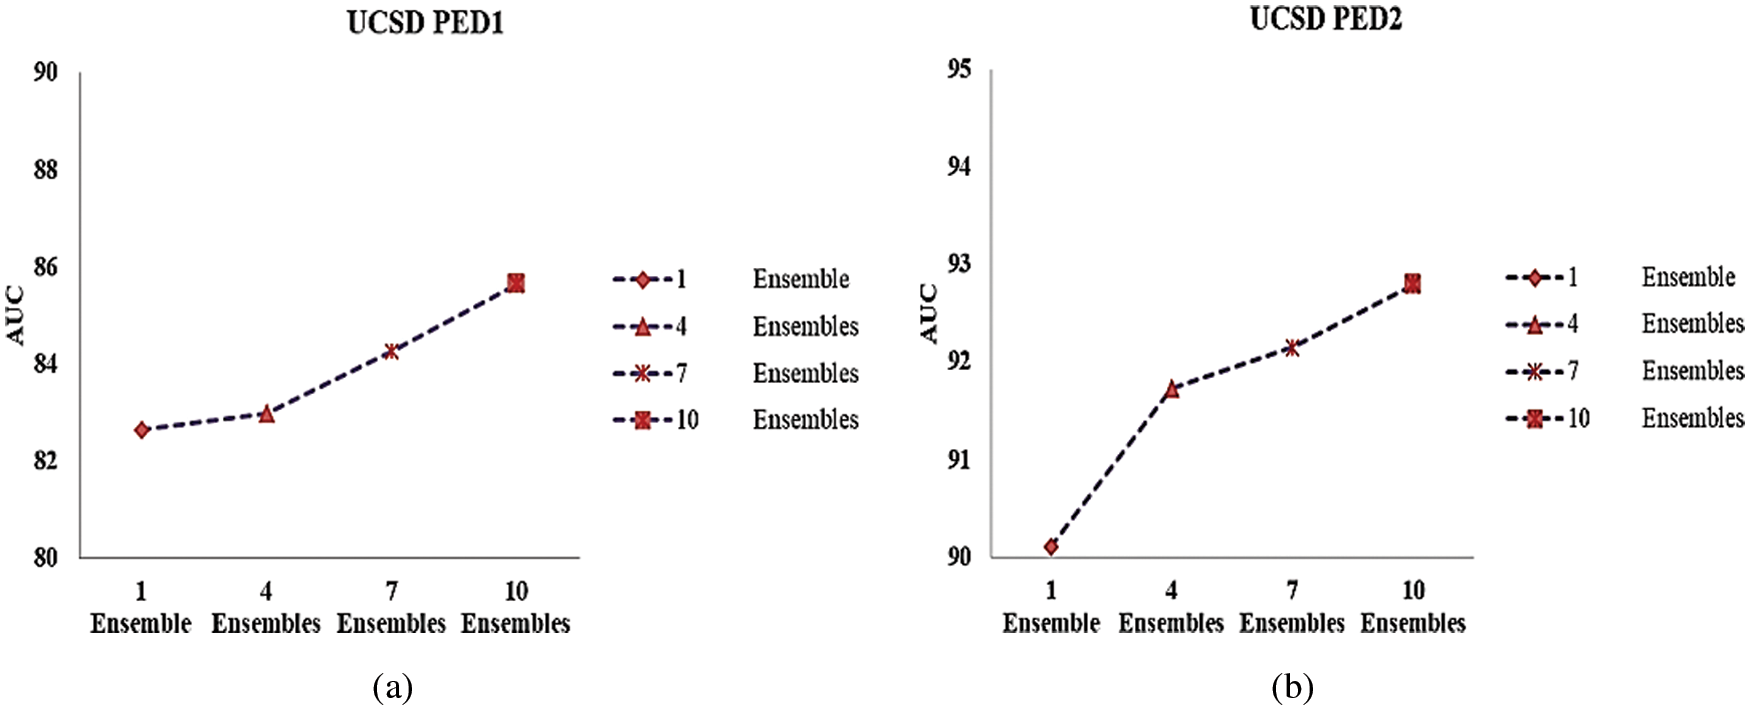
Figure 7: AUC of (a) UCSD Ped1 and (b) UCSD Ped2datasets for different
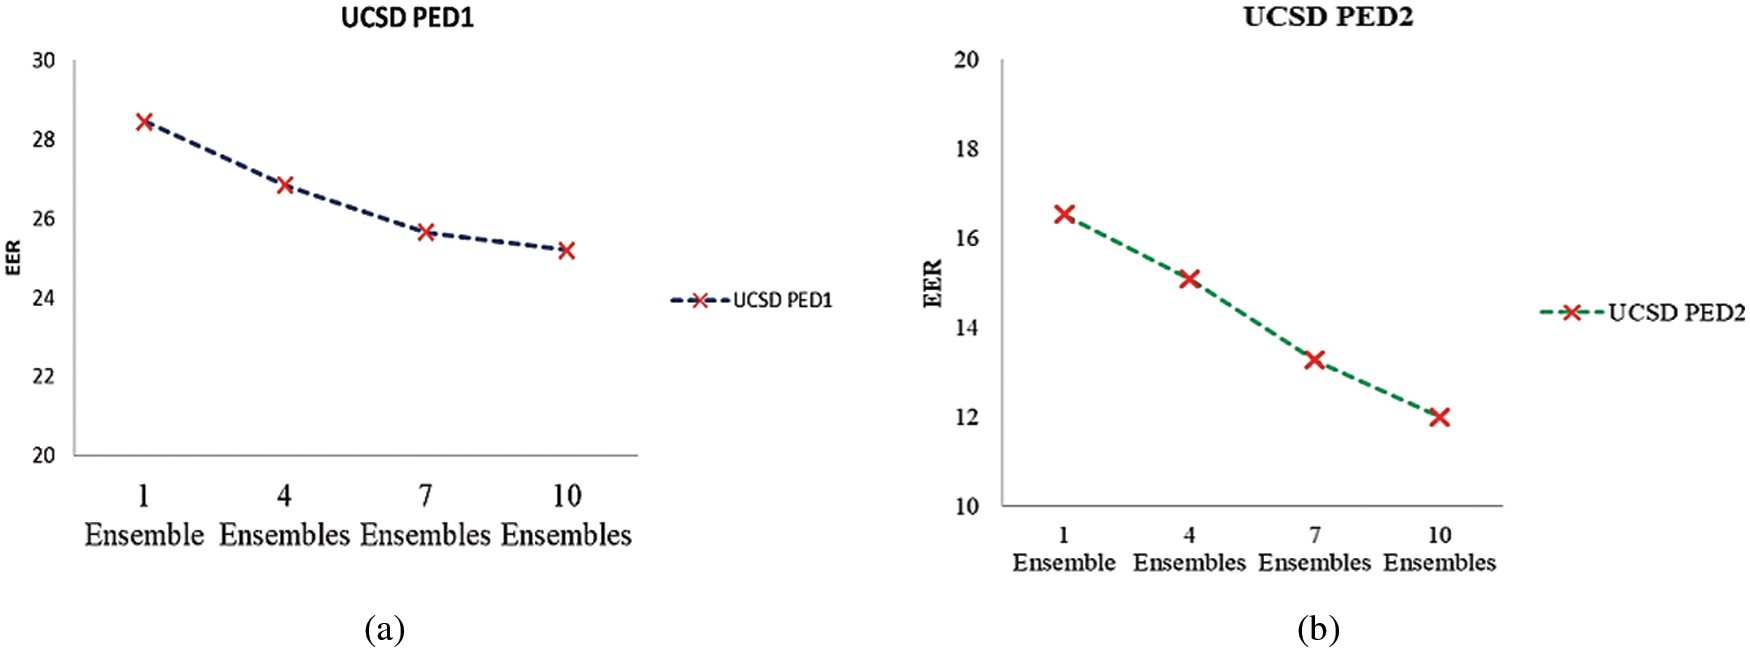
Figure 8: EER of (a) UCSD Ped1 (b) UCSD Ped2 datasets for different ensembles
Lower values of Equal Error Rate and higher values of Area under Curve denote better performance. Compared with other deep learning methods, our proposed method showed 9% EER Reduction and 4% increase in AUC for UCSD pedestrian 1% and 13% EER Reduction and 4% increase in AUC for UCSD pedestrian 2 sets. The performance of the model can also be measured by considering the volume of data as a parameter. The comparison shows that the deep learning model gives higher performance for larger volumes of data compared to other traditional machine learning algorithms. The accuracy of the proposed model is compared with the performance of existing methods in Tab. 4. The percentages unveil that the proposed method outperforms the existing methods.
Lower values of Equal Error Rate and higher values of Area under Curve denote better performance. Compared with other deep learning methods, our proposed method showed 9% EER Reduction and 4% increase in AUC for UCSD pedestrian 1% and 13% EER Reduction and 4% increase in AUC for UCSD pedestrian 2 sets. The performance of the model can also be measured by considering the volume of data as a parameter. The comparison shows that the deep learning model gives higher performance for larger volumes of data compared to other traditional machine learning algorithms.
Real-time video stream:
As an extension of the proposed work, the performance of the HERR anomaly detection algorithm on real-time video streams from a surveillance camera was also tested. The accuracy of the algorithm was near human-level on real-time high-speed video streams also. The main challenge we faced was about choosing worthy or intelligent frames in the video. The selection of these frames plays a major role in getting better results in terms of accuracy. In general, depending on the video source, the redundancy of frames might differ and for most of the video streams, the percentage of temporal redundancy will be higher. In such cases, subsampling might improve the response time by reducing the computational overhead. Subsampling is a process where the redundant frames will not be considered for analytics purposes. Hence, we adopted sub-sampling reductions to reduce the time complexity and improve the response time.
In this paper, we propose a novel method of large-scale real-time video analytics to detect anomalies. The proposed unsupervised learning method used a hybrid approach of Recurrent nets and Reinforcement learners with an optimal number of ensemble learners in classifying anomalies with minimum false-positive results. The results of our proposed HERR model showed superior performance with a minimum error rate of 4% and 13% on UCSD Ped1 and UCSD Ped2 respectively. Also, there was a 4% increase in the accuracy levels of both UCSD Ped1 and UCSD Ped2. Experiments conducted on live video streams also showed a considerable performance improvement compared to the standard benchmark datasets.
Funding Statement: The authors received no specific funding for this study.
Conflicts of Interest: The authors declare that they have no conflicts of interest to report regarding the present study.
References
1. P. Plamen and S. Angelov, “Autonomous learning systems: From data streams to knowledge in real-time,” John Wiley & Sons, vol. 1, no. 1, pp. 1–304, 2012. [Google Scholar]
2. V. Shikhar and K. Yuichi, “A survey on network methodologies for real-time analytics of massive iot data and open research issues,” IEEE Communications Surveys & Tutorials, vol. 19, no. 3, pp. 1457–1477, 2017. [Google Scholar]
3. A. Krizhevsky, I. Sutskever and G. E. Hinton, “ImageNet classification with deep convolutional neural networks,” Communcation Acm, vol. 60, no. 5, pp. 84–90, 2017. [Google Scholar]
4. R. Tudor, S. Smeureanu and B. Alexe, “Unmasking the abnormal events in video,” in Proc. of the IEEE Int. Conf. on Computer Vision, Venice, Italy, pp. 2895–2903, 2017. [Google Scholar]
5. W. Zhong, Z. Jian and Y. Jing, “A heuristic algorithm to incremental support vector machine learning,” in Proc. of 2004 Int. Conf. on Machine Learning and Cybernetics, Shanghai, China, pp. 802–815, 2004. [Google Scholar]
6. B. E. Laure, B. Angela and M. Tova, “Machine learning to data management: A round trip,” in 2018 IEEE 34th Int. Conf. on Data Engineering (ICDE), Paris, France, pp. 652–661, 2018. [Google Scholar]
7. S. Wang, Y. Zeng and Q. Liu, “Detecting abnormality without knowing normality: A two-stage approach for unsupervised video abnormal event detection,” in Proc. of the 2018 ACM, Changsha, China, pp. 1050–1061, 2018. [Google Scholar]
8. J. Hu, E. Zhu and S. Wang, “An efficient and robust unsupervised anomaly detection method using ensemble random projection in surveillance videos,” Sensors, vol. 8, no. 5, pp. 773–781, 2019. [Google Scholar]
9. Y. Zhao, B. Deng and C. Shen, “Spatio-temporal autoencoder for video anomaly detection,” in Proc. of the 25th ACM Int. Conf. on Multimedia, Silicon Valley, CA, USA, pp. 23–27, 2017. [Google Scholar]
10. X. Ran, Z. Haolianz and L. Xiaodan, “DeepDecision: A mobile deep learning framework for edge video analytics,” in IEEE INFOCOM 2018-IEEE Conf. on Computer Communications, Honolulu, HI, USA, pp. 1421–1429, 2018. [Google Scholar]
11. J. Hu, E. Zhu and S. Wang, “An efficient and robust unsupervised anomaly detection method using ensemble random projection in surveillance videos,” Sensors, vol. 19, no. 3, pp. 4145–4152, 2019. [Google Scholar]
12. D. M. Hawkins, “Identification of outliers,” Springer, vol. 5, no. 3, pp. 2043–2073, 1980. [Google Scholar]
13. M. Hasan, J. Choi and J. Neumann, “Learning temporal regularity in video sequences,” in Proc. of the IEEE Conf. on Computer Vision and Pattern Recognition, Las Vegas, NV, USA, pp. 733–742, 2016. [Google Scholar]
14. F. Li, M. Özsu and G. Chen, “R-Store: A scalable distributed system for supporting real-time analytics,” in 2014 IEEE 30th Int. Conf. on Data Engineering, Chicago, IL, USA, pp. 40–51, 2014. [Google Scholar]
15. E. Giorno, J. Bagnell and M. Hebert, “A discriminative framework for anomaly detection in large videos,” Computer Vision and Pattern Recognition, vol. 32, no. 9, pp. 845–856, 2016. [Google Scholar]
16. C. Lu, J. Shi and J. Jia, “Abnormal event detection at 150 fps in matlab,” in Proc. of the IEEE Int. Conf. on Computer Vision, Sydney, Australia, 1–8, pp. 2720–2727, 2013. [Google Scholar]
17. A. Adam, E. Rivlin and I. Shimshoni, “Robust real-time unusual event detection using multiple fixed-location monitors,” IEEE Transaction on Pattern Analysis and Machine Intelligence, vol. 30, no. 5, pp. 555–560, 2008. [Google Scholar]
18. J. Kim and K. Grauman, “Observe locally, infer globally: A space-time MRF for detecting abnormal activities with incremental updates,” in Proc. of the 2009 IEEE Conf. on Computer Vision and Pattern Recognition, Miami Beach, FL, pp. 2921–2928, 2009. [Google Scholar]
19. R. Mehran and A. Oyama, “Abnormal crowd behavior detection using social force model,” in 2009 IEEE Computer Society Conf. on Computer, Miami, FL, USA, pp. 123–131, 2009. [Google Scholar]
20. E. Marchi, F. Vesperini and F. Eyben, “A novel approach for automatic acoustic novelty detection using a denoising autoencoder with bidirectional LSTM neural networks,” in 2015 IEEE Int. Conf. on Acoustics, Speech and Signal Processing (ICASSP), South Brisbane, QLD, Australia, pp. 1996–2000, 2015. [Google Scholar]
21. M. Xu and X. Yu, “An efficient anomaly detection system for crowded scenes using variational autoencoders,” Applied Sciences, vol. 9, no. 16, pp. 3337–3342, 2019. [Google Scholar]
Cite This Article
 Copyright © 2023 The Author(s). Published by Tech Science Press.
This work is licensed under a Creative Commons Attribution 4.0 International License , which permits unrestricted use, distribution, and reproduction in any medium, provided the original work is properly cited.
 Downloads
 Citation Tools