
 Submit a Paper
 Propose a Special lssue
 Open Access
ARTICLE

A Novel Explainable CNN Model for Screening COVID-19 on X-ray Images
1 EEIS Laboratory, ENSET of Mohammedia, Hassan II University of Casablanca, Mohammedia, 28820, Morocco
2 STIE Team, CRMEF Casablanca-Settat, The Provincial Section of El Jadida, El Jadida, 24000, Morocco
3 Department of Information Systems, College of Computer Engineering and Sciences, Prince Sattam bin Abdulaziz University, Al-Kharj, 11942, Saudi Arabia
4 Department of Information Systems, King Khalid University, Muhayel Aseer, 61913, Saudi Arabia
5 College of Computer Science and Engineering, Taibah University, Medina, 42353, Saudi Arabia
6 Department of Computer Science, University of Sheba Region, Marib, 14400, Yemen
7 DAAI Research Group, Department of Computing and Data Science, School of Computing and Digital Technology, Birmingham City University, Birmingham, B4 7XG, UK
8 Department of Information Technology, College of Computer, Qassim University, Buraydah 51452, Saudi Arabia
9 Department of Computer Science, College of Applied Sciences, Taiz University, Taiz, 6803, Yemen
* Corresponding Author: Bouchaib Cherradi. Email:
Computer Systems Science and Engineering 2023, 46(2), 1789-1809. https://doi.org/10.32604/csse.2023.034022
Received 04 July 2022; Accepted 13 November 2022; Issue published 09 February 2023
 View Full Text
 Download PDF
Abstract
Due to the rapid propagation characteristic of the Coronavirus (COVID-19) disease, manual diagnostic methods cannot handle the large number of infected individuals to prevent the spread of infection. Despite, new automated diagnostic methods have been brought on board, particularly methods based on artificial intelligence using different medical data such as X-ray imaging. Thoracic imaging, for example, produces several image types that can be processed and analyzed by machine and deep learning methods. X-ray imaging materials widely exist in most hospitals and health institutes since they are affordable compared to other imaging machines. Through this paper, we propose a novel Convolutional Neural Network (CNN) model (COV2Net) that can detect COVID-19 virus by analyzing the X-ray images of suspected patients. This model is trained on a dataset containing thousands of X-ray images collected from different sources. The model was tested and evaluated on an independent dataset. In order to approve the performance of the proposed model, three CNN models namely Mobile-Net, Residential Energy Services Network (Res-Net), and Visual Geometry Group 16 (VGG-16) have been implemented using transfer learning technique. This experiment consists of a multi-label classification task based on X-ray images for normal patients, patients infected by COVID-19 virus and other patients infected with pneumonia. This proposed model is empowered with Gradient-weighted Class Activation Mapping (Grad-CAM) and Grad-Cam++ techniques for a visual explanation and methodology debugging goal. The finding results show that the proposed model COV2Net outperforms the state-of-the-art methods.Keywords
The infectious COVID-19 virus, officially called SARS-CoV-2, first appeared in China at the end of 2019 [1]. The infection is believed to have originated from animals to humans [2]. It spreads mainly from one human to another through respiratory mechanisms. The droplets from the infected individual probably contain COVID-19 viruses, which spread to others in numerous ways. The expanding spread of the disease led the World Health Organization (WHO) to declare COVID-19 as a pandemic. More than 590 million cases of the infection had been reported around the world and 6.5 million people had succumbed to the virus [3]. There is a question that needs serious discussion by researchers, what can be done through coordinated efforts to accelerate research and subsequently save lives.
Though several trials for candidate vaccines and potential therapies are underway, there is currently no cure, in the absence of either proven effective therapy or a vaccine, diagnostic testing becomes a valuable tool. Public health authorities implementing extreme measures to isolate the virus, most countries have been underprepared, as a result, they had faced community transmission before adequate testing was in place to allow for isolation and tracking [4].
COVID-19 is one of many causes of viral pneumonia [4], and the symptoms are very similar for all causes. It is not an easy task for researchers to diagnose and differentiate pneumonia arising from COVID-19 from other types of pneumonia [5]. To achieve a definite diagnosis, doctors need additional information that could be obtained from blood tests and radiation imaging techniques. Since the virus spreads rapidly, the traditional methods of diagnosis are not effective rapid. Thus, automated diagnostic methodologies are needed to control this pandemic [6].
Many imaging techniques are based on electromagnetic waves [7]. The resulting images are based on particles absorption and reflection properties in our bodies. The produced images are generally composed of gray-scale levels which allows doctors to analyze the tissue density based on the information in these images so they can diagnose accurately the disease [8]. Concerning COVID-19 virus, X-ray imaging is fast and inexpensive, and many techniques could be used to select only helpful features [9]. In some cases, radiologists can detect COVID-19 on thoracic X-ray images, but in most cases, they need the help of automated artificial methods and techniques [10,11].
Artificial Intelligence (AI) techniques have been used in many fields and applications including natural language processing [12], civil engineering systems [13], rumor and emotion detection [14], medical diagnosis support systems [15], diabetes mellitus retinopathy detection [16], heart and atherosclerosis disease [17], Parkinson’s disease detection [18–20]. Although, the mean limitations of the prior works related to this paper are the insufficiency of results due to the proposed architecture and the availability of medical data.
This work proposes a novel CNN model COV2Net based on deep learning methods in dealing with images. To compare the performance of the proposed model, a set of well-known CNN models in literature was fine-tuned on the same dataset used to build the COV2Net model.
The main contribution presented through this work can be summarized as follow:
• An equilibrated lung X-Ray based images dataset of three classes: normal, pneumonia and COVID-19 is collected.
• A new CNN proposed model entitled COV2Net to overcome the drawback of the existing models.
• To demonstrate the performance of the proposed COV2Net model, we implemented three standard CNN models, Mobile-Net, Res-Net and VGG-16, using the transfer learning technique.
• To explain the results, Grad-Cam and Grad-Cam++ techniques were implemented to debug the prediction process of the proposed model and, on the other hand, to visualize the regions of interest in the X-ray image responsible for the final decision.
The content of this paper is organized as follows: The Section 2 is a brief presentation of similar recent research work. Section 3 outlines the resources and methodology involved in collecting and generating a valid dataset to work with and presents a brief description of the methodology used in the experimental work. Section 4 presents the results obtained and discusses and compares them to the state-of-the-art. Finally, Section 5 presents conclusions drawn from our work.
The pandemic aspect of COVID-19 forced many researchers to focus on utilizing artificial intelligence-based approaches in diagnosing COVID-19-based pneumonia using Computer Tomography Images (CTI) [21].
A novel multi-feature CNN model was designed [22] to classify COVID-19 disease based on Chest X-ray (CXR) images. The classifications concerned pneumonia, normal and COVID-19 images. Obtained results were 99% precision, recall and F1-scores for the COVID-19 class and 95.57% accuracy.
In [23], the authors proposed a new CNN model for the automatic detection of COVID-19 disease based on raw X-ray images. Their model showed 87.02% accuracy in predicting COVID-19 cases. The authors implemented 17 convolutional layers within this model with different filtering layers.
In [24], the authors proposed a performance evaluation system for five pre-trained CNN models (ResNet50, ResNet101, ResNet152, InceptionV3 and Inception-ResNetV2) in predicting the presence of COVID-19 infection. In this study, ResNet50 achieved the best results, with 99.7% accuracy in a binary classification task on dataset-3 comprising only 301 images containing COVID-19, together with 2800 normal images, 2772 bacterial pneumonia images and 1493 viral pneumonia images. An augmentation technique was used in the dataset to increase its size.
In [25], the authors proposed a CNN model called a deep learning model for X-ray-based COVID-19 classification (COV-SNET). Their expanded dataset consisted of 3913 COVID-19 images, 7966 normal images, and 5441 pneumonia images. Their special idea is the choice of a large number of X-ray images, but this work only showed 95% sensitivity and between 75% and 80% accuracy for both multi-class and binary classification. Results are not enough to take into consideration for the real diagnosis. The main problem of this methodology lies in the conception of their CNN model. Even if the size of the dataset is huge, the architecture of the CNN model is very important in predicting COVID-19 cases accurately.
In [26], authors designed a system called COVIDC to diagnose COVID-19 based on CNN methodology and using 4882 COVID-19 CT scans as the dataset. The approach involved using a combination of three classifiers: support vector classification (SVC), random forest classification (RFC) and extreme gradient boosting classification (XGBC). The special idea in this work is that the model goes deep in classifying the CT features by predicting how severe COVID-19 is, based on the image. In this work, the authors did not report the accuracy of their models, which makes it hard to evaluate the model compared to other models. In [27], authors proposed a CNN model based on Xception architecture and trained it across a prepared dataset containing 284 COVID-19 X-ray images, 657 pneumonia images and 310 normal images, resulting in 89.6% accuracy.
In [28], authors conducted a comparative study of the ability of different CNN models to detect coronavirus cases based on chest X-ray and CT images. In this study, the best CNN model was inception_Resnet_V2, for which they obtained 92.18% accuracy based on training a dataset of 2780 images of pneumonia, 231 of Covid19 and 1583 normal individuals. The dataset used in this study is imbalanced and insufficient in term of COVID-19 cases.
In [29], the authors developed a CNN model called COVID-CXNet based on densely connected convolutional networks (Dense-Net) architecture. They used a CXR dataset containing 780 COVID-19 cases, 5000 Normal images and 4600 pneumonia cases. The method achieved the result of 96.10% accuracy in detecting positive COVID-19 images correctly. In [30], authors used a very large dataset containing 13975 COVID-19 CXR images. They obtained 93.3% accuracy, where the training phase was across 25 epochs with a batch size of 64. In [31], authors developed a new CNN model called a parallel-dilated convolutional neural network architecture for detecting COVID-19 from chest X-ray images (PDCOVIDNet). They achieved 96.58% accuracy by training their model across a dataset containing 2019 COVID-19 X-ray images, 1341 of normal cases and 1345 pneumonia cases.
Table 1 summarizes the results obtained by the works described above and specifies the size of the COVID-19 dataset used.
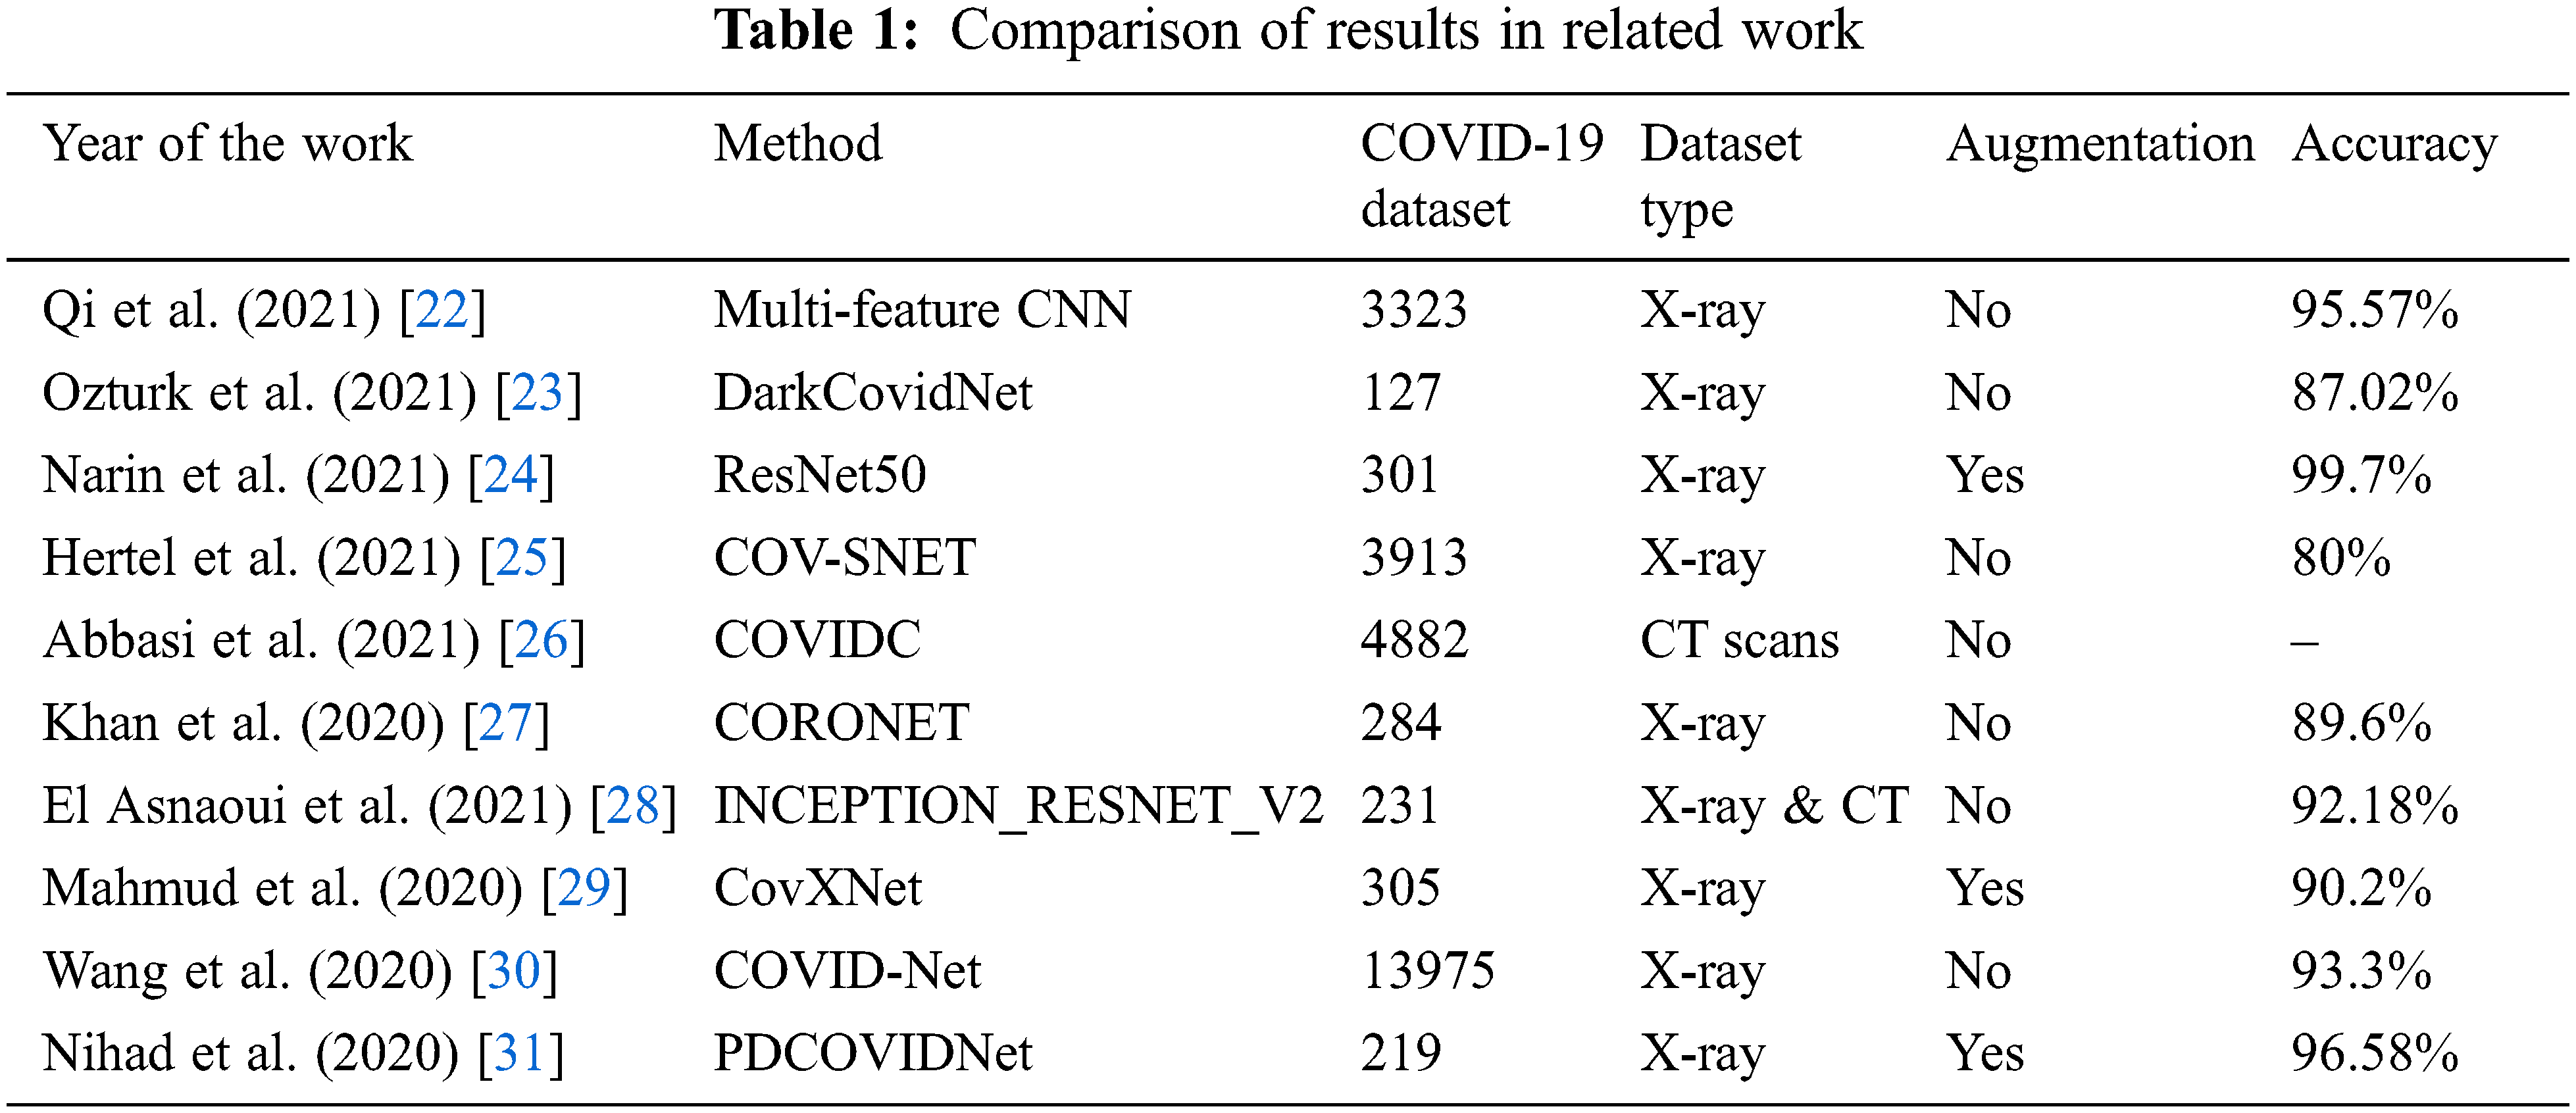
The summary of the related work in Table 1 shows that although Narin et al. [24] obtained 99.7% accuracy using their proposed transfer learning methodology based on a pre-trained model ResNet50, the dataset used contained only 301 images of COVID-19, which is a weak dataset compared to the actual availability of COVID-19 data. In contrast, Wang et al. [30] proposed a COVID-Net CNN-based model and trained it on a massive dataset of 13975 CXR medical images. However, they achieved only 93.3% accuracy, which is not a good result to adoptfor confirmed case diagnosis. Thus, a well-designed CNN model for predicting COVID-19 disease should have an optimal architecture and be trained on a balanced dataset containing a sufficient number of images, without augmentation techniques, as well as obtaining good accuracy on the test dataset.
Based on the weaknesses identified in related studies, we propose through this work a newly designed CNN model, COV2Net, that is trained on a moderated and cleaned dataset of 1764 COVID-19 X-ray images collected from many sources and achieved a high level of accuracy of 97.52%.
This section presents the research methods used to carry out this research work. The methodology consists of four interrelated phases: preparing the valid dataset from multiple datasets, data pre-processing, deep learning model building, and model evaluation and test performance.
3.1 Global Overview of the Proposed COVID-19 Detection System
This methodology used in this work consists firstly of the preparation and the pre-processing of images in the dataset, then building the models for training. At the end, an evaluation step is performed with validation of the results using the Grad-cam technique, which is the principal novelty of this paper. The global overview of the proposed methodology for predicting COVID-19 cases is shown in Fig. 1.
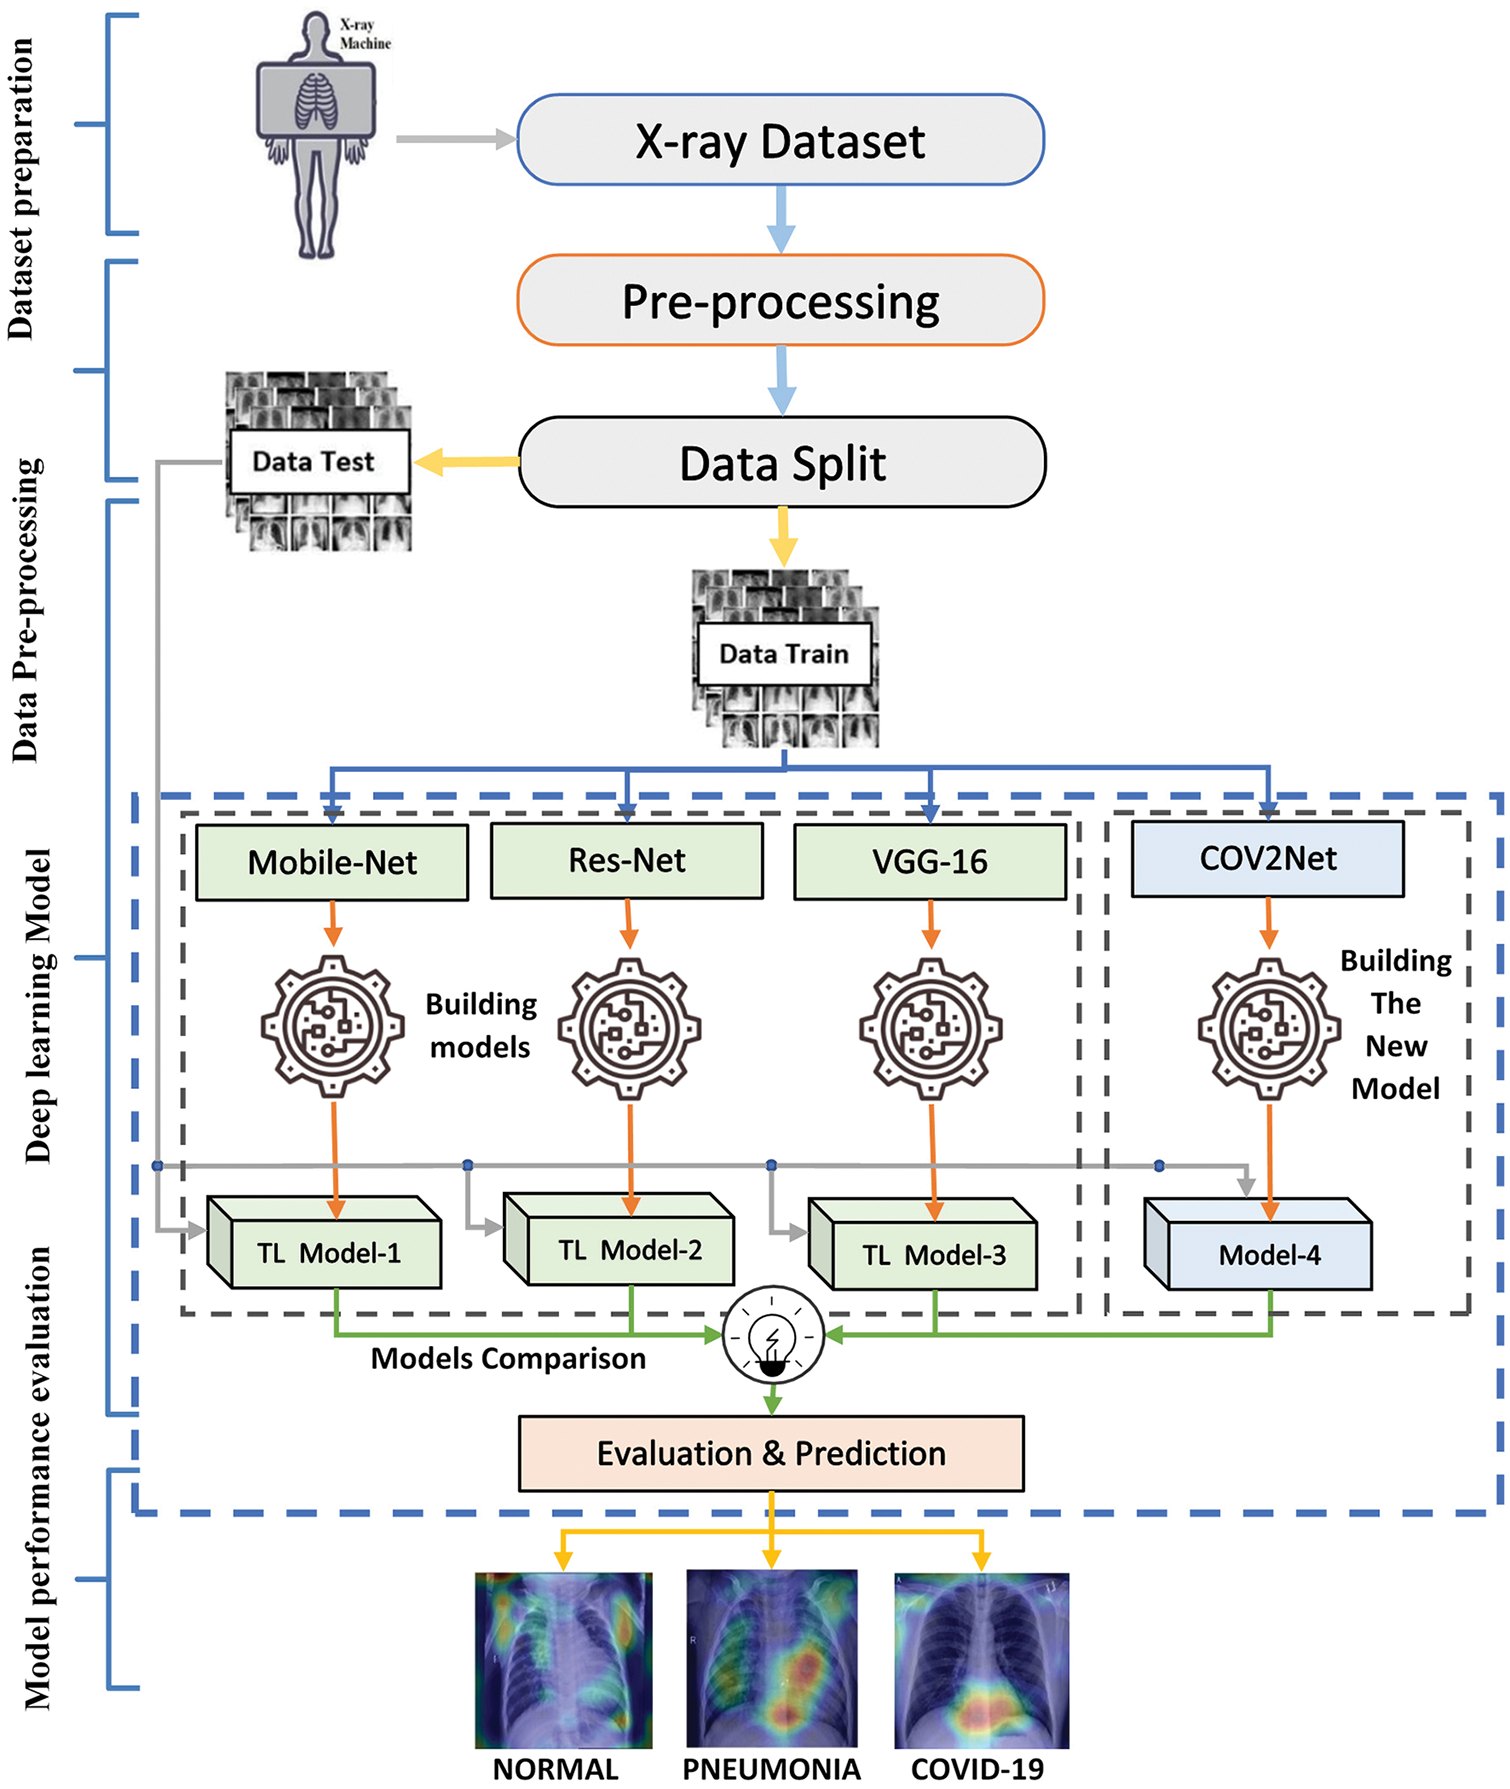
Figure 1: Global overview of the proposed COVID-19 detection system
3.2 Dataset Preparation and Pre-processing Phases
This section presents the initial phase of the research methodology, which is the data preparation phase. The availability of datasets is volatile. In general, publicly available datasets for COVID-19 patients to train machine learning models and obtain excellent results are still limited. In this work, many X-ray thoracic images were collected to train the proposed COV2Net model, as described later. The constructed dataset contains three classes of patients: normal patients, COVID-19-confirmed patients and patients with other pneumonia types. Fig. 2 shows examples of each category.
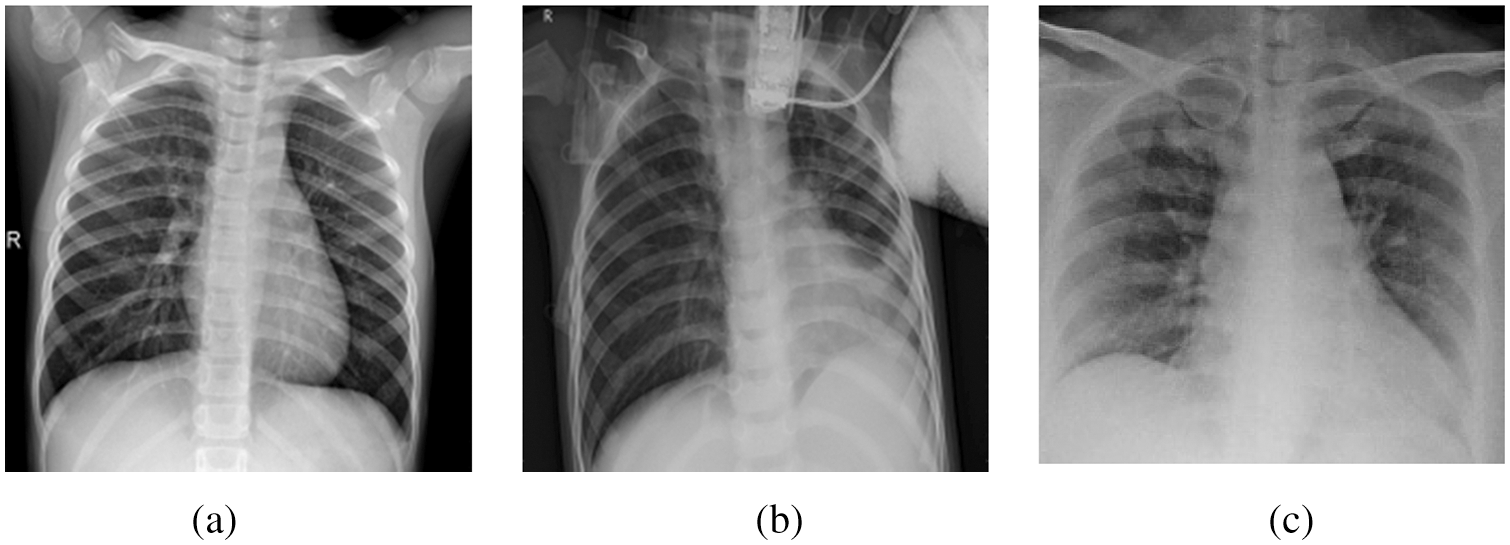
Figure 2: A sample of image classes in the collected dataset: (a) Normal case, (b) Pneumonia case, (c) COVID-19 case
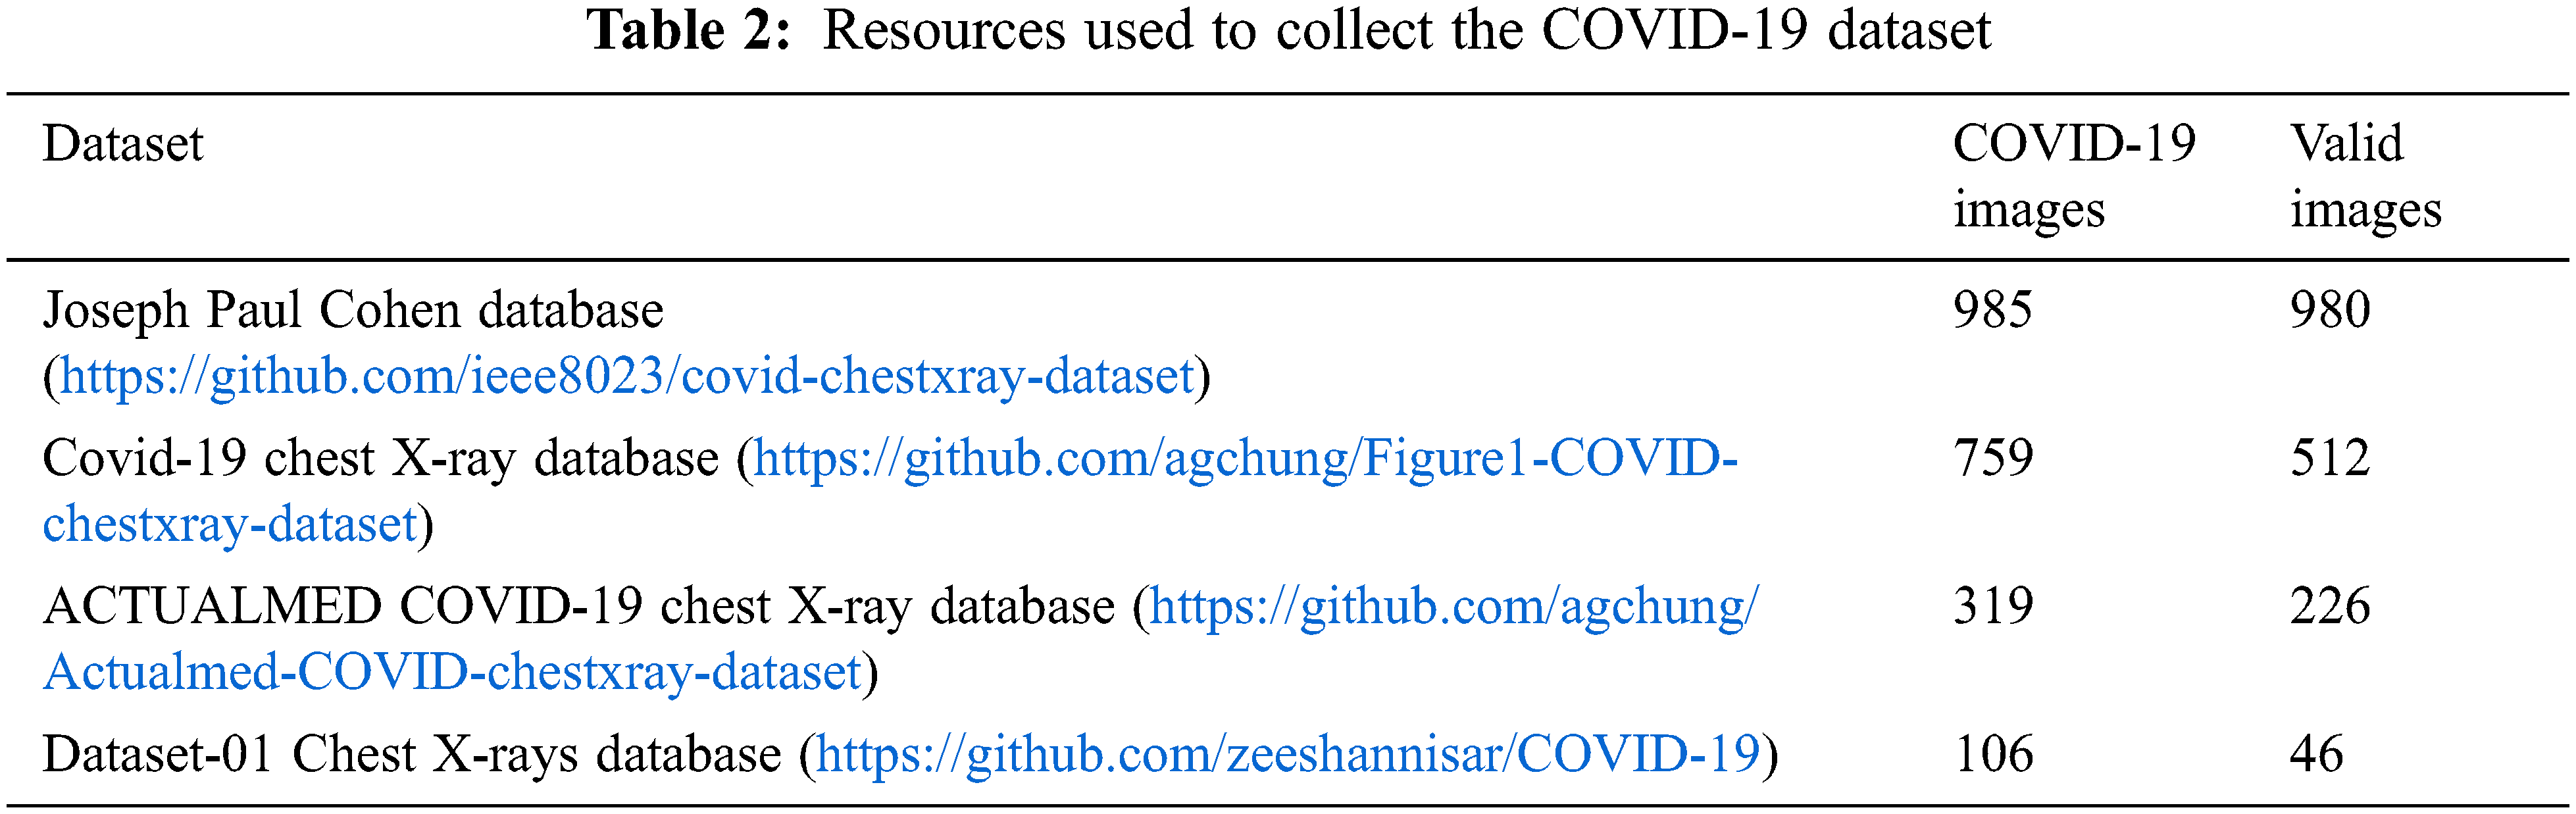
The X-ray images obtained from many publicly available sources were filtered and resized as valid images. As a result, 1349 images of normal patients and 3895 images of non-COVID-19 related pneumonia cases were collected. This part of our dataset originated from two different datasets, the Joseph Paul Cohen database, and Dataset-01 Chest X-rays. In addition, the COVID-19-based X-ray images required four different databases to collect 1764 images. The details are illustrated in Table 2.
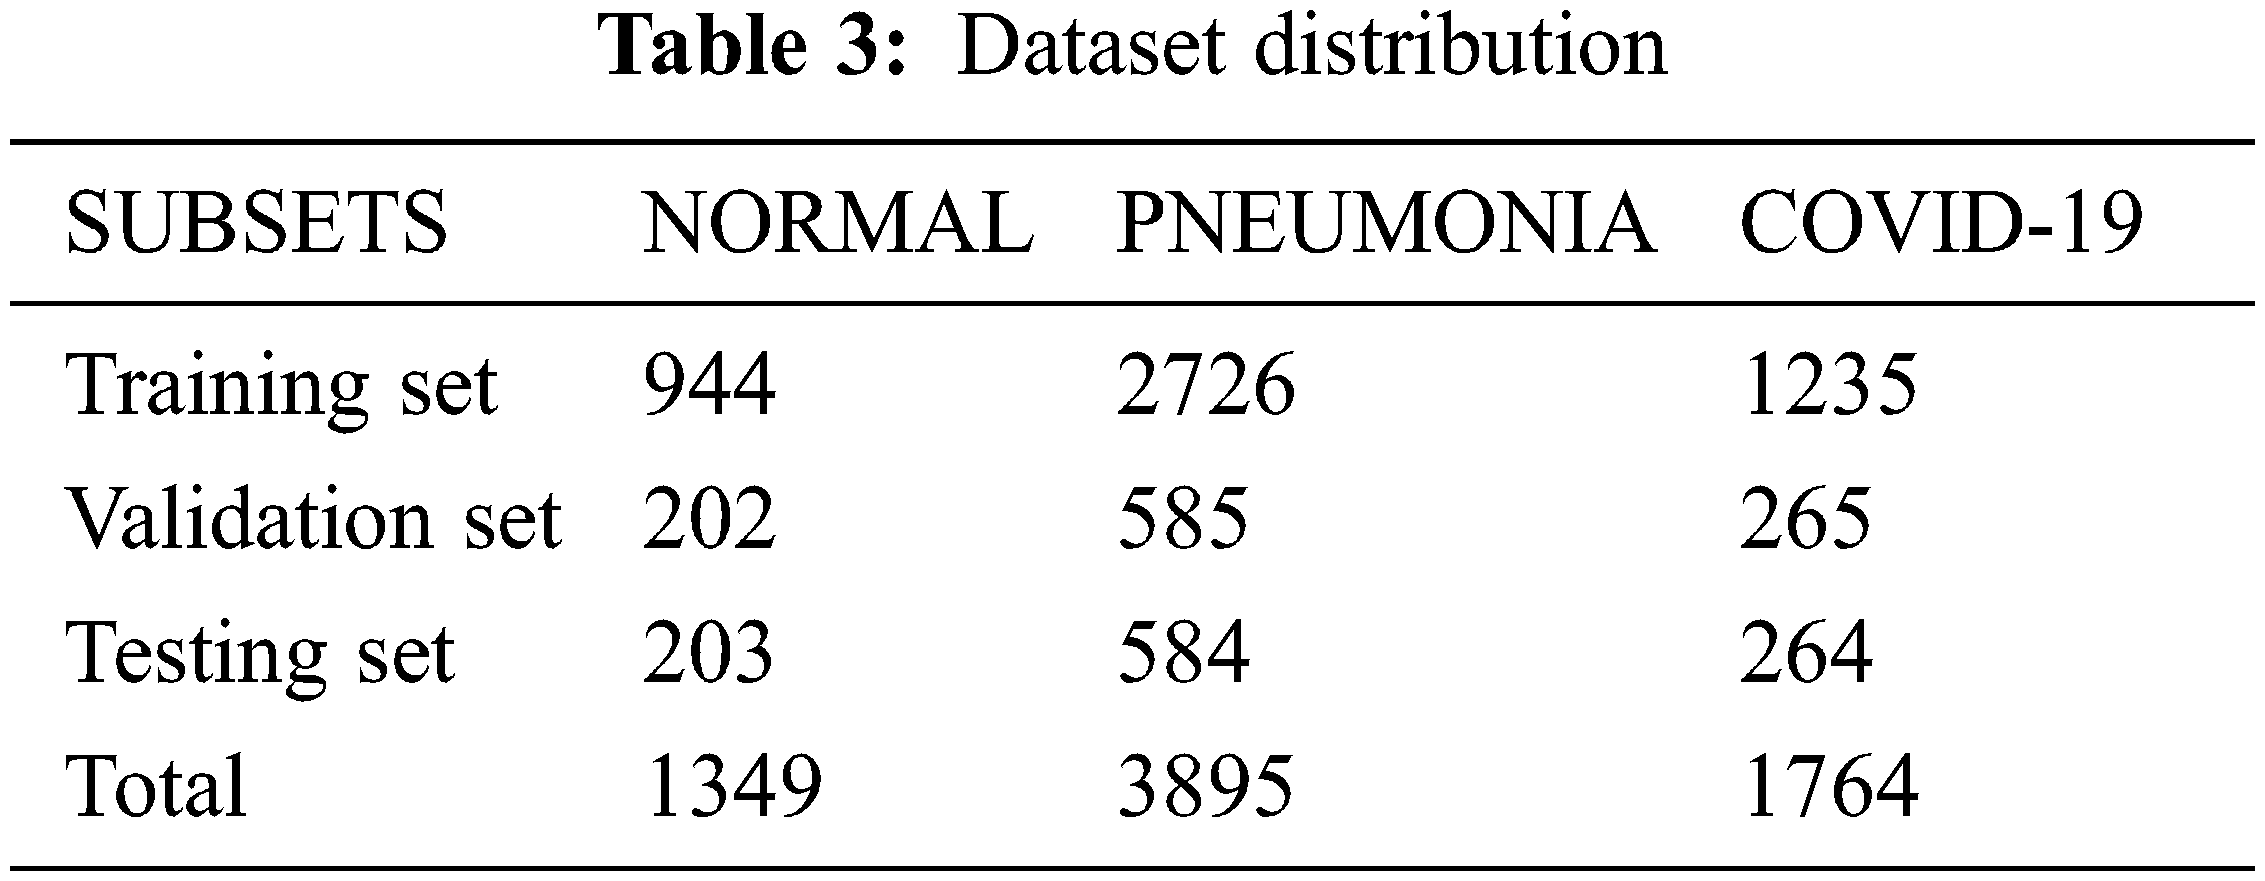
After preparing the dataset, we split it into three sub-datasets with the ratios: 70% for training, 15% for validation and 15% for testing. A detailed description of this partitioning is shown in Table 3.
3.3 Deep Learning Model Building Phase
In the third phase, the methodology adopted in this work derives from the artificial intelligence field [32] where machine learning techniques [33], specifically the convolutional neural networks (CNNs) [34,35], are proven their ability to handle images efficiently. CNN are very efficient in processing and analyzing images for classification and segmentation tasks. It allows the creation of model architecture that can handle the visual problem. The training of the designed model is based on a specific dataset assembled from publicly available data and then organized and preprocessed to ensure it is a valid dataset.
The segmentation and classification of labels based on image processing, a CNN network is recommended to obtain significant results [36]. The discrete convolution operation is based on a mathematical operator applied to image pixels as discrete spaces of elements.
For complex functions f, g defined on N natural ensemble, the convolution of f and g is defined as follows [37]:
CNN network is composed of different types of layers [38]: input layers, convolutional layers [39] and fully connected layers [40] and output layers. The input parameters are up to the designer, but the parameters of this layer must fit the preprocessed image shape. While the output layer conception depends on the type of the classification task, which would be a binary classification task or a multi-class task. The convolutional layers are ensembles of connected nodes, where each node can perform a defined convolution operation for its inputs and forward the output to the next node [41]. The fully connected layers, also called deep layers, consist of a network of nodes connected with a full-mesh structure, where each node of a specific layer is connected to each node in the next and the previous layers. All layers in a CNN network have different types of parameters specified while designing the architecture. Fig. 3 illustrates a simplified global architecture for a convolutional neural network where hidden layers contain the convolutional layers, pooling layers, and fully connected layers.
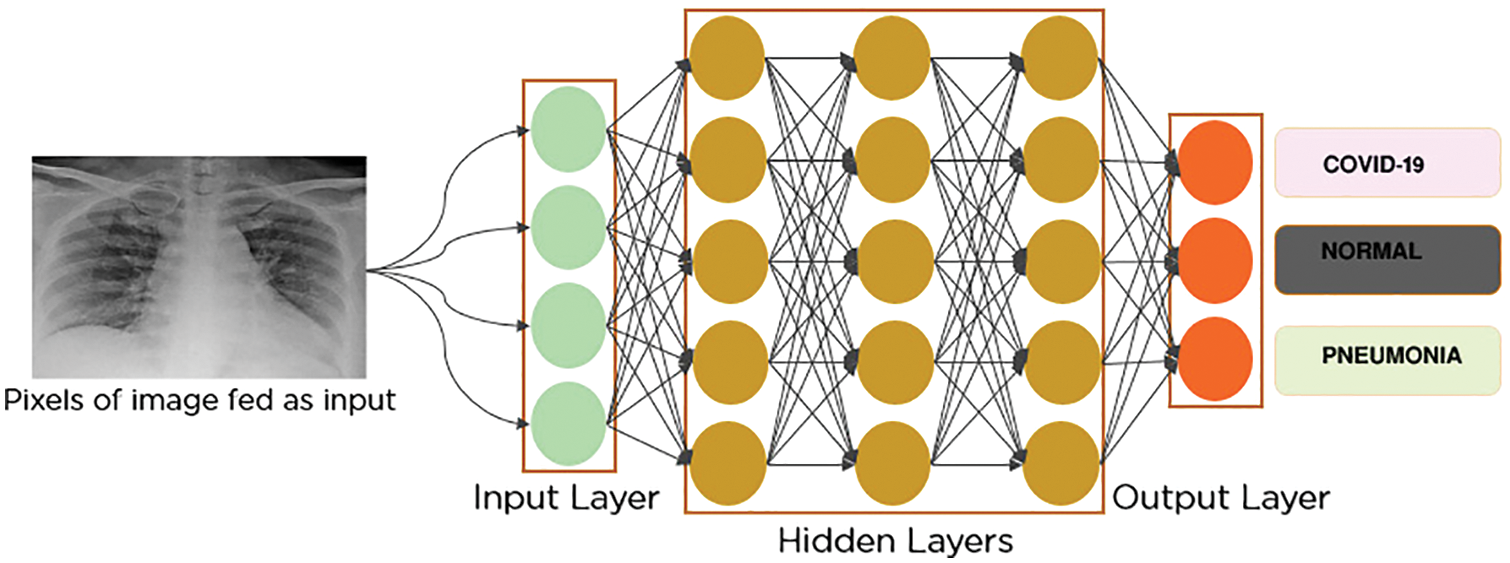
Figure 3: Global CNN architecture
a) Convolutional layers
The convolution layer is composed of several neurons connected spatially with neurons of the next layer, with a specific weight to be shared. The shared weights are optimized and regularized in the back-and-forward process over iterations [42]. This process detects the local features at all positions in the input feature.
b) Pooling layers
The pooling process consists of selecting only the vital information existing in the input feature map that can affect the final decision of the network [43]. The method of selecting this information determines the type of pooling layer. Generally, the most used type in CNN networks is max-pooling [44]. This type consists of selecting the maximum value inside a filter, where the size of the filter is defined as a parameter while designing the layer. Overall, all pooling layer types use the input to generate a smaller amount of essential data at the output. In Fig. 4, a max-pooling layer architecture is presented, applied to an input resolution shape of 224 × 224.
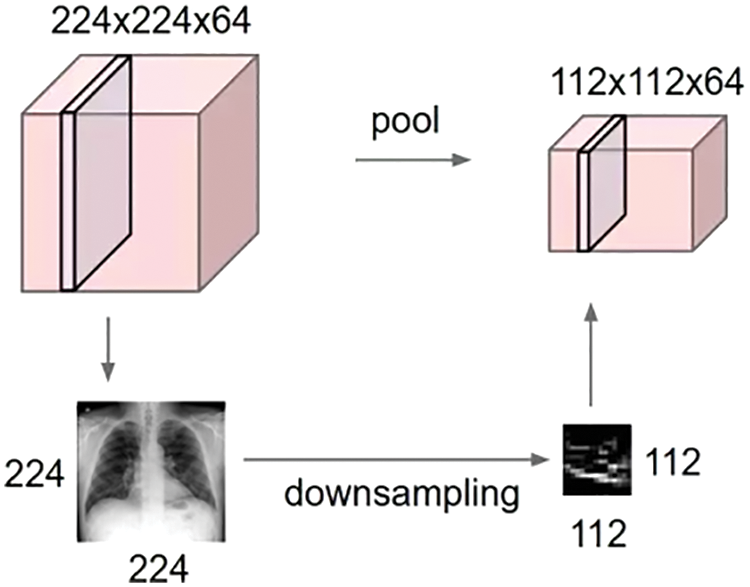
Figure 4: Down-sampling process across a max pooling layer
In Eq. (2), the output element
where
c) Fully Connected layers (FC)
Fully connected layers (also called dense layers or hidden layers) are composed of neurons that are connected fully with neurons of the previous and subsequent layers. This architecture is present in many artificial neural network types. Its goal is to help in the propagation of parameters through the network and to update weights to fit the optimal values for obtaining the best possible predictions [46].
d) Detailed Architecture of the Proposed COV2Net
The proposed CNN architecture of COV2Net is developed from scratch. In particular, it contains convolution layers and dense layers. Adding some dropout layers avoids over-fitting while training and max-pooling layers eliminate unnecessary data which propagate into the network.
At the beginning of the network, we use an input layer of shape (224 × 224 × 3), and at the end of the network we insert an output layer with three classes. Fig. 5 illustrates the global distribution of the used architecture and the main layers used to build COV2Net.
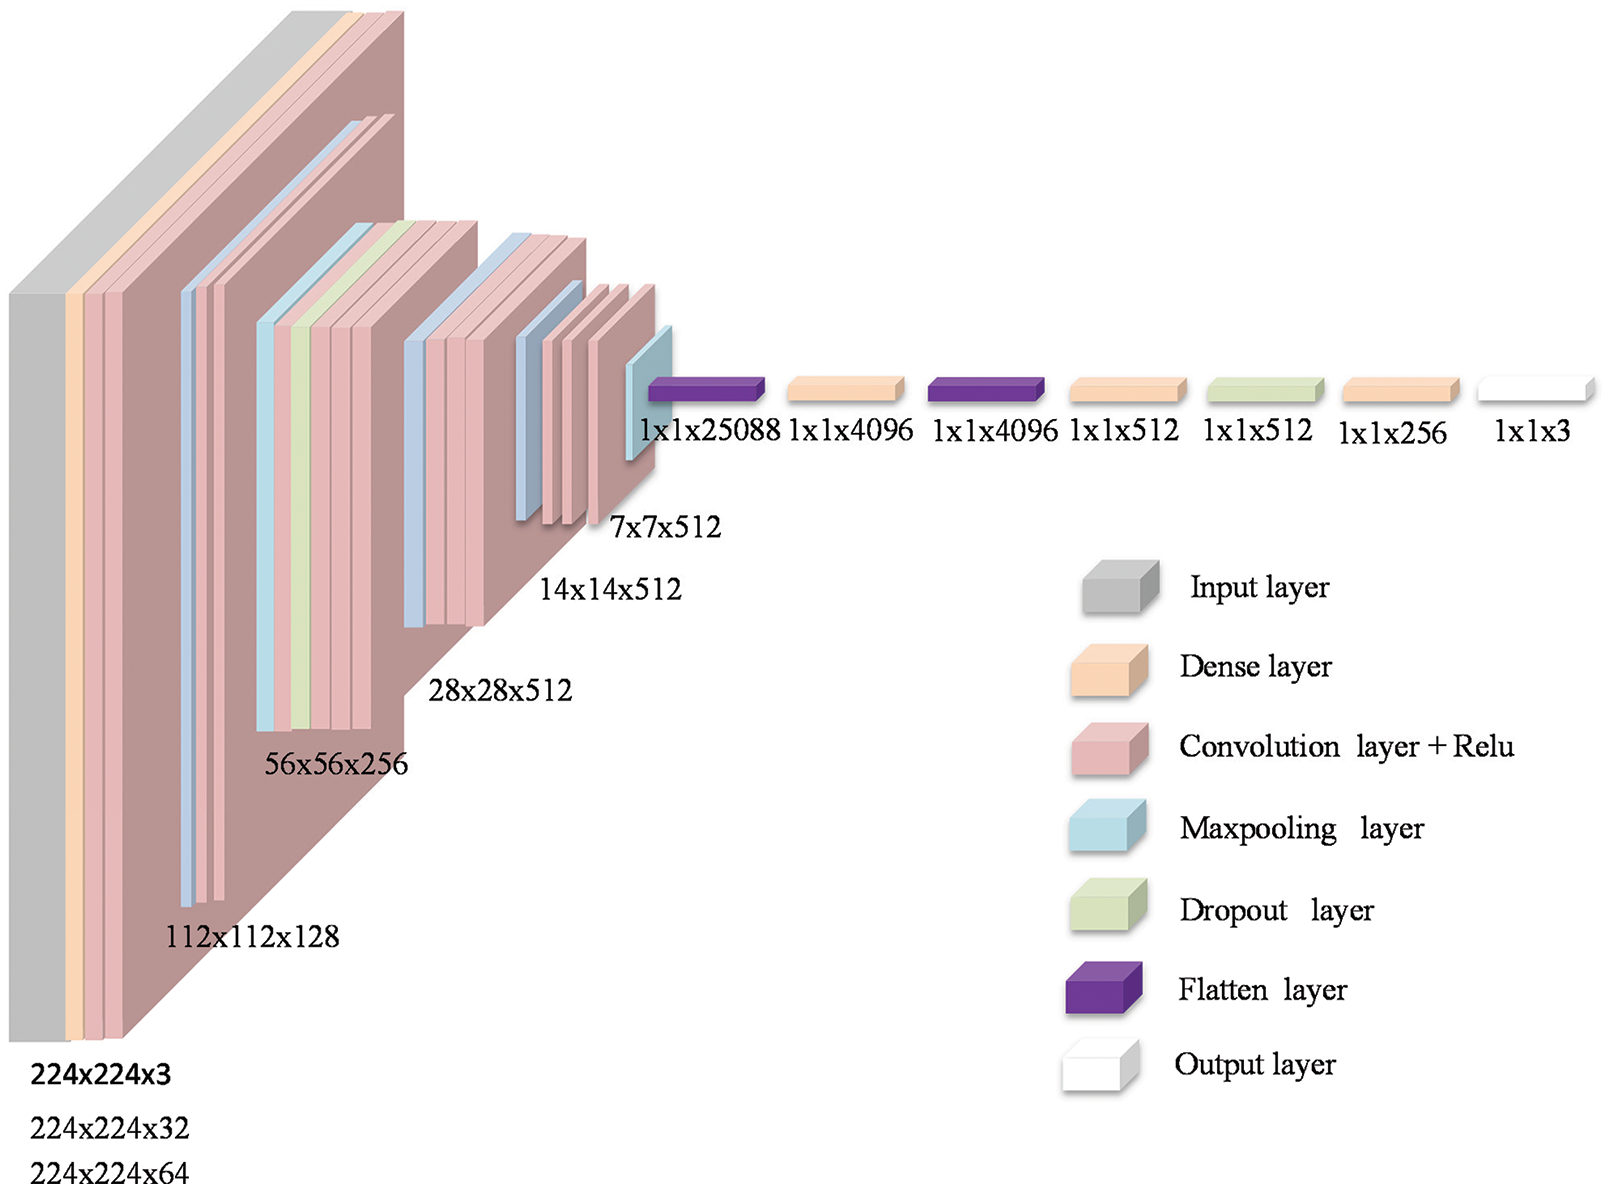
Figure 5: Architecture of COV2Net
In the COV2Net model, we used a root mean squared propagation (RMSProp) optimizer with a 10-6 learning rate to reduce over-fitting problems. Due to the multi-label aspect of our case, a cross-entropy loss function for regularization is used. As an output activation function, the softmax function is used because of the multi-class aspect of our classification task [47,48]. The mathematical formula of the activation function used is defined as follows:
Where zj is the input vector of the Softmax function and K is the number of classes in the multiclass classifier.
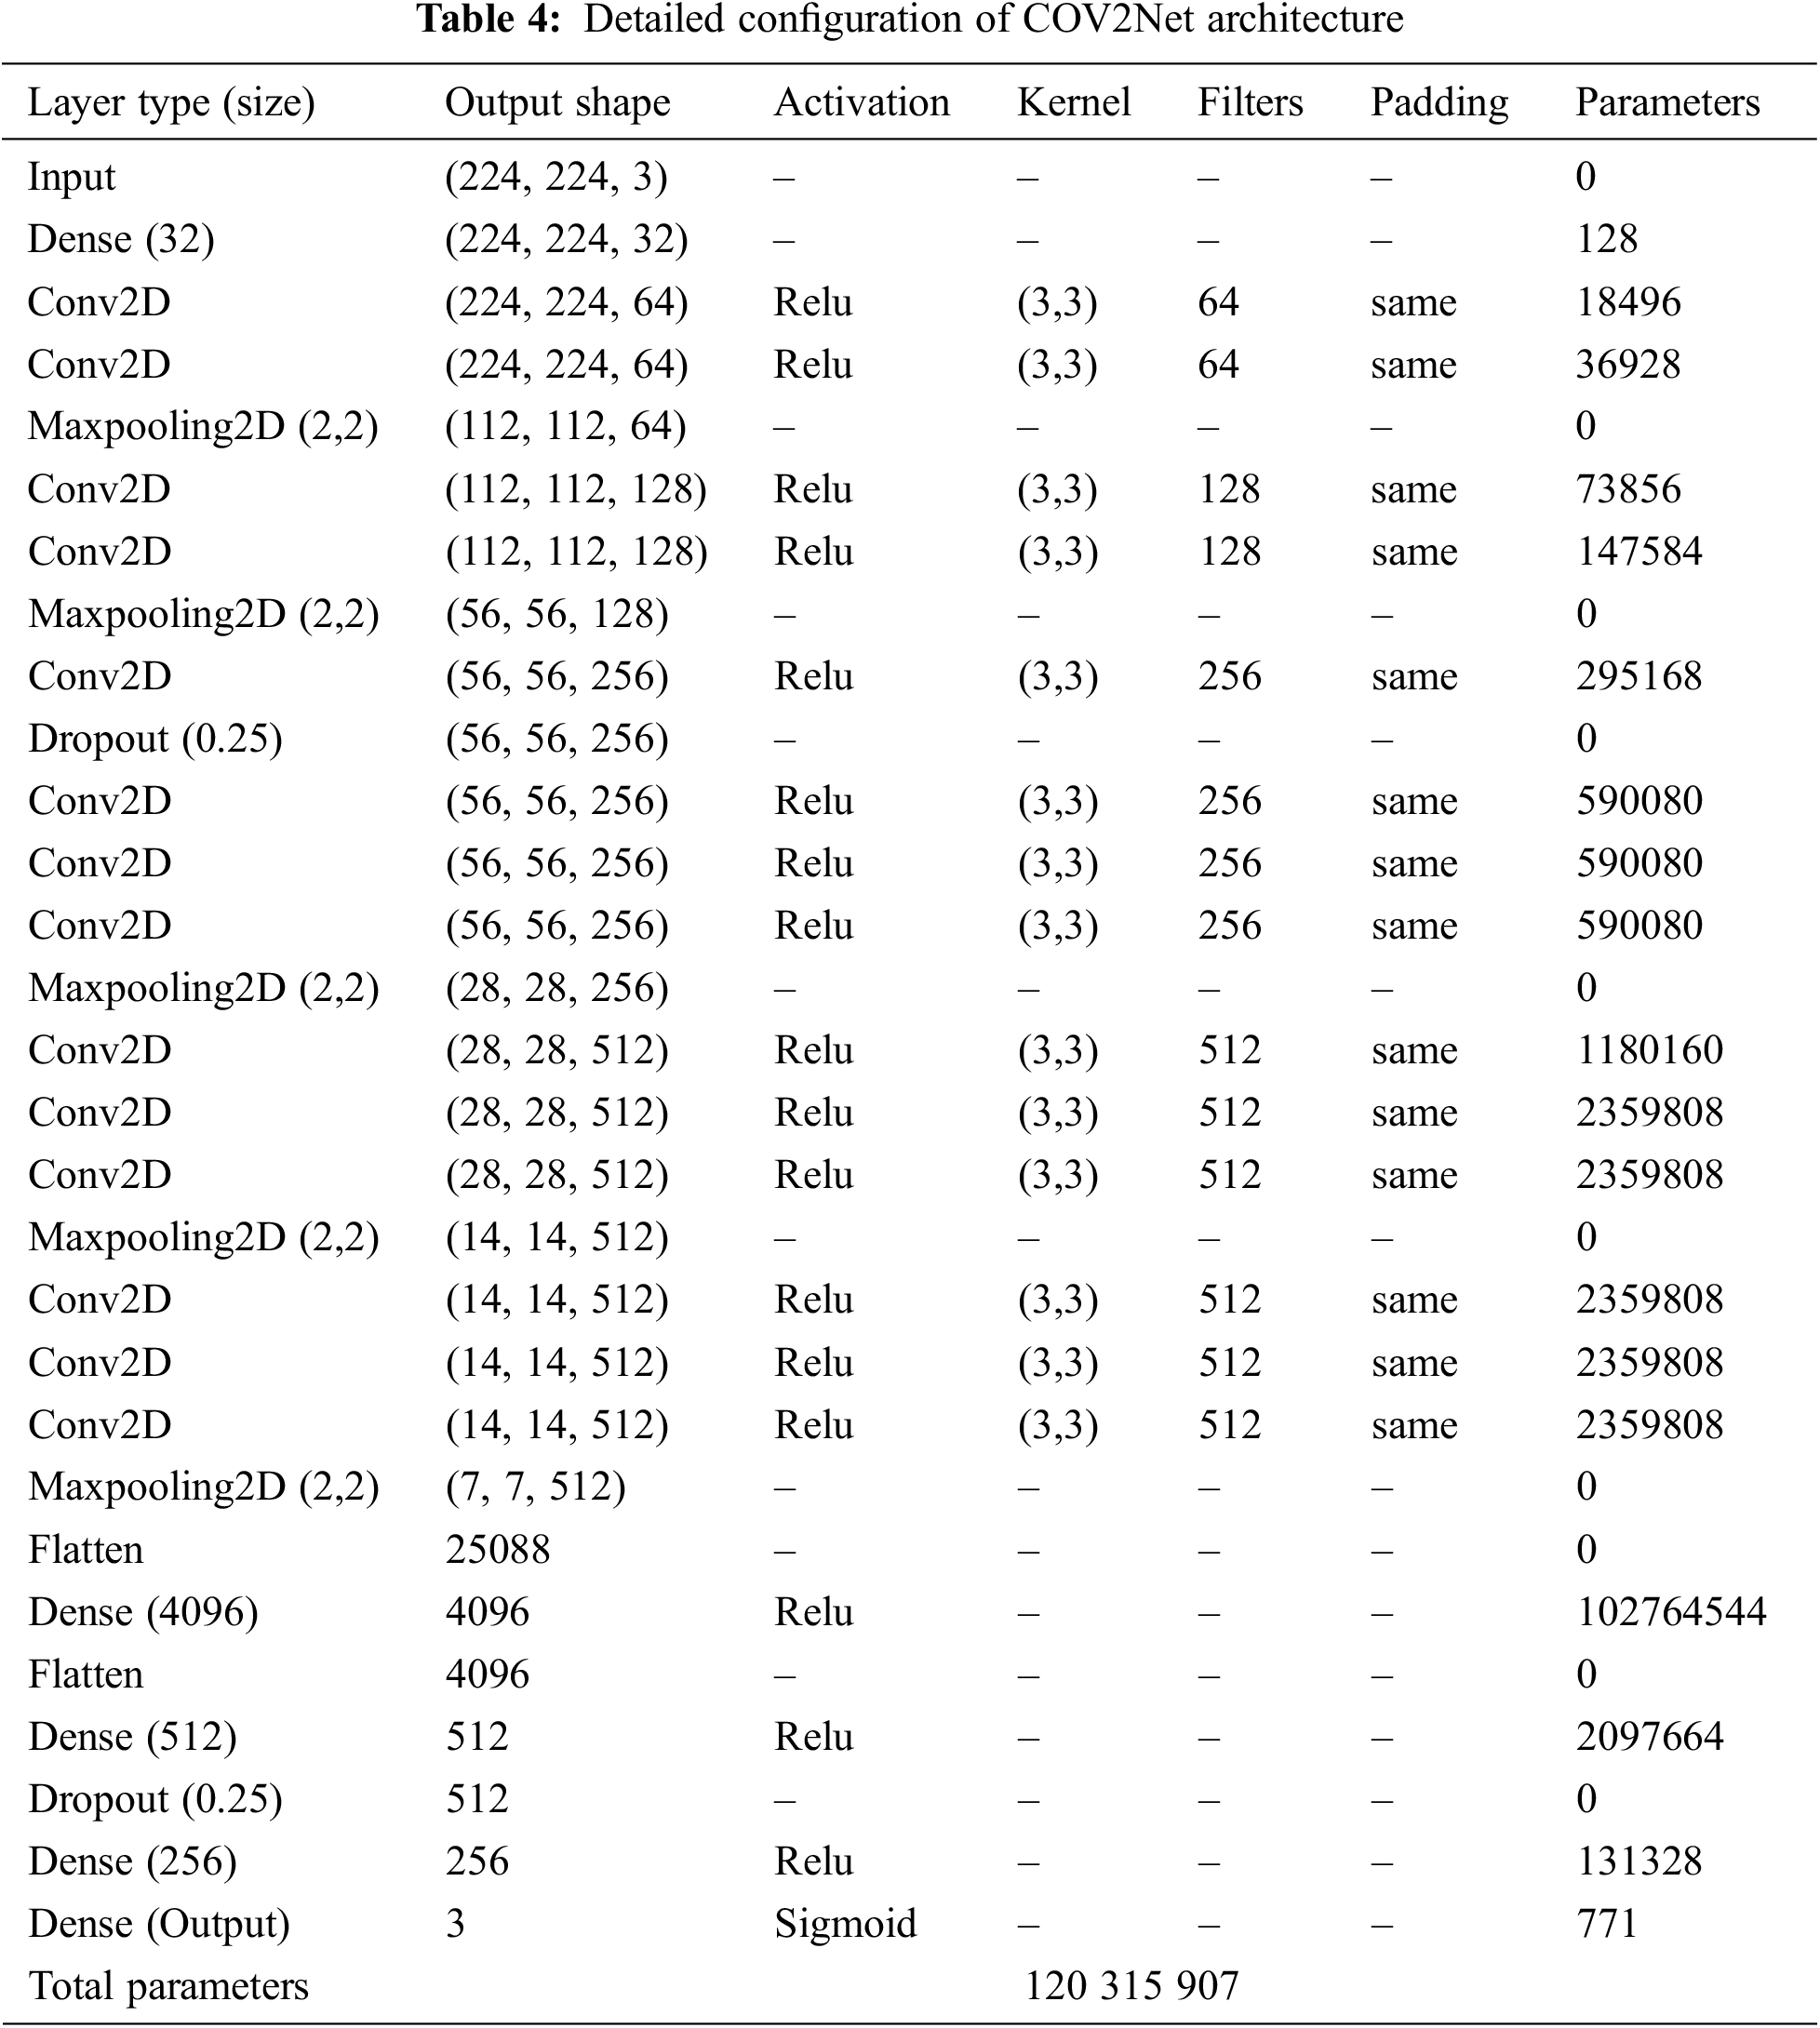
A detailed description of COV2Net is provided in Table 4.
3.4 Model Evaluation and Performance Phase
There are many metrics to evaluate a CNN model, depending on the case of the study. In this work, we chose metrics that could accurately evaluate CNN models trained and tested for the multi-label classification task using X-ray gray-scale images [49].
All the used metrics depend on specific parameters that must be calculated at the end of each step (training and testing); these concern, true positives (TP), true negatives (TN), false positives (FP) and false negatives (FN). These parameters are linked to one of the classes concerned. The true positive (TP) is the number of predicted positive cases correctly predicted according to the ground truth data. The true negative (TN) is the number of predicted negative cases that are correctly predicted according to the ground truth data. The false positive (FP) is the number of predicted positive cases that do not match the ground truth values. The false negative (FN) is the number of predicted negative cases that match the ground truth values.
Recall: Ratio of correctly predicted positive cases over the total truly positive cases.
Precision: Ratio of elements accurately predicted as positives out of all elements predicted as positive cases.
F1-Score: this metric combines precision and recall in one value that describes the correlation of both.
Accuracy: The ratio of total images accurately predicted over all the images.
Loss: This metric is reversibly proportional to the accuracy metric. It shows how much the prediction process fails across the dataset. In the training step, it has the role of a regulation parameter. Its formula depends on the nature of the classification task. In our case of multi-tasks, we use a categorical cross-entropy loss function [50], defined by:
3.5 Background on Some State-of-the-Art Pre-trained CNN Models
For comparison and performance evaluation, we decided in this work to train some well-known CNN models on the image classification tasks. We chose a VGG-16 CNN model explained in [51], where the model achieved 92.7% accuracy on an image-net dataset composed of 14 million images of 1000 different classes. In addition, VGG-16 can be considered as a form of improved AlexNet CNN [52] at the level of kernel-sized filters in the first and second convolutional layers.
Another interesting pre-trained CNN is Res-Net [53,54]. This network is based on skipping connections and taking shortcuts by ignoring some layers. This strategy is inspired from the functions of pyramidal cells in the human cerebral cortex [55]. This technique allows the network to train a vast number of datasets regardless of the lack of resources. The network obtained 92% accuracy on an Image-Net dataset.
The MobileNet CNN, which was proposed and explained in [56], is based on an inverted residual structure. The main idea of this network is that the input and the output layers of the residual blocks are bottleneck layers, in opposition to the traditional residual-based networks. This model obtained 89.5% accuracy on the Image-Net dataset and demonstrated excellent performance in dealing with images.
A brief description of the pre-trained CNN models used in the present study is provided in Fig. 6.
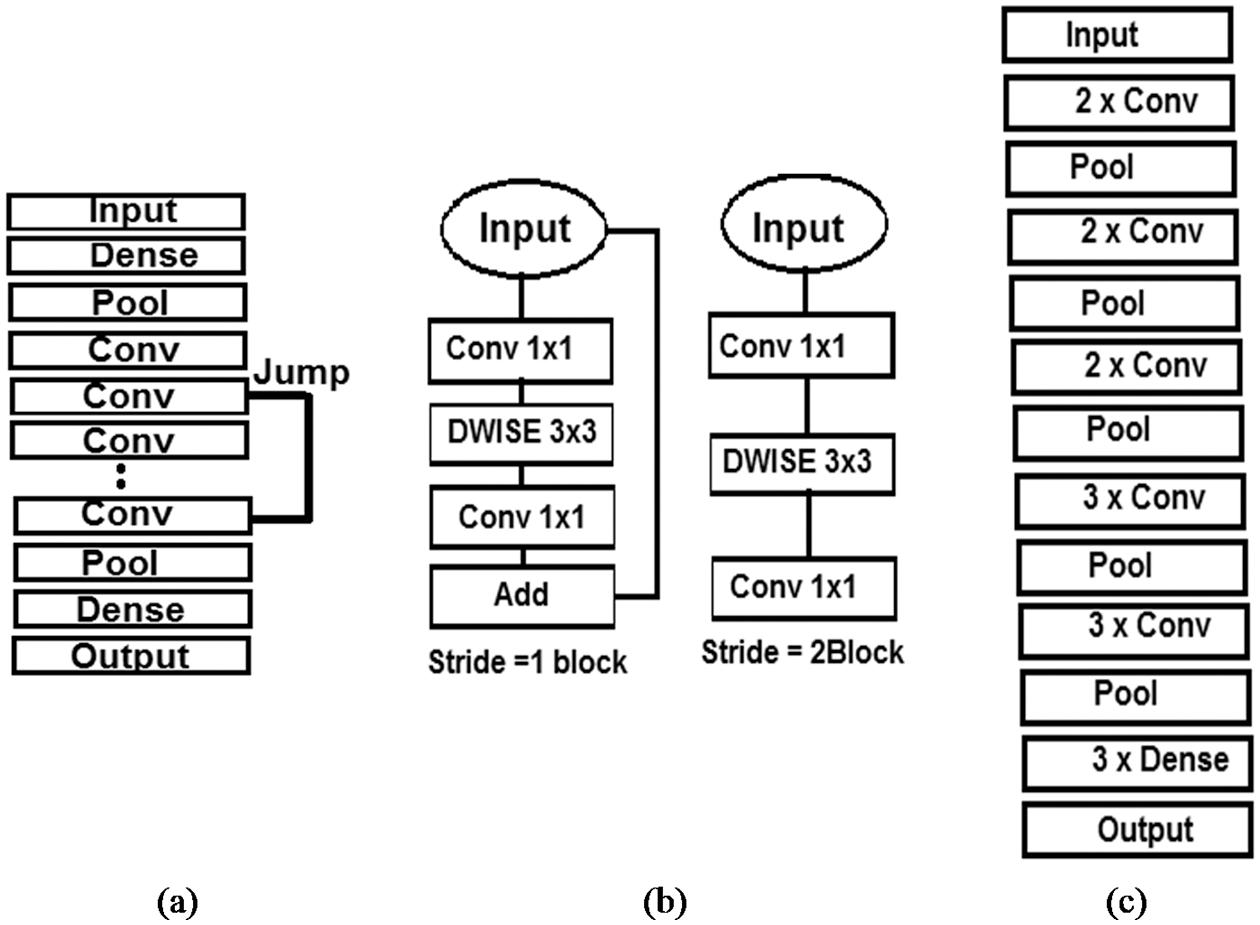
Figure 6: Graphic description of the architecture used for: (a) Res-Net, (b) MobileNet, (c) VGG-16
This section explains the results of the conducted experiments based on the proposed model. Generally, in a CNN model, many factors can make a difference in the results obtained, including the depth of its architecture, the type of its layers and the configuration parameters. In this work, we trained three other existing CNN models and compared the results to our COV2Net outcomes for each step. To accurately evaluate the models, all the models are trained on the same dataset through 50 epochs with the same configurations and conditions. Some metrics are computed after each epoch to supervise the convergence of the model and log the training process for graphical visualization. Trained models are also tested on the same independent dataset, then the metrics are computed.
The simulation experiments were conducted on the Kaggle platform owned by Google. It’s default hardware specifications consist of Intel Xeon central processing units (CPU) with four cores and 13 GIGABYTEs (GBs) of random-access memory (RAM), and a NvidiaP100 graphical processing unit (GPU), with two cores and 16 GB of memory. In this cloud platform, the most used deep learning libraries are pre-installed. The Kaggle platform runs with a Jupyter-like interface that can save works in versions and notebooks.
As stated earlier, (Mobile-Net, Res-Net, VGG16 and COV2Net) were trained across 50 epochs with the same configuration to get comparable results. Figs. 7, 8 show the obtained results for the training step. The Mobile-Net model training stabilized at epoch 40, while the Res-Net model achieved the training goal at epoch 45. The VGG16 model and COV2Net are slightly similar at the training step, stabilizing at epoch 20.
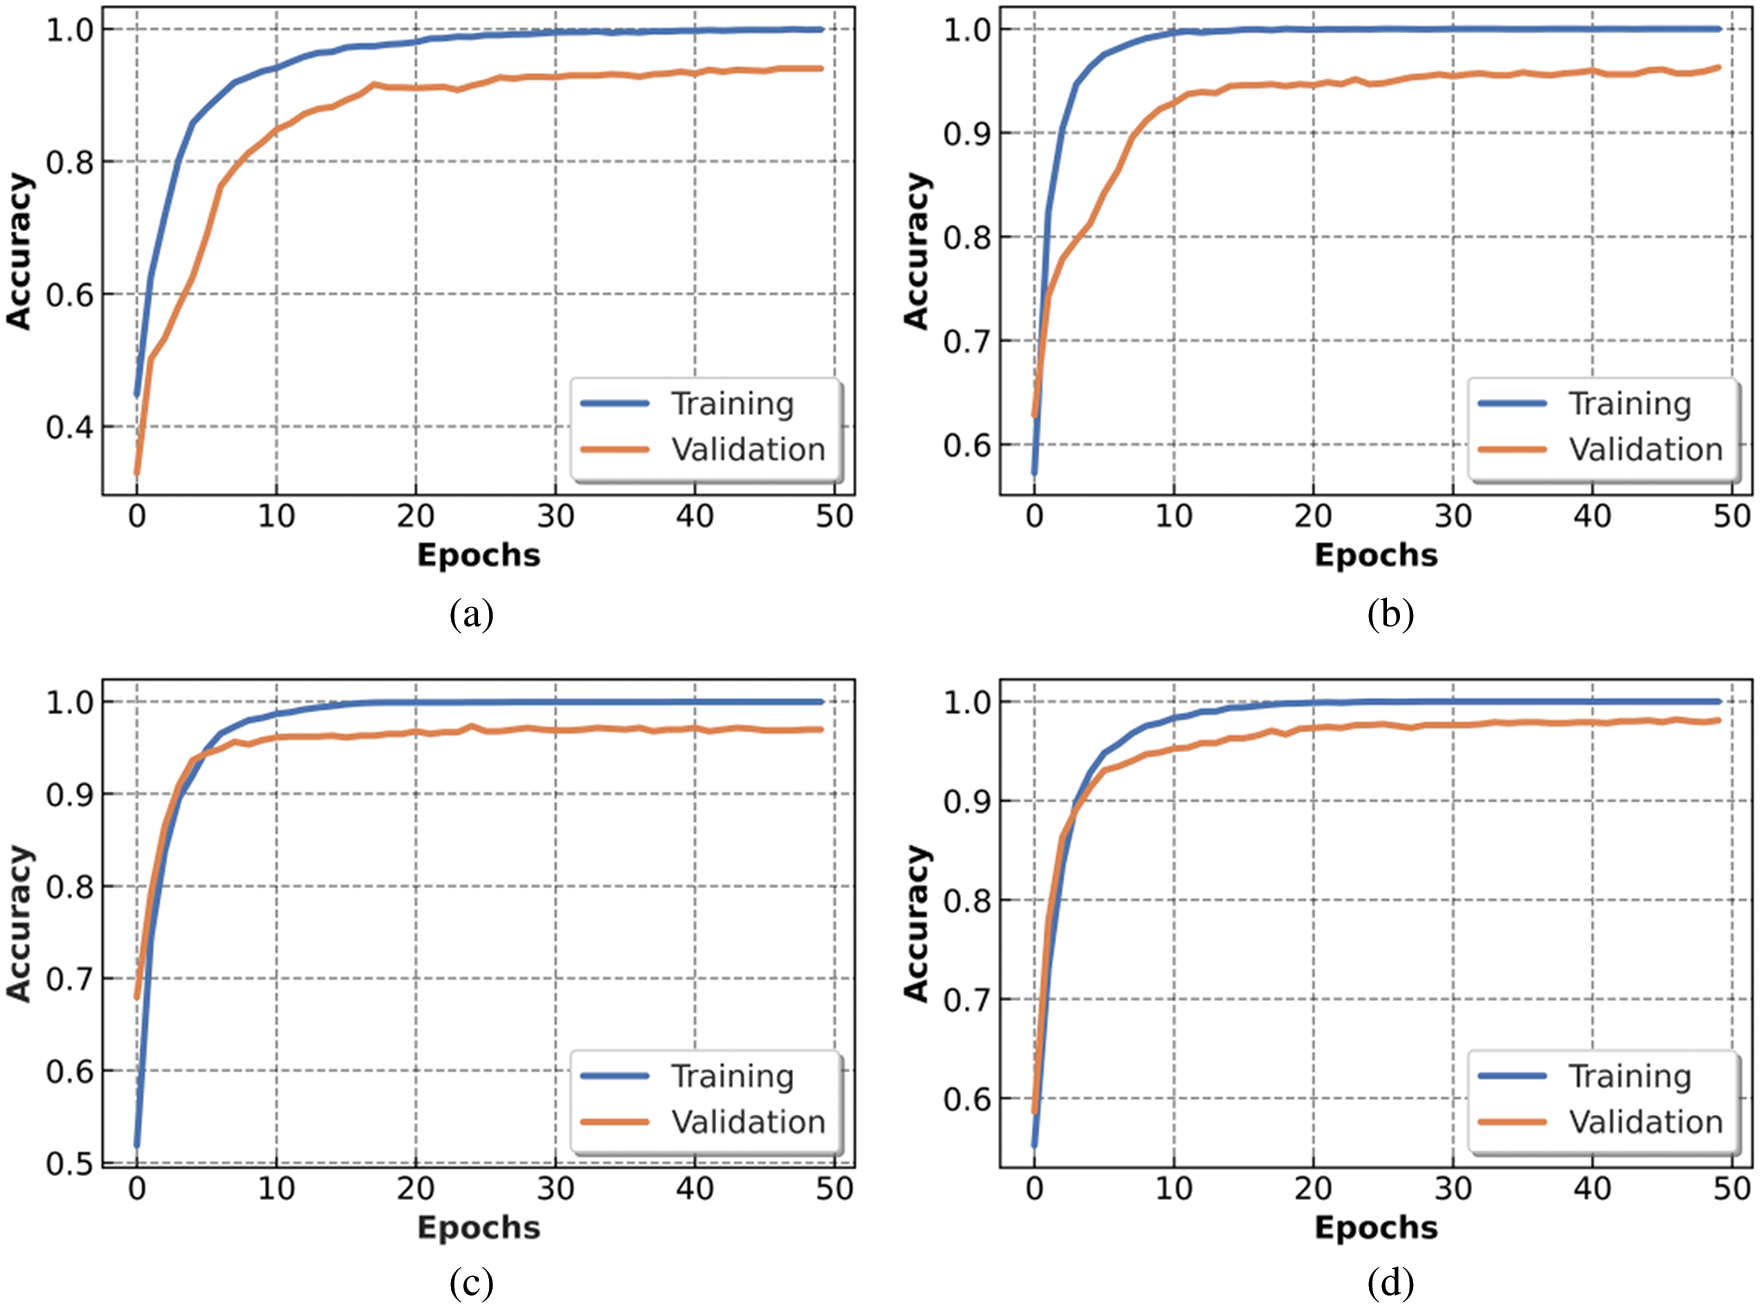
Figure 7: Accuracy metric of trained models: (a) Mobile-Net, (b) Res-Net, (c) VGG16 and (d) COV2Net
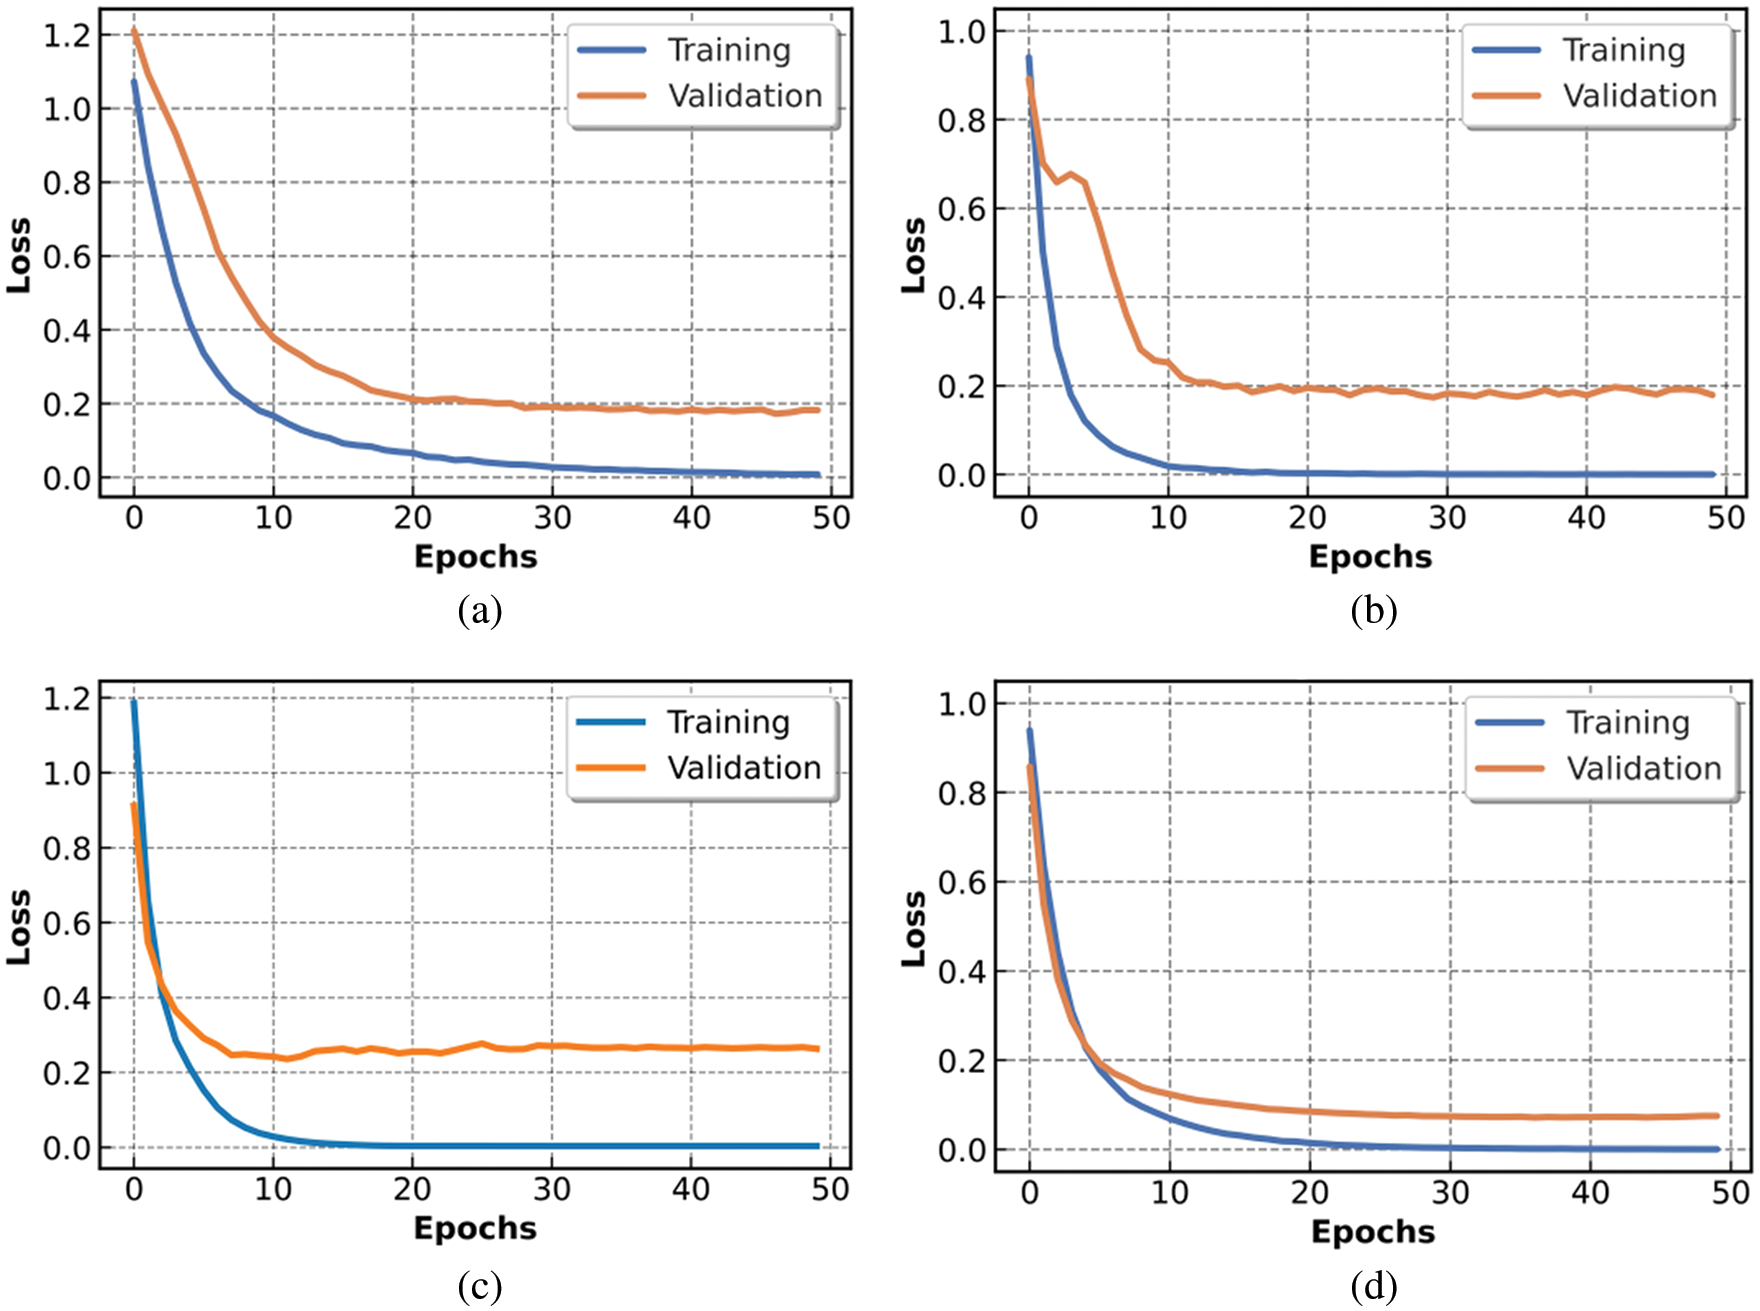
Figure 8: Loss metric of trained models: (a) Mobile-Net, (b) Res-Net, (c) VGG16 and (d) for COV2Net
In this experiment, we used a Linux platform and computing capacity of four CPUs with 13 GB of RAM and 16 GB of GPU memory. This configuration forced us to set the patch parameter of the training to 16 to achieve the training goal without errors.
The charts presented in Fig. 7 show the accuracy obtained after training and testing our proposed COV2Net model and three other pre-trained CNN models within 50 epochs. The COV2Net model presents the best accuracy compared to the other models.
The loss function values over the 50 epochs are presented in Fig. 8, in which COV2Net shows the smallest loss values compared to the three other CNN models.
Loss variation in Fig. 8 converges very fast for all models. Generally, the loss value stabilizes at epoch 30 for all the models. However, the loss function for the VGG16 model has higher values than the other trained models, while the COV2Net model achieves best results, with the lowest loss values.
After training each model, we tested them on a completely independent sub-dataset, and obtained different results, as presented in Fig. 9.
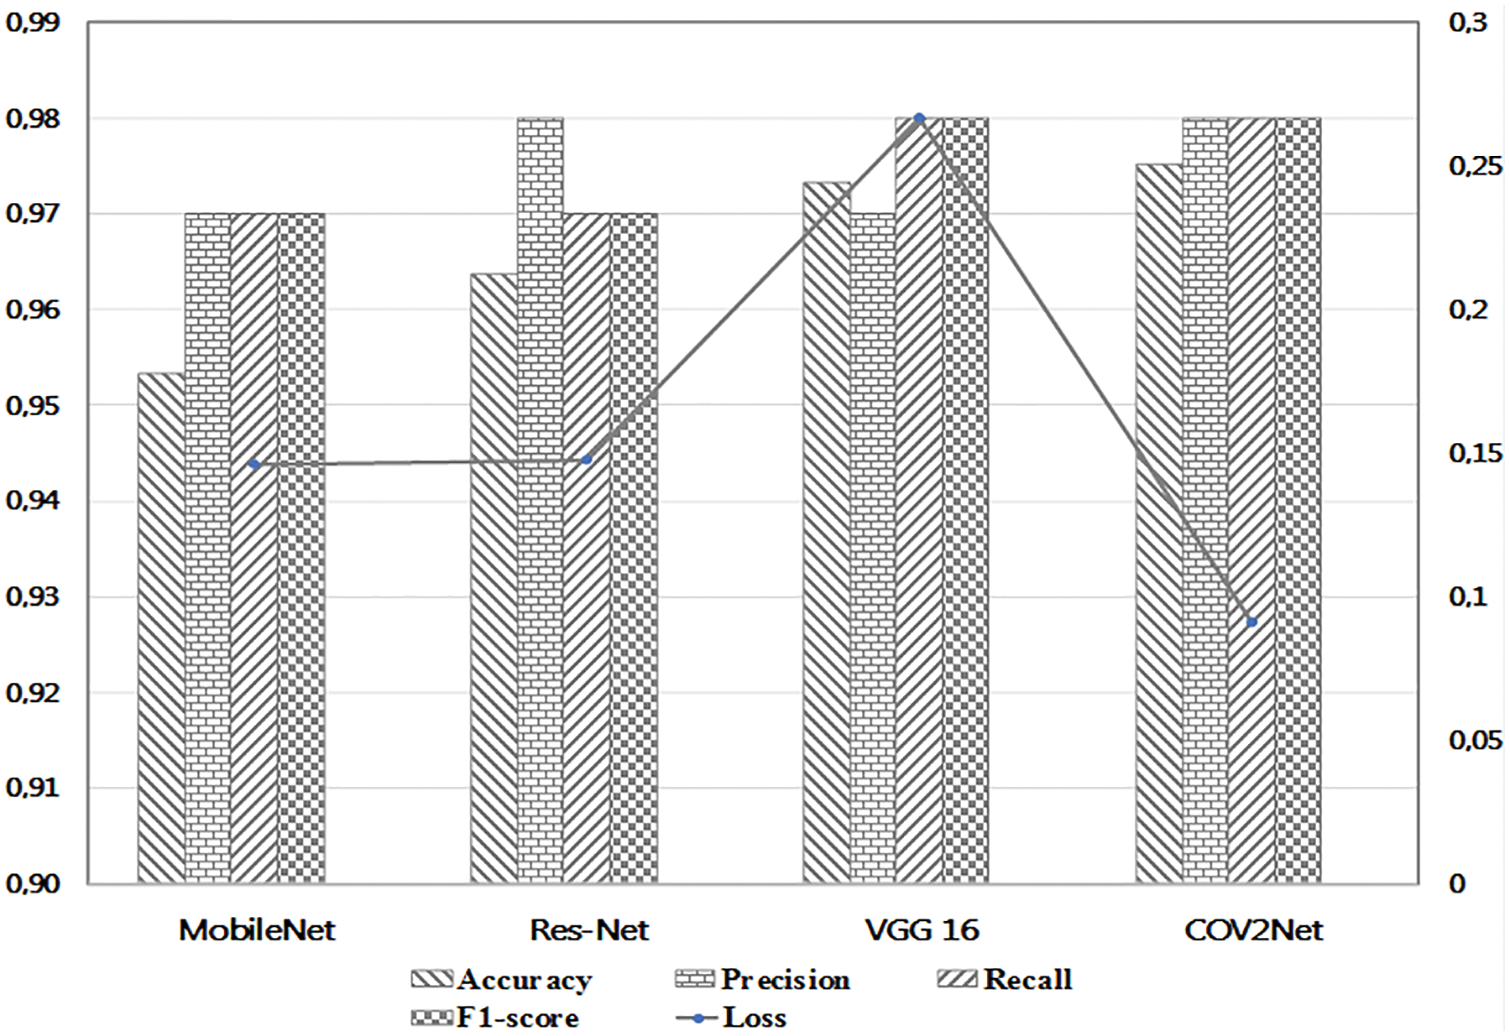
Figure 9: Detailed values of metrics for each trained model
According to the results obtained in the testing step, the COV2Net model shows the best results with 97.52% in terms of accuracy and 9% in terms of loss. The accuracy value is slightly higher than that for VGG16. However, the low loss value of COV2Net compared to all other models is very interesting. It means that COV2Net predicts COVID-19 cases very well compared to other models.
To show more details of the testing step, we generated a confusion matrix of the prediction results for the test set images. Fig. 10 shows the results obtained.
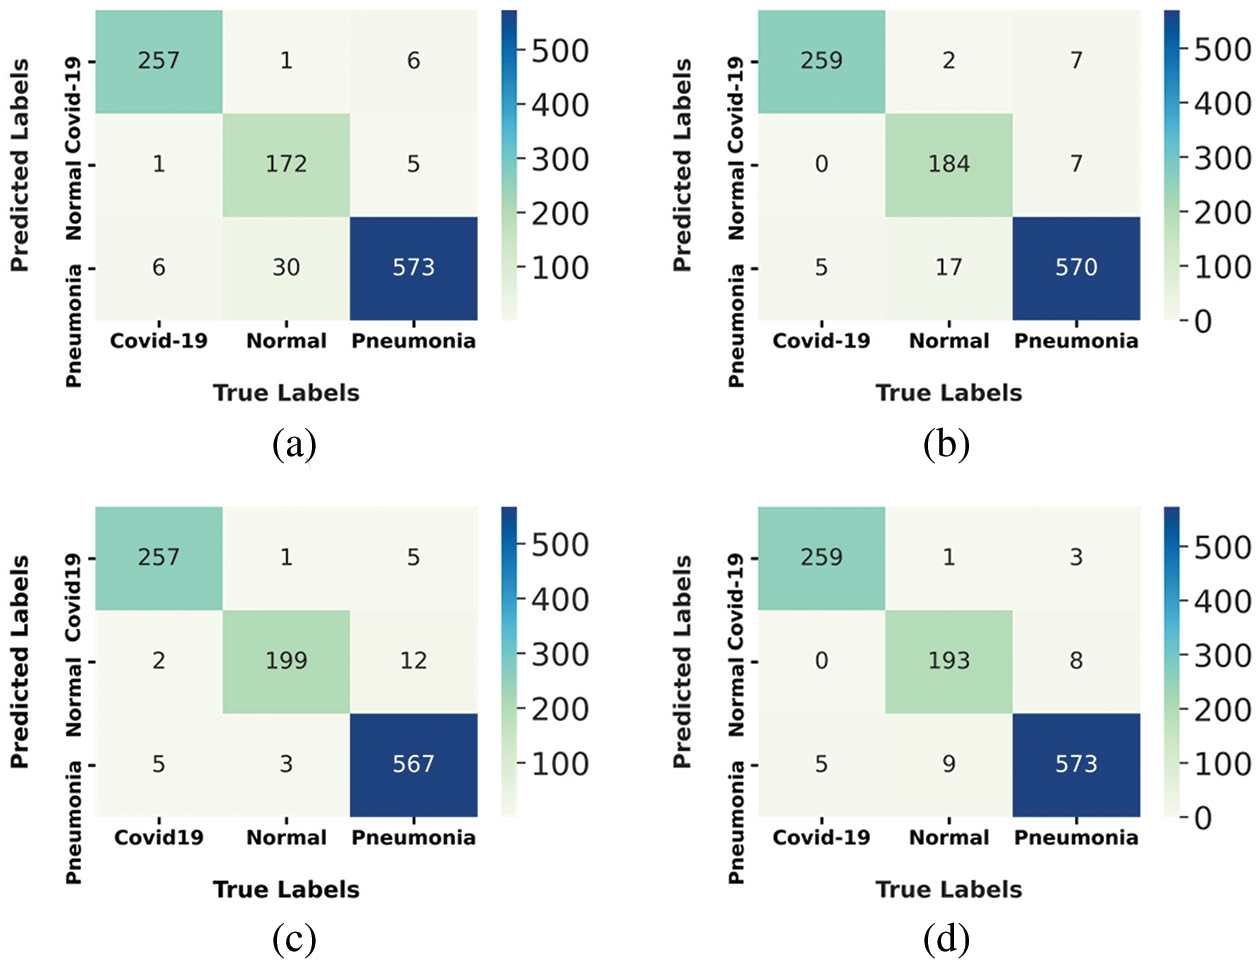
Figure 10: Confusion matrix of tested models: (a) Mobile-Net, (b) Res-Net, (c) VGG16 and (d) for COV2Net
The maximum number of correctly predicted COVID-19 cases is 259 over 264, made by models Res-Net and Cov2Net; this constitutes 98.10% of the ground truth. This resultalso shows that VGG-16 and Mobile-Net models, with 97.3% of accurately predicted COVID-19 patients, are less efficient at predicting COVID-19 cases compared to Res-Net and COV2Net.
The proposed model accurately predicted 193 normal cases out of 203 and 573 out of 604 pneumonia cases. It represents 95% of the normal ground truth cases, but only 64.8% of pneumonia ground truth cases.
The results obtained by training and testing the CNN models are based on the configurations cited in Table 5.
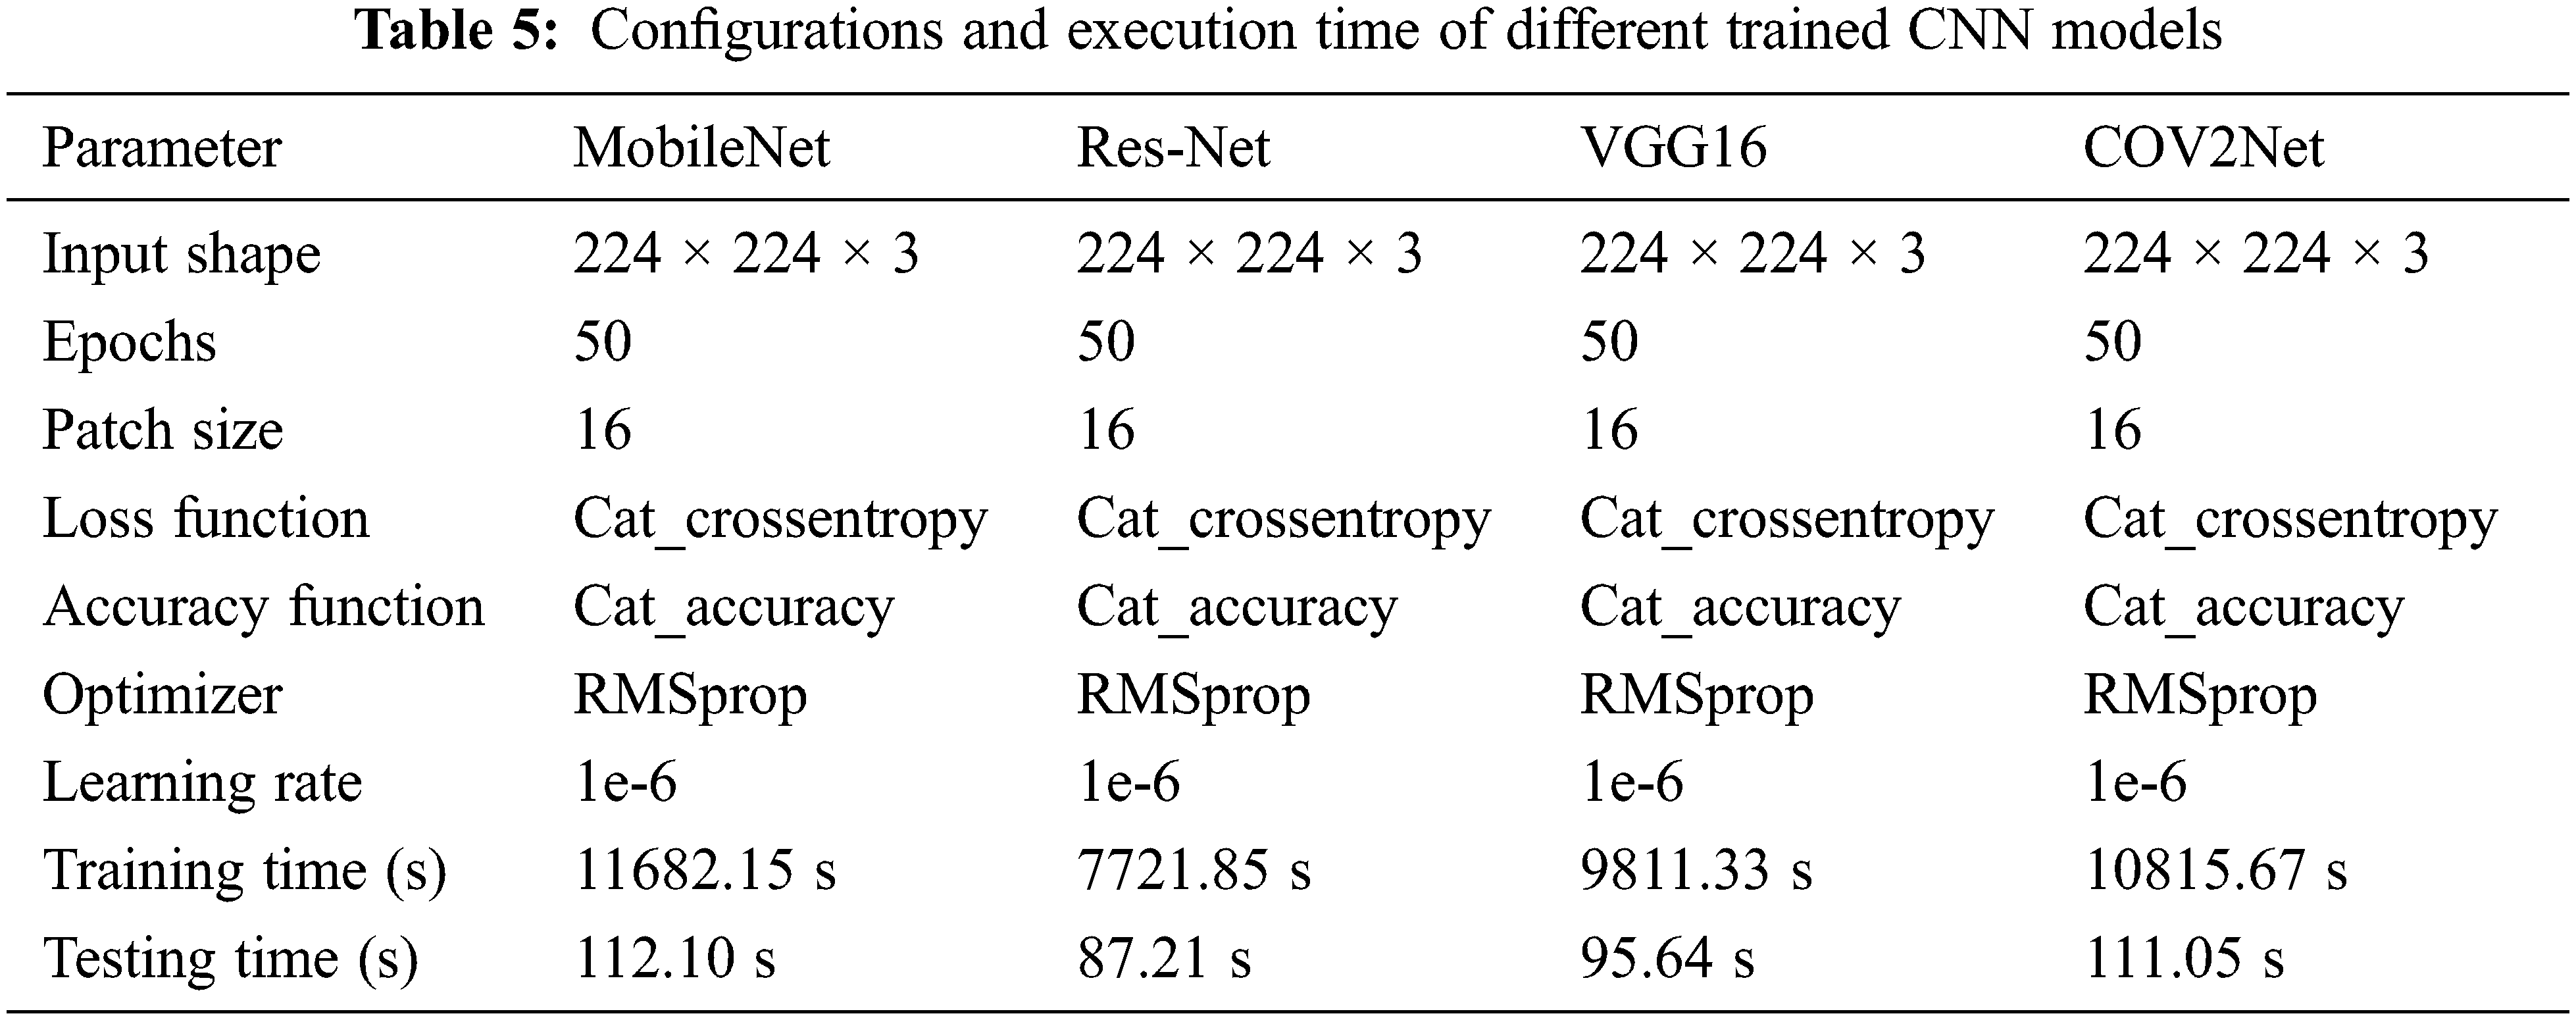
Almost all parameters are the same for configuring the four CNN models, but we observe that the training time and testing time are different for each model. It is due to the architecture of the CNN model. The ResNet-based model is the fastest one. It completed the training of the dataset in 7721.85 s and the testing step in only 87.21 s, while the slowest model is the MobileNet-based CNN model. The accuracy results obtained are independently related to the speed of the training and are highly affected by the designed architecture of the model.
4.4 Visual Explanation of COVID-19 Diagnosis Process Using Grad-Cam and Grad-Cam++
CNN models are some black boxes systems in terms of what happens across their layers. To debug the diagnosis process based on X-ray images, we implemented the Grad-Cam technique [56]. This algorithm allows us to visualize and understand which regions of the image are the most significant for the proposed model in terms of prediction decisions. This method is a great approach for debugging almost any CNN model by processing the gradient of the convolved features for the last convolutional layer. It provides us with a heat-map matrix to visualize how the model is processing our image classification and which regions of the images contribute the foremost to the prediction decision. The system consists of tracking the prediction process in the last convolutional layer of the CNN model. The weighted sum of the feature maps is performed for every prediction process to detect the principal areas of the initial image that affects the model decision. The result is a warmth map that could be associated with the original image for visualization. This method helps us to see whether the model predicts the COVID-19 disease based on the suitable infected regions of the lungs or not.
A better and improved version of the Grad-Cam methodology, defined by Grad-Cam++ [57], is also implemented during this work. This improved version provides us with an enhanced visual explanation of CNN model predictions compared to the simple Grad-Cam technique. It also allows us to evaluate how accurate is the classification task using the Cov2Net CNN model by confirming the important regions in the image obtained using the simple Grad-Cam method.
The Grad-CAM visualization analysis confirms that the COV2Net model predicts more accurately COVID-19 cases based on the correct regions of the lungs by highlighting the responsible regions for the prediction decision. The same regions are confirmed using the Grad-Cam++ visualization technique decisions with a small extension for the region of interest. In Fig. 11, we present some samples of original, COVID-19 and other pneumonia X-ray cases. These classification test results concern the designed and developed Cov2Net model debugged using Grad-Cam and Grad-Cam++ techniques.
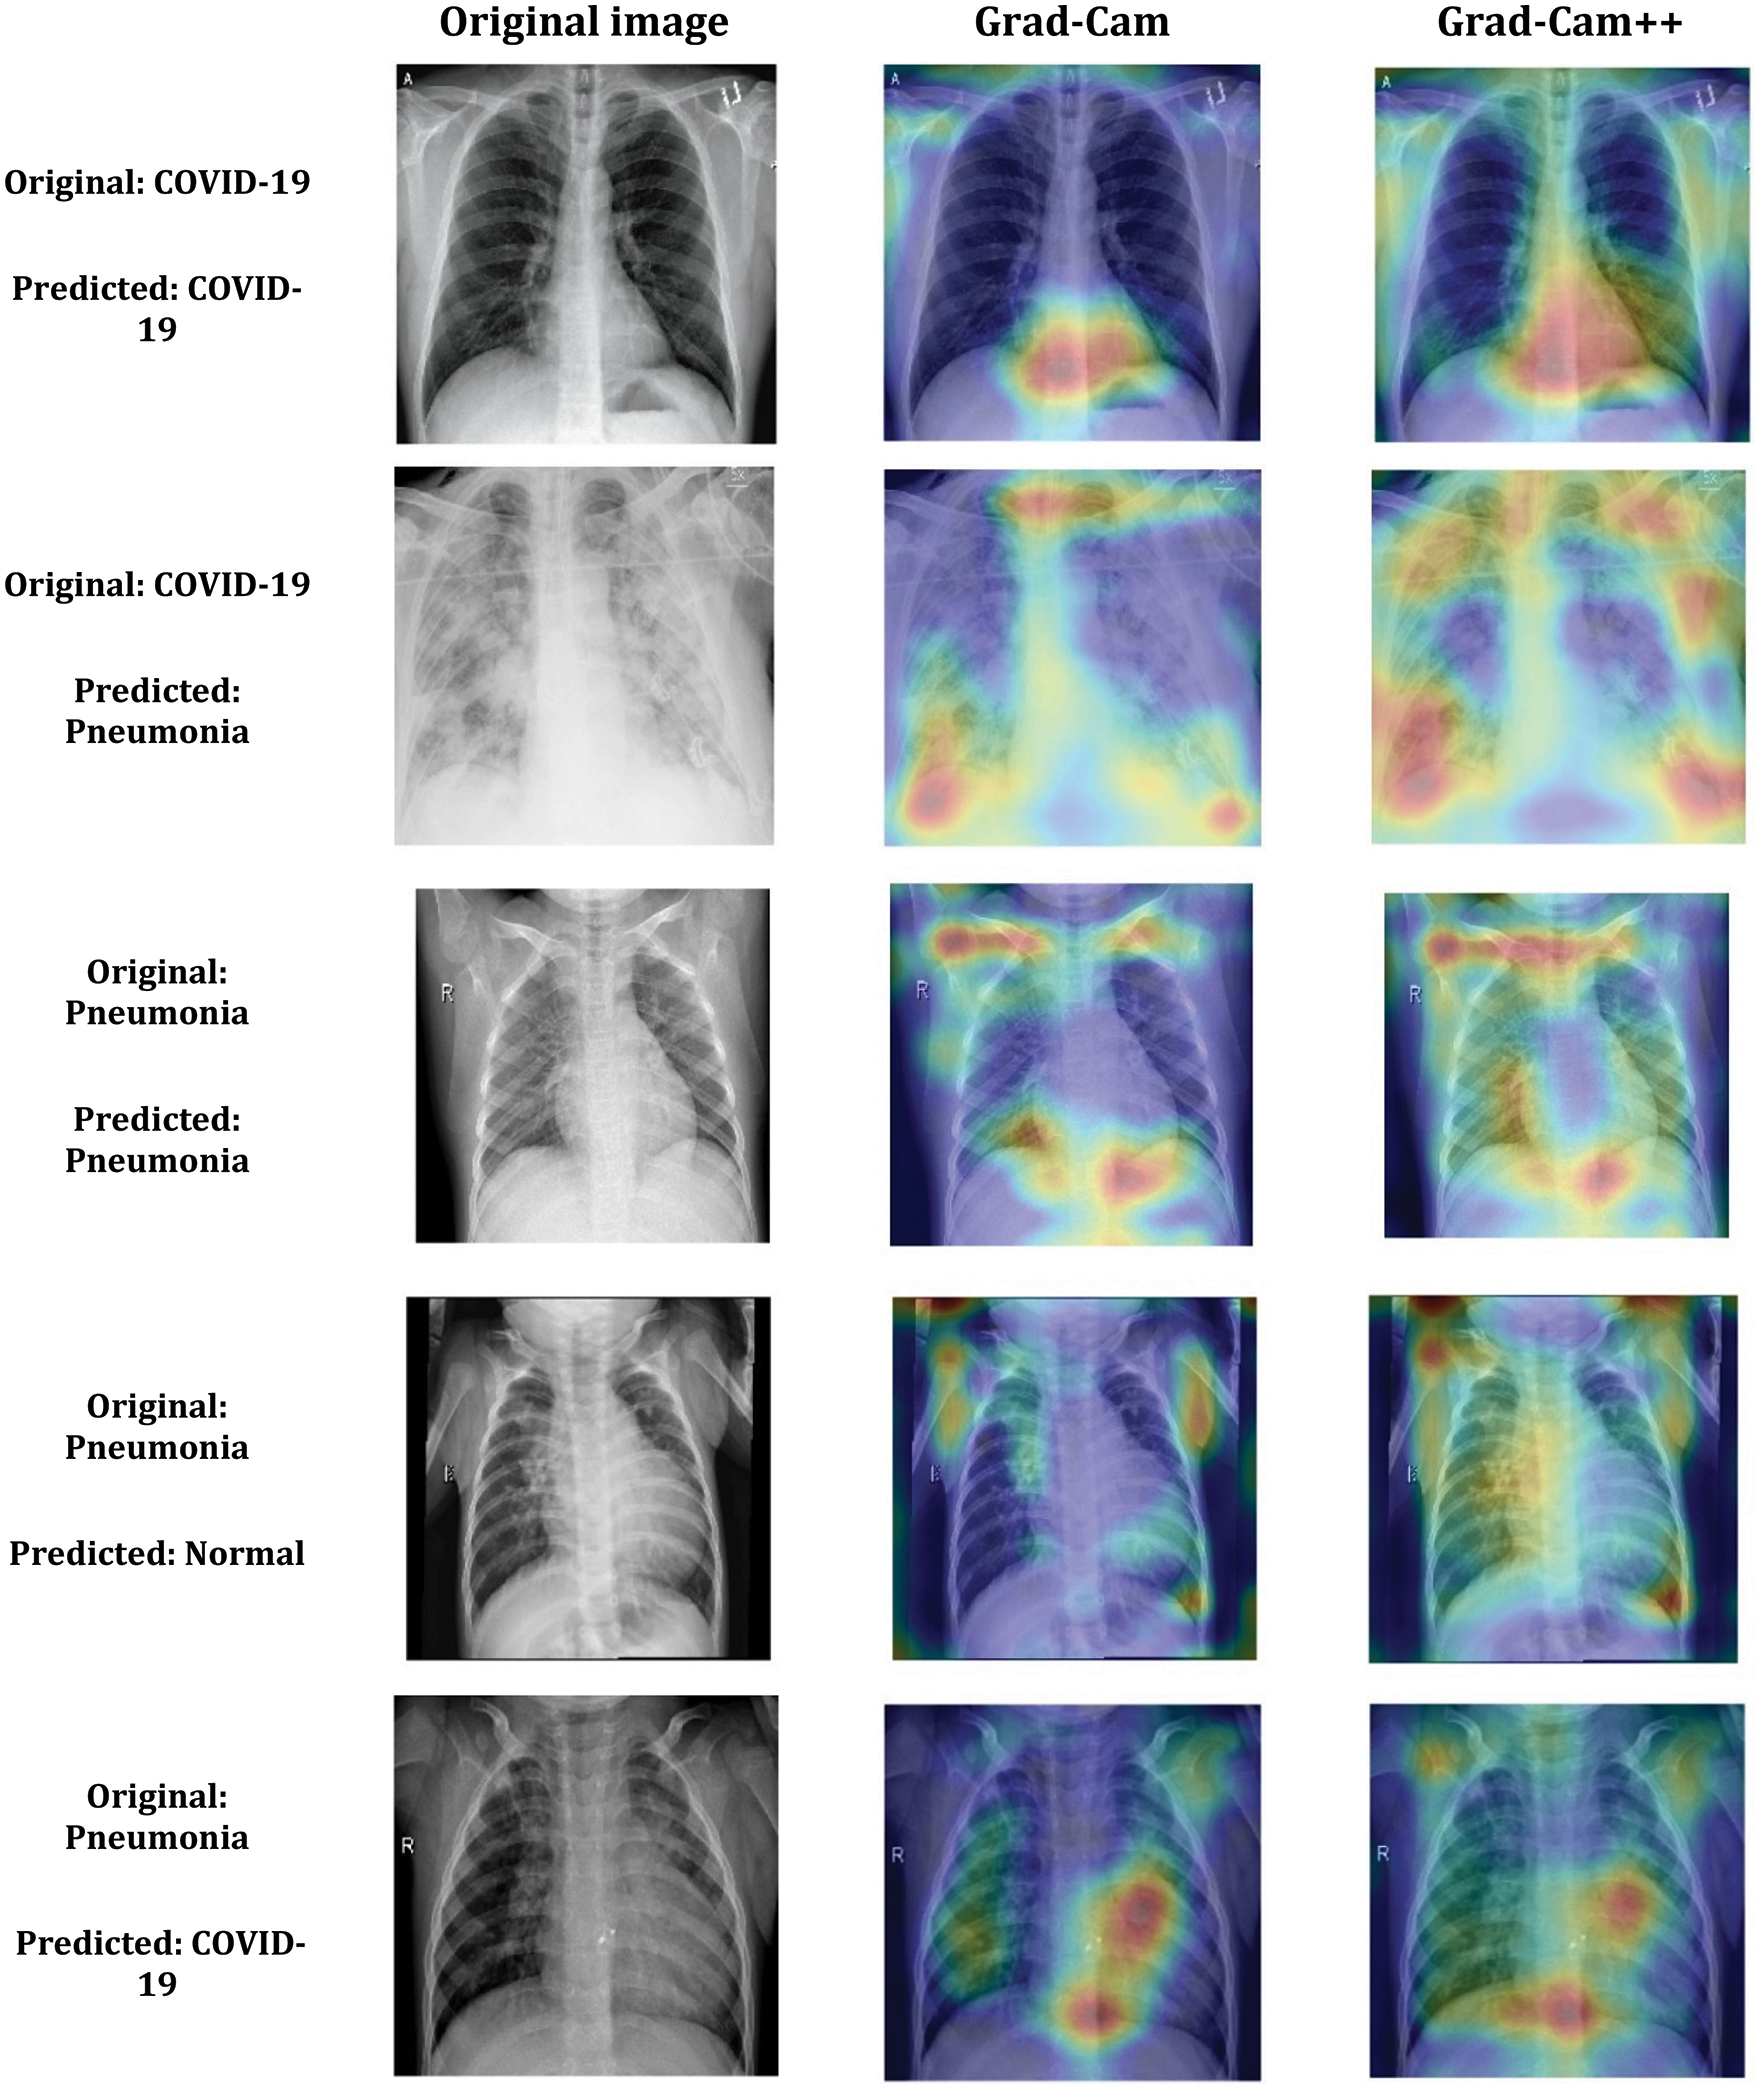
Figure 11: Samples of COV2Net visual explanation using Grad-Cam and Grad-Cam++ technique for COVID-19 and Pneumonia predicted classes
In this paper, we proposed a CNN architecture that was trained and tested on a constructed dataset. The assembled dataset contains 1349 normal X-ray images, 3895 pneumonia and 1764 COVID-19 cases. This dataset was filtered and processed to feed our network. In addition to the training of the proposed network, we also retrained three other pre-trained CNN networks from the literature for comparison and evaluation purposes. The results we obtained are very interesting in terms of accuracy and loss. The proposed model shows the results of 97.52% accuracy and 0.09 loss, while the second-ranked model is VGG16, with 97.33% accuracy and 0.26 loss. Even with these promising results, the automatic diagnosis of COVID-19 still cannot yet be adopted for patients, as a higher level of accuracy needs to be reached. To improve the current results, future work concerns collecting the maximum number of valid datasets and improving the proposed CNN network architecture. Deep learning provides a convenient tool for fast screening of COVID-19 and identifying potential high-risk patients, which may be helpful for medical resource optimization and early prevention before patients show severe symptoms. Future perspectives include additional COVID-19 clinical parameters into the training process, such as interrogatory results and medical measures, collecting more valid X-ray images and updating the core of the proposed architecture. This would significantly increase the accuracy and enable the methodology to converge further, so that it can be adopted by doctors in hospital infrastructures. Another methodology based on a combination of convolutional Modules and single-shot detector (SSD) architecture [58] could be implemented and improved. The ultimate goal of these automatic methods is to win the war against the virus. After all, it’s a matter of speed in the diagnosis process.
Acknowledgement: The authors extend their appreciation to the Deanship of Scientific Research at King Khalid University for funding this work through Large Groups. (Project under grant number (RGP.2/111/43)).
Funding Statement: This research is funded by the Deanship of Scientific Research at King Khalid University through Large Groups. (Project under grant number (RGP.2/111/43)).
Conflicts of Interest: The authors declare that they have no conflicts of interest to report regarding the present study.
References
1. B. Hu, H. Guo, P. Zhou and Z. -L. Shi, “Characteristics of SARS-CoV-2 and COVID-19,” Nature Reviews Microbiology, vol. 19, no. 3, pp. 141–154, 2021. [Google Scholar]
2. M. A. Shereen, S. Khan, A. Kazmi, N. Bashir and R. Siddique, “COVID-19 infection: Emergence, transmission, and characteristics of human coronaviruses,” Journal of Advanced Research, vol. 24, no. 1, pp. 91–98, 2020. [Google Scholar]
3. E. Dong, H. Du and L. Gardner, “An interactive web-based dashboard to track COVID-19 in real time,” The Lancet Infectious Diseases, vol. 20, no. 5, pp. 533–534, 2020. [Google Scholar]
4. I. Koivula, M. Sten and P. H. Makela, “Risk factors for pneumonia in the elderly,” The American Journal of Medicine, vol. 96, no. 4, pp. 313–320, 1994. [Google Scholar]
5. D. Zhao, F. Yao, L. Wang, L. Zheng, Y. Gao et al., “A comparative study on the clinical features of coronavirus 2019 (COVID-19) pneumonia with other pneumonias,” Clinical Infectious Diseases, vol. 71, no. 15, pp. 756–761, 2020. [Google Scholar]
6. N. G. Kurt, “COVID-19 and other viral pneumonias,” Dicle Tıp Dergisi, vol. 48, no. 1, pp. 40–46, 2021. [Google Scholar]
7. A. M. Howseman and R. W. Bowtel, “Functional magnetic resonance imaging: Imaging techniques and contrast mechanisms,” Philosophical Transactions of the Royal Society of London, vol. 354, no. 1387, pp. 1179–1194, 1999. [Google Scholar]
8. H. Villarraga-Gómez, E. L. Herazo and S. T. Smith, “X-ray computed tomography: From medical imaging to dimensional metrology,” Precision Engineering, vol. 60, no. 1, pp. 544–569, 2019. [Google Scholar]
9. S. Bahassine, A. Madani, M. Al-Sarem and M. Kissi, “Feature selection using an improved Chi-square for Arabic text classification,” Journal of King Saud University-Computer and Information Sciences, vol. 32, no. 2, pp. 225–231, 2020. [Google Scholar]
10. A. Narin, C. Kaya and Z. Pamuk, “Automatic detection of coronavirus disease (COVID-19) using X-ray images and deep convolutional neural networks,” Pattern Analysis and Applications, vol. 24, no. 3, pp. 1207–1220, 2021. [Google Scholar]
11. X. Qi, L. G. Brown, D. J. Foran, J. Nosher and I. Hacihaliloglu, “Chest X-ray image phase features for improved diagnosis of COVID-19 using convolutional neural network,” International Journal for Computer Assisted Radiology and Surgery, vol. 16, no. 2, pp. 197–206, 2021. [Google Scholar]
12. M. Al-Sarem, F. Saeed, A. Alsaeedi, W. Boulila and T. Al-Hadhrami, “Ensemble methods for instance-based Arabic language authorship attribution,” IEEE Access, vol. 8, no. 1, pp. 17331–17345, 2020. [Google Scholar]
13. C. Feng, M. -Y. Liu, C. -C. Kao and T. -Y. Lee, “Deep active learning for civil infrastructure defect detection and classification,” in Proc. Int. Workshop on Computing in Civil Engineering (IWCCE), Seattle, Washington, USA, pp. 298–306, 2017. [Google Scholar]
14. M. Hadwan, M. Al-Sarem, F. Saeed and M. A. Al-Hagery, “An improved sentiment classification approach for measuring user satisfaction toward governmental services’ mobile apps using machine learning methods with feature engineering and SMOTE technique,” Applied Sciences, vol. 12, no. 11, pp. 5547–5572, 2022. [Google Scholar]
15. B. Cherradi, O. Terrada, A. Ouhmida, S. Hamida, A. Raihani et al., “Computer-aided diagnosis system for early prediction of atherosclerosis using machine learning and k-fold cross-validation,” in 2021 Int. Congress of Advanced Technology and Engineering (ICOTEN’21), Taiz, Yemen, pp. 1–9, 2021. [Google Scholar]
16. O. Daanouni, B. Cherradi and A. Tmiri, “Predicting diabetes diseases using mixed data and supervised machine learning algorithms,” in Proc. 4th Int. Conf. on Smart City Applications (SCA), Casablanca, Morocco, pp. 1–6, 2019. [Google Scholar]
17. O. Terrada, B. Cherradi, S. Hamida, A. Raihani, H. Moujahid et al., “Prediction of patients with heart disease using artificial neural network and adaptive boosting techniques,” in Proc. Int. Conf. on Advanced Communication Technologies and Networking (CommNet), Marrakech, Morocco, pp. 1–6, 2020. [Google Scholar]
18. A. Ouhmida, A. Raihani, B. Cherradi and O. Terrada, “A novel approach for Parkinson’s disease detection based on voice classification and features selection techniques,” Int. Journal of Online and Biomedical Engineering, vol. 17, no. 10, pp. 111–125, 2021. [Google Scholar]
19. A. Ouhmida, O. Terrada, A. Raihani, B. Cherradi and S. Hamida, “Voice-based deep learning medical diagnosis system for Parkinson’s disease prediction,” in Proc. 2021 Int. Congress of Advanced Technology and Engineering (ICOTEN), Taiz, Yemen, pp. 1–5, 2021. [Google Scholar]
20. M. Al-Sarem, F. Saeed, W. Boulila, A. H. Emara, M. Al-Mohaimeed et al., “Feature selection and classification using Catboost method for improving the performance of predicting Parkinson’s disease,” in Proc. 1st Int. Conf. of Advanced Computing and Informatics (ICACIN ’20), Casablanca, Morocco, pp. 189–199, 2021. [Google Scholar]
21. T. M. Buzug, “Computed tomography,” in Handbook of Medical Technology, 11th edvol. 1. Heidelberg, Berlin, Germany: Springer, pp. 311–342, 2011. [Google Scholar]
22. X. Qi, L. G. Brown, D. J. Foran, J. Nosher and I. Hacihaliloglu, “Chest X-ray image phase features for improved diagnosis of COVID-19 using convolutional neural network,” Int. Journal for Computer Assisted Radiology and Surgery, vol. 16, no. 2, pp. 197–206, 2021. [Google Scholar]
23. T. Ozturk, M. Talo, E. A. Yildirim, U. B. Baloglu, O. Yildirim et al., “Automated detection of COVID-19 cases using deep neural networks with X-ray images,” Computers in Biology and Medicine, vol. 121, no. 10, pp. 792–815, 2020. [Google Scholar]
24. A. Narin, C. Kaya and Z. Pamuk, “Automatic detection of coronavirus disease (COVID-19) using X-ray images and deep convolutional neural networks,” Pattern Analysis and Applications, vol. 24, no. 1, pp. 1207–1220, 2021. [Google Scholar]
25. R. Hertel and R. Benlamri, “COV-SNET: A deep learning model for X-ray-based COVID-19 classification,” Informatics in Medicine Unlocked, vol. 24, no. 11, pp. 620–642, 2021. [Google Scholar]
26. W. A. Abbasi, S. A. Abbas, S. Andleeb, G. U. Islam, S. A. Ajaz et al., “COVIDC: An expert system to diagnose COVID-19 and predict its severity using chest CT scans: Application in radiology,” Informatics in Medicine Unlocked, vol. 23, no. 10, pp. 540–567, 2021. [Google Scholar]
27. A. I. Khan, J. L. Shah and M. M. Bhat, “CoroNet: A deep neural network for detection and diagnosis of COVID-19 from chest x-ray images,” Computer Methods and Programs in Biomedicine, vol. 196, no. 1, pp. 5581–5897, 2020. [Google Scholar]
28. K. El Asnaoui and Y. Chawki, “Using X-ray images and deep learning for automated detection of coronavirus disease,” Journal of Biomolecular Structure and Dynamics, vol. 39, no. 10, pp. 3615–3626, 2021. [Google Scholar]
29. T. Mahmud, M. A. Rahman and S. A. Fattah, “CovXNet: A multi-dilation convolutional neural network for automatic COVID-19 and other pneumonia detection from chest X-ray images with transferable multi-receptive feature optimization,” Computers in Biology and Medicine, vol. 122, no. 1, pp. 103869, 2020. [Google Scholar]
30. L. Wang, Z. Q. Lin and A. Wong, “COVID-Net: A tailored deep convolutional neural network design for detection of COVID-19 cases from chest X-ray images,” Scientific Reports, vol. 10, no. 1, pp. 19549, 2020. [Google Scholar]
31. N. K. Chowdhury, Md M. Rahman and M. A. Kabir, “PDCOVIDNet: A parallel-dilated convolutional neural network architecture for detecting COVID-19 from chest X-ray images,” Health Information Science and Systems, vol. 8, no. 1, pp. 27, 2020. [Google Scholar]
32. P. Hamet and J. Tremblay, “Artificial intelligence in medicine,” Metabolism-clinical and Experimental, vol. 69, no. 1, pp. S36–S40, 2017. [Google Scholar]
33. M. S. Mottaqi, F. Mohammadipanah and H. Sajedi, “Contribution of machine learning approaches in response to SARS-CoV-2 infection,” Informatics in Medicine Unlocked, vol. 23, no. 1, pp. 100526, 2021. [Google Scholar]
34. Q. Li, W. Cai, X. Wang, Y. Zhou, D. D. Feng et al., “Medical image classification with convolutional neural network,” in Proc. 13th Int. Conf. on Control Automation Robotics & Vision (ICARCV), Singapore, pp. 844–848, 2014. [Google Scholar]
35. L. C. Jacaruso, “Accuracy improvement for fully convolutional networks via selective augmentation with applications to electrocardiogram data,” Informatics in Medicine Unlocked, vol. 26, no. 4, pp. 100729, 2021. [Google Scholar]
36. H. Lee and H. Kwon, “Going deeper with contextual cnn for hyperspectral image classification,” IEEE Transactions on Image Processing, vol. 26, no. 10, pp. 4843–4855, 2017. [Google Scholar]
37. R. Yamashita, M. Nishio, R. K. G. Do and K. Togashi, “Convolutional neural networks: An overview and application in radiology,” Insights Imaging, vol. 9, no. 4, pp. 611–629, 2018. [Google Scholar]
38. S. Albawi, T. A. Mohammed and S. Al-Zawi, “Understanding of a convolutional neural network,” in Proc. Int. Conf. on Engineering and Technology (ICET), Antalya, Turkey, pp. 1–6, 2017. [Google Scholar]
39. C.-L. Zhang, J.-H. Luo, X.-S. Wei and J. Wu, “In defense of fully connected layers in visual representation transfer,” Advances in Multimedia Information Processing, vol. 10736, no. 1, pp. 807–817, 2018. [Google Scholar]
40. W. Boulila, M. Sellami, M. Driss, M. Al-Sarem, M. Safaei et al., “RS-DCNN: A novel distributed convolutional-neural-networks based-approach for big remote-sensing image classification,” Computers and Electronics in Agriculture, vol. 182, no. 1, pp. 106014, 2021. [Google Scholar]
41. T. N. Sainath, A. Mohamed, B. Kingsbury and B. Ramabhadran, “Deep convolutional neural networks for LVCSR,” in Proc. IEEE Int. Conf. on Acoustics, Speech and Signal Processing (ICASSP), Vancouver, BC, Canada, pp. 8614–8618, 2013. [Google Scholar]
42. H. Wu and X. Gu, “Max-pooling dropout for regularization of convolutional neural networks,” Neural Information Processing, vol. 9489, no. 1, pp. 46–54, 2015. [Google Scholar]
43. H. J. Jie and P. Wanda, “Runpool: A dynamic pooling layer for convolution neural network,” Int. Journal of Computer and Information System, vol. 13, no. 1, pp. 66, 2020. [Google Scholar]
44. H. Wu and X. Gu, “Max-pooling dropout for regularization of convolutional neural networks,” Neural Information Processing, vol. 9489, no. 1, pp. 46–54, 2015. [Google Scholar]
45. S. H. S. Basha, S. R. Dubey, V. Pulabaigari and S. Mukherjee, “Impact of fully connected layers on performance of convolutional neural networks for image classification,” Neurocomputing, vol. 378, no. 1, pp. 112–119, 2020. [Google Scholar]
46. M. Wang, S. Lu, D. Zhu, J. Lin and Z. Wang, “A high-speed and low-complexity architecture for softmax function in deep learning,” in Proc. IEEE Asia Pacific Conf. on Circuits and Systems (APCCAS), Chengdu, China, pp. 223–226, 2018. [Google Scholar]
47. F. Gao, B. Li, L. Chen, Z. Shang, X. Wei et al., “A softmax classifier for high-precision classification of ultrasonic similar signals,” Ultrasonics, vol. 112, no. 1, pp. 106344, 2021. [Google Scholar]
48. H. Lee and H. Kwon, “Contextual deep CNN based hyperspectral classification,” in Proc. IEEE Int. Geoscience and Remote Sensing Symp. (IGARSS), Beijing, China, pp. 3322–3325, 2016. [Google Scholar]
49. A. Rusiecki, “Trimmed categorical cross entropy for deep learning with label noise,” Electronics Letters, vol. 55, no. 6, pp. 319–320, 2019. [Google Scholar]
50. A. R. Saikia, K. Bora, L. B. Mahanta and A. K. Das, “Comparative assessment of CNN architectures for classification of breast FNAC images,” Tissue and Cell, vol. 57, no. 1, pp. 8–14, 2019. [Google Scholar]
51. T. Shanthi and R. S. Sabeenian, “Modified alexnet architecture for classification of diabetic retinopathy images,” Computers & Electrical Engineering, vol. 76, no. 1, pp. 56–64, 2019. [Google Scholar]
52. V. I. A., M. S., D. R and S. Rc, “ResNet-50 vs VGG-19 vs training from scratch: A comparative analysis of the segmentation and classification of pneumonia from chest x-ray images,” in Proc. Computational Science and Its Applications–(ICCSA), Saint Petersburg, Russia, pp. 375–381, 2021. [Google Scholar]
53. R. A. Al-Falluji, Z. D. Katheeth and B. Alathari, “Automatic detection of COVID-19 using chest x-ray images and modified resnet18-based convolution neural networks,” Computers, Materials & Continua, vol. 66, no. 2, pp. 1301–1313, 2021. [Google Scholar]
54. A. Polsky, B. W. Mel and J. Schiller, “Computational subunits in thin dendrites of pyramidal cells,” Nature Neuroscience, vol. 7, no. 6, pp. 621–627, 2004. [Google Scholar]
55. M. Toğaçar, Z. Cömert and B. Ergen, “Intelligent skin cancer detection applying autoencoder, MobileNetV2 and spiking neural networks,” Chaos, Solitons & Fractals, vol. 144, no. 119, pp. 11–17, 2021. [Google Scholar]
56. R. R. Selvaraju, M. Cogswell, A. Das, R. Vedantam, D. Parikh et al., “Grad-CAM: Visual explanations from deep networks via gradient-based localization,” International Journal of Computer Vision, vol. 128, no. 2, pp. 336–359, 2020. [Google Scholar]
57. A. Chattopadhay, A. Sarkar, P. Howlader and V. N. Balasubramanian, “Grad-CAM++: Generalized gradient-based visual explanations for deep convolutional networks,” in Proc. IEEE Winter Conf. on Applications of Computer Vision (WACV), Lake Tahoe, NV, USA, pp. 839–847, 2018. [Google Scholar]
58. S. Mahajan, A. Raina, M. Abouhawwash, X. Gao and A. K. Pandit, “Covid-19 detection from chest x-ray images using advanced deep learning techniques,” Computers, Materials & Continua, vol. 70, no. 1, pp. 1541–1556, 2022. [Google Scholar]
Cite This Article
 Copyright © 2023 The Author(s). Published by Tech Science Press.
This work is licensed under a Creative Commons Attribution 4.0 International License , which permits unrestricted use, distribution, and reproduction in any medium, provided the original work is properly cited.
 Downloads
 Citation Tools