
 Submit a Paper
 Propose a Special lssue
 Open Access
ARTICLE

Structural Interval Reliability Algorithm Based on Bernstein Polynomials and Evidence Theory
1 College of Software Engineering, Xiamen University of Technology, Xiamen, Fujian, 361005, China
2 School of Aerospace Engineering, Xiamen University, Xiamen, Fujian, 361005, China
3 School of Naval Architecture, Ocean & Civil Engineering, Shanghai Jiao Tong University, Shanghai, 200240, China
4 College of Software Engineering, Xiamen University of Technology, Xiamen, Fujian, 361005, China
* Corresponding Author: Juxi Hu. Email:
Computer Systems Science and Engineering 2023, 46(2), 1947-1960. https://doi.org/10.32604/csse.2023.035118
Received 08 August 2022; Accepted 08 December 2022; Issue published 09 February 2023
 View Full Text
 Download PDF
Abstract
Structural reliability is an important method to measure the safety performance of structures under the influence of uncertain factors. Traditional structural reliability analysis methods often convert the limit state function to the polynomial form to measure whether the structure is invalid. The uncertain parameters mainly exist in the form of intervals. This method requires a lot of calculation and is often difficult to achieve efficiently. In order to solve this problem, this paper proposes an interval variable multivariate polynomial algorithm based on Bernstein polynomials and evidence theory to solve the structural reliability problem with cognitive uncertainty. Based on the non-probabilistic reliability index method, the extreme value of the limit state function is obtained using the properties of Bernstein polynomials, thus avoiding the need for a lot of sampling to solve the reliability analysis problem. The method is applied to numerical examples and engineering applications such as experiments, and the results show that the method has higher computational efficiency and accuracy than the traditional linear approximation method, especially for some reliability problems with higher nonlinearity. Moreover, this method can effectively improve the reliability of results and reduce the cost of calculation in practical engineering problems.Keywords
Structural reliability is an essential tool to measure the safety performance of structures under the influence of uncertain factors. It is necessary to judge whether the reliability of traditional limit state calculation is reliable and the calculation cost is very high. In the existing methods, the deterministic mathematical model with safety coefficients is often adopted to complete the structural design. A complex deterministic model like the fractal fractional model [1] can be built by computer modeling, but it cannot accurately describe the uncertainty in engineering problems. Stochastic extension of the deterministic model [2] can address the above issue; however, various assumptions are imposed to simplify the calculation, which limits this method. To solve this problem, the method of fitting the probability density function of uncertain variables is often adopted. However, this method requires a lot of sampling, and the calculation cost sometimes exceeds that of the original method. Evidence theory [3] uses an interval composed of a pair of upper and lower probability values to describe the reliability of the problem and the uncertainty of the proposition. This interval contains the real probability value calculated by the traditional probability method. Thus, the problem of solving reliability is transformed into the problem of solving an interval value range [4]. Although it may cause conflicts in the evidence combination rule, some appropriate methods can avoid this problem [5]. Evidence theory uses probability bounds to reflect confidence in the collective power set of all possible outcomes. Evidence theory can deal with uncertain problems well in line with people’s habits of thinking, which can reasonably describe and deal with all kinds of incomplete information, uncertain information, unreliable information, and even conflicting information, so it is applied to various fields [6,7]. Therefore, the motivation of this research is to find an effective, low-cost method for structural interval reliability.
In this paper, a method to solve the reliability probability interval by using Bernstein polynomials is proposed. The value range of limit state function is obtained by Bernstein polynomial approximation, and then the reliability interval of the problem is obtained based on evidence theory [8]. This method has higher efficiency and accuracy for implicit limit states and complex explicit expressions [9,10].
The rest of the paper is organized as follows: Section 2 briefly reviews some specific measures and open issues in the literature. Section 3 elaborates on our proposed method. Section 4 presents the experiments, and Section 5 describes the results and discussion. Section 6 concludes the paper.
2 Review of Typical Uncertainty Measures
In this section, we first introduce some basic concepts of evidence theory and then summarize its application model in structural reliability analysis. In addition, the current research status with the structural reliability analysis is illustrated by pieces of literature.
2.1 Basic Principles of Evidence Theory
Evidence theory was first proposed and developed by Dempster and Shafer, which is also called Dempster–Shafer theory. The Frame of Discernment (FD) is the most fundamental concept in evidence theory [11] which is the set of all possible results that can be recognized for a particular decision problem. The FD is similar to the sample of random variables in probability theory, which consists of a finite number of essential elements. As an essential concept of evidence theory, the Basic Probability Assignment (BPA) is used to describe the credibility of propositions. Θ is regarded as the FD if the set function (
Then m is called the BPA on the FD of Θ. For all
The two measures, one upper bound and the other lower bound, form an upper and lower probability interval to describe the uncertainty of proposition A [15,16].
2.2 Structural Reliability Analysis Based on Evidence Theory
Evidence theory uses an interval composed of a pair of upper and lower probability values to describe the reliability of the problem. This interval contains the true probability value P calculated by the traditional probability method. With the increased uncertain variable information, the upper probability
For a two-dimensional limit state equation
where
Based on the combination of BPA and reliability domain G, the reliability measures
The term
If both
In recent years, reliability research based on evidence theory has become a hot spot in the reliability research of high-tech equipment. The combination method proposed by Yang et al. [18] and Jiang et al. [19] considers multiple dimensions when fusing conflict evidence. However, there is still a problem that the consideration is not comprehensive or the probability subtraction method is used to measure the consistency of evidence at the decision-making level. In response to this problem, many experts and scholars have improved the evidence combination rules by modifying the evidence combination rules [20] and the actual evidence [21,22], respectively. However, the method of modifying the evidence combination rules fails to preserve the exchange laws and association law of the classical Dempster combination rules, which is not convenient for complex combination operations. Most of the previous methods to modify the actual evidence only consider the consistency of evidence at the reliability level. In contrast, the reliability evaluation depends on the probability distribution of indicators, so there is a lack of consistent measurement of evidence at the decision-making level. In literature [23], the conflict degree of evidence at the decision-making level is measured by the sum of the absolute values of the difference between the evidence and the Pignistic probability values of the same focal element, to define the correction weight of each evidence. However, the results of the consistency measurement between evidence by this method are often affected by the probability interval segmentation and are not accurate enough.
In this method, the value range of the limit state function is obtained by Bernstein polynomial approximation, and then the reliability interval of the problem is obtained based on evidence theory. As seen from the above section, the key to reliability analysis of evidence theory is to solve the extreme value of the limit state function on each focal element [24]. There are two forms of limit state function for structural reliability analysis under cognitive uncertainty, namely, explicit limit state function and implicit limit state function. The explicit limit state function is divided into polynomial expressions and complex expressions. For complex expressions and implicit expressions, the response surface method is first used to establish the polynomial response surface approximation.
3.1 Response Surface Methodology
In this paper, the quadratic response surface method without cross terms is adopted. It approximates the actual limit state function
where
3.2 Bernstein Polynomials for Extreme Values
After obtaining the approximate limit state function, the reliability analysis is transformed into the solution of the range of polynomials. Traditional optimization methods are complex in solving multi-dimensional and high-order problems, and there are optimal local problems. In this paper, a method based on Bernstein polynomials is proposed to obtain the value range of the limit state function. By using the properties of Bernstein polynomials [25], it is possible to solve Bernstein coefficients instead of finding the range directly.
Bernstein polynomials have the following properties for a given multivariate polynomial:
where
and
Among
is called the ith Bernstein term, and
is called the term’s Bernstein coefficient, where
Expanding the approximate polynomial of the limit state function into a Bernstein polynomial, the value range of the limit state function is obtained from the properties of the Bernstein polynomial coefficients:
Based on the above contents, the specific algorithm for interval reliability analysis based on Bernstein polynomials and evidence theory can be obtained, as shown in Fig. 1.
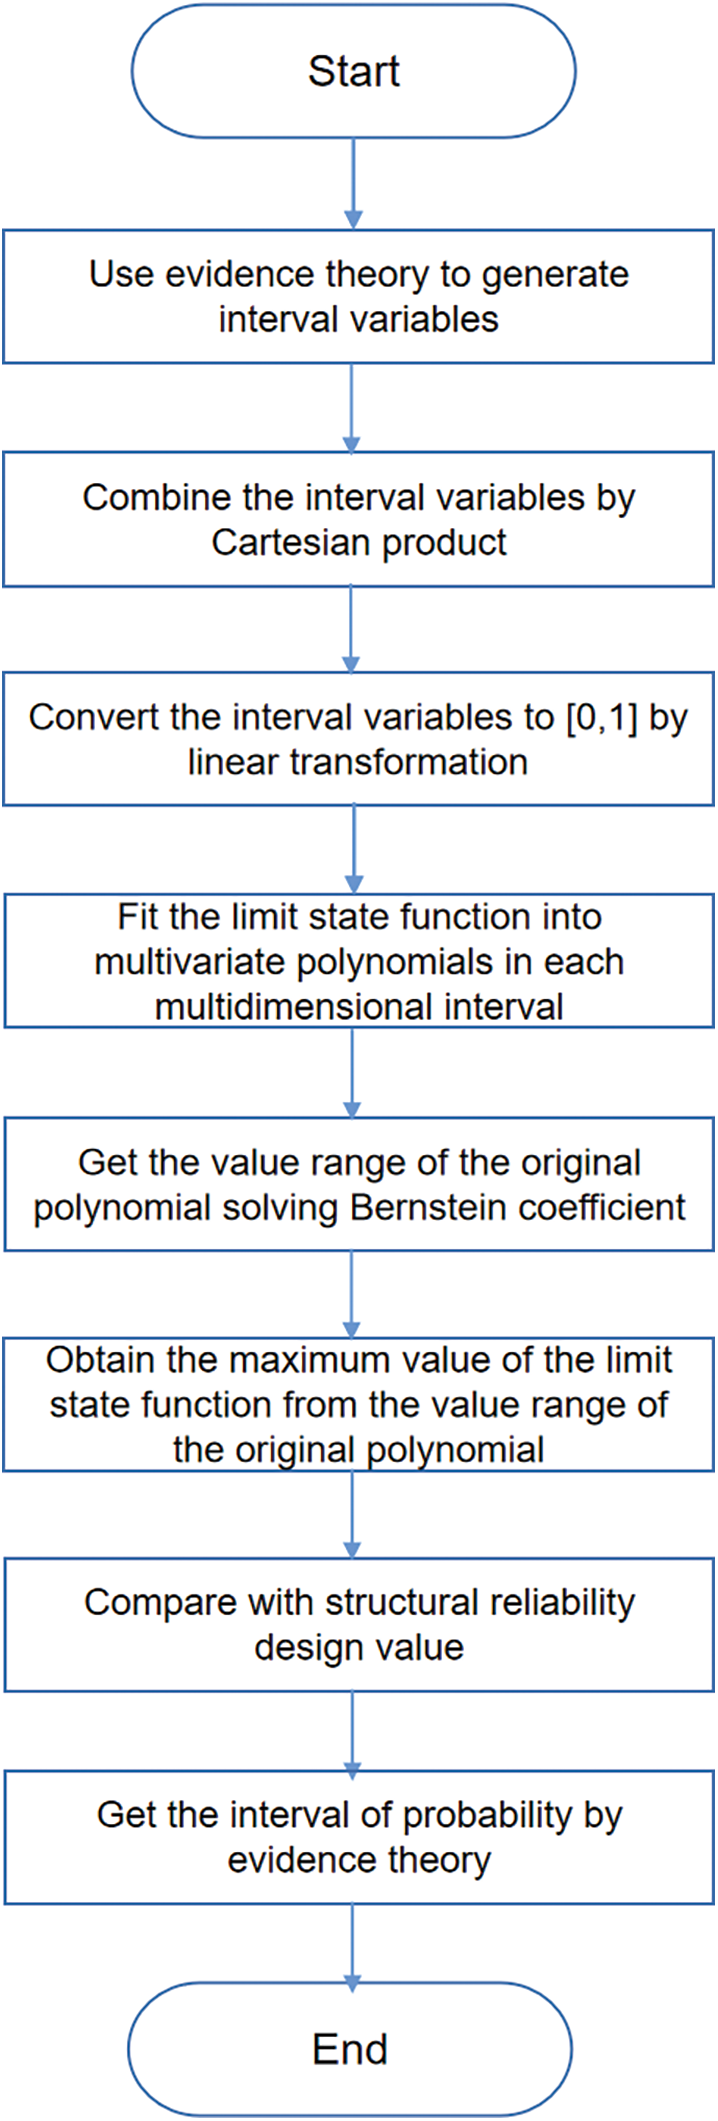
Figure 1: Algorithm flow chart
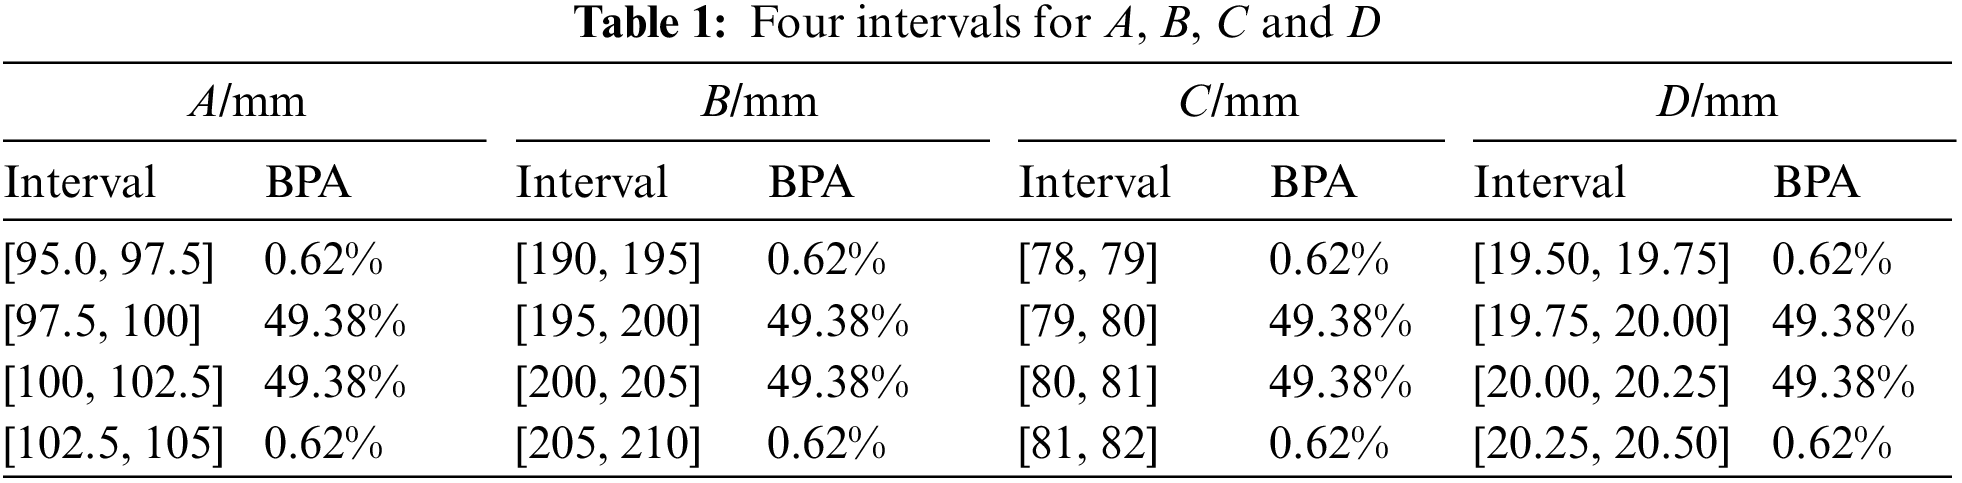
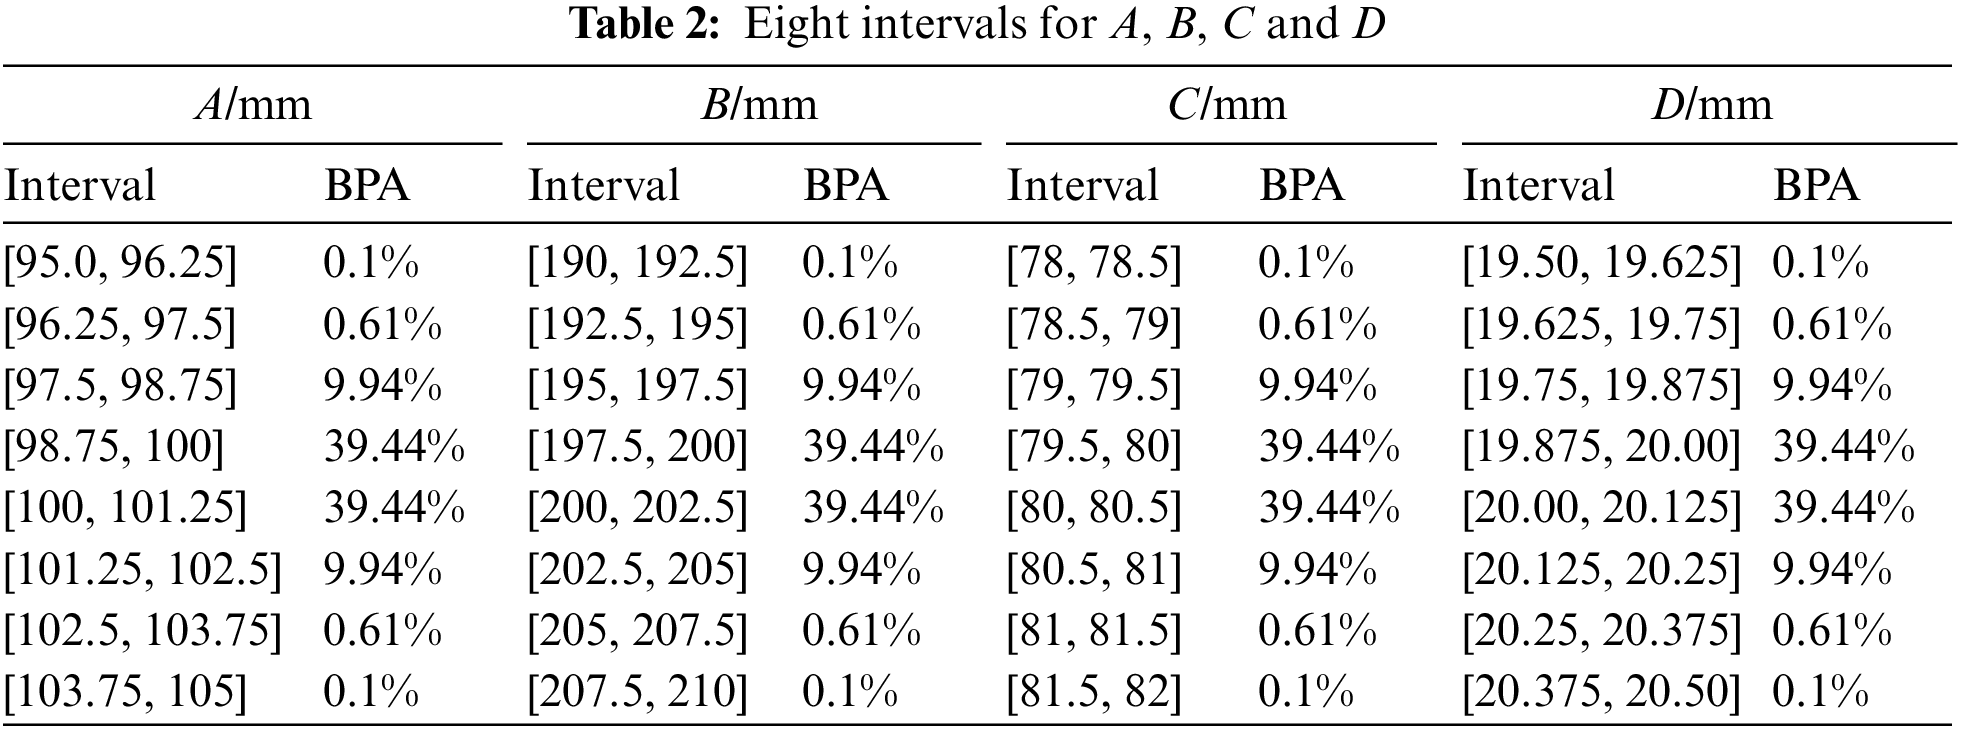
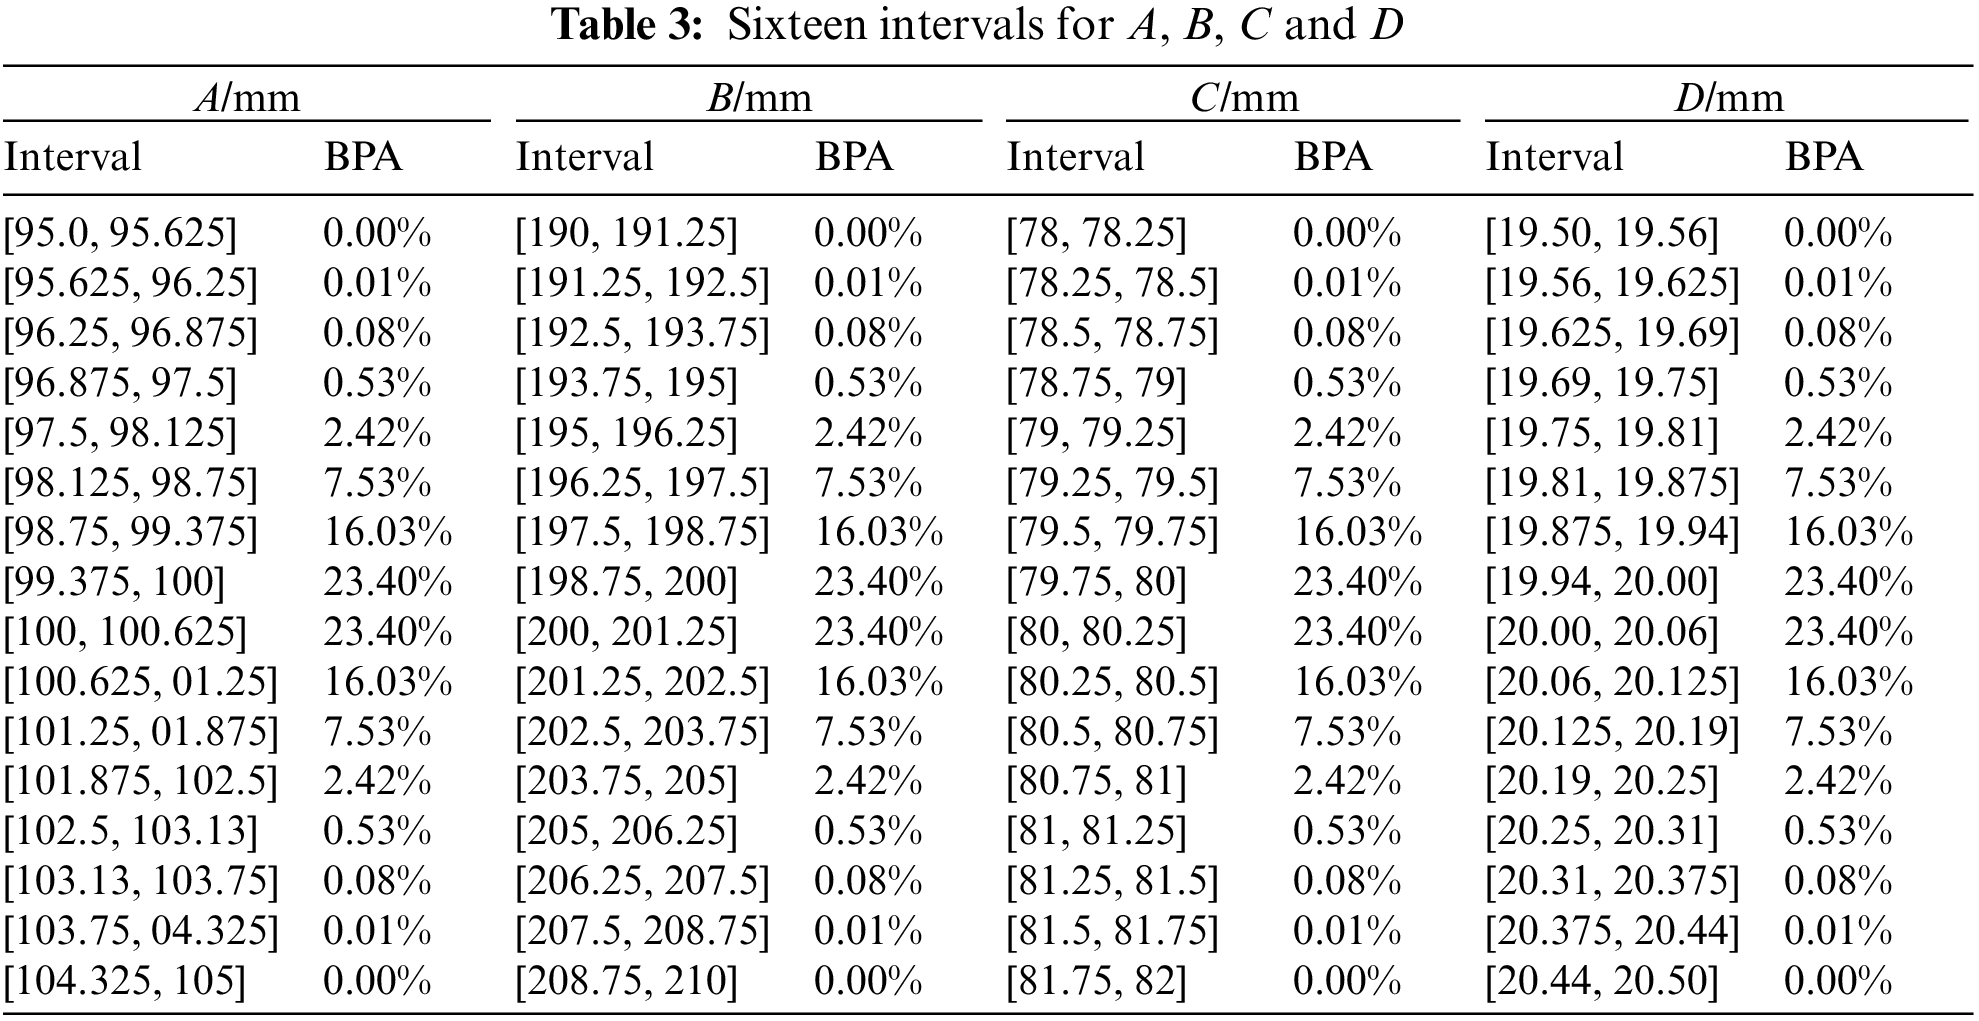
For the composite beam shown in Fig. 2, the elastic modulus of the beam is E, the length, width, and height are L (mm), A (mm) and B (mm) respectively, and the elastic modulus of the aluminum plate on the lower surface of the beam is
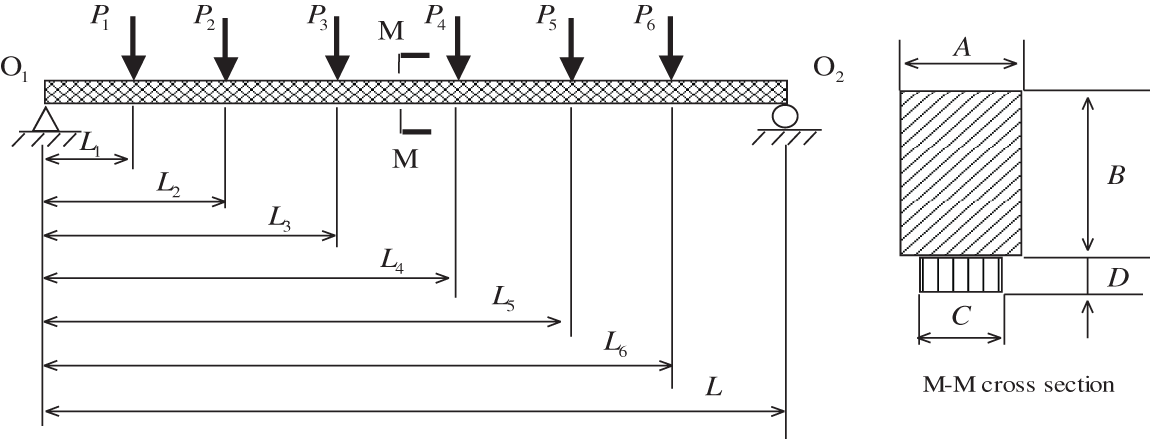
Figure 2: Composite beam diagram
Among them, S is the allowable stress, and
The stress
where
The values of the 15 fixed parameters in the model are:
Taking the allowable stress
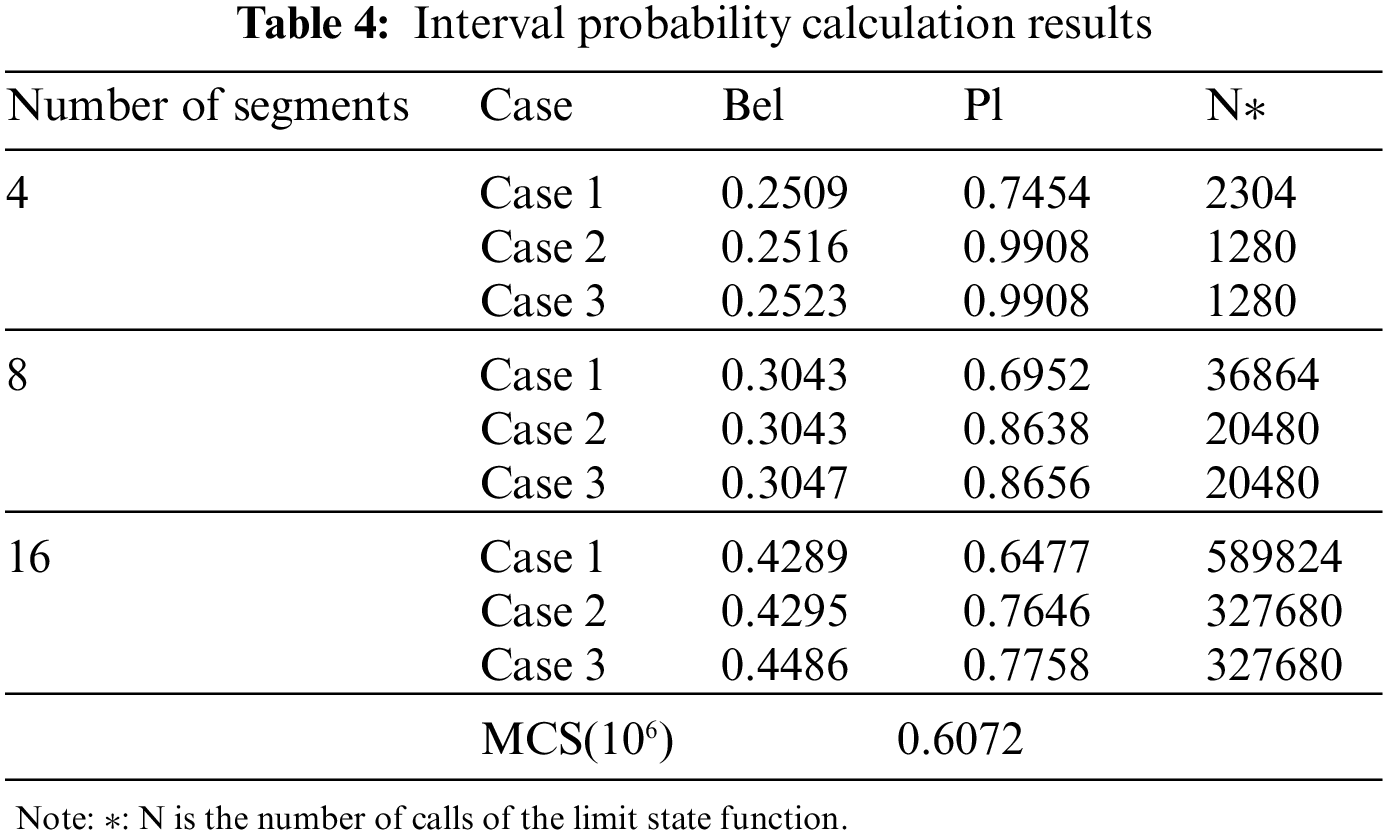
Fig. 3 shows the ten-bar structure. All horizontal and vertical bars are of length L, and
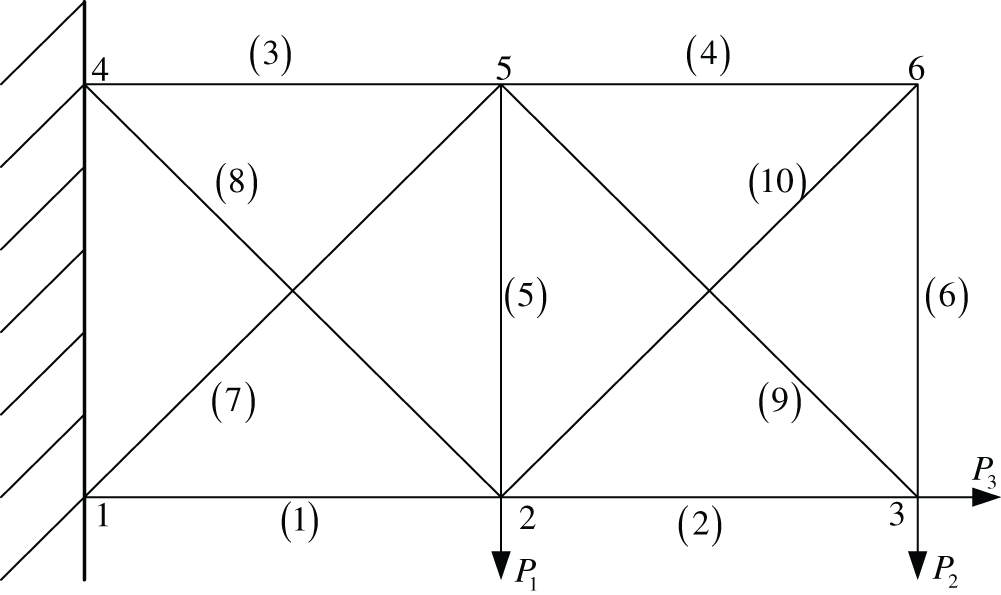
Figure 3: Schematic diagram of a ten-bar structure
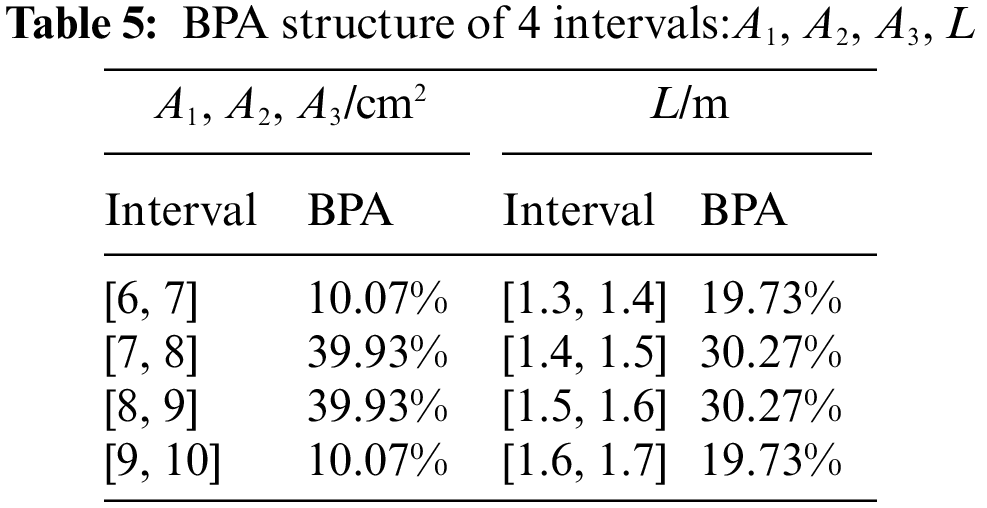
Of these, the cross-sectional areas are
To display the comparison results more clearly and accurately, the curves of Bel and Pl with the allowable stress S obtained by the two methods are given in this paper and compared with the actual probability curve obtained by the Monte Carlo method (the number of samples is 106). Figs. 4–6 show the results obtained by dividing the variables into four segments, eight segments and sixteen segments, respectively. As can be seen from the figure, in the whole process of S change, the Bel curve and Pl curve obtained by the two methods always include the actual probability P curve. With the increase of variable segmentation, i.e., the increase of information, the Bel curve and Pl curve gradually approach the actual probability curve. The Bel and Pl curves obtained by the Bernstein method are closer to the actual probability curve than those obtained by the linear method.
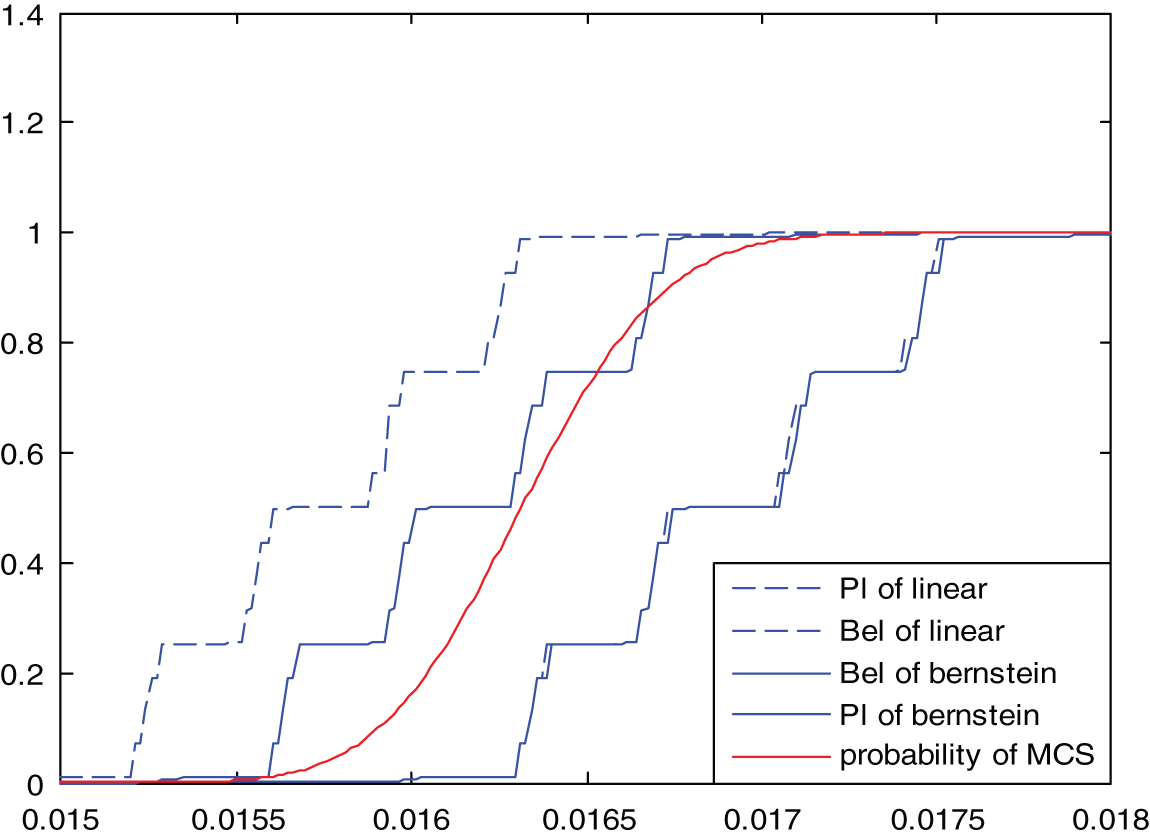
Figure 4: 4-interval cumulative distribution results
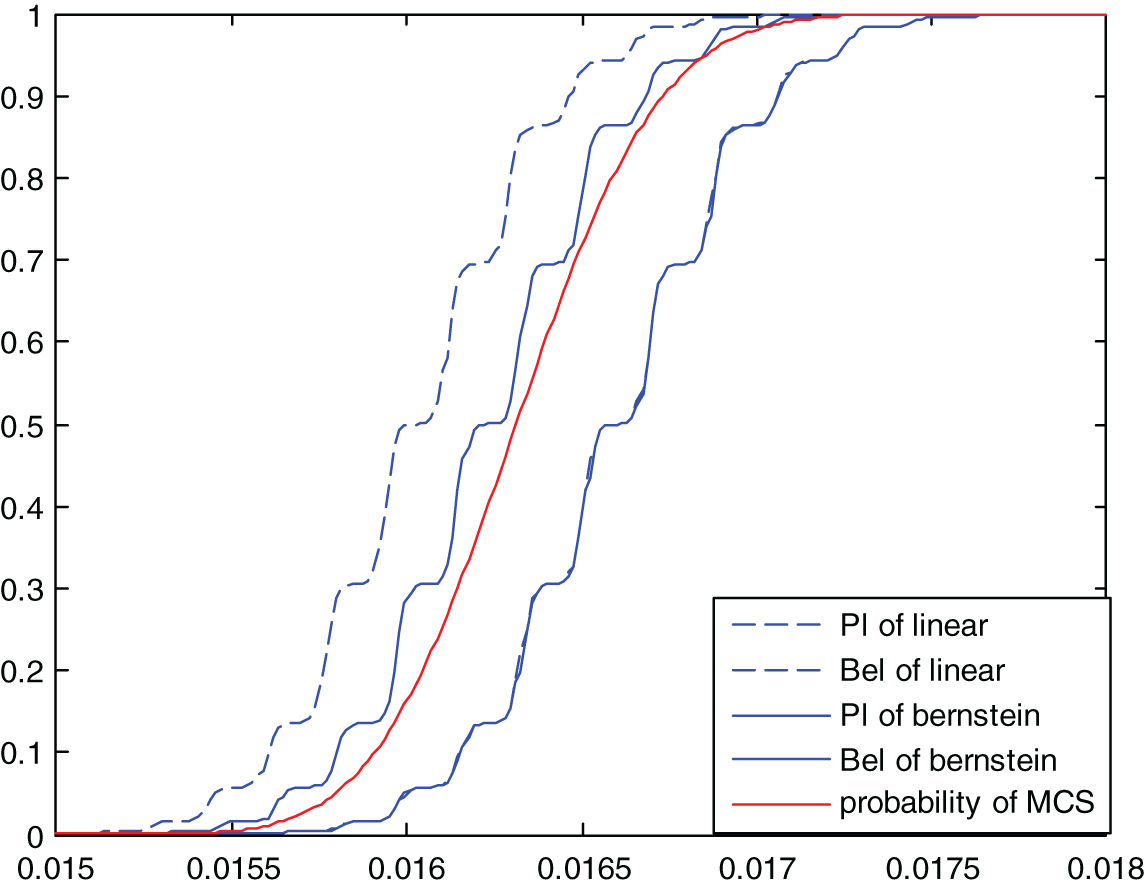
Figure 5: 8-interval cumulative distribution results
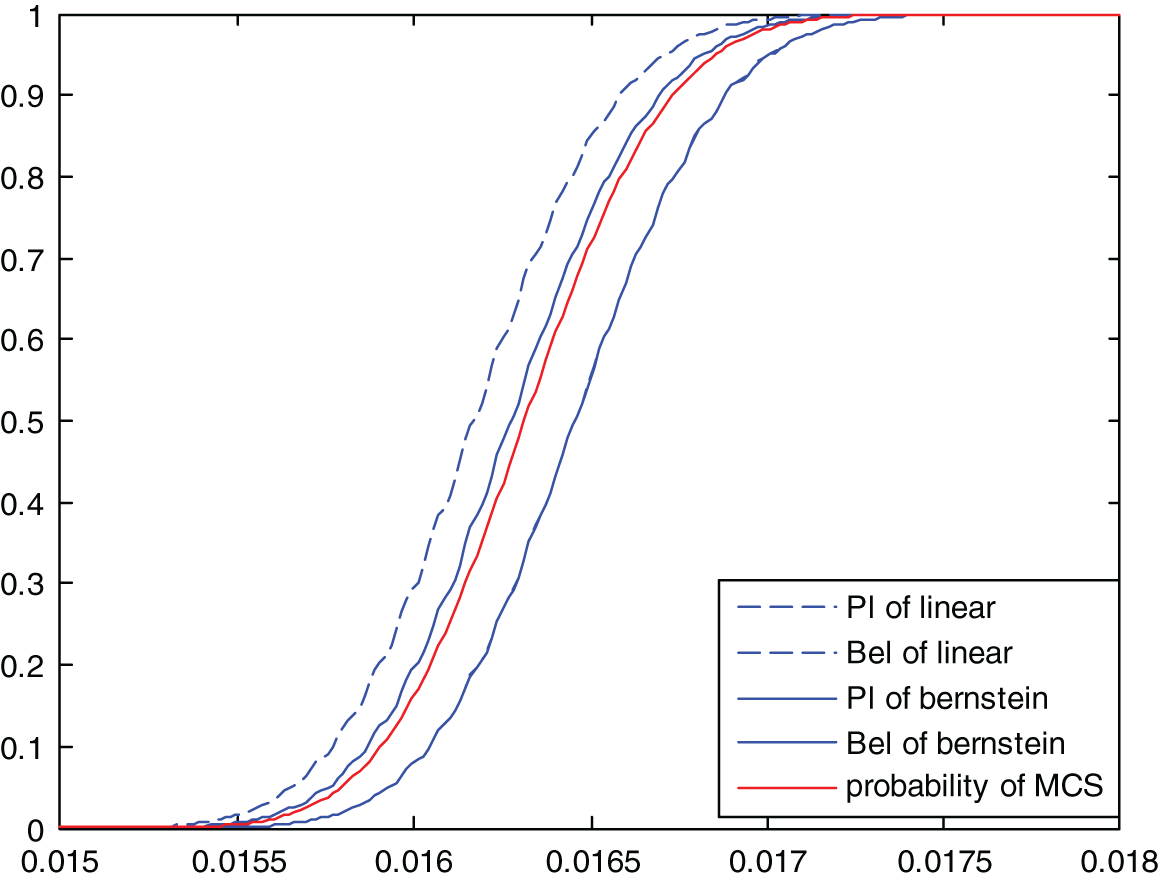
Figure 6: 16-interval cumulative distribution results
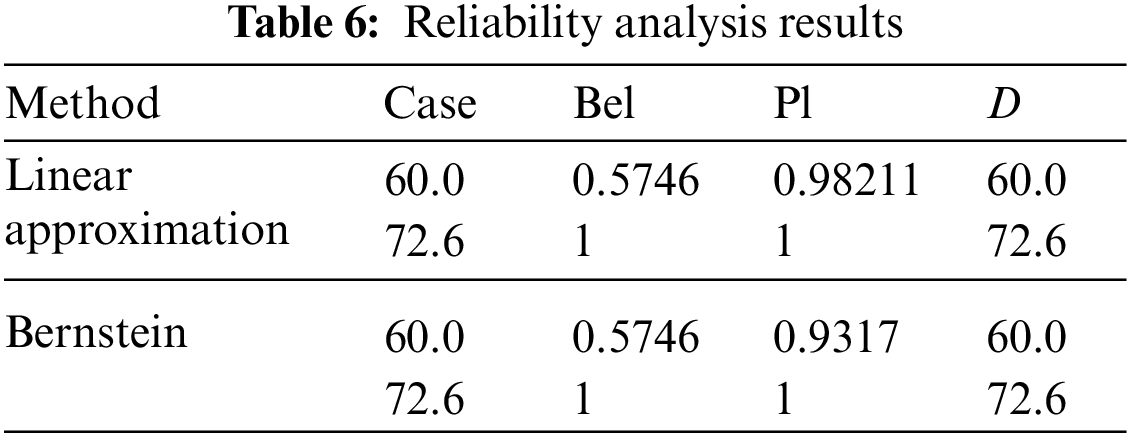
Table 6 shows the obtained reliability analysis results. When the allowable maximum displacement D of node 3 is D = 60.0 mm, the plausibility Pl = 0.9821 is obtained by linear approximation. According to this result, structural safety is ideal. However, the plausibility obtained by the Bernstein approximation is Pl = 0.9317, which is relatively small, indicating an excellent possibility of structural failure under the design requirements of this displacement value. It can be seen that the accuracy of the proposed method is higher than that of the linear approximation method. When the maximum allowable displacement D of node 3 is D = 72.6 mm, the reliability and plausibility obtained by the two methods are 1. It can be seen that the safety index always meets the design needs; that is, the structure is entirely reliable.
In this paper, a reliability analysis method based on evidence theory is proposed. Based on the non-probabilistic reliability index method, the extreme value of the limit state function is obtained by using the properties of the Bernstein polynomial to avoid large sampling.
The proposed method has been applied to a numerical example and an engineering application. The calculation results have shown that the proposed method has high calculation efficiency and accuracy, especially for some reliability problems with high nonlinearity. Compared with the linear approximation method, the proposed method in this paper has higher accuracy. Unfortunately, this study has not yet included large-scale reliability problems with many evidence uncertainties. It is expected that this method will be extended to the mixed reliability problem with cognitive uncertainty and random uncertainty in future.
Funding Statement: The authors received no specific funding for this study.
Conflicts of Interest: The authors declare that they have no conflicts of interest to report regarding the present study.
References
1. A. Akgul, U. Fatima, M. S. Iqbal, N. Ahmed, A. Raza et al., “A fractal fractional model for computer virus dynamics,” Chaos, Solitons and Fractals, vol. 147, no. 1, pp. 1–9, 2021. [Google Scholar]
2. J. E. M. Diaz, A. Raza, N. Ahmed and M. Rafiq, “Analysis of a nonstandard computer method to simulate a nonlinear stochastic epidemiological model of coronavirus-like diseases,” Computer Methods and Programs in Biomedicine, vol. 204, no. 1, pp. 1–10, 2021. [Google Scholar]
3. Y. Deng, “Uncertainty measure in evidence theory,” Science China Information Sciences, vol. 63, no. 11, pp. 5–23, 2020. [Google Scholar]
4. X. Y. Chen, J. P. Fan and X. Y. Bian, “Theoretical analysis of non-probabilistic reliability based on interval model,” Acta Mechanica Solida Sinica, vol. 30, no. 6, pp. 638–646, 2017. [Google Scholar]
5. B. Limboo and P. Dutta, “A Q-rung orthopair basic probability assignment and its application in medical diagnosis,” Decision Making: Applications in Management and Engineering, vol. 5, no. 1, pp. 290–308, 2022. [Google Scholar]
6. D. N. Chen, H. S. Li and C. Y. Yao, “Reliability analysis based on evidence theory and Bayesian network for hydraulic drive system,” Chinese Hydraulics & Pneumatics, vol. 1, no. 4, pp. 8–14, 2017. [Google Scholar]
7. C. Jiang, W. Zhang and W. X. Han, “A copula function based evidence theory model for correlation analysis and corresponding structural reliability method,” Journal of Mechanical Engineering, vol. 53, no. 16, pp. 199–209, 2017. [Google Scholar]
8. R. Ghosal, S. Ghosh, J. Urbanek, J. A. Schrack and V. Zipunnikov, “Shape-constrained estimation in functional regression with Bernstein polynomials,” Computational Statistics & Data Analysis, vol. 178, no. 1, pp. 1–20, 2023. [Google Scholar]
9. B. Jin, W. Zhou, L. Y. Tang, Z. Y. Li and Z. L. Jiang, “Calculation of structural reliability of implicit function under serviceability limit state,” Journal of Hunan University (Natural Sciences), vol. 47, no. 1, pp. 116–122, 2020. [Google Scholar]
10. G. S. Su, L. F. Peng and L. H. Hu, “A Gaussian process-based dynamic surrogate model for complex engineering structural reliability analysis,” Structural Safety, vol. 68, no. 1, pp. 97–109, 2017. [Google Scholar]
11. Z. Liu, J. Duan, L. Huang, J. Dezert and Y. Zhao, “Combination of classifiers with incomplete frames of discernment,” Chinese Journal of Aeronautics, vol. 35, no. 5, pp. 145–157, 2022. [Google Scholar]
12. Z. Liu, X. Zhang, J. Niu and J. Dezert, “Combination of classifiers with different frames of discernment based on belief functions,” IEEE Transactions on Fuzzy Systems, vol. 99, no. 1, pp. 1, 2020. [Google Scholar]
13. H. J. Shi, J. H. Li, H. Chang and L. L. Liu, “Research on passive localization method of shallow water acoustic source with single hydrophone based on hierarchical grid histogram filtering,” Applied Acoustics, vol. 194, no. 1, pp. 108812, 2022. [Google Scholar]
14. H. Y. Dui, Y. Li and G. H. Bai, “An improved uncertainty importance analysis method for reliability,” Operations Research and Management Science, vol. 31, no. 3, pp. 100–104, 2022. [Google Scholar]
15. S. T. Liu, X. J. Li, Z. J. Zhou, J. P. Yao and J. Wang, “A review of the application of evidence theory in pattern classification,” Journal of China Academy of Electronics and Information Technology, vol. 17, no. 3, pp. 247–258, 2022. [Google Scholar]
16. C. Andrea, C. Davide and D. Thierry, “Belief functions and rough sets: Survey and new insights,” International Journal of Approximate Reasoning, vol. 143, no. 1, pp. 192–215, 2022. [Google Scholar]
17. S. A. Solovyev and A. A. Soloveva, “Structural reliability analysis using evidence theory and fuzzy probability distributions,” Magazine of Civil Engineering, no. 107, pp. 10704, 2022. [Google Scholar]
18. Y. X. Yang, X. Pan and Q. D. Cui, “An evidence combination rule based on transferable belief model and application in reliability assessment with multi-source data,” IEEE Access, vol. 8, no. 8, pp. 69096–69104, 2020. [Google Scholar]
19. B. Jiang, X. A. Ling, L. Zhang and Y. J. Gao, “Evidence combination method based on improved modified weight,” Computer Engineering and Applications, vol. 57, no. 24, pp. 100–106, 2021. [Google Scholar]
20. Q. Sun, X. Q. Ye and W. K. Gu, “A new combination rules of evidence theory,” Acta Electronica Sinica, vol. 28, no. 8, pp. 4, 2000. [Google Scholar]
21. Z. Wang and F. Xiao, “An improved multi-source data fusion method based on the belief entropy and divergence measure,” Entropy, vol. 21, no. 6, pp. 611, 2019. [Google Scholar]
22. P. J. Lv, X. J. Shi and Y. F. Qin, “An improved D-S algorithm for correcting evidence conflicts,” Electronic Measurement Technology, vol. 42, no. 19, pp. 96–100, 2019. [Google Scholar]
23. B. Li, “Synthesis assessment method based on pignistic similarity and improved DS evidence theory,” Application Research of Computers, vol. 35, no. 12, pp. 3682–3684, 2018. [Google Scholar]
24. Q. Liu and H. L. Zhang, “Reliability evaluation of weighted voting system based on D–S evidence theory,” Reliability Engineering and System Safety, vol. 217, no. 1, pp. 108079, 2022. [Google Scholar]
25. J. Wu, J. G. Zhang, L. F. You and N. Ye Nan, “Structural reliability calculation method based on improved weighted response surface,” Journal of Beijing University of Aeronautics and Astronautics, vol. 47, no. 8, pp. 1638–1645, 2021. [Google Scholar]
Cite This Article
 Copyright © 2023 The Author(s). Published by Tech Science Press.
This work is licensed under a Creative Commons Attribution 4.0 International License , which permits unrestricted use, distribution, and reproduction in any medium, provided the original work is properly cited.
 Downloads
 Citation Tools