
 Submit a Paper
 Propose a Special lssue
 Open Access
ARTICLE

An Effective Diagnosis System for Brain Tumor Detection and Classification
1 Electrical Engineering Department, College of Engineering, Northern Border University, Arar, 91431, Saudi Arabia
2 Department of Medical Laboratory Technology, Faculty of Applied Medical Sciences, Northern Border University, Arar, 91431, Saudi Arabia
3 Electrical Engineering Department, Faculty of Engineering at Rabigh, King Abdulaziz University, Jeddah, 21589, Saudi Arabia
* Corresponding Author: Ahmed A. Alsheikhy. Email:
Computer Systems Science and Engineering 2023, 46(2), 2021-2037. https://doi.org/10.32604/csse.2023.036107
Received 17 September 2022; Accepted 08 December 2022; Issue published 09 February 2023
A correction of this article was approved in:
Correction: An Effective Diagnosis System for Brain Tumor Detection and Classification
Read correction
 View Full Text
 Download PDF
Abstract
A brain tumor is an excessive development of abnormal and uncontrolled cells in the brain. This growth is considered deadly since it may cause death. The brain controls numerous functions, such as memory, vision, and emotions. Due to the location, size, and shape of these tumors, their detection is a challenging and complex task. Several efforts have been conducted toward improved detection and yielded promising results and outcomes. However, the accuracy should be higher than what has been reached. This paper presents a method to detect brain tumors with high accuracy. The method works using an image segmentation technique and a classifier in MATLAB. The utilized classifier is a Support Vector Machine (SVM). Discrete Wavelet Transform (DWT) and Principal Component Analysis (PCA) are also involved. A dataset from the Kaggle website is used to test the developed approach. The obtained results reached nearly 99.2% of accuracy. The paper provides a confusion matrix of applying the proposed approach to testing images and a comparative evaluation between the developed method and some works in the literature. This evaluation shows that the presented system outperforms other approaches regarding the accuracy, precision, and recall. This research discovered that the developed method is extremely useful in detecting brain tumors, given the high accuracy, precision, and recall results. The proposed system directs us to believe that bringing this kind of technology to physicians diagnosing brain tumors is crucial.Keywords
Numerous solutions have been proposed to identify and classify brain tumors. These solutions deployed different technologies to achieve an acceptable range of accuracy, and the maximum obtained accuracy was 98.8%. Hence, this study aims to improve accuracy and produce promising results. The significant contributions of this article are:
• Investigating the current state-of-the-art methods for brain tumor diagnosis and classification to spot their weaknesses and how to improve the accuracy of diagnosis and classification as well.
• Integrating SVM and K-means algorithms to perform the classification operation precisely.
• Analyzing the performance of the presented system in terms of accuracy, precision, and recall. This analysis shows that the developed approach of diagnosis and classification for brain tumors achieves over 99% accuracy and outperforms other state-of-the-art methods.
The analysis of tumors for their location, size, and shape is complex [1,2]. MRI scans can offer in-depth information about the soft tissues in the human body and provide an outline of a tumor if it exists [2,3–6]. That said, manual analysis of an MRI can lead to an inaccurate diagnosis of brain tumors [2]. Still, attempting these challenges is critical to patient care. The early diagnosis and detection of tumors can provide an excellent, timely treatment to elevate the survival ratio [2–4]. Compared to other parts of the human body, diagnosing a brain tumor is particularly difficult because the brain is filled with the Blood-Brain Barrier (BBB) [2]. MRIs are a preferred technology in brain tumor detection since they can capture disruptions in the BBB [2,5–9]. Around 227,000 deaths are reported annually due to brain tumors, and 7 to 11 out of 100,000 are diagnosed with brain tumors [2]. Three main components comprise the brain’s anatomy: the stem, cerebrum, and cerebellum [3]. The World Health Organization (WHO) classifies brain tumors among four types, known as grades. These four grades indicate whether a cancer is slow-growing or aggressive [3,10–13]. The first grade refers to tumors that grow slowly and do not spread excessively [3]. The second grade represents tumors that grow slowly and can spread to other tissues [3]. Second-grade tumors can come back after surgery. The third grade denotes tumors that grow faster than the previous two grades and spread to neighboring tissues [3–6]. These tumors are treated by surgery and post-surgical treatment such as radiotherapy or chemotherapy [3]. The fourth grade refers to the most destructive and spreadable tumors [3]. Fig. 1 illustrates a healthy brain on the left-hand side and a brain with a tumor on the right-hand side of an MRI image as in [14].
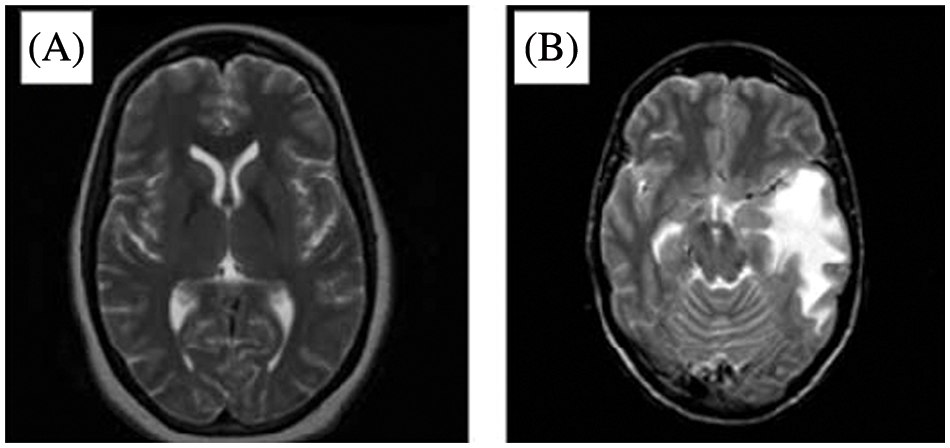
Figure 1: MRI of (A) A healthy brain and (B) A brain with a tumor
In addition to the grades used to classify brain tumor growth and spread, tumors can be classified as benign or malignant [15–22]. Benign tumors are non-cancerous, unlike malignant tumors. The National Brain Tumor Society (NBTS) published some facts about brain cancer in the United States [15].
Benign tumors are classified into several types: Chordomas, Craniopharyngiomas, Gangliocytomas, Glomus Jugulare, Meningiomas, Pineocytomas, and Pituitary Adenomas. Malignant tumors are classified into six classes; readers can refer to [21,22] for additional information. According to [20–22], any tumor can grow until it becomes large and overpower the body’s immune system or nearby nerves and blood vessels that affect the brain’s functions. BBC posted a photo of a 31-year-old man who lost his vision because of a brain tumor [16]. This tumor could be one of the giant detected tumors ever and is shown in Fig. 2. Fig. 2 clearly shows the true meaning of tumor: an abnormal growth of cells. The change was uncontrolled. According to [17,18], over one hundred different types of brain tumors have been discovered and detected.

Figure 2: The largest discovered brain tumor
A brain tumor can cause light or severe, acute, and profound pain, and this pain can be associated with numerous symptoms [18–20]. These symptoms are:
A) Headaches.
B) Seizures.
C) Muscle twitches and shaking in the body.
D) Loss of consciousness, awareness, realization, feeling, and body control.
E) Drowsiness, nausea, and vomiting.
Healthcare providers and physicians decide the best treatments for a brain tumor based on several factors. These factors are the type of tumor being diagnosed and detected, its size, location, and the patient’s health and condition. DWT is used to diagnose and identify brain tumors by X-rays, CT scans, magnetic resonance imaging, or biopsies [21,22]. DWT is able to divide available information of an image into two discrete components through two filters to extract the approximate coefficients and details coefficients for each color in an input. DWT is used for compression and denoising purposes. Tumors can be treated using either surgery, radiation, or chemotherapy. Recently, numerous studies on brain tumors have been conducted, and several solutions have been developed and proposed using evolving technologies and their applications. Computer-Aided Diagnosis (CAD), MRI, and CT scans are some of these technologies. SVM and Convolutional Neural Networks (CNNs) are examples of CAD systems recently utilized for brain tumor detection. SVM is one of the most popular supervised learning algorithms for classification problems in machine learning. SVM creates a hyperplane decision boundary to segregate considered data into different classes or groups. Thus, introducing new data is quickly done. SVMs are classified as linear or non-linear, as depicted in Figs. 3a and 3b, respectively. Simple linear support vector machines create a straight line between two data types, as illustrated in Fig. 3a. This straight line indicates that all data on one side belong to a particular class while other data on the other side represent another class. Thus, these support vector machines have some advantages and disadvantages:
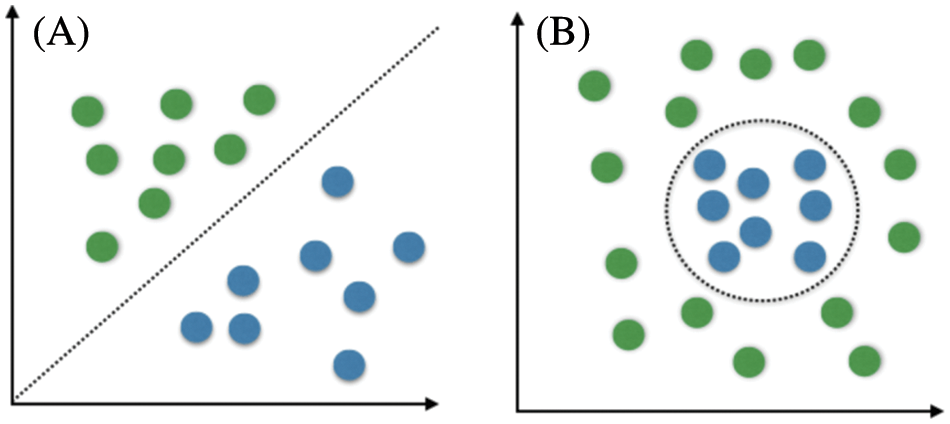
Figure 3: Linear SVM vs. non-linear SVM
Advantages:
i) Very effective on datasets with numerous features.
ii) Utilizes some information from a dataset to create a hyperplane boundary to classify data.
iii) Different functions are used to reach the best decision, boundaries, and functions.
Disadvantages:
i) Working on larger datasets degrades performance and increases the possibility of making erroneous decisions.
ii) Overfitting becomes crucial when the number of features is more significant than the number of data points.
Discrete Wavelet Transform (DWT) is used for discrete samples of inputs. In image processing techniques, discrete wavelet transform is utilized to denoise any two-dimensional signals, such as images [23–25]. It was implemented to overcome issues of Fourier Transformation in the temporal resolution of frequency and location. Hence, it is helpful in numerous real applications in different fields, such as science, mathematics, engineering, and the medical industry. It performs operations on signals to discrete them into redundant forms without altering data [23,24]. MATLAB has a built-in function for DWT, which makes it easier for developers to utilize this helpful tool in their applications and systems.
Principle Component Analysis (PCA) transforms data from high dimensions into low dimensions and keeps information unchanged [26,27]. This technique is powerful and valuable when dealing with data containing many features, especially in genome and image processing research [26–29]. Utilizing a PCA tool in image processing makes it easier to reduce data dimensions to readable; thus, developers and designers can analyze the resultant data to reach a decision.
1.1 Research Problem and Objectives
This research evaluates the current state-of-the-art of brain tumor detection and classification, enhances the accuracy since the maximum obtained accuracy was 98.8% as in [2], and minimizes the processing time. Hence, the proposed system detects and classifies brain tumors precisely and adequately, as accuracy is nearly 99.2% which is much better than any algorithms found in the literature.
The objectives of this study are as follows:
1. Having a system that identifies and classifies brain tumors correctly.
2. Increasing the accuracy to more than 98.8%.
3. Implementing a system to support and assist healthcare providers and physicians in diagnosing brain tumors quickly and precisely.
This paper develops and proposes a feasible system to detect and classify brain tumors. Detection is achieved using image processing and segmentation techniques. Then, SVM is used for classification. A comparison study that evaluates the method’s accuracy is conducted between the developed method and other works in the literature in Section 4. The rest of this paper is organized as follows; Section 2 presents the related work on brain tumor detection and classifications. The approach is explained in detail in Section 3. In Section 4, the results and discussion are presented. To conclude, the conclusion of the paper is in Section 5.
Thayumanavan et al. in [1] proposed using a median filter to optimize the shedding of the brain in MRI. The filter extracted abnormal tissues in low contrast to find the edges of infected tissues. Discrete Wavelet Transform (DWT) and Histogram of Oriented Gradients (HOG) were used to perform feature extraction on the infected tissues, discerning texture and shape. Lastly, a Random Forest Classifier was used to classify the images as normal or abnormal, though it did not diagnose the type of the detected tumor. It reached around 98% of accuracy and 96.6% for the recall metric. The proposed approach in this paper builds on their research and not only detects brain tumors but classifies them as slow-growing (Benign) or aggressive (Malignant). The presented system reached higher accuracy as it was found to be more than 99%. Moreover, this system determines the shape and exact location of the detected tumors and outlines them. PCA is used with DWT to reduce the dimension of the extracted features matrix. The method in [1] provided no information about classifying the detected tumors. In contrast, the proposed system in this study provides accurate details about the location, shape, and size of all detected tumors.
Naser et al. in [2] developed a method to detect brain tumors in an early stage by employing CNNs. These CNNs were constructed from twelve layers and trained on MRI images that contained brain tumors. Six datasets were used to evaluate the method’s sustainability for the unseen data. The obtained accuracy was around 98.8%, and the precision was 99%. However, this approach diagnosed only two datasets correctly, as disclosed by the authors in [2]. Herein, the proposed algorithm reaches nearly 99.2% accuracy for detection and classification and 99.66% recall. These two values indicate that the proposed system is better and produces promising results. Another difference is that the approach in [2] utilized CNNs which require much processing time. At the same time, the presented system uses SVM and image segmentation tools to identify and classify brain tumors more quickly and precisely, as proved by the conducted experiments.
In [4], Ramu et al. presented an approach to identify brain tumors using a fuzzy means clustering tool on MRI images. This approach also used DWT and a Propagation Neural Network (PNN) to classify cells and tissues, whether regular or abnormal. All inputs were resized to 256 × 256 to speed up the processing time. A median filter modified every input to remove noise and enhance the quality. Then, this input was segmented using DWT to identify potentially infected tissue and classify it. The last step used PNN and the fuzzy means clustering approach to categorize tissue as normal or abnormal. Unfortunately, there needed to be more information about the obtained accuracy or which performance metrics were utilized and measured in this method. The presented system herein converts MRI images into a grayscale mode to perform several procedures, such as applying DWT and PCA to outline a potential Region of Interest (RoI). Gabor filter is used to enhance the quality. SVM and K-means algorithms integrate and incorporate to classify RoI into either Benign or Malignant with higher accuracy, as shown in the result and discussion section. This accuracy is 99.2%.
The authors in [5] proposed a method to segment and classify brain tumors using multiple feature extraction and CNN tools. The goal was to detect tumors in their early stages. The authors extracted the required features using three different techniques, Local Binary Pattern (LBP), Histogram of Oriented Gradients (HOG), and Gray Level Co-occurrence Matrix (GLCM), and CNNs were trained based on those three methods. The authors extracted texture features and utilized these features to calculate the distance between every two pixels and their intensity. The utilized CNN deployed different layers to soften the generated outputs. The authors used only 250 images in their research, and 70% of the utilized inputs were used to train the developed model and achieve 95.5% accuracy. The number of MRI inputs used is small. It could lead to undesirable results since the accuracy increases dramatically with the increasing number of inputs and the number of iterations. The obtained accuracy was nearly 95.5%. The proposed approach in this study was applied to the downloaded dataset, which contains 3865 MRI images and achieved more than 98% accuracy. In addition, recall and precision gained more than 99%, while the implemented model in [5] provided no information about these two performance metrics. The processing time of the presented system in this study is nearly 23.7 s when applied on just one input, and this time is less than the method in [5]. The proposed system beats the algorithm in [5] regarding accuracy and processing time.
Ranjbarzadeh et al. in [7] presented two methods to decrease computing time in a Cascade deep learning model for tumor detection. The authors dealt with a small part of MRIs to extract features, utilized a cascade CNN to train their model, and applied a Distance-Wise Attentions (DWA) algorithm to improve accuracy. DWA considered the effect of the location of a tumor inside the brain, as claimed by the authors. This model mainly dealt with the distance between the potential detected objects. Comprehensive experiments were conducted on the BRATS 2018 dataset to test and verify the proposed model and achieve competitive results. The obtained average percentage value of sensitivity was nearly 97.12%. The processing time of one patient was 84 s, while the proposed system in this study took less than 20 s, which is faster and much better. However, this method took a long time to achieve its results as one input took 84 s. The proposed system in this research produces promising results as its recall is more than 99%, and the processing time is less than the models in [7]. Moreover, it outperforms the developed methods in [7].
Recent studies focus on identifying and categorizing brain tumors with a higher accuracy level. The processing time, also known as the execution time, is long, which is considered a drawback since diagnosing brain tumors requires less time. Thus, this article's authors aim to create a feasible, reliable, and dependable system to detect and classify brain tumors precisely, correctly, and quickly and obtain a higher accuracy than achieved. For this system to be efficient and practical, it should be able to execute detection and classification procedures in less than 30 s quickly. In addition, this system should produce its outputs/outcomes in less time since other developed systems take more than 1 min to process one input.
This research is motivated by the need for a practical, reasonable, and reliable system to detect and classify brain tumors quickly and accurately in their early stage. The authors propose an algorithm using image segmentation techniques and a combination of SVM and K-means classifiers. The proposed method performs numerous operations on MRIs, as illustrated in Fig. 4.
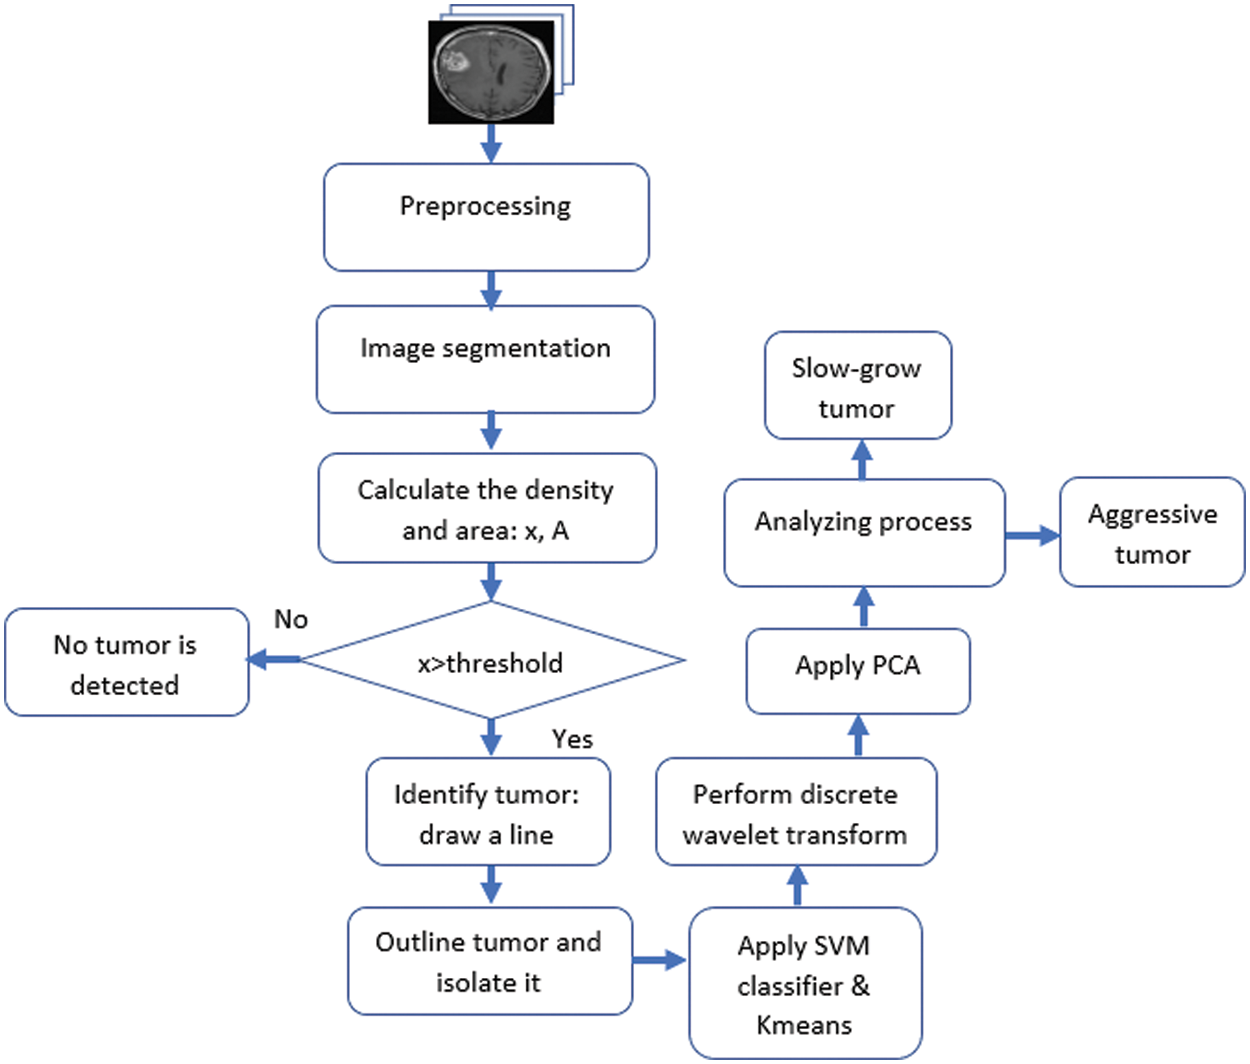
Figure 4: The flowchart of the proposed approach
This system utilizes the K-means algorithm along with SVM to classify the detected potential tumors. Furthermore, Discrete Wavelet Transformation (DWT) and Principal Component Analysis (PCA) are used in the classification process. The algorithm classifies tumors as either slow-growing (Benign) or aggressive (Malignant). MATLAB is used in this research for programming and simulation to verify the appropriateness of the developed system. The K-means approach partitions data into two clusters and the support vector machine model to classify the detected tumors. The clusters are “slow-growing, Benign” and “aggressive, Malignant.” These two classifiers use numerous iterations to find the best two centroids. MATLAB uses the squared Euclidean distance as a metric to find optimal two centroids. The proposed system randomly assigns multiple data points to every cluster. It determines the optimal centroids to separate all given data into groups according to their distances from the center points. In this study, the algorithm iterates around 1000 times to determine the best fit for every point. Fig. 5 illustrates a sample of generated outputs from the clustering operation used in the presented algorithm. The green dots represent healthy cells, while the red dots refer to the potentially infected cells. X represents the two centroid points.
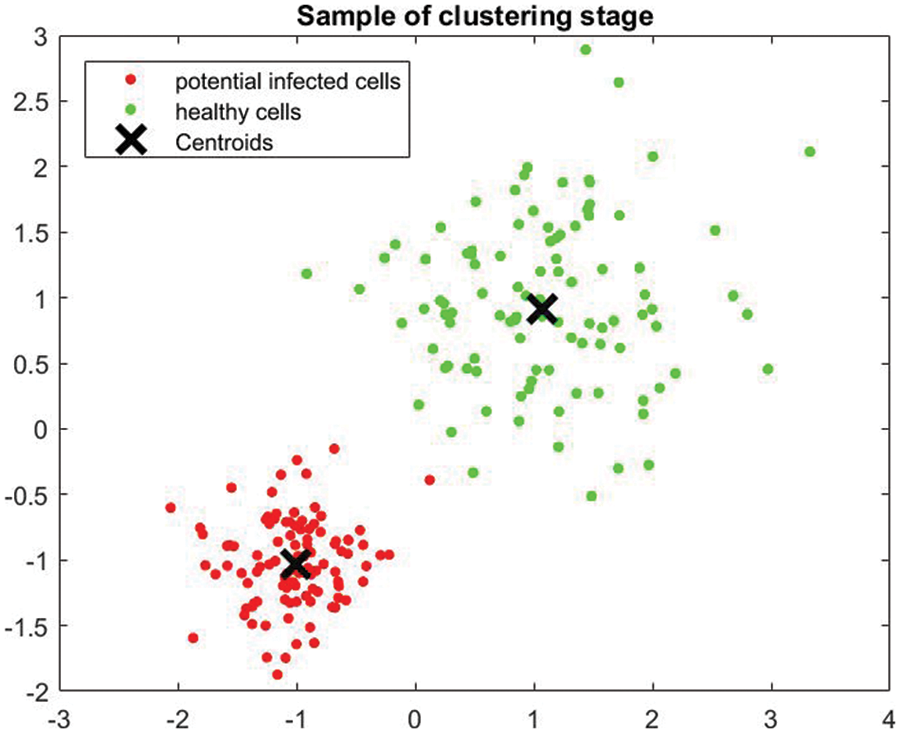
Figure 5: Sample of clustering stage
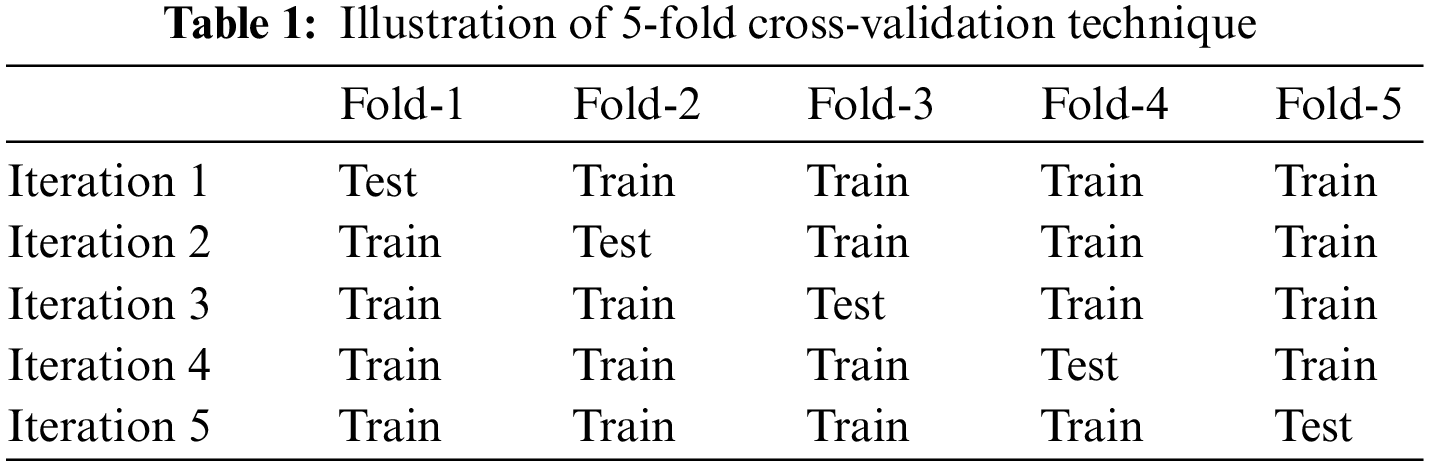
After applying SVM and K-means approaches to classify the diagnosed tumors, a K-Fold Cross-Validation method is performed. The k-Fold Cross-Validation method is a statistical method used to measure and evaluate the skill of the proposed system. The dataset is split into ten folds. Every fold is utilized as a training set and a testing set in different iterations, as in Table 1. However, due to space limitations, only five folds are shown.
In MATLAB, discrete wavelet transformation is performed by the wavelet toolbox. This toolbox analyzes images and returns a single-level wavelet of decomposition-filtered data. Then, it computes the discrete wavelet data for vertical, horizontal, and diagonal data. This toolbox is utilized on the input images to support the presented method in extracting the required input features to determine and classify tumors. DWT is used to provide information in the frequency domain for deep analysis to extract needed features for tumor classification. These features include contrast, correlation, RMS, variance, and homogeneity. Furthermore, location, shape, and area are extracted by the presented system and used. The clustering operation is performed using the Euclidean Distance equation and an index for every clustered point. The output of this stage is a 124 × 31 entry matrix. This matrix refers to the features that are forwarded into the PCA phase to reduce the dimensions of the data.
As stated, the principal component analysis tool reduces the data’s dimensions. Furthermore, normalization is achieved for every required feature through a built-in function. MATLAB contains this built-in function to perform this operation. This operation is utilized to determine the main components of the analysis: variance, mean, standard deviation, energy, and histogram. All these components are fed into SVM and K-means for further analysis. The output from this phase is a new 8 × 8 matrix, as shown in Fig. 6. DWT_feat refers to the matrix that contains all considered and required features, whereas g represents the output matrix from the PCA operation. The new matrix includes only the feature components to perform classification. Fig. 6 illustrates a sample of the values of the considered features.
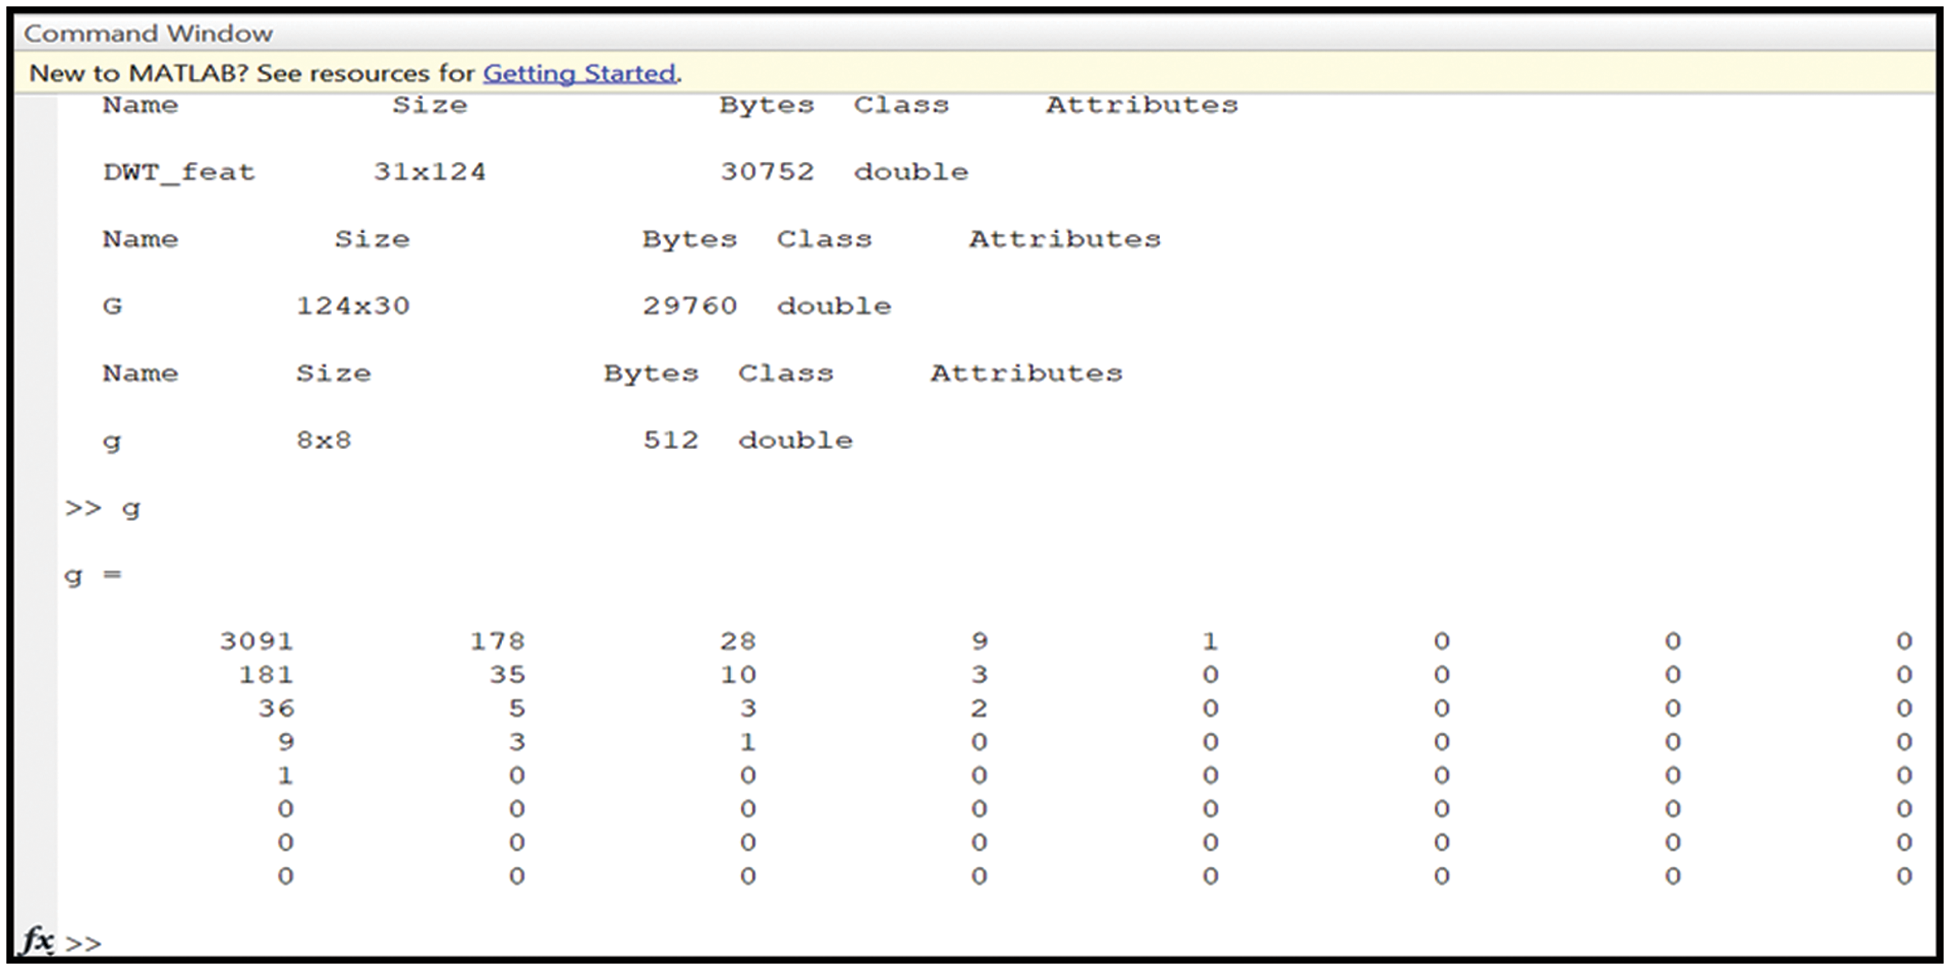
Figure 6: The obtained outputs of the DWT and PCA operations
As illustrated in Fig. 4, the developed algorithm starts with a preprocessing phase where several procedures are performed, such as applying The Gabor filter to remove noise if it exists, resizing the images for faster processing, and converting them into grayscale. Then, the segmentation process is performed to:
1. Find the mean and the maximum values to determine a threshold.
2. Use a morphological technique to draw a yellow rectangular around a potential area of the detected tumor, as illustrated in the next section.
The threshold is computed by finding the mean value of the input image. Then, the maximum and the minimum values are estimated and divided by 2. This process is performed dynamically in each image; hence, the threshold is different for each image. The output from this procedure is a two-dimensional matrix whose values are either one or zero. One occurs if the value of the input image is bigger than the threshold, and zero occurs if it is not. This operation aims to draw the yellow rectangular box around the detected tumor with the help of the morphological process. After that, the density of the potential area is calculated to compare it with a predefined threshold. If the evaluated value of the density area is bigger than the threshold, then there is a tumor. Then, the yellow rectangular is drawn around the potential area. After that, the detected tumor is isolated to outline and prepare it for applying the SVM and the K-means classifiers in the classification stage. The outlining process begins by calculating the diameter of the potential tumor area and ends by using an Eroding built-in function in MATLAB.
Several metrics are evaluated during the simulation:
1- True Positive (TP) measures the total number of correctly detected and classified brain tumors.
2- False Positive (FP) refers to the incorrectly identified tumors.
3- True Negative (TN) defines the number of total negative samples detected and classified correctly by the algorithm.
4- False Negative (FN) indicates the total number of negative samples that were incorrectly classified and detected.
5- Precision (PR) measures a fraction of the samples identified correctly over the same samples plus the samples classified incorrectly, as shown in Eq. (1).
6- Recall (RE) indicates the fraction of the truly identified sample over the summation of the valid samples plus the number of negative samples classified wrongly, as depicted in Eq. (2).
7- Accuracy (ACC) shows the percentage of the summation of the valid samples and the negative samples detected and classified correctly by the proposed method over the total number of samples as depicted in Eq. (3).
where X represents the total number of images or samples and is computed as follows:
The main advantages of the proposed system are:
F) The execution time is less than 25 s for every input.
G) The achieved accuracy is more than 99%.
H) Reliable and dependable system.
I) Produces promising results.
J) Outperforms other state-of-the-art algorithms mentioned in the literature review section.
MATLAB is used in this research to conduct numerous experiments on a machine that runs Windows 11 Pro. The specifications are an Intel Chip of Core i7 of 8th generation, the clock speed is 2 GHz, and the RAM size is 16 GB. The dataset from the Kaggle website contains 3865 images of patients diagnosed with a brain tumor or no tumor. These MRIs were utilized to verify the precision, accuracy, recall, and correctness of the presented method in this research. Figs. 7–9 illustrate the obtained results for different MRIs. Each figure contains four subgraphs in which (A) is an input image in the upper lefthand corner, (B) is the detected potential area (tumor) bounded by the yellow rectangular box in the upper right corner, (C) is the detected tumor outline in the bottom left corner and (D) in the bottom right corner shows the detected tumor in red. The performance evaluation is detailed in two forms, which are quantitative and qualitative, of the obtained accuracy, precision, and recall. These three metrics are considered the most critical factors, and several studies use them to measure the developed algorithms. The presented system has evaluated the whole dataset. In the final phase, the proposed system receives inputs from both classifiers, as depicted in Fig. 4. The computed performance metrics are evaluated for the whole dataset, and the average value is taken for every metric. This section mainly focuses on evaluating the required factors and assessing them against implemented systems of the literature review. The dataset contains different sizes, which are resized to speed up the processing time. Figs. 7–9 provide a brief detection and classification results analysis when applying ten distinct runs. These three figures indicate that the proposed system has proficiently identified and classified the images under different runs. For instance, the system reached 92.3%, 93.51%, and 92.87% for accuracy, precision, and recall, respectively, in the first distinct run, and these figures increased as the number of distinct runs increased. The maximum obtained accuracy was 99.47% which is higher than measured. Fig. 10 illustrates the chart of the obtained values of the considered three performance metrics for ten distinct runs. One represents accuracy, two refers to precision, and three represents recall in the same figure. This graph shows that the accuracy increases after each distinct run while the precision and the rise in recall slightly reach an acceptable level of over 99%.
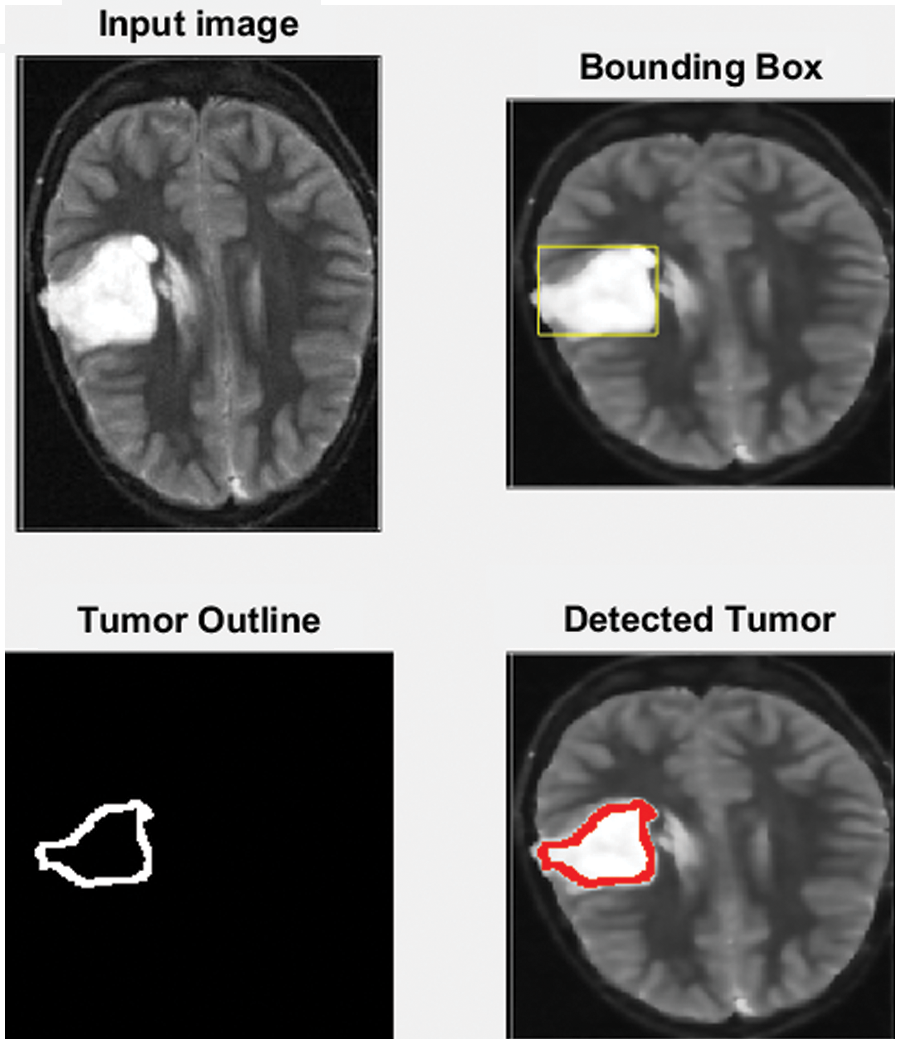
Figure 7: The input MRI and the detected tumor
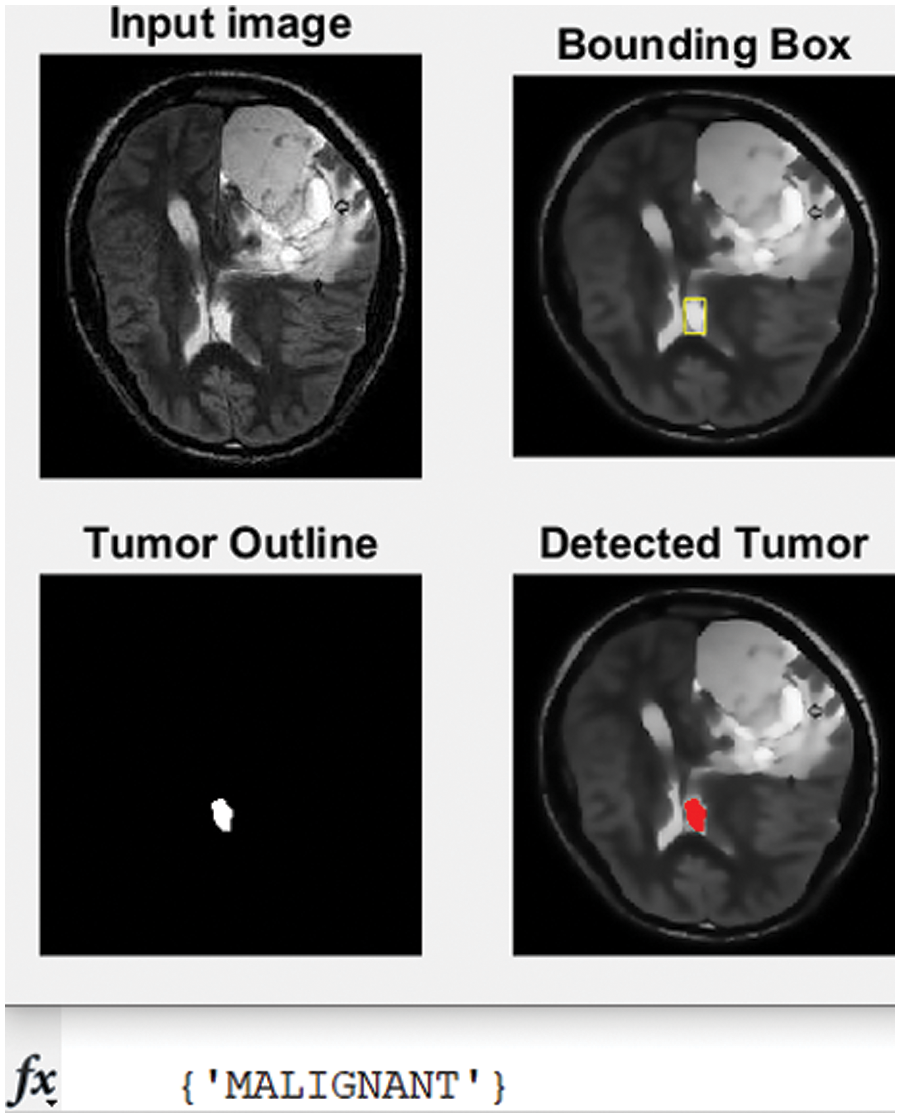
Figure 8: The second tested MRI and the detected tumor with its classification
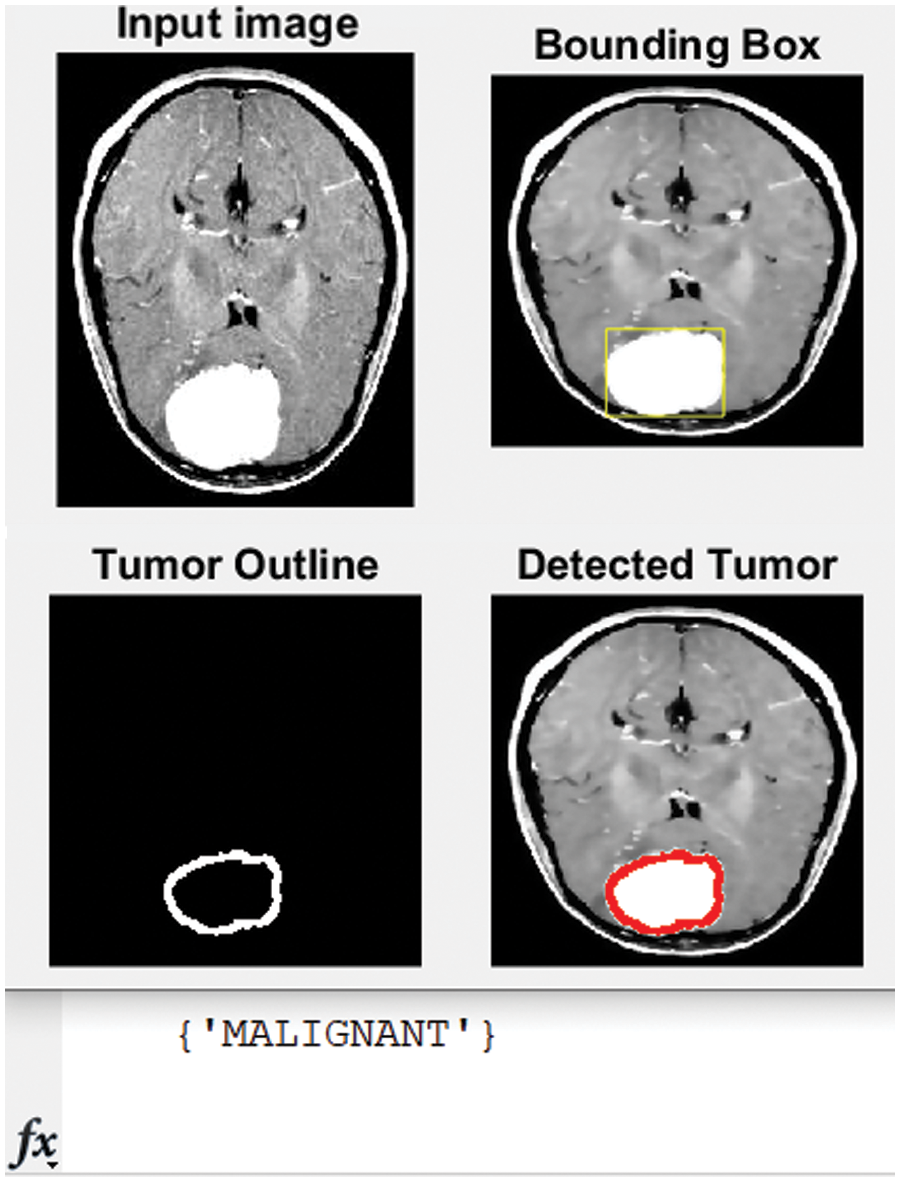
Figure 9: Original MRI, the detected, and classified tumor
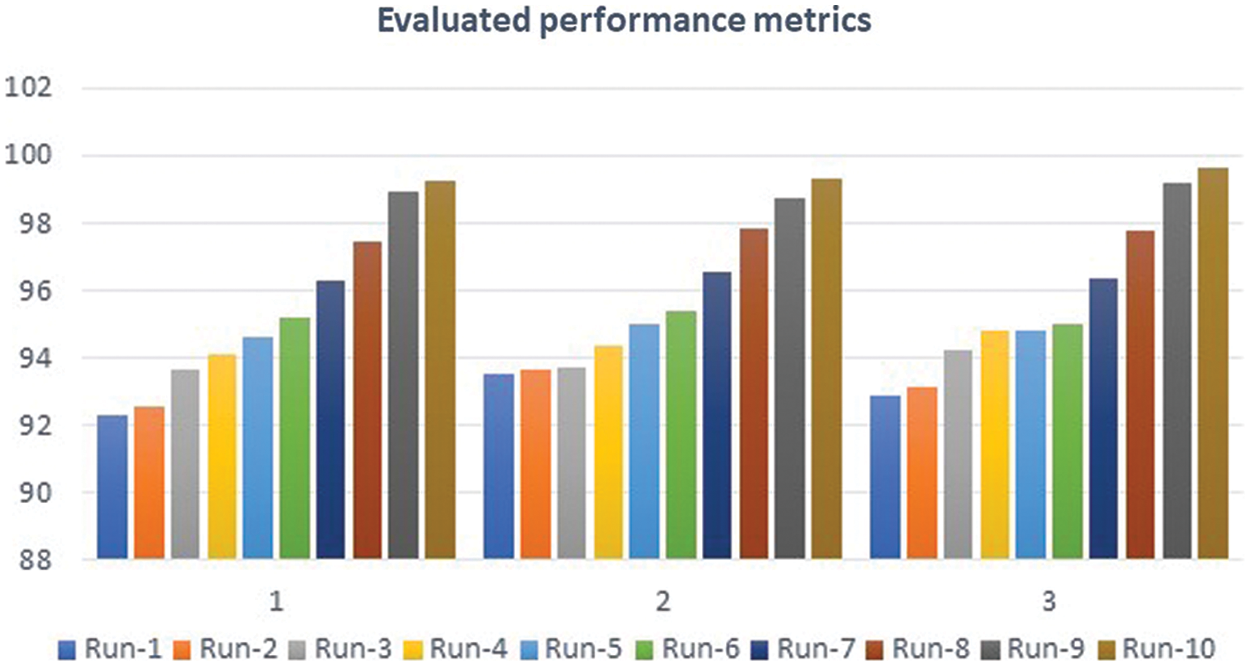
Figure 10: Performance analysis charts
Fig. 7 depicts the process of the implemented method. A yellow rectangle around it bounds the detected tumor, as shown in the upper right corner of the figure. The cancer is then outlined in the bottom left corner in red, as shown in the bottom right corner.
The developed algorithm also outlines tumors to justify and validate the correctness of the presented method. The detected tumor in Fig. 7 was slow-growth, while Figs. 8 and 9 show that the algorithm detected an aggressive or malignant tumor. In the previous three figures, Figs. 7–9, the proposed algorithm identified the tumors and classified them correctly.
Table 2 contains the values of all seven-performance metrics that were mentioned earlier. They were measured after applying the developed approach to a part of the dataset, which includes 365 MRIs. On the other hand, it affects the execution time as it utilizes more time in processing since numerous operations and procedures are involved; the expected execution time should be less than 20 s, and it was found to be 23.7 s.
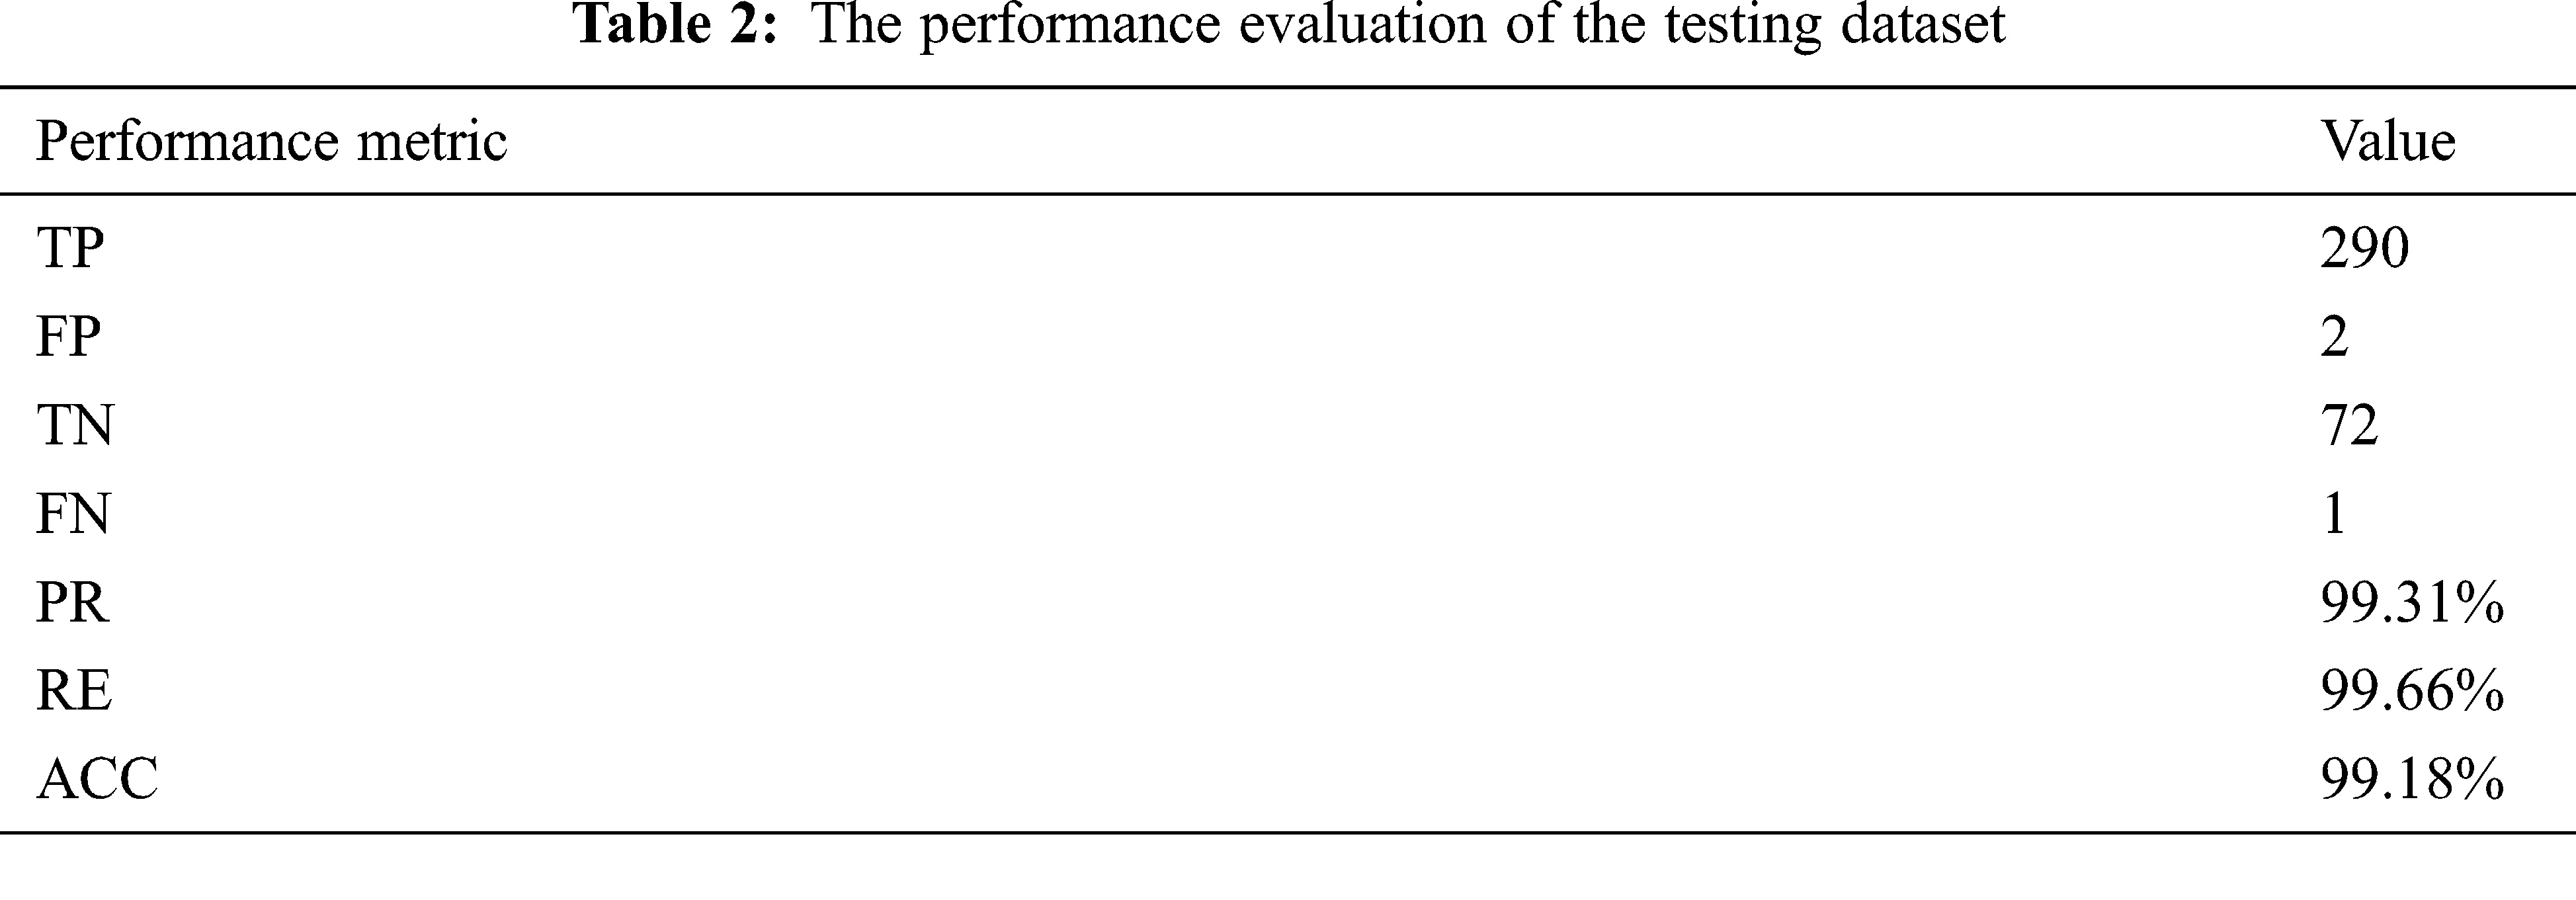
Table 3 lists the values of the comparative evaluation between the proposed approach and some works of literature. This evaluation compares the achieved accuracy, precision, and recall.
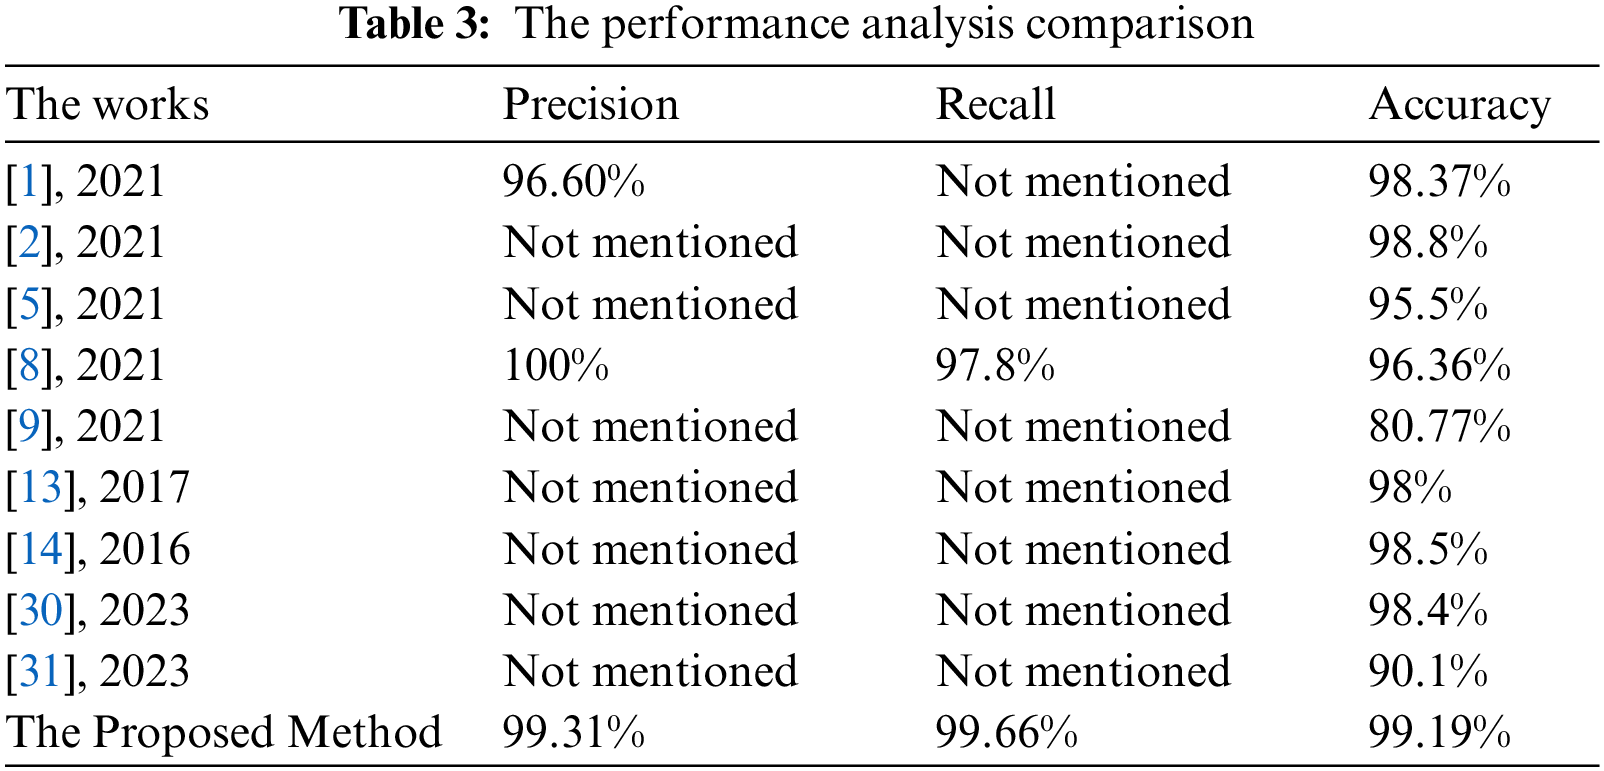
The presented algorithm outperforms the implemented approaches of the literature, as shown in Table 3. Fig. 11 illustrates a comparative evaluation of the obtained accuracy analysis between the proposed system with recent algorithms. This graph shows that the implemented methods in [9] and [31] attained minimal accuracy of 80.33% and 90.1%, respectively. Furthermore, the implemented methods in [5] and [8] achieved moderate accuracy of 95.5% and 96.36%, respectively. Moreover, it shows that the maximum achieved accuracy before the proposed system is 98.8%, and the presented system in this study outperforms all methods and achieves nearly 99.2%.
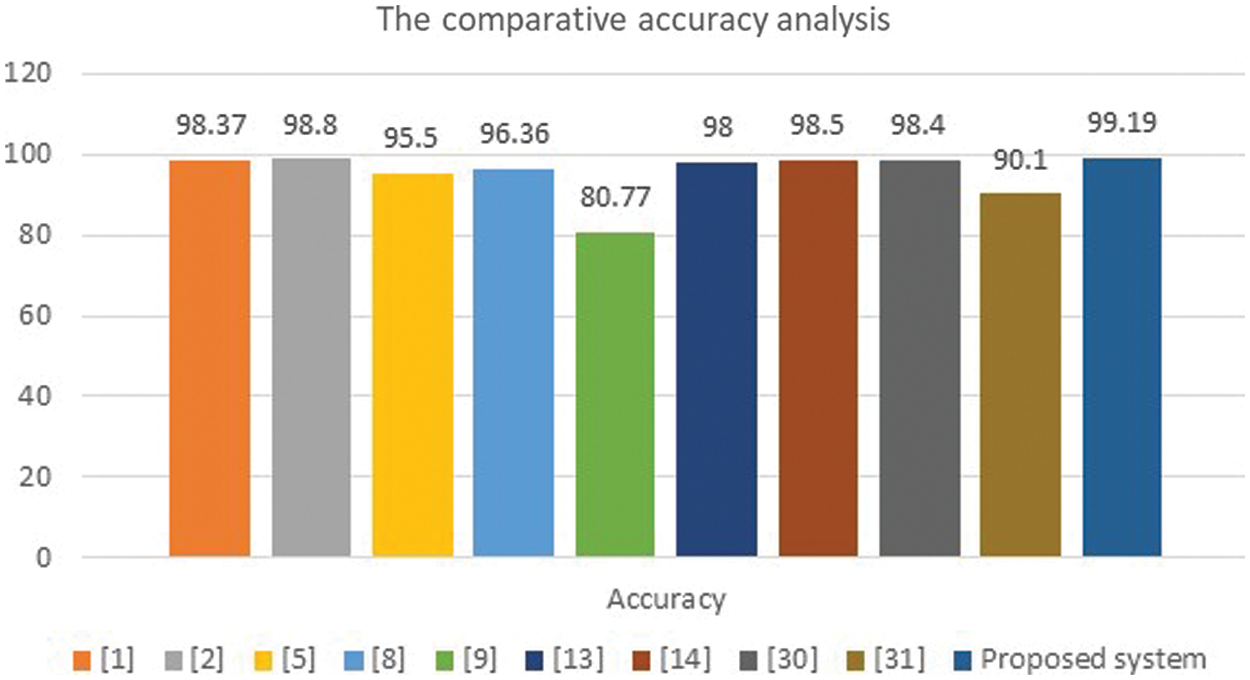
Figure 11: Accuracy analysis charts
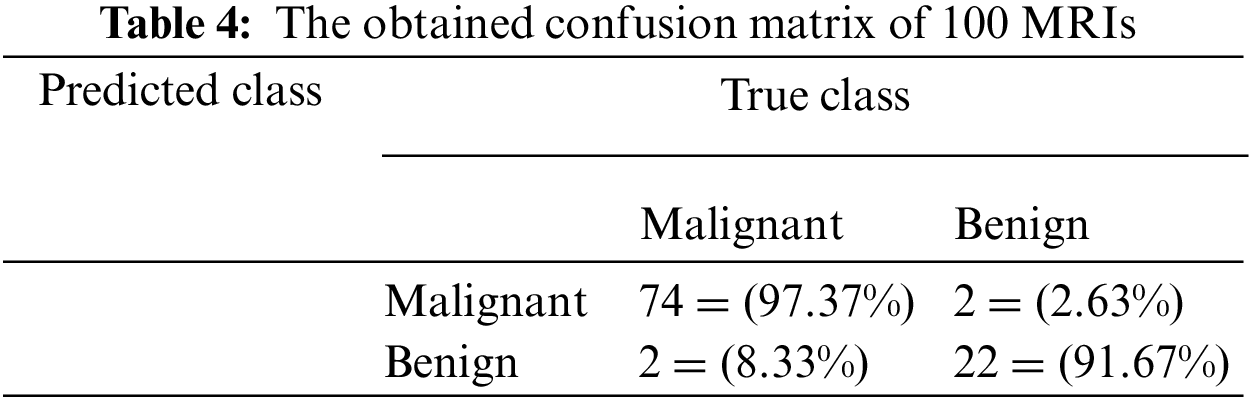
Table 4 illustrates the confusion matrix when applying the proposed algorithm to a sample of 100 MRIs. This sample contains 76 malignant and 24 benign. The confusion matrix, as shown in Table 4, has proved that the proposed system identified the inputs of 100 MRIs into Malignant and Benign classes. Seventy-four inputs were classified as Malignant, while 22 as Benign. In addition, the presented method incorrectly classified four inputs out of 100. However, this figure becomes less than 2% when applied to the testing dataset. Table 4 shows a view of the classification results of the proposed system when performed in five different and distinct runs. In total, more than 50 runs were performed. The results in Figs. 7–9 show that the developed approach precisely detected the tumors and classified them into their proper classes.
This study was deployed because several relatives have been diagnosed with brain tumors. These patients paid too much; unfortunately, their treatments were below their expectations. Seeing those patients suffer from this disease motivated the authors to conduct this research. Moreover, this research is inspired by the need for a practical, reasonable, and reliable system to detect and classify brain tumors quickly and accurately in their early stage.
In this article, the proposed approach demonstrates a highly effective and dependable system to detect and classify tumors from MRI images correctly and precisely. This system involves DWT, PCA, K-means, and SVM to generate promising results. It can classify tumors as Malignant or Benign. The performance of the proposed method was tested on the obtained dataset from The Kaggle website. The obtained results show that the presented system in this research outperforms all other approaches in terms of accuracy, precision, and recall. These results show that the presented system enhanced accuracy by 3.85% compared with the maximum of 98.8%. In addition, it classifies the type of detected tumors almost perfectly, as its accuracy reaches nearly 99.2% when applying the algorithm to the dataset. The implemented system shows significant improvements overall, considering the metrics, but there is still room for improvement. The execution time for this method is slow since the approach uses numerous operations and procedures to achieve acceptable results with a high degree of accuracy.
The future work will involve improving the performance regarding execution time while maintaining the accuracy level.
Acknowledgement: The authors gratefully acknowledge the approval and the support of this research study by grant no. ENGA-2022-11-1469 from the Deanship of Scientific Research at Northern Border University, Arar, KSA.
Funding Statement: The authors gratefully acknowledge the approval and the support of this research study by Grant No. ENGA-2022-11-1469 from the Deanship of Scientific Research at Northern Border University, Arar, KSA.
Conflicts of Interest: The authors declare they have no conflicts of interest to report regarding the present study.
References
1. M. Thayumanavan and A. Ramasamy, “An efficient approach for brain tumor detection and segmentation in MRI brain images using random forest classifier,” Concurrent Engineering: Research and Applications, vol. 29, no. 3, pp. 266–274, 2021. [Google Scholar]
2. A. Naseer, T. Yasir, A. Azhar, T. Shakeel and K. Zafar, “Computer-aided brain tumor diagnosis: Performance evaluation of deep learner CNN using augmented brain MRI,” International Journal of Biomedical Imaging, vol. 2021, no. 2, pp. 11, 2021. [Google Scholar]
3. J. Amin, M. Sharif, A. Haldorai, M. Yasmin and R. S. Nayak, “Brain tumor detection and classification using machine learning: A comprehensive survey,” Complex and Intelligent Systems, vol. 8, no. 4, pp. 3161–3183, 2021. [Google Scholar]
4. B. Ramu, M. Anand, V. Praneeth and S. Shreedha, “Automatic identification of brain tumour using MATLAB by fuzzy c means clustering,” International Journal of Advanced Research in Engineering and Technology (IJARET), vol. 12, no. 2, pp. 652–656, 2021. [Google Scholar]
5. T. Tazeen and M. Sarvagya, “Brain tumor segmentation and classification using multiple feature extraction and convolutional neural networks,” International Journal of Engineering and Advanced Technology (IJEAT), vol. 10, no. 6, pp. 23–27, 2021. [Google Scholar]
6. E. S. Biratu, F. Schwenker, Y. M. Ayano and T. G. Debelee, “A survey of brain tumor segmentation and classifications algorithms,” Journal of Imaging, vol. 7, no. 9, pp. 1–30, 2021. [Google Scholar]
7. R. Ranjbarzadeh, A. B. Kasgari, S. J. Ghoushchi, S. Anari, M. Naseri et al., “Brain tumor segmentation based on deep learning and an attention mechanism using MRI multi-modalities brain images,” Scientific Reports, vol. 11, no. 1, pp. 17, 2021. [Google Scholar]
8. G. Prathibha and H. S. Mohana, “Transvaluate of machine learning algorithms in dissecting of cerebrum tumor in mr images,” International Journal of Advanced Research in Engineering and Technology (IJARET), vol. 12, no. 7, pp. 38–45, 2021. [Google Scholar]
9. P. G. Brindha, M. Kavinraj, P. Manivasakam and P. Prasanth, “Brain tumor detection from MRI images using deep learning techniques,” IOP Conference Series: Material Science and Engineering, pp. 1–7, Erode, India, 2021. [Google Scholar]
10. J. Nalepa, M. Marcinkiewicz and M. Kawulok, “Data augmentation for brain-tumor segmentation: A review,” Frontiers in Computational Neuroscience, vol. 13, no. 83, pp. 1–18, 2019. [Google Scholar]
11. P. Patil, S. Pawar, S. Patil and A. Nichal, “A review paper on brain tumor segmentation and detection,” International Journal of Innovative Research in Electrical, Electronics, Instrumentation and Control Engineering (IJIREEICE), vol. 5, no. 1, pp. 11–15, 2017. [Google Scholar]
12. P. Bedekar, N. Prasad, R. Hagir and N. Singh, “Automated brain tumor detection using image processing,” International Journal of Engineering Research and Technology (IJERT), vol. 5, no. 1, pp. 1–3, 2017. [Google Scholar]
13. R. Gurusamy and V. Subramaniam, “A machine learning approach for MRI brain tumor classification,” Computers, Materials and Continua, vol. 53, no. 2, pp. 91–108, 2017. [Google Scholar]
14. S. Han, “Understanding brain tumors. Healthline Media, San Francisco, CA, USA,” 2022. [Online]. Available: https://www.healthline.com/health/brain-tumor#benign-vs-malignant. [Google Scholar]
15. S. Borse, “Brain tumour. TheHealthSite, Noida, India,” 2022. [Online]. Available: https://www.thehealthsite.com/diseases-conditions/brain-tumour/. [Google Scholar]
16. BBC, “India doctors remove world’s ‘largest brain tumour’,” 2018. [Online]. Available: https://www.bbc.com/news/world-asia-india-43151120. [Google Scholar]
17. A. K. Isselmou, S. Zhang and G. Xu, “A novel approach for brain tumor detection using MRI images,” Journal of Biomedical Science and Engineering, vol. 9, no. 10B, pp. 44–52, 2016. [Google Scholar]
18. R. Kapse, S. S. Salankar and M. Babar, “Literature survey on detection of brain tumor from MRI images,” IOSR Journal of Electronics and Communication Engineering, vol. 10, no. 1, pp. 80–86, 2015. [Google Scholar]
19. T. Logeswari and M. Karnan, “An improved implementation of brain tumor detection using segmentation based on soft computing,” Journal of Cancer Research and Experimental Oncology, vol. 2, no. 1, pp. 6–14, 2010. [Google Scholar]
20. A. A. N. Surgeons, “Patients: Neurosurgical conditions and treatments: Brain tumors,” 2022. [Online]. Available: https://www.aans.org/en/Patients/Neurosurgical-Conditions-and-Treatments/Brain-Tumors. [Google Scholar]
21. Wikipedia, “Discrete wavelet transform,” 2022. [Online]. Available: https://en.wikipedia.org/wiki/Discrete_wavelet_transform. [Google Scholar]
22. K. Chandrasekaran, “2D-discrete wavelet transformation and its applications in digital image processing using MATLAB,” 2021. [Online]. Available: https://medium.com/@koushikc2000/2d-discrete-wavelet-transformation-and-its-applications-in-digital-image-processing-using-matlab-1f5c68672de3. [Google Scholar]
23. P. Kour, “Image processing using discrete wavelet transform,” IPASJ International Journal of Electronics and Communication (IJEC), vol. 3, no. 1, pp. 53–59, 2015. [Google Scholar]
24. Wikipedia, “Principal component analysis,” 2022. [Online]. Available: https://en.wikipedia.org/wiki/Principal_component_analysis. [Google Scholar]
25. C. Cheng, “Principal component analysis (PCA) explained visually with zero math,” 2022. [Online]. Available: https://towardsdatascience.com/principal-component-analysis-pca-explained-visually-with-zero-math-1cbf392b9e7d. [Google Scholar]
26. D. Analytics, “What is principal component analysis (PCA) and how it is used?,” 2020. [Online]. Available: https://www.sartorius.com/en/knowledge/science-snippets/what-is-principal-component-analysis-pca-and-how-it-is-used-507186. [Google Scholar]
27. M. Awad and R. Khanna, “Support vector machines for classification,” in Efficient learning machines, 1st edition, vol. 1. Apress Berkeley, CA, USA: Springer Link, pp. 39–66, 2015. [Google Scholar]
28. D. Srivastava and L. Bhambhu, “Data classification using support vector machine,” Journal of Theoretical and Applied Information Technology, vol. 12, no. 1, pp. 1–7, 2010. [Google Scholar]
29. S. P. Mishra, U. Sarkar, S. Taraphder, S. Datta, D. P. Swain et al., “Multivariate statistical data analysis- principal component analysis (PCA),” International Journal of Livestock Research, vol. 7, no. 5, pp. 60–78, 2017. [Google Scholar]
30. G. I. Rajathi, R. R. Kumar, D. Ravikumar, T. Joel, S. Kadry et al., “Brain tumor diagnosis using sparrow search algorithm based deep learning model,” Computer Systems Science and Engineering (CSSE), vol. 44, no. 2, pp. 1793– 1806, 2023. [Google Scholar]
31. K. D. Babu and C. S. Singh, “Brain tumor segmentation through level-based learning model,” Computer Systems Science and Engineering (CSSE), vol. 44, no. 1, pp. 709–720, 2023. [Google Scholar]
Cite This Article
 Copyright © 2023 The Author(s). Published by Tech Science Press.
This work is licensed under a Creative Commons Attribution 4.0 International License , which permits unrestricted use, distribution, and reproduction in any medium, provided the original work is properly cited.
 Downloads
 Citation Tools