
 Submit a Paper
 Propose a Special lssue
 Open Access
ARTICLE

Leveraging Retinal Fundus Images with Deep Learning for Diabetic Retinopathy Grading and Classification
1 Department of Management Information Systems, Faculty of Economics and Administration King Abdulaziz University, P.O.Box 80201, Jeddah, 21589, Saudi Arabia
2 Department of Business Administration, King Abdulaziz University, P.O.Box 80201, Jeddah, 21589, Saudi Arabia
3 Department of Management Information Systems, College of Business Administration, Taibah University, Al-Madinah, Saudi Arabia
4Department of Computer Science and Engineering, GMR Institute of Technology, Andhra Pradesh, Rajam 532127, India
* Corresponding Author: Mohammad Yamin. Email:
Computer Systems Science and Engineering 2023, 46(2), 1901-1916. https://doi.org/10.32604/csse.2023.036455
Received 30 September 2022; Accepted 08 December 2022; Issue published 09 February 2023
 View Full Text
 Download PDF
Abstract
Recently, there has been a considerable rise in the number of diabetic patients suffering from diabetic retinopathy (DR). DR is one of the most chronic diseases and makes the key cause of vision loss in middle-aged people in the developed world. Initial detection of DR becomes necessary for decreasing the disease severity by making use of retinal fundus images. This article introduces a Deep Learning Enabled Large Scale Healthcare Decision Making for Diabetic Retinopathy (DLLSHDM-DR) on Retinal Fundus Images. The proposed DLLSHDM-DR technique intends to assist physicians with the DR decision-making method. In the DLLSHDM-DR technique, image preprocessing is initially performed to improve the quality of the fundus image. Besides, the DLLSHDM-DR applies HybridNet for producing a collection of feature vectors. For retinal image classification, the DLLSHDM-DR technique exploits the Emperor Penguin Optimizer (EPO) with a Deep Recurrent Neural Network (DRNN). The application of the EPO algorithm assists in the optimal adjustment of the hyperparameters related to the DRNN model for DR detection showing the novelty of our work. To assuring the improved performance of the DLLSHDM-DR model, a wide range of experiments was tested on the EyePACS dataset. The comparison outcomes assured the better performance of the DLLSHDM-DR approach over other DL models.Keywords
The latest advancements in healthcare and machine learning can offer high-quality medical services to patients. In the past few years, the convergence of dominant ideas from the psychology, bioethics, medicine, and sociology fields has contributed to our understanding of the advantageous role of engaging patients in the medical data mining (MDM) procedure [1]. Many possible advantages of including patient in MDM involves improved concordance, greater self-efficacy, and higher satisfaction with their physician, reduced depression and anxiety [2]. Also, patients’ expectation about exercising choice in MDM was affected by socio-cultural factor and thus increased litigious practices and consumerist attitudes in society, resulting in the belief among medical personnel that patient is better placed to estimate the benefits and risks of alternate treatment [3]. MDM is a challenging task, the outcome of which is the interplay of many correlated features and not constraint to uncertainty in scientific studies. Since decision-making is influenced by various factors, it is prone to error [4]. Therefore, it is not surprising that some patient decisions might be at odds with the healthcare provider's recommendation, which makes shared decisions challenging for the implementation of medical practice.
Diabetes is a major cause of many diseases, namely stroke, heart, and foot problems, gum disease, nerve damage, etc., [5]. Also, the eye is the most important organ impacted by diabetes. The diabetic problem related to the eye is named Diabetic Retinopathy (DR), and it is the major cause of impaired vision, mainly in adults [6]. It damages the retina, a light-sensitive part of the eye, and might become the cause of impaired vision if it hasn’t been diagnosed at an earlier stage. Chances of suffering DR become high if the duration of having the disease is extensively over the threshold [7]. Automated diagnosis of the lesion might assist in earlier DR control of progression and monitoring optimally and effectively. During the past few years, researcher workers have put their effort into building an efficient technique where they could recognize distinct abnormalities by accomplishing high performance. But, extracting precise features is highly complicated [8].
Furthermore, the selection of precise machine learning (ML) algorithm at an earlier stage leads to better outcomes in DR earlier diagnosis and is considered the primary step of the ubiquitous solution. Each algorithm has its advantages and drawbacks, but in all stages, no technique could be considered superior [9]. In recent times, deep learning (DL) networks have accomplished considered interesting because of their strong abstract representation learning and capability to extract features automatically [10]. Similar to the ML algorithm, this model depends on learning from the data, but rather than utilizing hand-engineered features, which is a time-consuming and very difficult task, the DL technique provides various benefits like the exclusion of clumsy feature extraction methods and development in the performance of the training dataset.
This article introduces a Deep Learning Enabled Large Scale Healthcare Decision Making for Diabetic Retinopathy (DLLSHDM-DR) on Retinal Fundus Images. The proposed DLLSHDM-DR technique intends to assist physicians in the DR decision-making process. In the DLLSHDM-DR technique, image preprocessing is initially performed to improve the quality of the fundus image. Besides, the DLLSHDM-DR applies HybridNet to produce a collection of feature vectors. For retinal image classification, the DLLSHDM-DR technique exploits the Emperor Penguin Optimizer (EPO) with a Deep Recurrent Neural Network (DRNN). The application of the EPO algorithm assists in the optimal adjustment of the hyperparameters related to the DRNN model, which helps in accomplishing maximum classification results. To validate the enhanced performance of the DLLSHDM-DR approach, wide-ranging simulation analysis experiments were tested on the EyePACS dataset.
This section offers a detailed review of existing DR methods available in the literature. Sahoo et al. [11] provide a devised intellectual HRS utilizing the Restricted Boltzmann Machine (RBM)-DL technique that offers an insight into how big data analytics is employed for the application of potential health recommender’s engines and demonstrates chances for the healthcare sector for a transition from a conventional scenario to a highly personalized pattern in a telehealth atmosphere. In [12], a case study of utilizing CMC, which can be improved by DL and fuzzy rule induction to gain superior stochastic insights regarding epidemic advancement, can be tested. As a replacement for applying uniform and simplistic assumptions for an MC that becomes a usual practice, a DL-related CMC can be utilized in conjunction with fuzzy rule inducting approaches. Yahyaoui et al. [13] project a Decision Support System (DSS) for diabetes forecasting related to ML methods. The author compared traditional ML with DL methods. For classical ML algorithms, authors consider the typically utilized random forest (RF) and support vector machine (SVM). In contrast, for DL author used a fully convolutional neural network (CNN) for predicting and detecting diabetes patients.
Račić et al. [14] define the utility of ML techniques for processing chest X-ray images to support the process of decision-making and precise analysis. To be specific, the study focus on the use of the DL technique related to a convolutional neural network (CNN) for building a processing method. Rahman et al. [15] devise a B5G structure that supports coronavirus diagnosis, using the high-bandwidth and low-latency features of the 5G network at the edge. This structure uses a distributed DL pattern where every COVID-19 edge utilizes its individual local DL structure and employs a 3-stage reconciliation has the universal DL structure. Gumaei et al. [16] project an effectual multi-sensor-related structure for human activity detection utilizing a hybrid DL technique that integrates the gated recurrent units (GRUs) with simple recurrent units (SRUs) of neural networks (NN). The author uses the deep SRUs for processing the series of multimodal input datasets by utilizing the ability of its internal memory states. In addition, the author uses the deep GRUs for storing and learning that several past data can be sent to the upcoming state to solve instability or fluctuations in accurateness and disappearing gradient complexities. Subiksha [17] provides an application-related service share method for generalizing mapping and knowledge processing to integrate healthcare mechanisms. Depending on the method, a distributed DL structure was offered that readily compiles several systems and healthcare databases transparently.
In this study, a new DLLSHDM-DR system was established to assist physicians in the DR decision-making process. At an initial level, the DLLSHDM-DR approach performed image preprocessing to boost the image quality. Following this, the HybridNet technique was exploited for creating a group of feature vectors. Then, the DLLSHDM-DR technique used the DRNN model to perform image classification. Finally, the EPO algorithm is utilized for optimal hyperparameter selection of the DRNN method. Fig. 1 displays the block diagram of the DLLSHDM-DR algorithm.
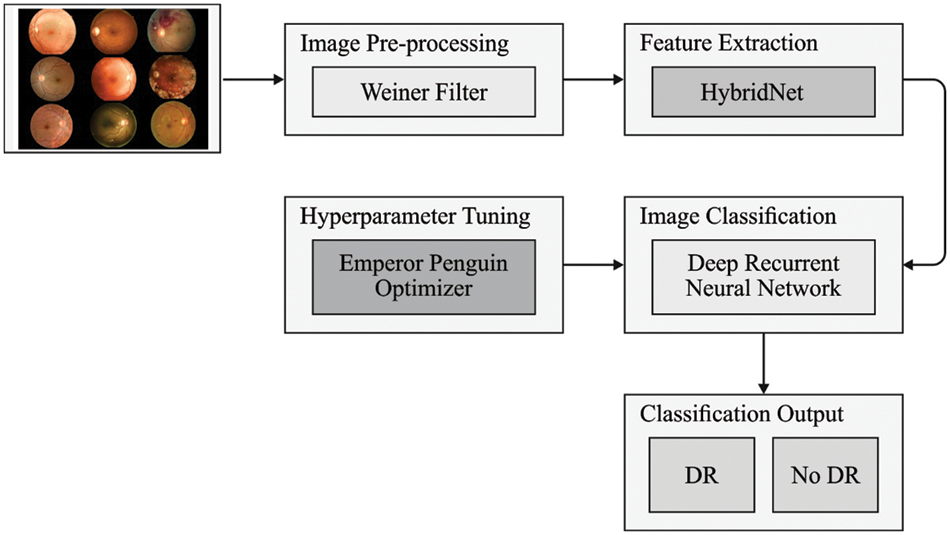
Figure 1: Block diagram of the DLLSHDM-DR approach
Firstly, the DLLSHDM-DR technique performed image preprocessing to boost the image quality. Wiener filter (WF) refers to a method that executes optimum trading, indulging noise smoothing and opposite filtering [18]. It eliminates the muddling and extra noises in the image and is also highly optimum about the mean squared fault, in which it eradicates the complete Mean Square Error in the functioning of the filtering approach for removing noises. WFs were described by the following:
a) Hypothesis: Image signal and additive noise were inactive linear random procedures comprising spectral features.
b) Necessity: The filter should achieve a noise removal process.
c) Performance criteria: It relies upon minimal Mean Square Errors.
3.2 Feature Extraction Using HybridNet
In this study, the HybridNet model is exploited to create a set of feature vectors. CNN is a multi-layer feed-forward neural network (FFNN), viz., generally comprised of 3 kinds of layers: fully connected (FC), convolutional, and pooling layers. The convolution and pooling layers extract the features of the input dataset via down-sampling operation and convolution calculation. Next, the FC layer accomplishes regression or classification tasks. The FC layer has a similar architecture and calculation model as the conventional FFNN [19].
Convolution Layer. This layer learns the feature of the input dataset via convolutional calculation. It is comprised of different mapping features. Every neuron of the mapping feature is interconnected with the local area of the preceding layer of the mapping feature via a group of weights known as the corresponding fields of the neuron, and the set of weights is named the convolutional kernels. The forward propagation of the CNN from
In Eq. (1),
Activation Layer. It is generally operable to execute a non-linear conversion on the output of convolutional calculation to attain a non-linear demonstration of the input dataset, thus enhancing the feature learning capability of the network. This layer widely applied in the CNN is a rectified linear unit (ReLU) function, and it is calculated as follows:
Now
To enhance the antinoise capability of the model, we apply the Exponential Linear Unit (ELU) activation function in the multi-scale convolutional structure that might accelerate the learning method and enhance the performance of the network. As well, it applies a saturation function in the negative part for making the ELU effective to noise, and it is calculated as follows:
In Eq. (3),
Pooling Layer. This layer is generally inserted between consecutive convolution layers in the structure of CNN. The aim is to considerably decrease the dimension of convolution layer output to decrease the parameter and calculation in the network and suppress over-fitting and execute secondary feature extraction. It is comprised of various mapping features, and it corresponds to the mapping feature of the preceding convolution layer sequentially without amending the number.
In Eq. (4),
In this study, the visual features of the input images are generated by the HybridNet mechanism [20]. In general, classification requires intra-class invariant features while reconstruction desires to retain every data. HybridNet includes the unsupervised path (
It is noteworthy that the eventual role of complementary reconstruction is to implement regularization for discriminatory encoding. The HybridNet method contains two data paths, namely a partial reconstruction and class prediction, that need to be incorporated. In this section, we overcome the shortcoming of proficiently training this model. It includes terms for classification with
As well it is followed by a branch complementarity training model. Each term is correspondingly weighted over
HybridNet structure is trained on partially labelled datasets, i.e., encompassed of unlabelled images
3.3 DR Classification Using DRNN Model
To classify the retinal fundus images for the existence of DR, the DRNN model is utilized in this study. The structure of Deep RNN classification has been elaborated in this section, which is employed in carrying out the sentiment classification of political reviews [21]. The
In Eq. (7),
In Eq. (8),
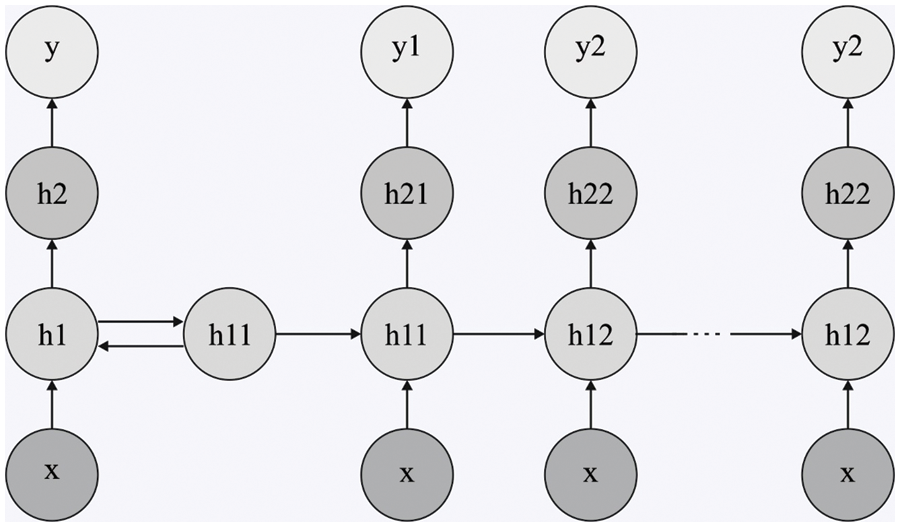
Figure 2: Structure of DRNN
For making the classification simple, consider
Now,
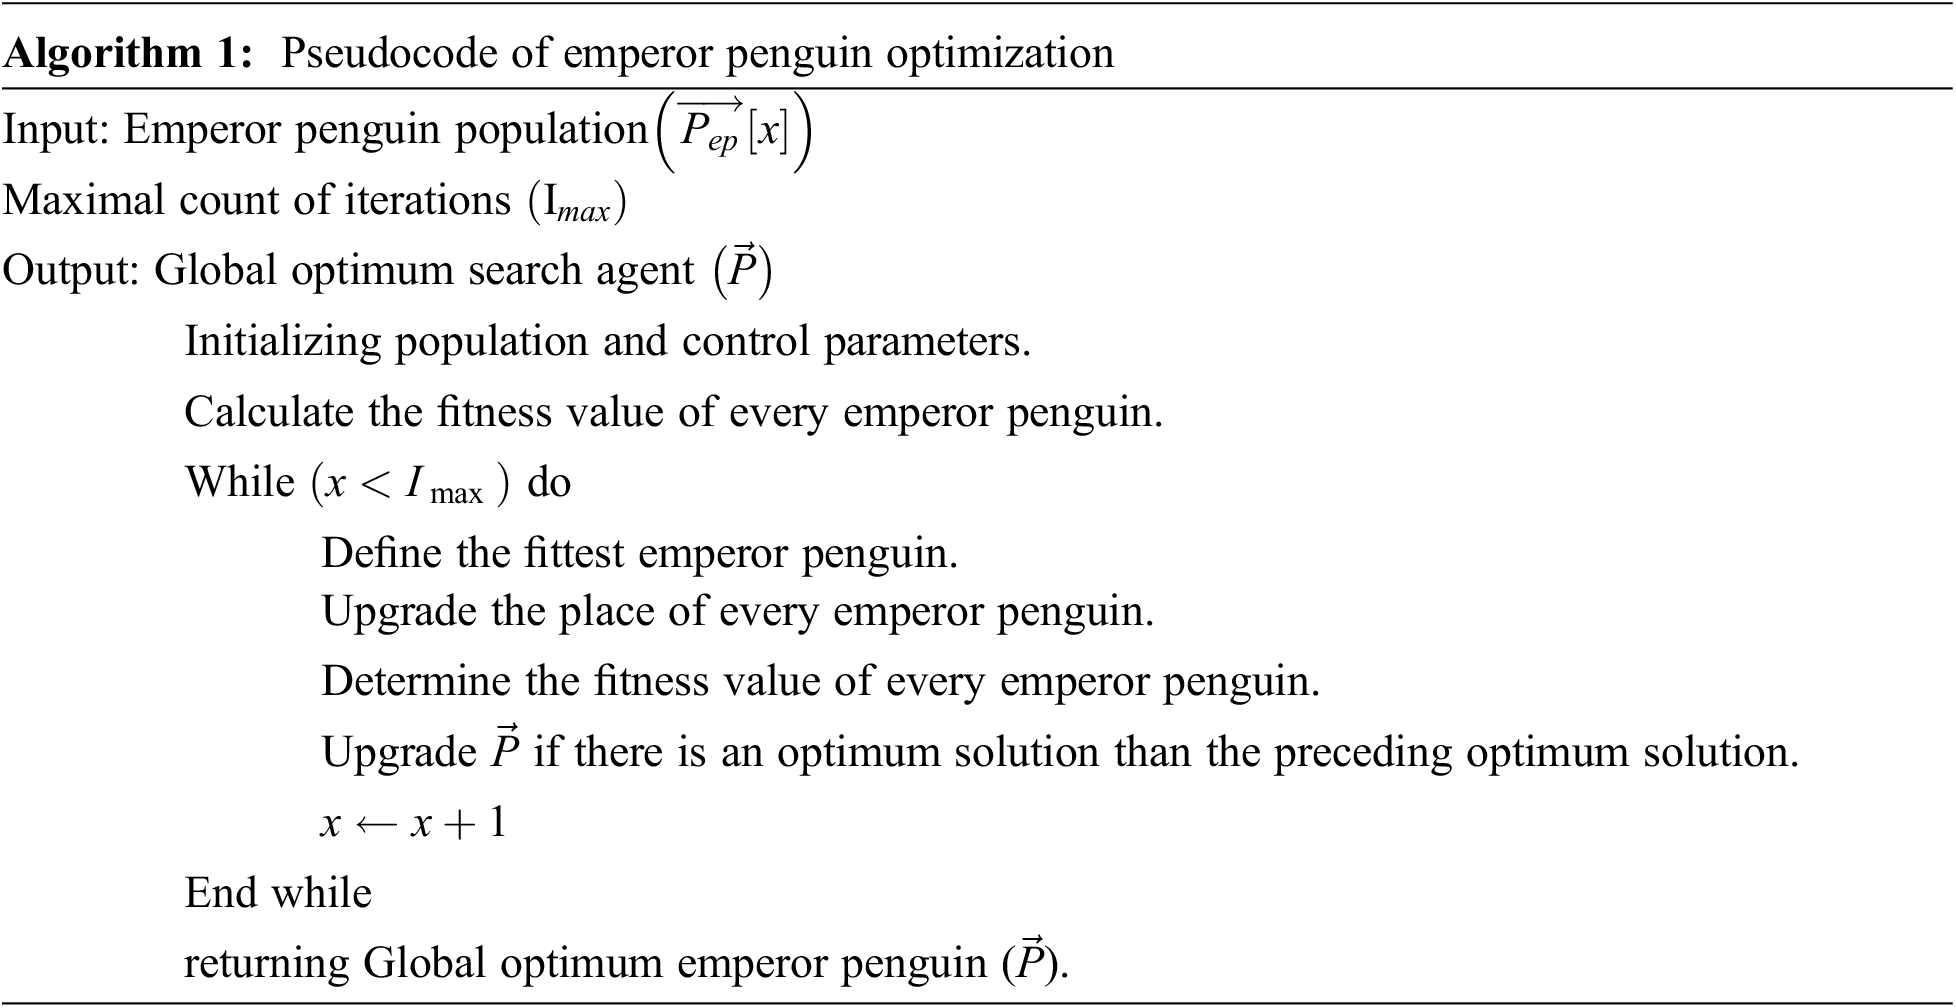
3.4 Hyperparameter Optimization Using EPO Algorithm
In the final stage, the EPO algorithm is utilized for optimal hyperparameter tuning of the DRNN model. Emperor penguins (EP) are considered social animals, and they perform many different activities, like hunting mainly for living and foraging in groups [22]. In extreme winter, they huddle to survive. At the time of huddling, every penguin ensemble in their social behaviour gives a mutual sense of unity.
The huddling behaviour of the penguins is summarized below:
• Produce and determine the huddling domain.
• Evaluate the temperature.
• Consider every penguin's distance.
• Reposition the validated mover.
Modelling can be mainly performed for identifying the actual mover. The huddle shape is represented by L shape plane of the polygon. The huddle boundary is calculated if effectiveness is discovered.
Huddling is used to map the behaviours of EPs. During huddling, a minimum of two penguins are approached. The huddling boundary can be defined by the direction and speed of wind flow. The mathematical expression of the huddling boundary is given as follows:
The wind velocity is signified as
The vector
The imaginary constant is denoted as ‘i’, and the function of the polygon plane is signified by
The huddling action can be performed by the EPs that surge the temperature of the huddle to conserve its energy,
The time required for finding an optimum solution is denoted by
Once the huddling boundary is discovered then, the EPs distance is computed. The maximum fitness value solution is regarded as an optimal solution. The position of the search agent is updated concerning the optimum solution.
The position updating process can be mathematically given in the following:
Now, the distance is represented as
Let, Pgrid (Acc) be the accuracy, and Rand
The function
The expression function is represented by
By utilizing the mover, the EPs location can be upgraded. The movement of other searches is led by considering the optimal solution in a search space. To find the next location of EP following equation is applied:
EP’s updated location is denoted by
This section investigates the DR classification performance of the DLLSHDM-DR model on the Kaggle dataset (available at https://www.kaggle.com/c/diabetic-retinopathy-detection). The dataset comprises 2471 samples with two classes, namely healthy and unhealthy, as depicted in Table 1.
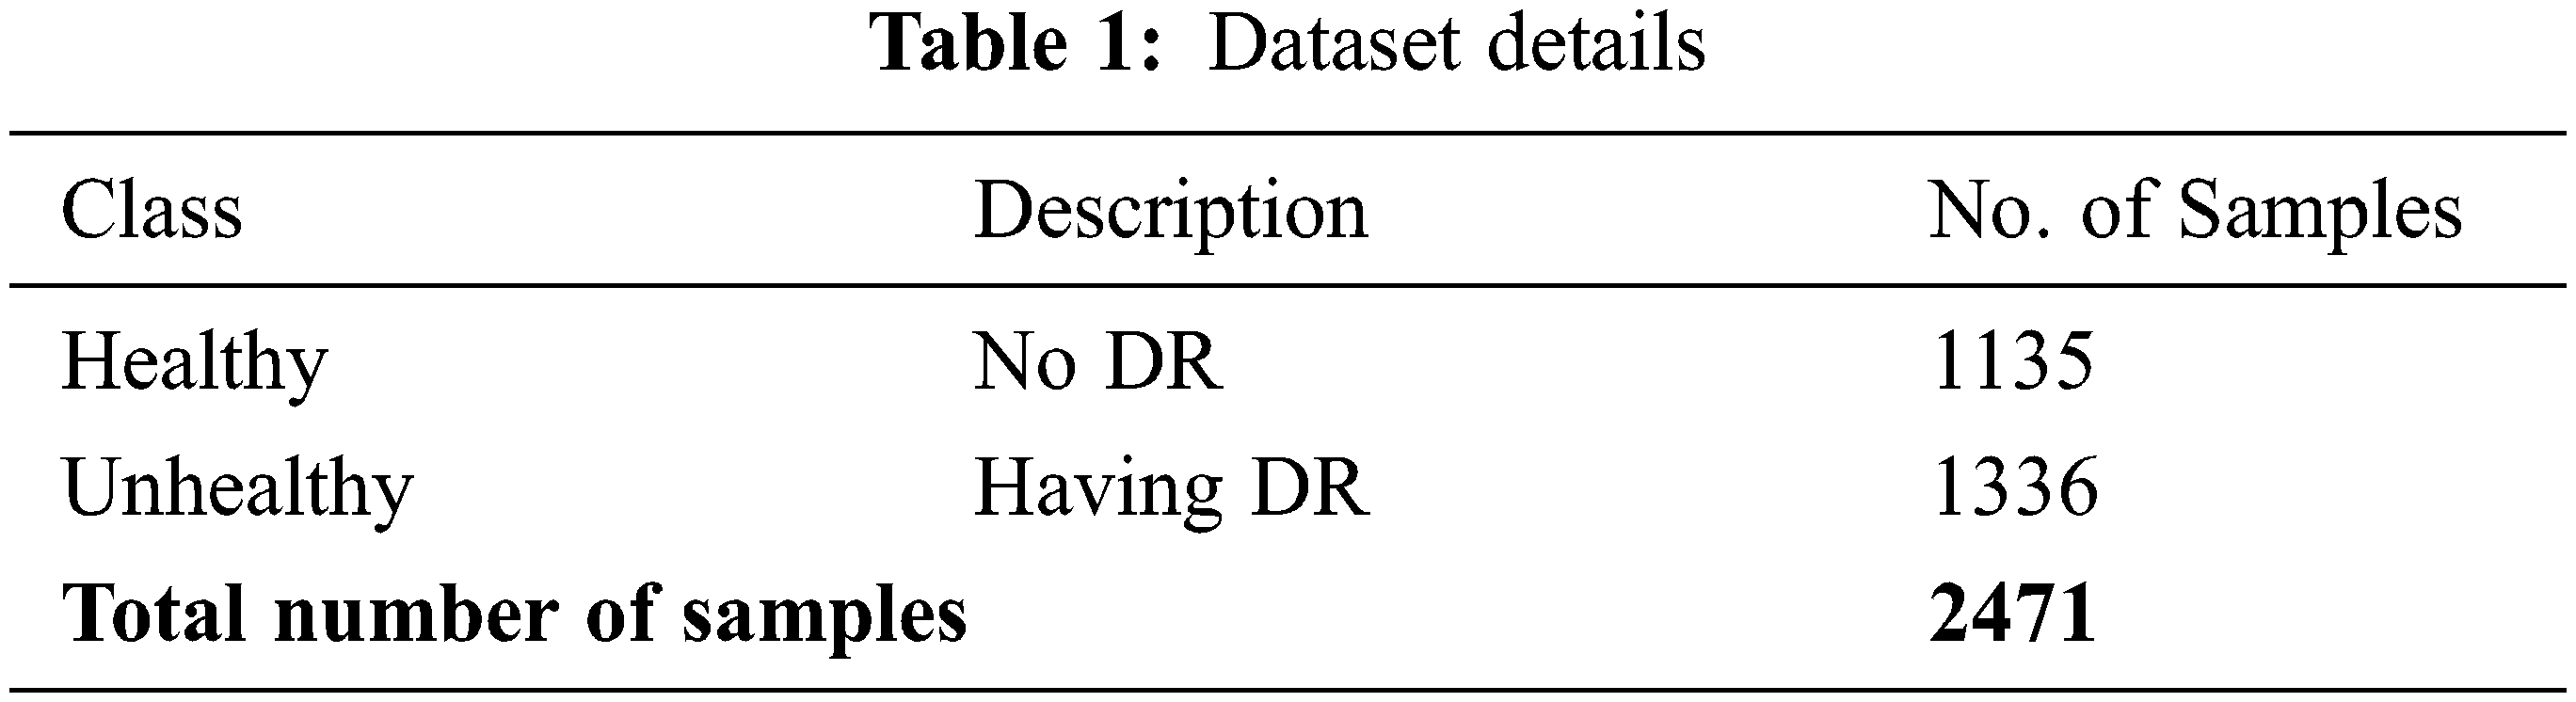
Fig. 3 exemplifies the confusion matrices created by the DLLSHDM-DR approach on the Kaggle dataset. With 80% of training (TR) data, the DLLSHDM-DR model has classified 899 fundus images into healthy and 1035 fundus images into unhealthy classes. In the meantime, with 20% of testing (TS) data, the DLLSHDM-DR approach has classified 213 fundus images into healthy and 280 fundus images into unhealthy classes. Concurrently, with 70% of TR data, the DLLSHDM-DR methodology has classified 774 fundus images into healthy and 921 fundus images into unhealthy classes. Simultaneously, with 30% of TS data, the DLLSHDM-DR system has classified 335 fundus images into healthy and 399 fundus images into unhealthy classes.
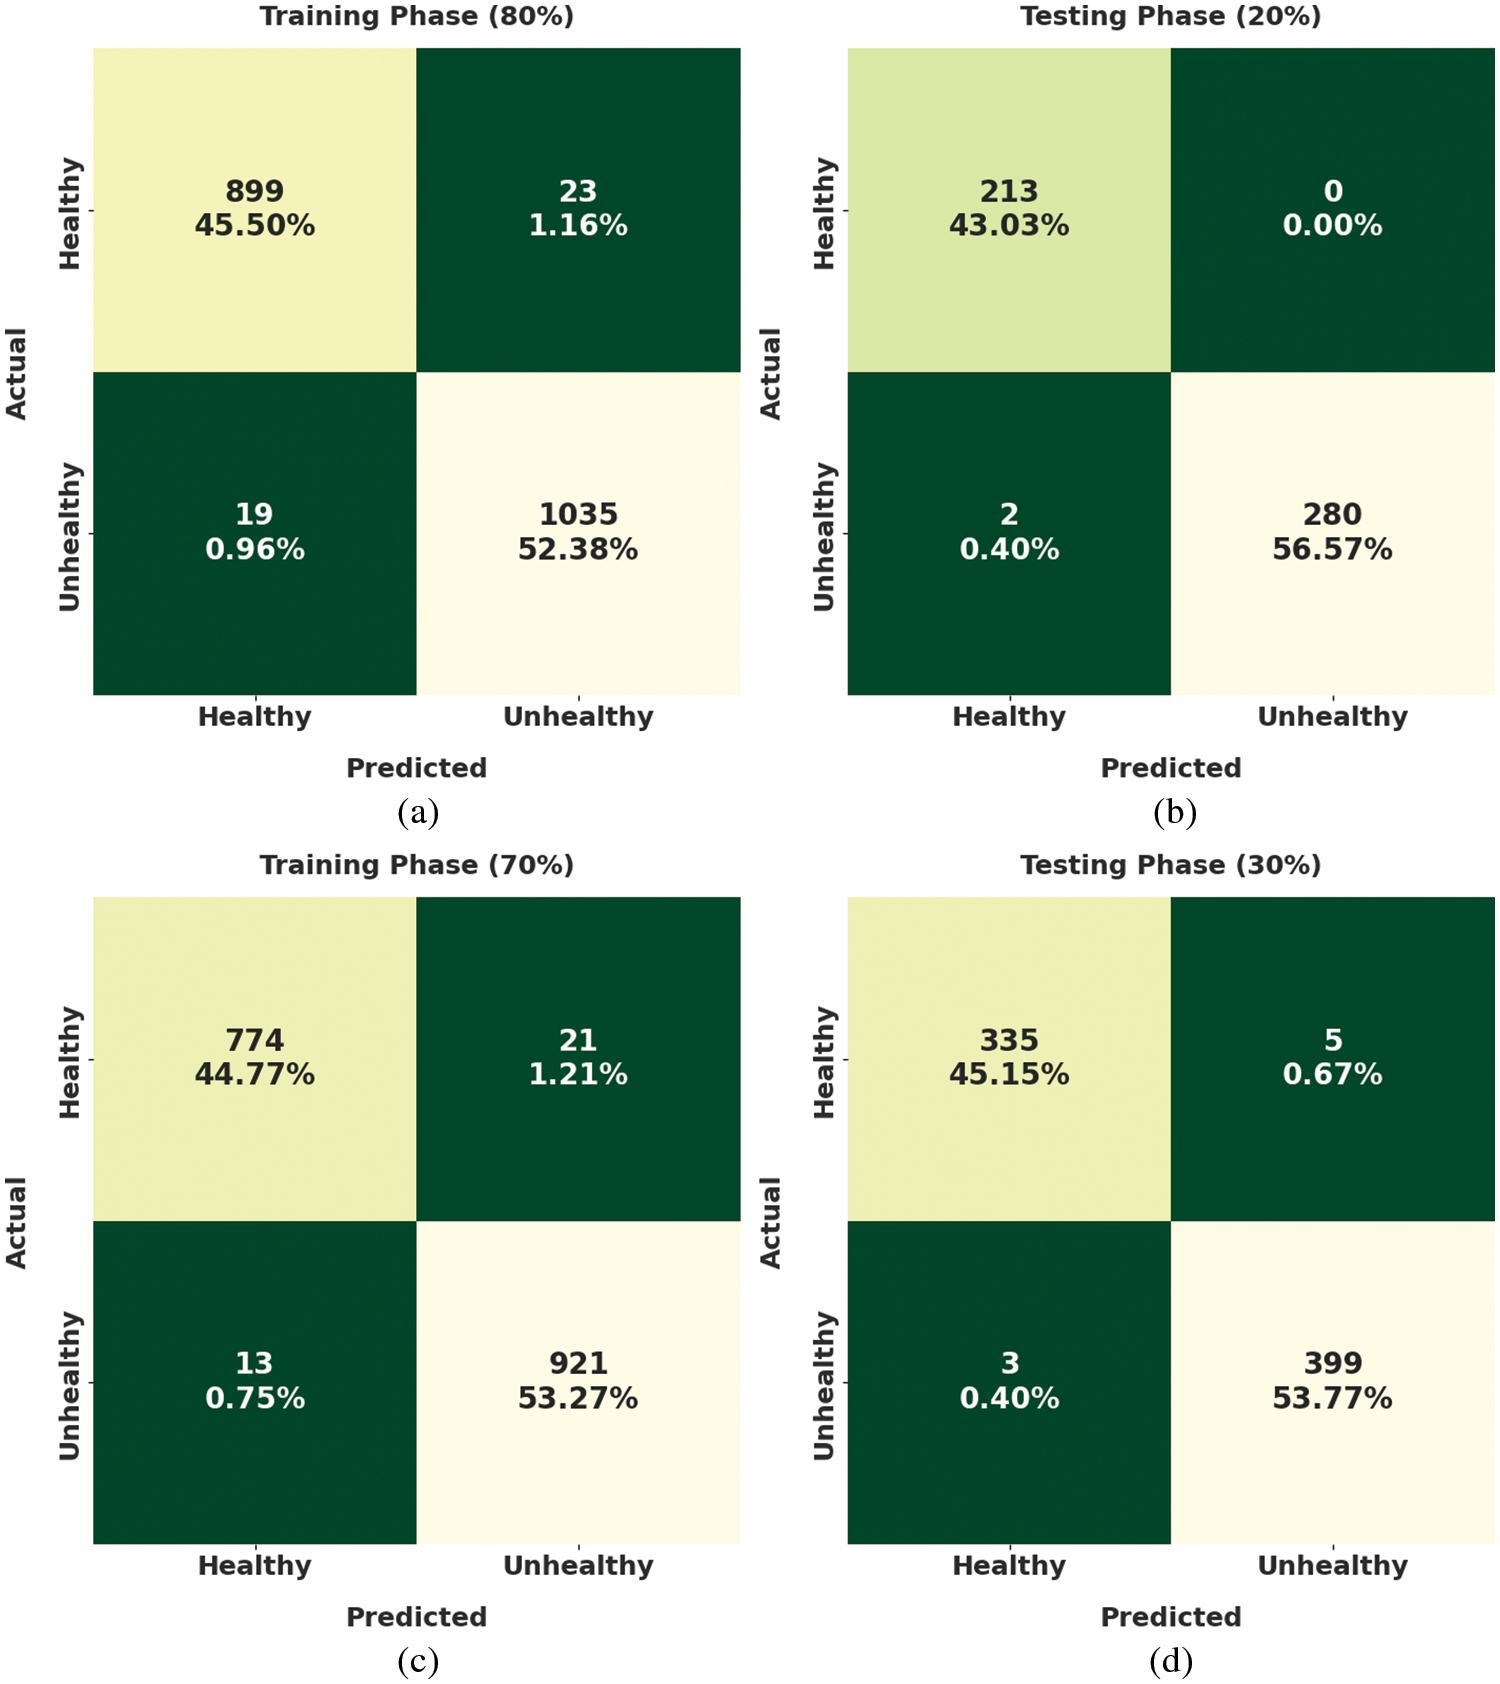
Figure 3: Confusion matrices of DLLSHDM-DR approach (a) 80% of TR data, (b) 20% of TS data, (c) 70% of TR data, and (d) 30% of TS data
Table 2 and Fig. 4 provide an overall DR classification outcome of the DLLSHDM-DR model. Fig. 4 examines the DR results obtainable by the DLLSHDM-DR model on 80% of TR data. The DLLSHDM-DR model has recognized images under healthy class with
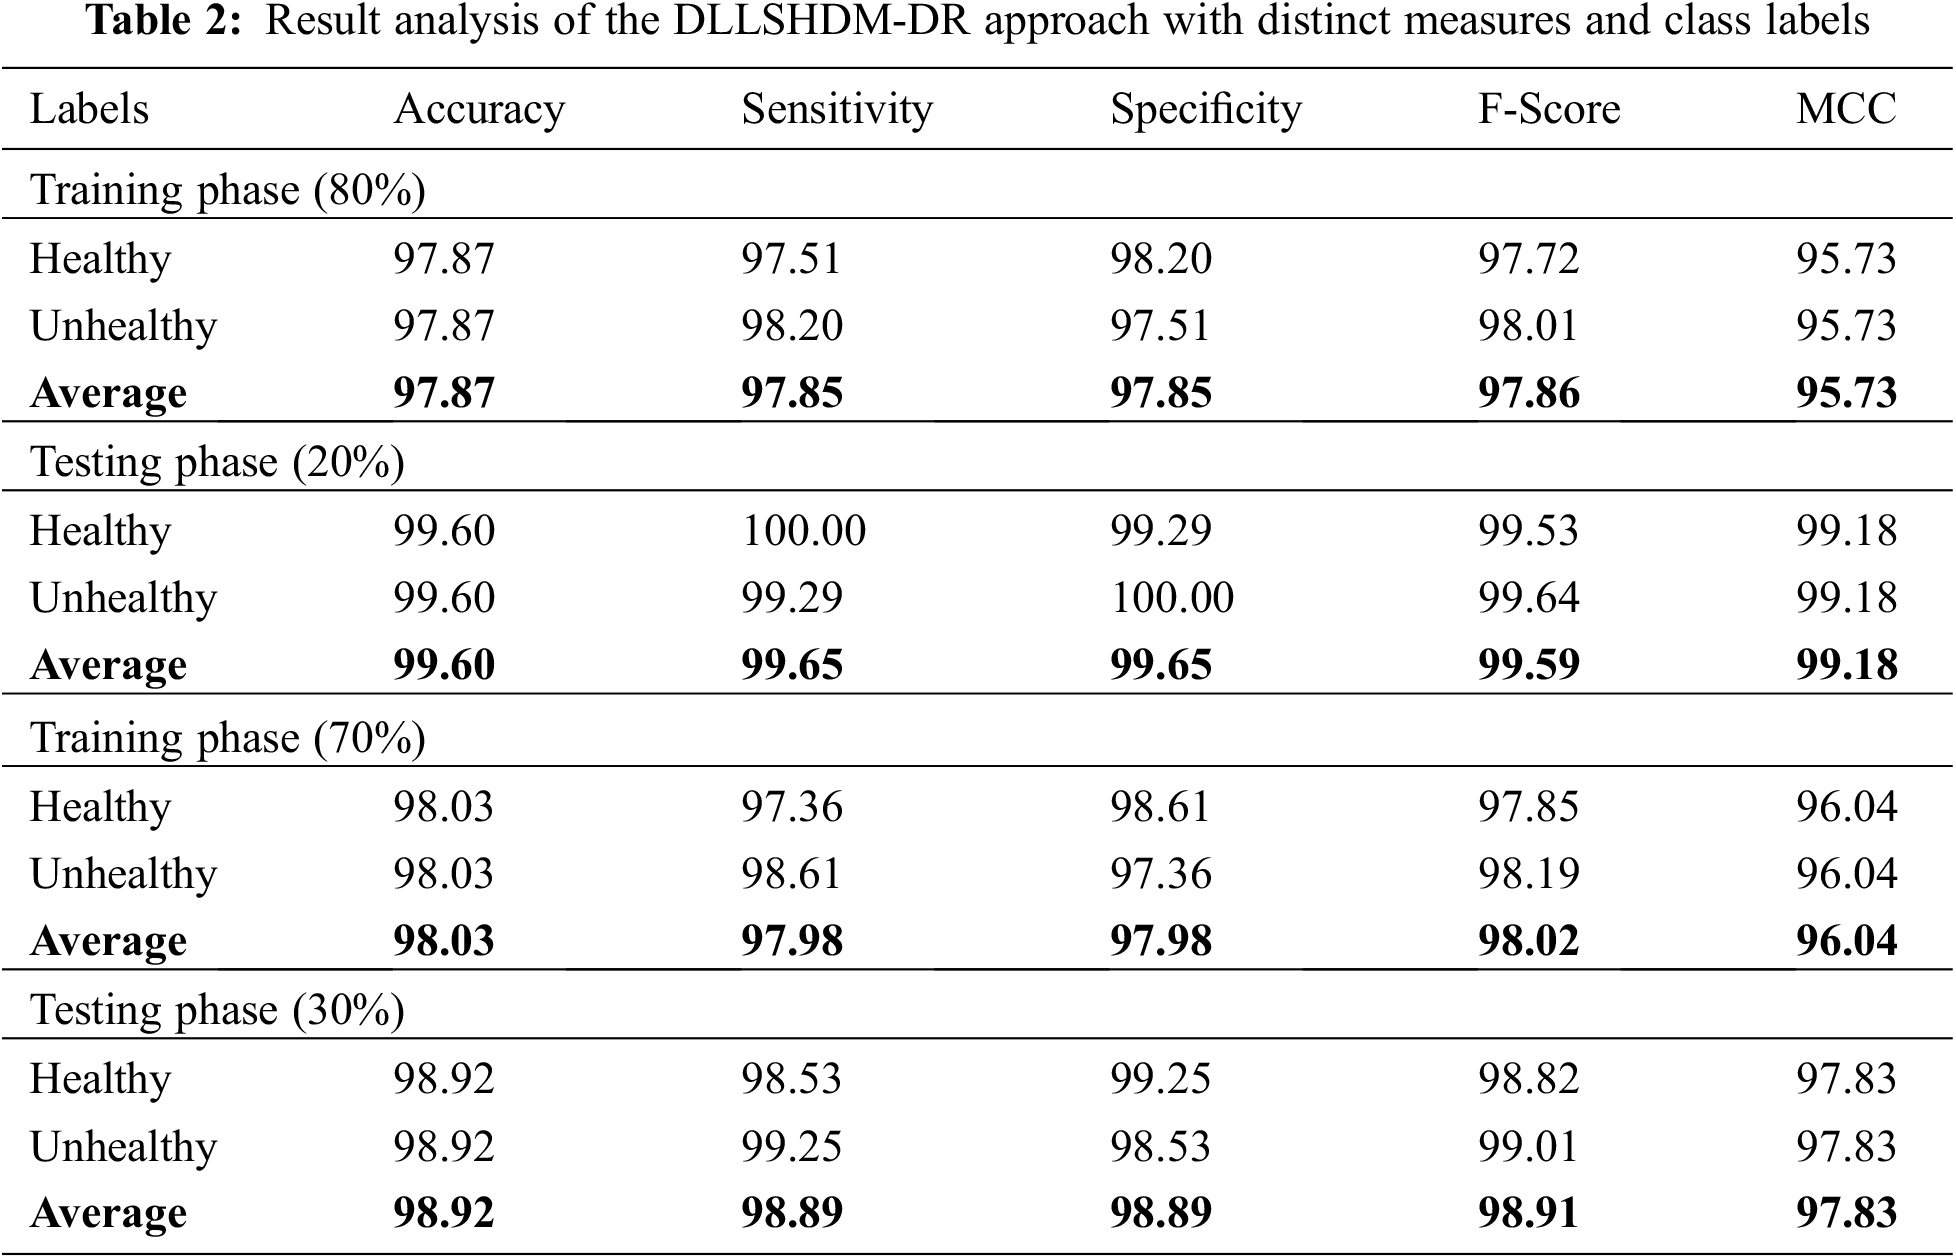

Figure 4: Result analysis of DLLSHDM-DR approach under 80% of TR data
Fig. 5 examines the DR results obtainable by the DLLSHDM-DR model on 20% of TS data. The DLLSHDM-DR approach has recognized images under healthy class with

Figure 5: Result analysis of DLLSHDM-DR approach under 20% of TS data
Fig. 6 scrutinizes the DR results offered by the DLLSHDM-DR technique on 70% of TR data. The DLLSHDM-DR methodology has recognized images under healthy class with

Figure 6: Result analysis of DLLSHDM-DR approach under 70% of TR data
Fig. 7 demonstrates the DR results presented by the DLLSHDM-DR model on 30% of TS data. The DLLSHDM-DR system has recognized images under healthy class with

Figure 7: Result analysis of DLLSHDM-DR approach under 30% of TS data
The training accuracy (TRA) and validation accuracy (VLA) realized by the DLLSHDM-DR algorithm on the test dataset is depicted in Fig. 8. The experimental result stated that the DLLSHDM-DR system had accomplished improved values of TRA and VLA. Mostly the VLA looked that longer than TRA.

Figure 8: TRA and VLA analysis of the DLLSHDM-DR approach
The training loss (TRL) and validation loss (VLL) accomplished by the DLLSHDM-DR algorithm on the test dataset are depicted in Fig. 9. The experimental result demonstrated that \ the DLLSHDM-DR system had achieved minimal values of TRL and VLL. In certain, the VLL is lesser than TRL.

Figure 9: TRL and VLL analysis of the DLLSHDM-DR approach
Fig. 10 depicts a comparative

Figure 10:
Fig. 11 showcases a comparative

Figure 11:
In this study, a novel DLLSHDM-DR system was established to assist physicians in the DR decision-making process. At an initial level, the DLLSHDM-DR system performed image preprocessing to boost the image quality. Following this, the HybridNet approach was exploited to create a group of feature vectors. Then, the DLLSHDM-DR technique used the DRNN model to perform image classification. Finally, the EPO algorithm is utilized for optimal hyperparameter selection of the DRNN technique. The application of the EPO algorithm assists in the optimal adjustment of the hyperparameters related to the DRNN model which helps in accomplishing maximum classification outcomes. To assuring the improved performance of the DLLSHDM-DR model, a wide range of experiments was tested on the EyePACS dataset. The comparison outcomes assured the better performance of the DLLSHDM-DR methodology over other DL models with maximum accuracy of 99.6%. In the future, the performance of the proposed model can be improved by deep instance segmentation models.
Funding Statement: The Deanship of Scientific Research (DSR) at King Abdulaziz University (KAU), Jeddah, Saudi Arabia has funded this project, under grant no KEP-4-120-42.
Conflicts of Interest: The authors declare that they have no conflicts of interest to report regarding the present study.
References
1. S. C. Huang, A. Pareek, S. Seyyedi, I. Banerjee and M. P. Lungren, “Fusion of medical imaging and electronic health records using deep learning: A systematic review and implementation guidelines,” Nature Partner Journals Digital Medicine, vol. 3, no. 1, pp. 1–9, 2020. [Google Scholar]
2. B. Saravi, F. Hassel, S. Ülkümen, A. Zink, V. Shavlokhova et al., “Artificial intelligence-driven prediction modeling and decision making in spine surgery using hybrid machine learning models,” Journal of Personalized Medicine, vol. 12, no. 4, pp. 509, 2022. [Google Scholar]
3. L. Saba, M. Biswas, V. Kuppili, E. C. Godia, H. S. Suri et al., “The present and future of deep learning in radiology,” European Journal of Radiology, vol. 114, no. 3, pp. 14–24, 2019. [Google Scholar]
4. T. Grote and P. Berens, “On the ethics of algorithmic decision-making in healthcare,” Journal of Medical Ethics, vol. 46, no. 3, pp. 205–211, 2020. [Google Scholar]
5. M. Sendak, M. C. Elish, M. Gao, J. Futoma, W. Ratliff et al., “The human body is a black box supporting clinical decision-making with deep learning,” in Proc. Conf. on Fairness, Accountability, and Transparency, Barcelona Spain, pp. 99–109, 2020. [Google Scholar]
6. E. Begoli, T. Bhattacharya and D. Kusnezov, “The need for uncertainty quantification in machine-assisted medical decision making,” Nature Machine Intelligence, vol. 1, no. 1, pp. 20–23, 2019. [Google Scholar]
7. D. Chen, S. Liu, P. Kingsbury, S. Sohn, C. B. Storlie et al., “Deep learning and alternative learning strategies for retrospective real-world clinical data,” Nature Partner Journals Digital Medicine, vol. 2, no. 1, pp. 1–5, 2019. [Google Scholar]
8. Z. Guo, X. Li, H. Huang, N. Guo and Q. Li, “Deep learning-based image segmentation on multimodal medical imaging,” IEEE Transactions on Radiation and Plasma Medical Sciences, vol. 3, no. 2, pp. 162–169, 2019. [Google Scholar]
9. B. H. van der Velden, H. J. Kuijf, K. G. Gilhuijs and M. A. Viergever, “Explainable artificial intelligence (XAI) in deep learning-based medical image analysis,” Medical Image Analysis, vol. 79, pp. 102470, 2022. [Google Scholar]
10. M. H. Olya, H. Badri, S. Teimoori and K. Yang, “An integrated deep learning and stochastic optimization approach for resource management in team-based healthcare systems,” Expert Systems with Applications, vol. 187, no. 4, pp. 115924, 2022. [Google Scholar]
11. A. K. Sahoo, C. Pradhan, R. K. Barik and H. Dubey, “DeepReco: Deep learning based health recommender system using collaborative filtering,” Computation, vol. 7, no. 2, pp. 25, 2019. [Google Scholar]
12. S. J. Fong, G. Li, N. Dey, R. G. Crespo and E. Herrera-Viedma, “Composite Monte Carlo decision making under high uncertainty of novel coronavirus epidemic using hybridized deep learning and fuzzy rule induction,” Applied Soft Computing, vol. 93, no. 1, pp. 106282, 2020. [Google Scholar]
13. A. Yahyaoui, A. Jamil, J. Rasheed and M. Yesiltepe, “A decision support system for diabetes prediction using machine learning and deep learning techniques,” in 1st Int. Informatics and Software Engineering Conf. (UBMYK), Ankara, Turkey, pp. 1–4, 2019. [Google Scholar]
14. L. Račić, T. Popović and S. Šandi, “Pneumonia detection using deep learning based on convolutional neural network,” in 25th Int. Conf. on Information Technology (IT), Zabljak, Montenegro, pp. 1–4, 2021. [Google Scholar]
15. M. A. Rahman, M. S. Hossain, N. A. Alrajeh and N. Guizani, “B5G and explainable deep learning assisted healthcare vertical at the edge: COVID-I9 perspective,” IEEE Network, vol. 34, no. 4, pp. 98–105, 2020. [Google Scholar]
16. A. Gumaei, M. M. Hassan, A. Alelaiwi and H. Alsalman, “A hybrid deep learning model for human activity recognition using multimodal body sensing data,” IEEE Access, vol. 7, pp. 99152–99160, 2019. [Google Scholar]
17. K. P. Subiksha, “Improvement in analyzing healthcare systems using deep learning architecture,” in 2018 4th Int. Conf. on Computing Communication and Automation (ICCCA), Greater Noida, India, pp. 1–4, 2018. [Google Scholar]
18. N. Kumar and M. Nachamai, “Noise removal and filtering techniques used in medical images,” Oriental Journal of Computer Science and Technology, vol. 10, no. 1, pp. 103–113, 2017. [Google Scholar]
19. A. El-Sawy, M. Loey and H. El-Bakry, “Arabic handwritten characters recognition using convolutional neural network,” WSEAS Transactions on Computer Research, vol. 5, no. 1, pp. 11–19, 2017. [Google Scholar]
20. T. Robert, N. Thome and M. Cord, “Hybridnet: Classification and reconstruction cooperation for semi-supervised learning,” in Proc. of the European Conf. on Computer Vision (ECCV), Glasgow, UK, pp. 153–169, 2018. [Google Scholar]
21. M. Z. Uddin, M. M. Hassan, A. Alsanad and C. Savaglio, “A body sensor data fusion and deep recurrent neural network-based behavior recognition approach for robust healthcare,” Information Fusion, vol. 55, no. 4, pp. 105–115, 2020. [Google Scholar]
22. H. Jia, K. Sun, W. Song, X. Peng, C. Lang et al., “Multi-strategy emperor penguin optimizer for RGB histogram-based color satellite image segmentation using Masi entropy,” IEEE Access, vol. 7, pp. 134448–134474, 2019. [Google Scholar]
23. W. L. Alyoubi, M. F. Abulkhair and W. M. Shalash, “Diabetic retinopathy fundus image classification and lesions localization system using deep learning,” Sensors, vol. 21, no. 11, pp. 3704, 2021. [Google Scholar]
Cite This Article
 Copyright © 2023 The Author(s). Published by Tech Science Press.
This work is licensed under a Creative Commons Attribution 4.0 International License , which permits unrestricted use, distribution, and reproduction in any medium, provided the original work is properly cited.
 Downloads
 Citation Tools