
 Submit a Paper
 Propose a Special lssue
 Open Access
ARTICLE

Cardiac CT Image Segmentation for Deep Learning–Based Coronary Calcium Detection Using K-Means Clustering and Grabcut Algorithm
1 Department of Software Convergence, Soonchunhyang University, Asan, 31538, Korea
2 Department of Computer Science, Kennesaw State University, Marietta, 30144, GA, USA
3 Department of Computer Software Engineering, Soonchunhyang University, Asan, 31538, Korea
* Corresponding Author: Min Hong. Email:
Computer Systems Science and Engineering 2023, 46(2), 2543-2554. https://doi.org/10.32604/csse.2023.037055
Received 21 October 2022; Accepted 29 December 2022; Issue published 09 February 2023
 View Full Text
 Download PDF
Abstract
Specific medical data has limitations in that there are not many numbers and it is not standardized. to solve these limitations, it is necessary to study how to efficiently process these limited amounts of data. In this paper, deep learning methods for automatically determining cardiovascular diseases are described, and an effective preprocessing method for CT images that can be applied to improve the performance of deep learning was conducted. The cardiac CT images include several parts of the body such as the heart, lungs, spine, and ribs. The preprocessing step proposed in this paper divided CT image data into regions of interest and other regions using K-means clustering and the Grabcut algorithm. We compared the deep learning performance results of original data, data using only K-means clustering, and data using both K-means clustering and the Grabcut algorithm. All data used in this paper were collected at Soonchunhyang University Cheonan Hospital in Korea and the experimental test proceeded with IRB approval. The training was conducted using Resnet 50, VGG, and Inception resnet V2 models, and Resnet 50 had the best accuracy in validation and testing. Through the preprocessing process proposed in this paper, the accuracy of deep learning models was significantly improved by at least 10% and up to 40%.Keywords
The increase in life expectancy resulting from the advance in the economy and technology worldwide is bringing about a steady increase in the world’s population. Recent trends in research on demographics are constantly increasing interest in the demographic characteristics of low birth rate and aging population and the impact of aging on the economy and society [1]. In particular, in the case of an aging population, theoretical discussions are currently taking place with a focus on tax burden, early retirement, economic growth, and distribution. With the continued growth in the elderly population, there has also been increasing interest in related diseases.
The United Nations uses the ratio of the population over 65 to the total population, and if the ratio of the population over 65 is 7% or more, it is classified as an elderly population. Countries with an elderly population can be further subdivided and defined as a super-aged society if the proportion of the elderly population is more than 20%, an aged society if it is 14% to 20%, and an aging society if it is 7% to 14%. In 2000, Korea was classified as an aged population, with 7.3% of the population being over 65. With the continued growth in the elderly population, there has also been increasing interest in related diseases.
These diseases include high blood pressure, diabetes, stroke, Parkinson’s disease, hypercholesterolemia, and heart failure. According to the World Health Organization (WHO), cardiovascular disease accounts for a very high percentage of these deaths, with 17.9 million people dying from cardiovascular disease in 2019, thus accounting for 32% of deaths worldwide. Among them, 85% died due to cardiovascular and stroke [2]. Cancer is still the number one cause of death in Korea, but the second leading cause of death is death from heart disease. In 2020, there were 228,915 heart failure patients in Korea. This may be due to the variables that are selected as the causes of various diseases, such as drinking and smoking, and the negative effects accumulated from daily eating habits.
To analyze these heart diseases, pictures are taken through CT or MRI, then read by an imaging specialist. However, these methods are time-consuming due to the lack of reading specialists. To solve this problem, in this paper, we decided to study a data analysis method using deep learning. Artificial Neural Network technology, which was first developed in 1943, has been extensively developed through several dark ages. Initially, the biggest problem with artificial neural network learning was that the learning layer could not be deepened and sufficient computational power was not secured.
In 2012, AlexNet, a deep neural network made by stacking multiple layers of convolutional neural networks, began to gain attention in the computer vision field as it performed better than humans in the ImageNet classification contest. This neural network learning technique came to be called deep learning [3,4]. Currently, deep learning technology is applied to various fields of medical imaging, and it is used in various forms, such as classifying medical images according to specific diseases, locating lesions, and segmenting organs [5–8]. In this paper, by learning chest CT on a deep learning model, calcified data and normal data were distinguished.
This study was conducted with IRB approval (SCHCA20202025-HE001) for an AI-based cardiovascular disease diagnosis study at Soonchunhyang University Cheonan Hospital to apply patients’ CT images to deep learning training. For the CT image training data used in deep learning, about 2,400 images from 177 individuals provided by Soonchunhyang University Cheonan Hospital were used. To apply the CNN model to the entire provided data, training was performed by classifying it into 1,200 CT images including calcium regions and 1,200 CT images indicating normal cardiovascular function.
The CNN model, which is widely used for image classification, has undergone rapid developments due to the recent rapid increase in big data and the improvement of GPU processing speed. Data has been collected in several studies [9–11]. Animal photos, fruit photos, and human data for identifying people’s bones, which were easy to collect in the early stages, were easily collected by ordinary people, and the number of data could be increased without any restrictions. However, for medical data, the types of hardware and software currently used by each hospital are different, the cooperation structure of each hospital is different, and the laws applicable to medical and other data are different in each country, so it is difficult to share, and the number of patients to collect is also limited. Therefore, it is very difficult to collect data. In this context, research on data augmentation and preprocessing has proceeded in many places [12–17].
Ritter et al. [18] found that unlike general image processing, which has a main purpose, such as enhancing the aesthetics of an image or creating art, the sole purpose of medical image processing is to improve the interpretability of the depicted content, thus resulting in increased accuracy of the results; improving accuracy is the ultimate goal. We determined that this could include not only automatic or manual extraction of information but it could also work to enhance the image itself to raise awareness of specific functions, so pre-processing was performed using various software programs.
Chanda et al. [19] emphasized the influence of uncertainty in intuitive fuzzy sets and improved robustness against noise by first generating an intuitive fuzzy set and determining the initial clustering center based on grayscale features. To more accurately measure the distance between the data and the cluster center, an improved nonlinear kernel function that maps the data to the kernel space is proposed, and local gray information measurement that simultaneously considers grayscale feature and spatial location information are introduced.
Ning et al. [20] proposed removing noise in medical images based on the median filter method. A traditional median filter and an adaptive median filter were implemented. Simulation results of the two methods can eliminate the noise in MRI and CT medical images and preserve the detail information of the objects. The two filtering algorithms have been used in the VE system, and they provide valuable data for tissue segmentation and reconstruction.
Martin et al. [21] proposed a study focused on the evaluation of a deep learning-based automatic coronary calcium scoring algorithm using data gathered from 511 patients from 2014 to 2018. All data were collected on a dual-source CT scanner (SOMATOM Force, Siemens Healthineers, Erlangen, Germany). Deep learning-based automated calcium analysis was performed using a prototype proposed by Martin (Automated Scoring Siemens Healthineers) based on a neural network with Resnet architecture and a fully connected neural network for spatial coordinate functions. They used Hounsfield units and trained on 2,000 datasets. Accuracy was determined according to CACS. At (0, 1–10, 11–100, 101–400, and >400), the respective accuracies were (94.9%, 73.5%, 95.6%, 98.3%, and 92.3%). A limitation of this paper is that most of the data are data from non-calcified normal people.
In this paper, we studied the CNN models that are currently popularly used by supplementing the problems that occur when processing data such as images or videos using a Deep Neural Network (DNN).
The VGG network was introduced in a paper [22] published by Oxford researchers in 2014, and it achieved second place in the ILSVRC 2014 competition. VGG is a basic CNN composed of a convolutional layer and a pooling layer, and it continuously passes through a convolutional layer using a small 3 × 3 filter. The process of reducing the size by half is repeated by placing the convolutional layers in succession. Unlike Alexnet, the convolutional layer is unified as 3 × 3, which means that it can learn deeper with fewer parameters. If the convolution layer is 5 × 5, 25 parameters are generated even though this layer has been passed through once. However, if you go through it twice in 3 × 3, it was judged that it is an appropriate model to have 18 parameters and enable deeper learning. However, when comparing VGG 16 and VGG 19, research results showed that there was almost no difference, and based on this, we selected VGG 16. There was also a problem with this VGG, but the deeper it was learned, the more gradient vanishing occurred, which caused a learning problem. The basic structure of VGG used in this paper is shown in Fig. 1.
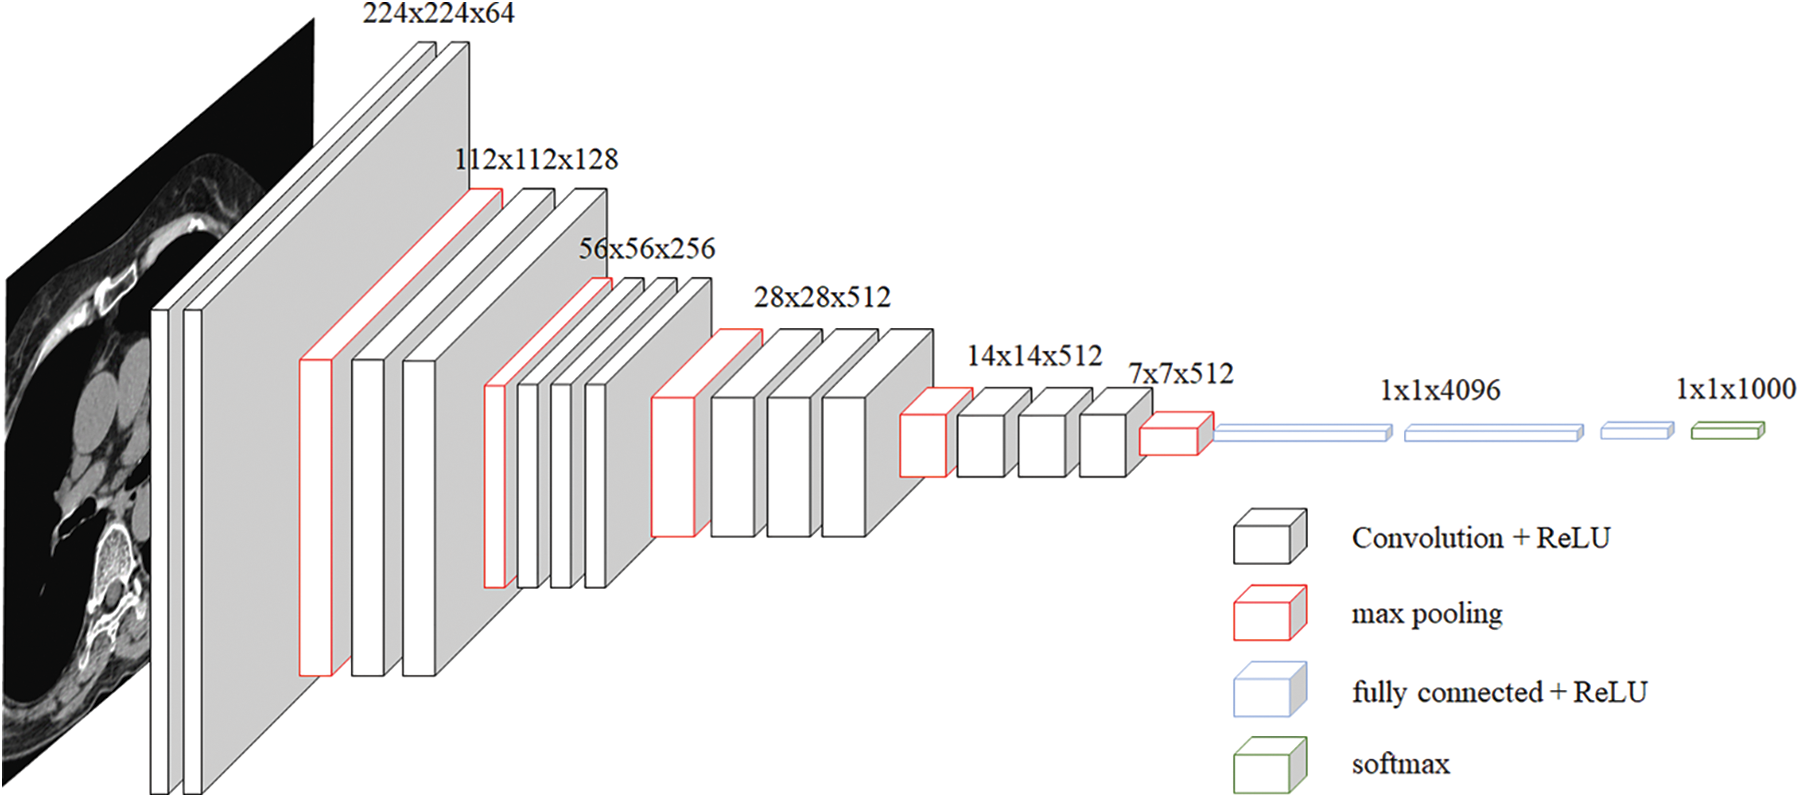
Figure 1: VGG architecture
Resnet is a network developed by a team belonging to Microsoft, and some blocks can be stacked more deeply [23]. In general, deepening the layer is known to help improve performance, but there are cases where performance is rather poor. To solve this problem, the concept of the residual block was introduced. As shown in Fig. 2, the Conv layer is skipped for the input x and directly connected to the output. Without such a fast path, the output of the two convolutional layers should be F(x), but the output through the fast path should be F(x) + x. This helps efficiently operate learning even if the layers are deep. Among the Resnet networks, this paper used Resnet 50. We tried using a deeper model, but our hardware could not maintain this model.
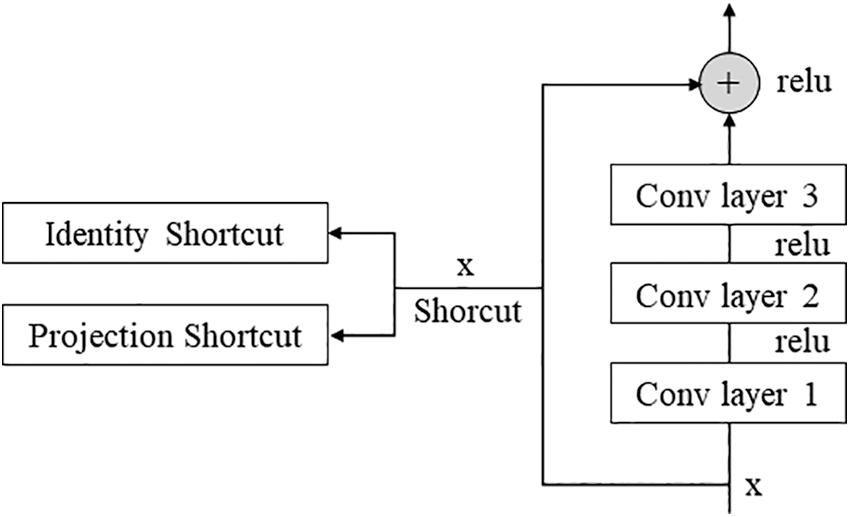
Figure 2: Residual block
Inception resnet is a model that has achieved good results in image classification competitions. Although it has a small number of parameters, it has the disadvantage of the model is rather complex [24]. Because of this complexity, VGGnet has been more commonly used than GoogleNet. Each Inception showed a simplified and uniform structure for each version applied more Inception modules and was designed to make the neural network wider and deeper as well as more effective. Later, Inception resnet was combined by borrowing the residual connection from Resnet, which reduced the amount of computation and speed up the learning. The idea of using residual connection is shown in Fig. 3.
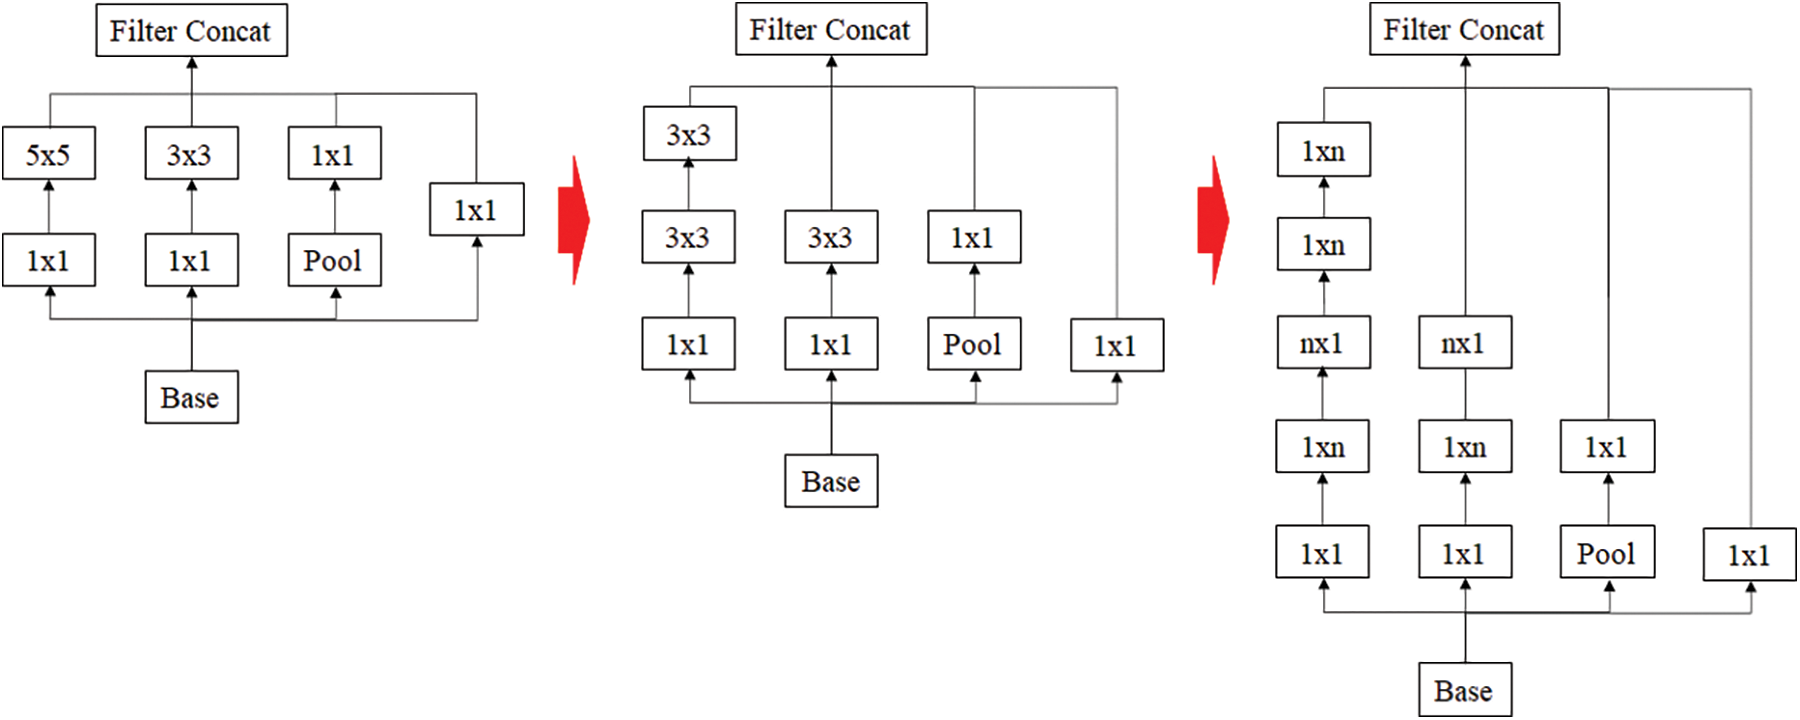
Figure 3: Inception resnet using residual connection
In this paper, the chest CT data has been divided into a ten-image dataset for the original image, K-means Clustering, K-Clustering images with Grabcut, and cropped images from both methods as shown in Fig. 4 were used, and K-means clustering and Grabcut were applied to the original image. In total, 2,400 chest CTs were used, 2,400 images through the original and K-means clustering algorithm and 2,400 data through K-means clustering and Grabcut were used. Ultimately, 7,200 pieces of data were used as a result of reducing the calcium-containing area and the calcium-free area to allocate the same ratio. The images were divided into subdivided images, and all image folders were divided into a group in which calcification had progressed and a group in which calcification had not progressed. The idea of not training parts other than the heart in the preprocessing stage came to mind when we expressed the histogram using Opencv as depicted in Fig. 5. However, at first, there were too many dark areas, so I removed 0 from the range [0:256] and changed it more dynamically. After excluding 0, the data of the normal group and the data that had undergone calcification showed a large difference in values at 256, and when the ROI was set and checked as shown in the figure, the progress of calcification could be seen more clearly, OpenCV supports ROI operation for some functions, but at this time, mask image must be passed as a factor. A mask is a binary image made up of zeros and non-zero. That is, 1 to 255 are treated as the same value. When a mask is applied to an image, all pixels that are 0 in the mask are set to 0 in the output image. It can be implemented using multiplication or AND operation for pixels, but the latter is usually faster. If the ROI is set through this masking operation and only the heart area is drawn as a histogram, it will appear as shown in Fig. 6. The value for 256 was 0 for a normal heart, and the value for 256 increased for data with calcification. So, we thought that if we learned by detecting only the heart region, the accuracy would increase because the feature of other organs was not included. The flowchart is described in Fig. 7.
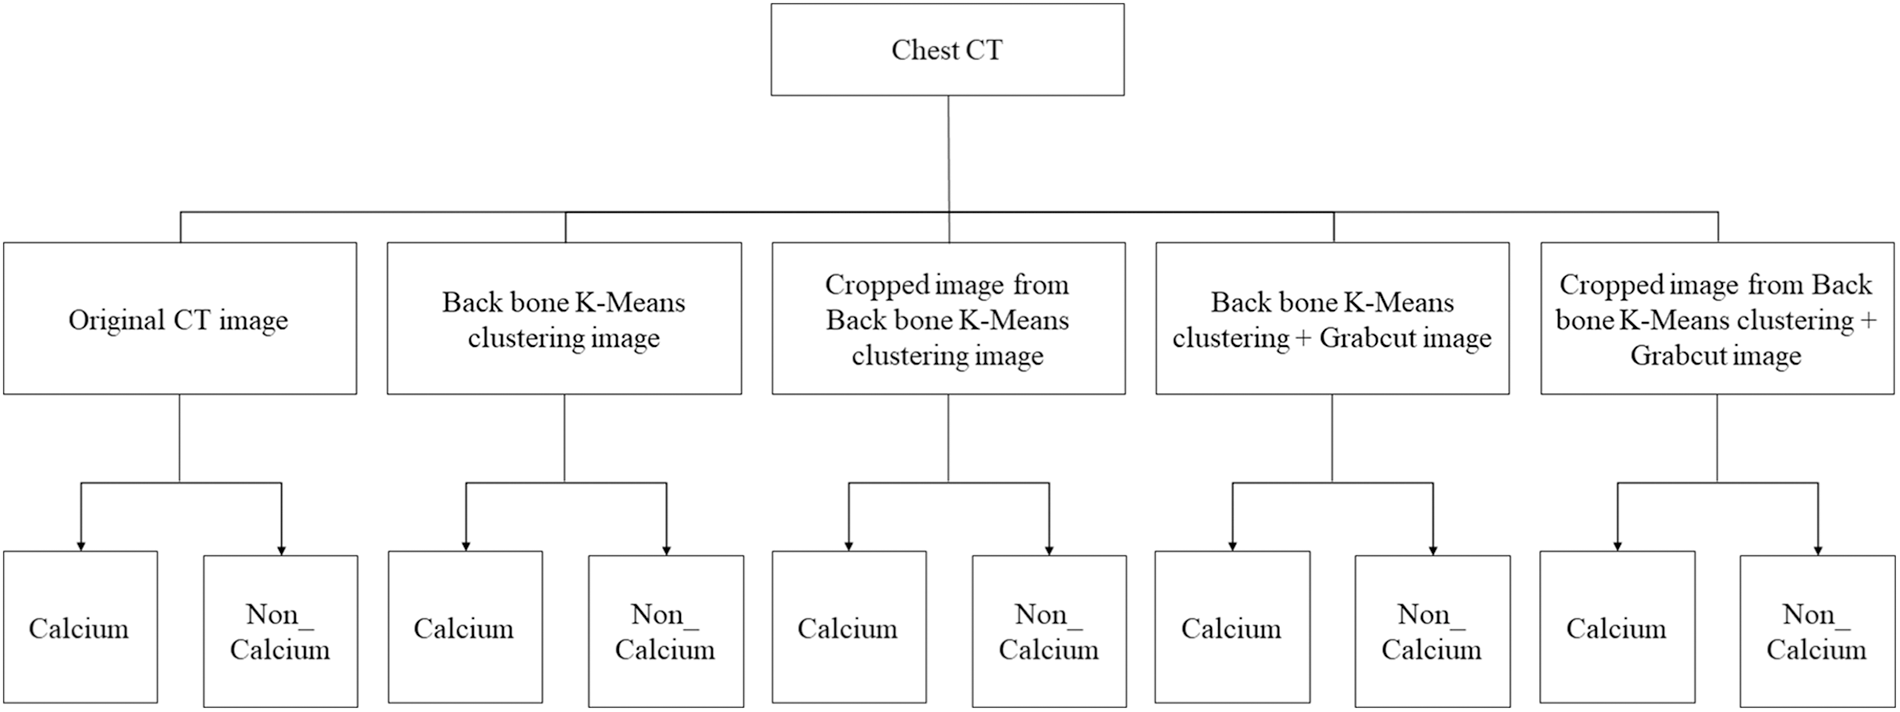
Figure 4: Dataset configuration
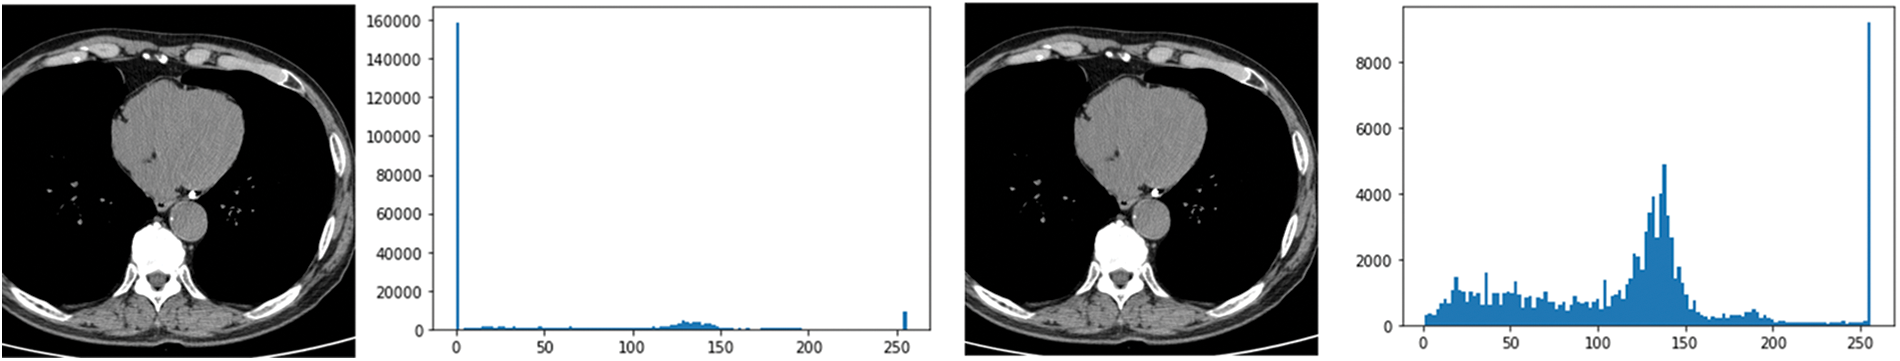
Figure 5: Histogram results in the range [0:256] and histogram results in the range [1:256]
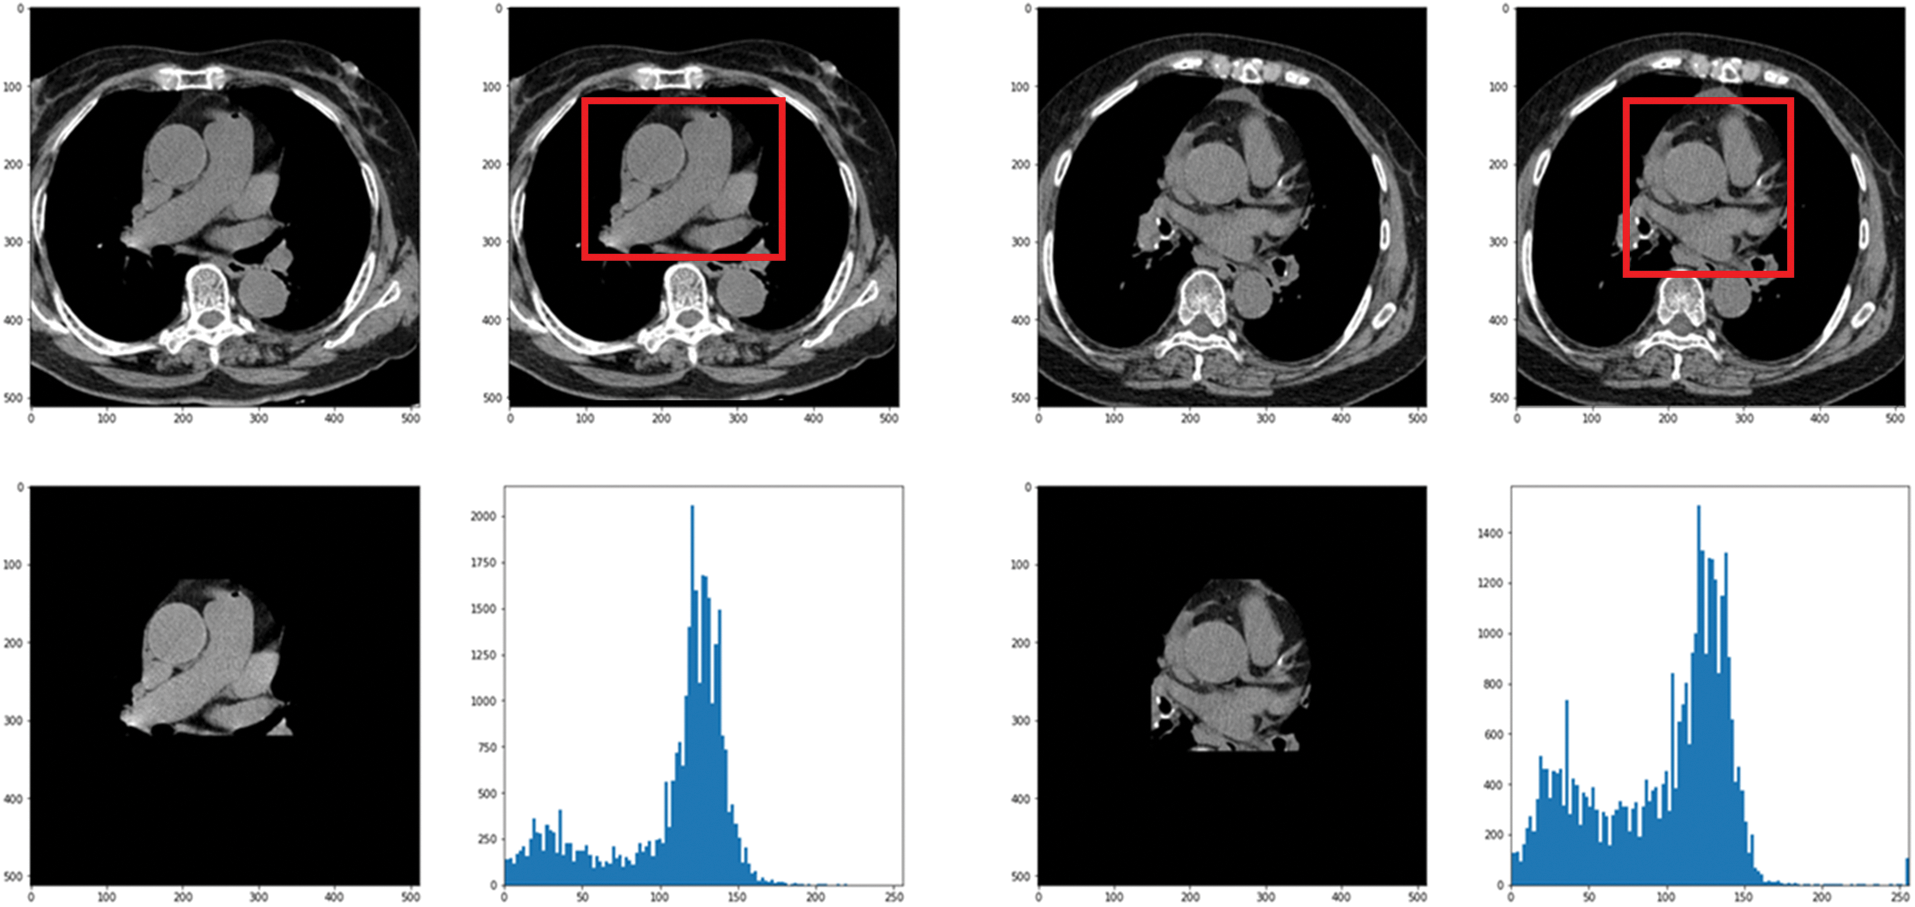
Figure 6: Result when a histogram is drawn with only the heart region by setting the ROI
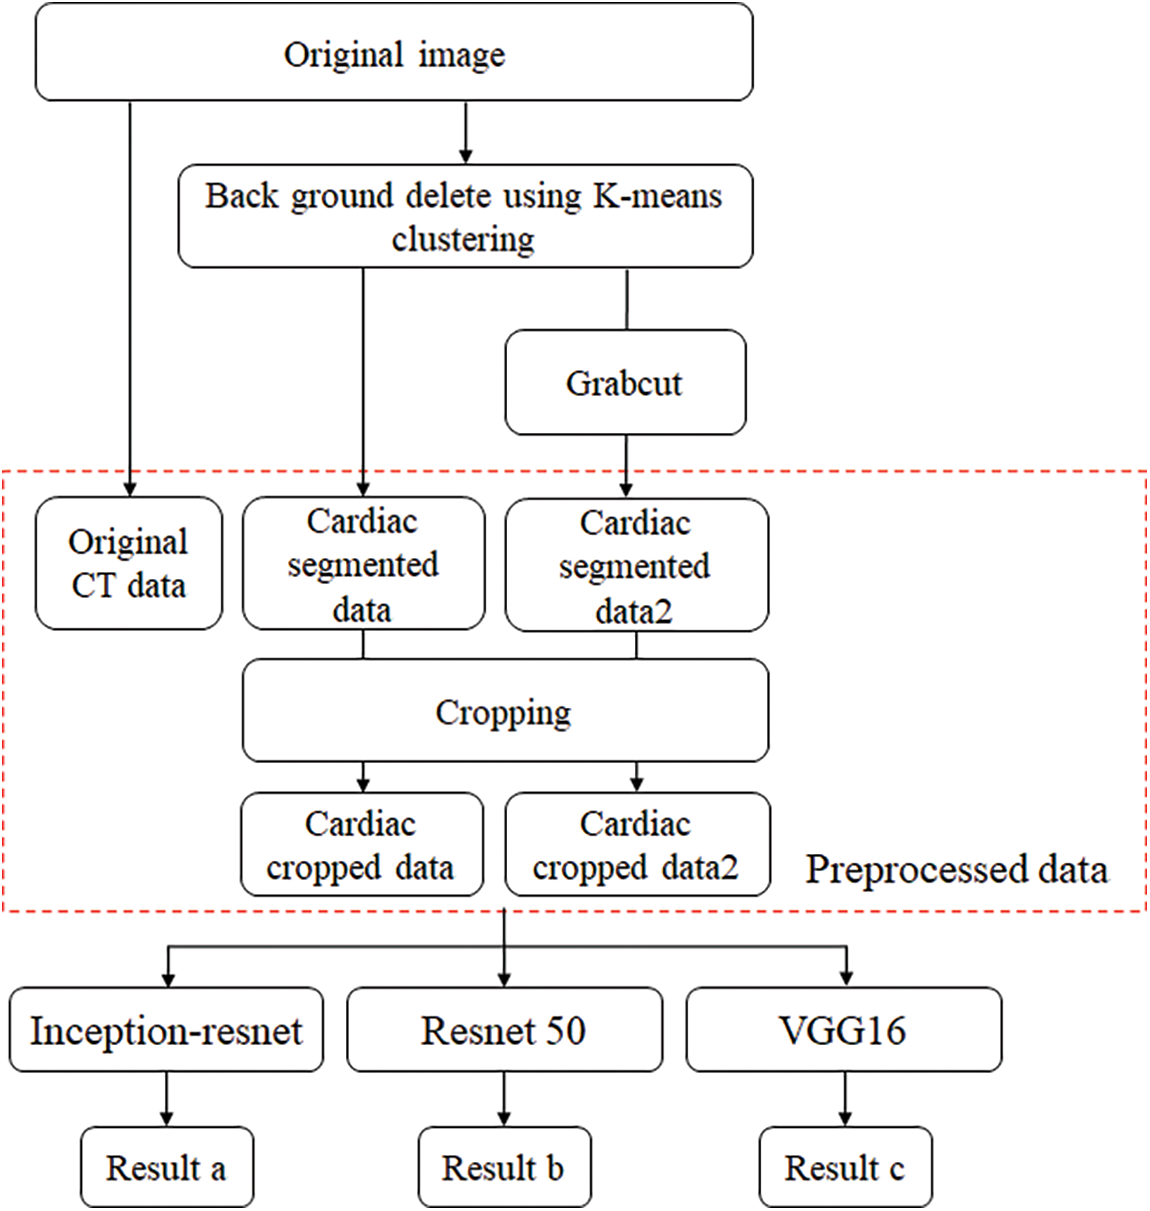
Figure 7: Flowchart of training and preprocessing step
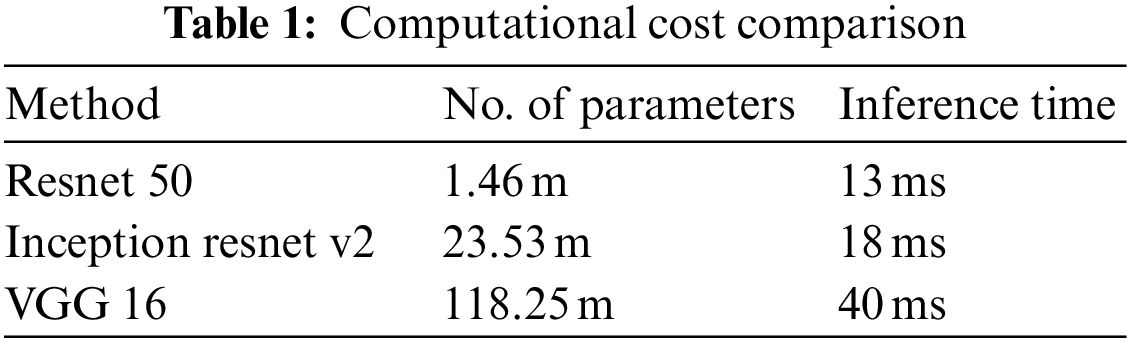
In this paper, first, a 512 × 512-sized CT image was read based on its HU pixels, and all of these HU pixels were converted to grayscale pixels and standardized, after which demarcation for parts such as the heart and fossa could be drawn [25,26]. Now, to remove the spine and ribs, the brightness of the bones such as the spine is stronger than the background and heart, so I adjusted the threshold and removed it using K-means clustering. However, while there are data in which the spine was properly removed from the image, in some other data, only the ribs were removed or a part of the heart was removed. Even when learning with these data, significant results were shown, and to supplement this, it was decided to use Grabcut [27] in this paper. The GrabCut algorithm extracts the image corresponding to the foreground, not the background, from the image, and extracts it step by step through interaction with the user. In this paper, by using Grabcut and considering the difference between the remaining bones and adjacent pixels between the heart, the heart and the bone were cut into two groups, which could reduce the amount of unnecessary information used. Fig. 8 shows the original data and each preprocessed data sample. Each data set was trained by deep learning models, and the parameters of each model are listed in Table 1. Resnet 50 has a total of 1.46 million parameters, Inception resnet v2 has 23.53 million parameters, and VGG has 1.1825 million parameters.
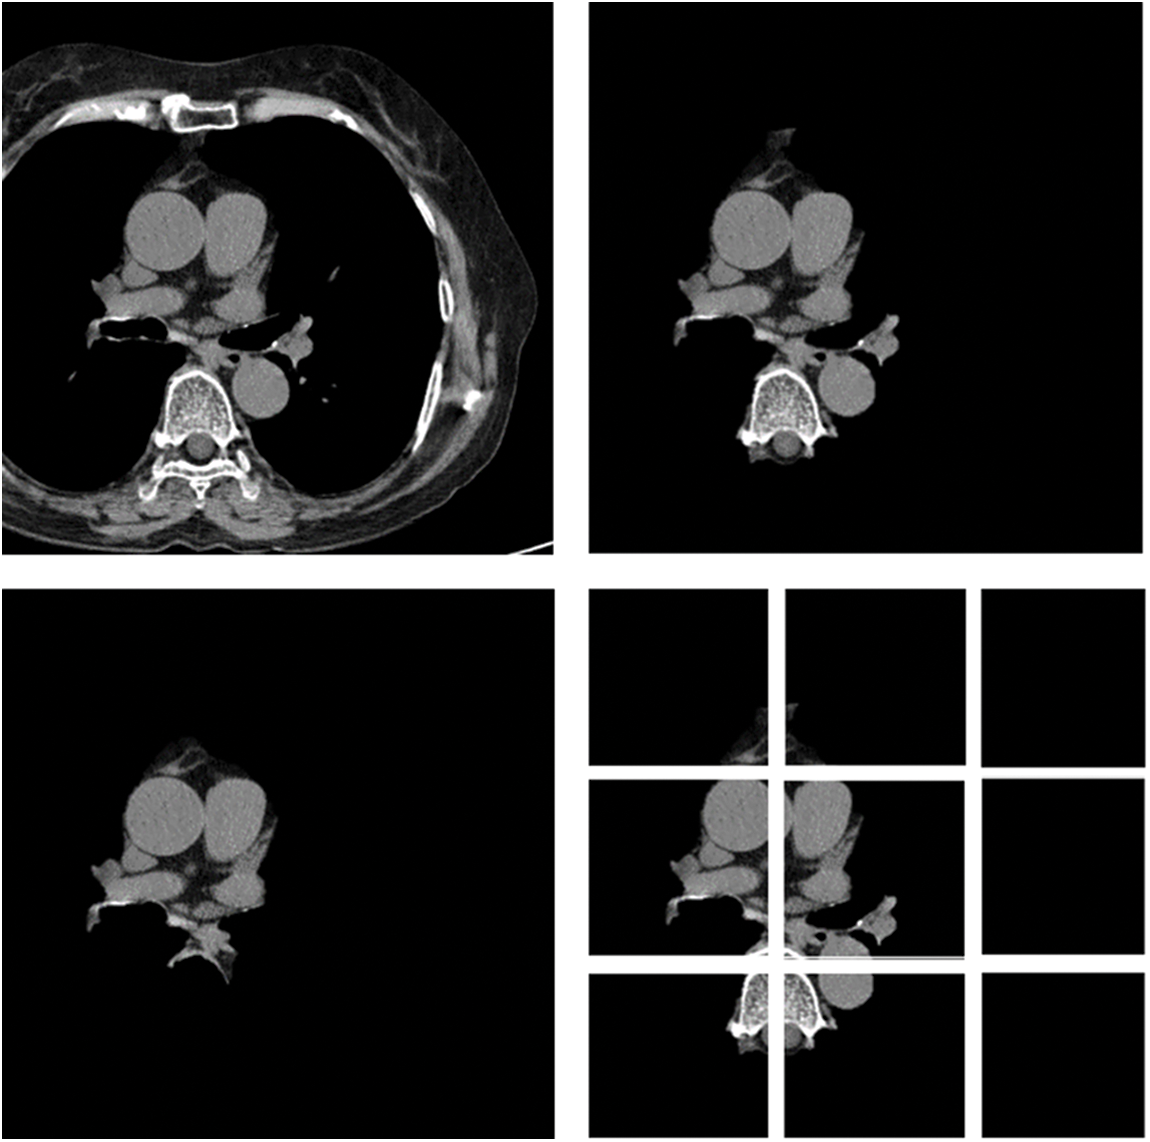
Figure 8: Data sample of original artery calcium score CT-data; cardiac segmented data; cardiac segmented data2; cropped data
5 Results of Experimental Tests
In this paper, an experiment was conducted to determine how much data processed through preprocessing affects the learning resulting achieved good results as a model that improved the point that in-depth learning of the existing Alexnet was impossible, Resnet improved gradient vanishing in the concept of VGG, and Inception renset applied Resnet’s characteristics to Inception v4, which was improved from the existing GoogLeNet. It was judged that the three models were closely related to each other and suitable for comparison. VGG was found to have a high effect whereas Inception resnet showed the smallest effect. As data from K-means clustering, first, the training result of Cardiac segmented data showed that the validation accuracy was 21% lower in Resnet 50 than the original artery calcium score CT data and that the test accuracy was increased by 0.48%. In Inception resnet v2, it was confirmed that the verification accuracy was 1% lower and that the test accuracy was 3% lower. If the spine cannot be completely excluded, it is judged that the accurate part can be reduced by confusing the pixel values of the spine with the progress of calcification in the coronary arteries. First, if we look at the result of Cardiac segmented data2 that has been subjected to the K-means clustering algorithm and the Grabcut algorithm for comparison, we could confirm that Resnet50 has a verification accuracy of 98.55% and a test accuracy of 91.51%, which is 31% higher than the existing Cardiac segmented data result. An increase in accuracy was confirmed, and an increase of 10% was confirmed in the test results. As such, it can be seen that the accuracy of all three models increased compared to when Cardiac segmented data2 was trained on Cardiac segmented data. The next thing to compare is the cardiac cropped data, which is better for learning the spine and other noises than data that has been resized by dividing the cardiac segmented data by 9. Therefore, the Cardiac cropped data was able to confirm better results than the Cardiac segmented data. Cropped data2 was made with cropped data2, which improved the verification accuracy by 0.41% in Resnet 50% and 0.50% in the test, thereby only leading to slight changes, but in Inception resnet v2, the verification accuracy increased by 2.55% and 13.82% in the test. It was confirmed that the test data increased by 0.65%. This shows that the data segmented in Cardiac segmented data2 can have higher learning and result accuracies that can be seen with increased % values. Inception resnet v2, which showed the lowest results in learning the original data, showed increases of 37.84% and 42.58%, respectively, in validation and testing, and finally, VGG showed respective increases of 11.71% and 35.62%. The detail is described in Table 2. The comparison result was Martin et al.; Martin et al. measured the accuracy for each score of calcification using Resnet and showed results ranging from 73.5% to 98.3%. With similar results, we showed a meaningful result with an accuracy of 99.49% for the presence or absence of calcification. Also, the preprocessing step with K-means clustering and the Grabcut algorithm is suitable for Cardiac CT deep learning. Fig. 9 shows one error out of a total of 100 sample data. In [x, y], x is the result of the specialist on whether calcification is progressing or normal, and y is the result of the deep learning model. All data labeling for x was directly performed by a specialist at Soonchunhyang University. Therefore, when the values of x and y are the same, the decision is correct, and if they are not, the decision is not correct. The misjudged data in Fig. 9 says that the labeling is normal, but the decision result by the deep learning model is that calcification has progressed.
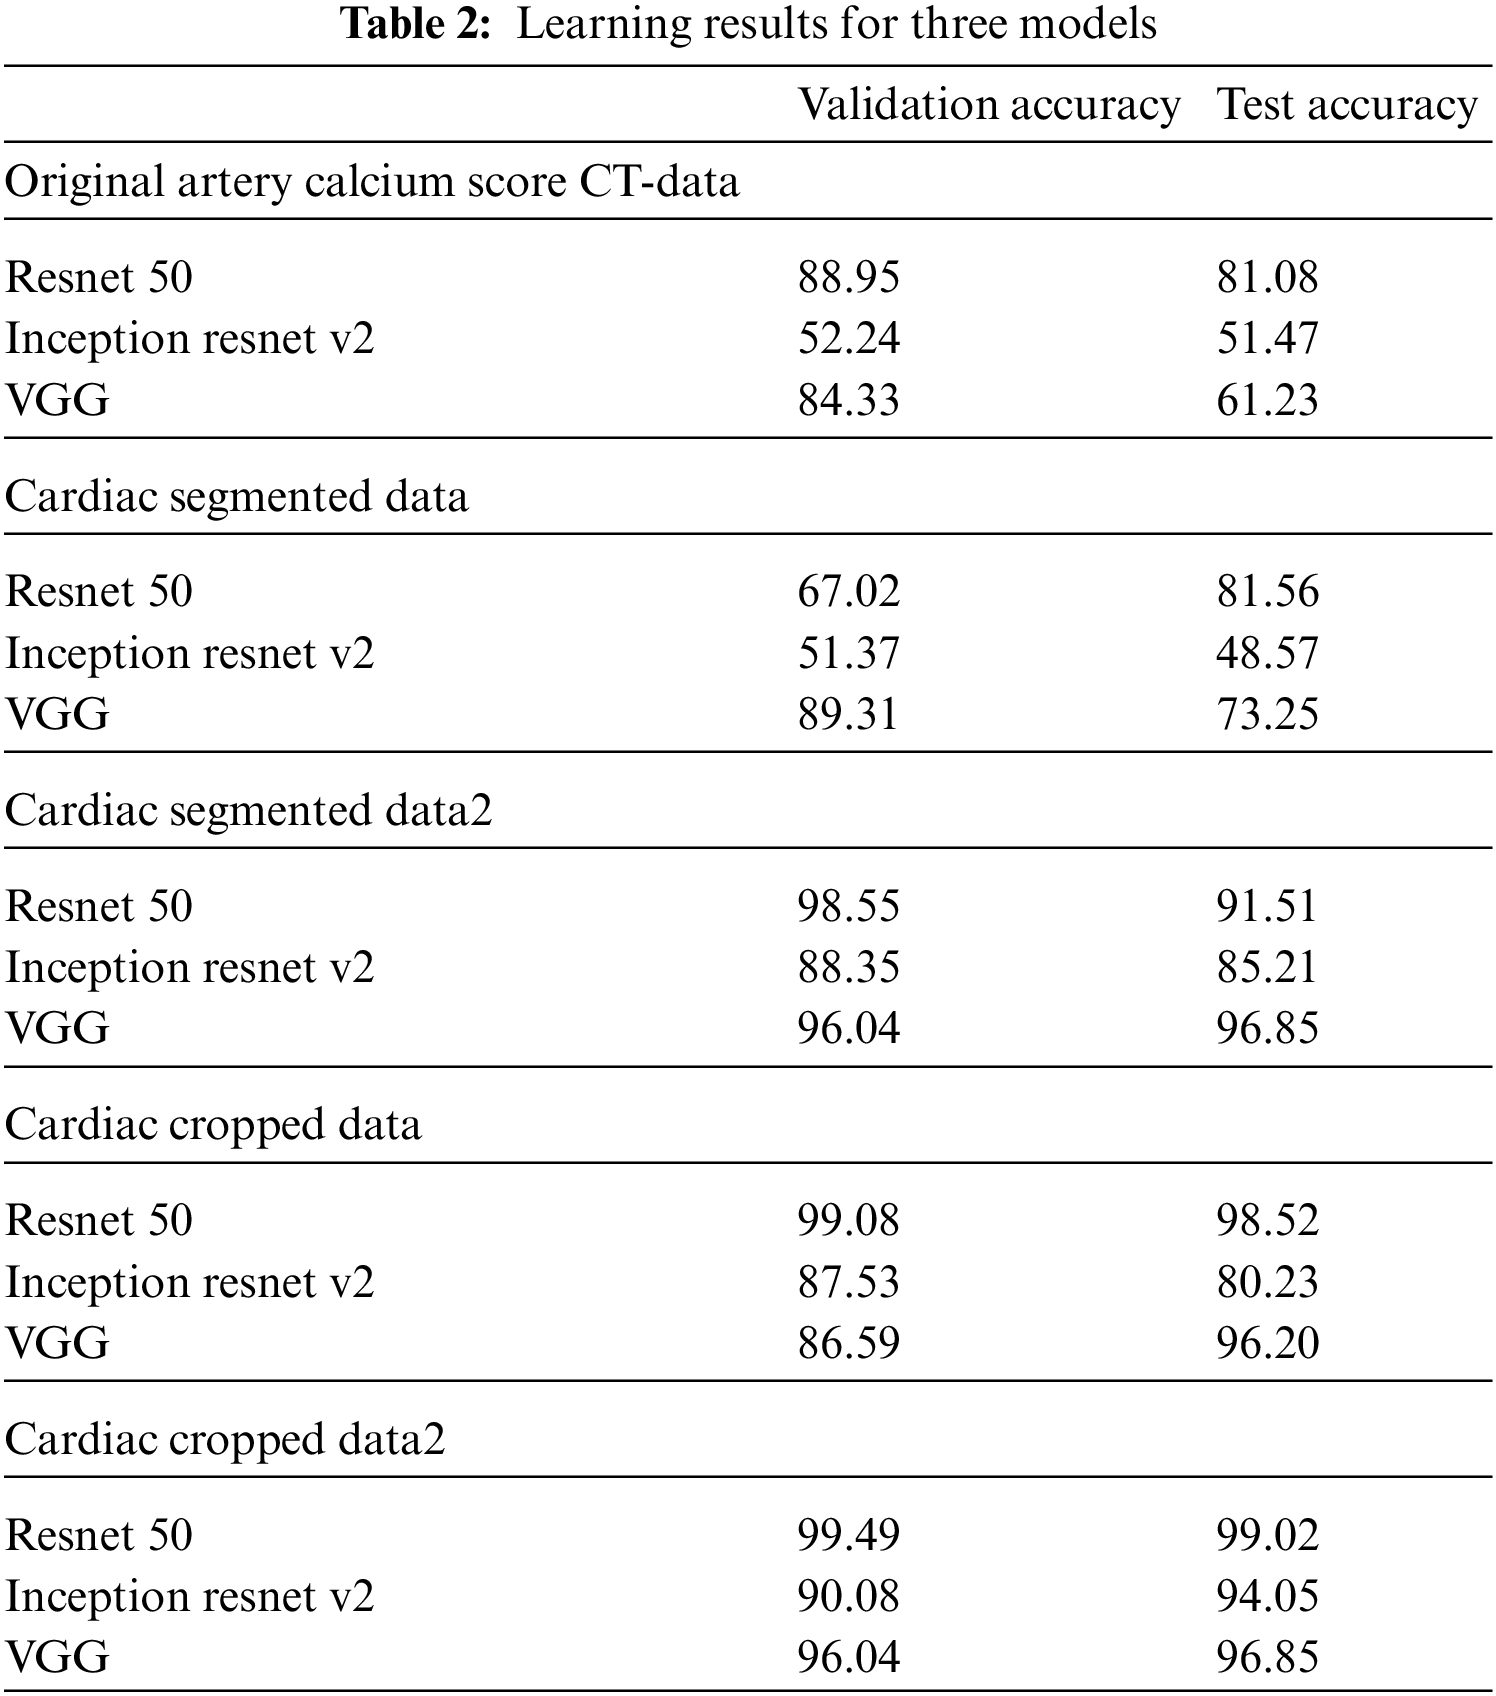
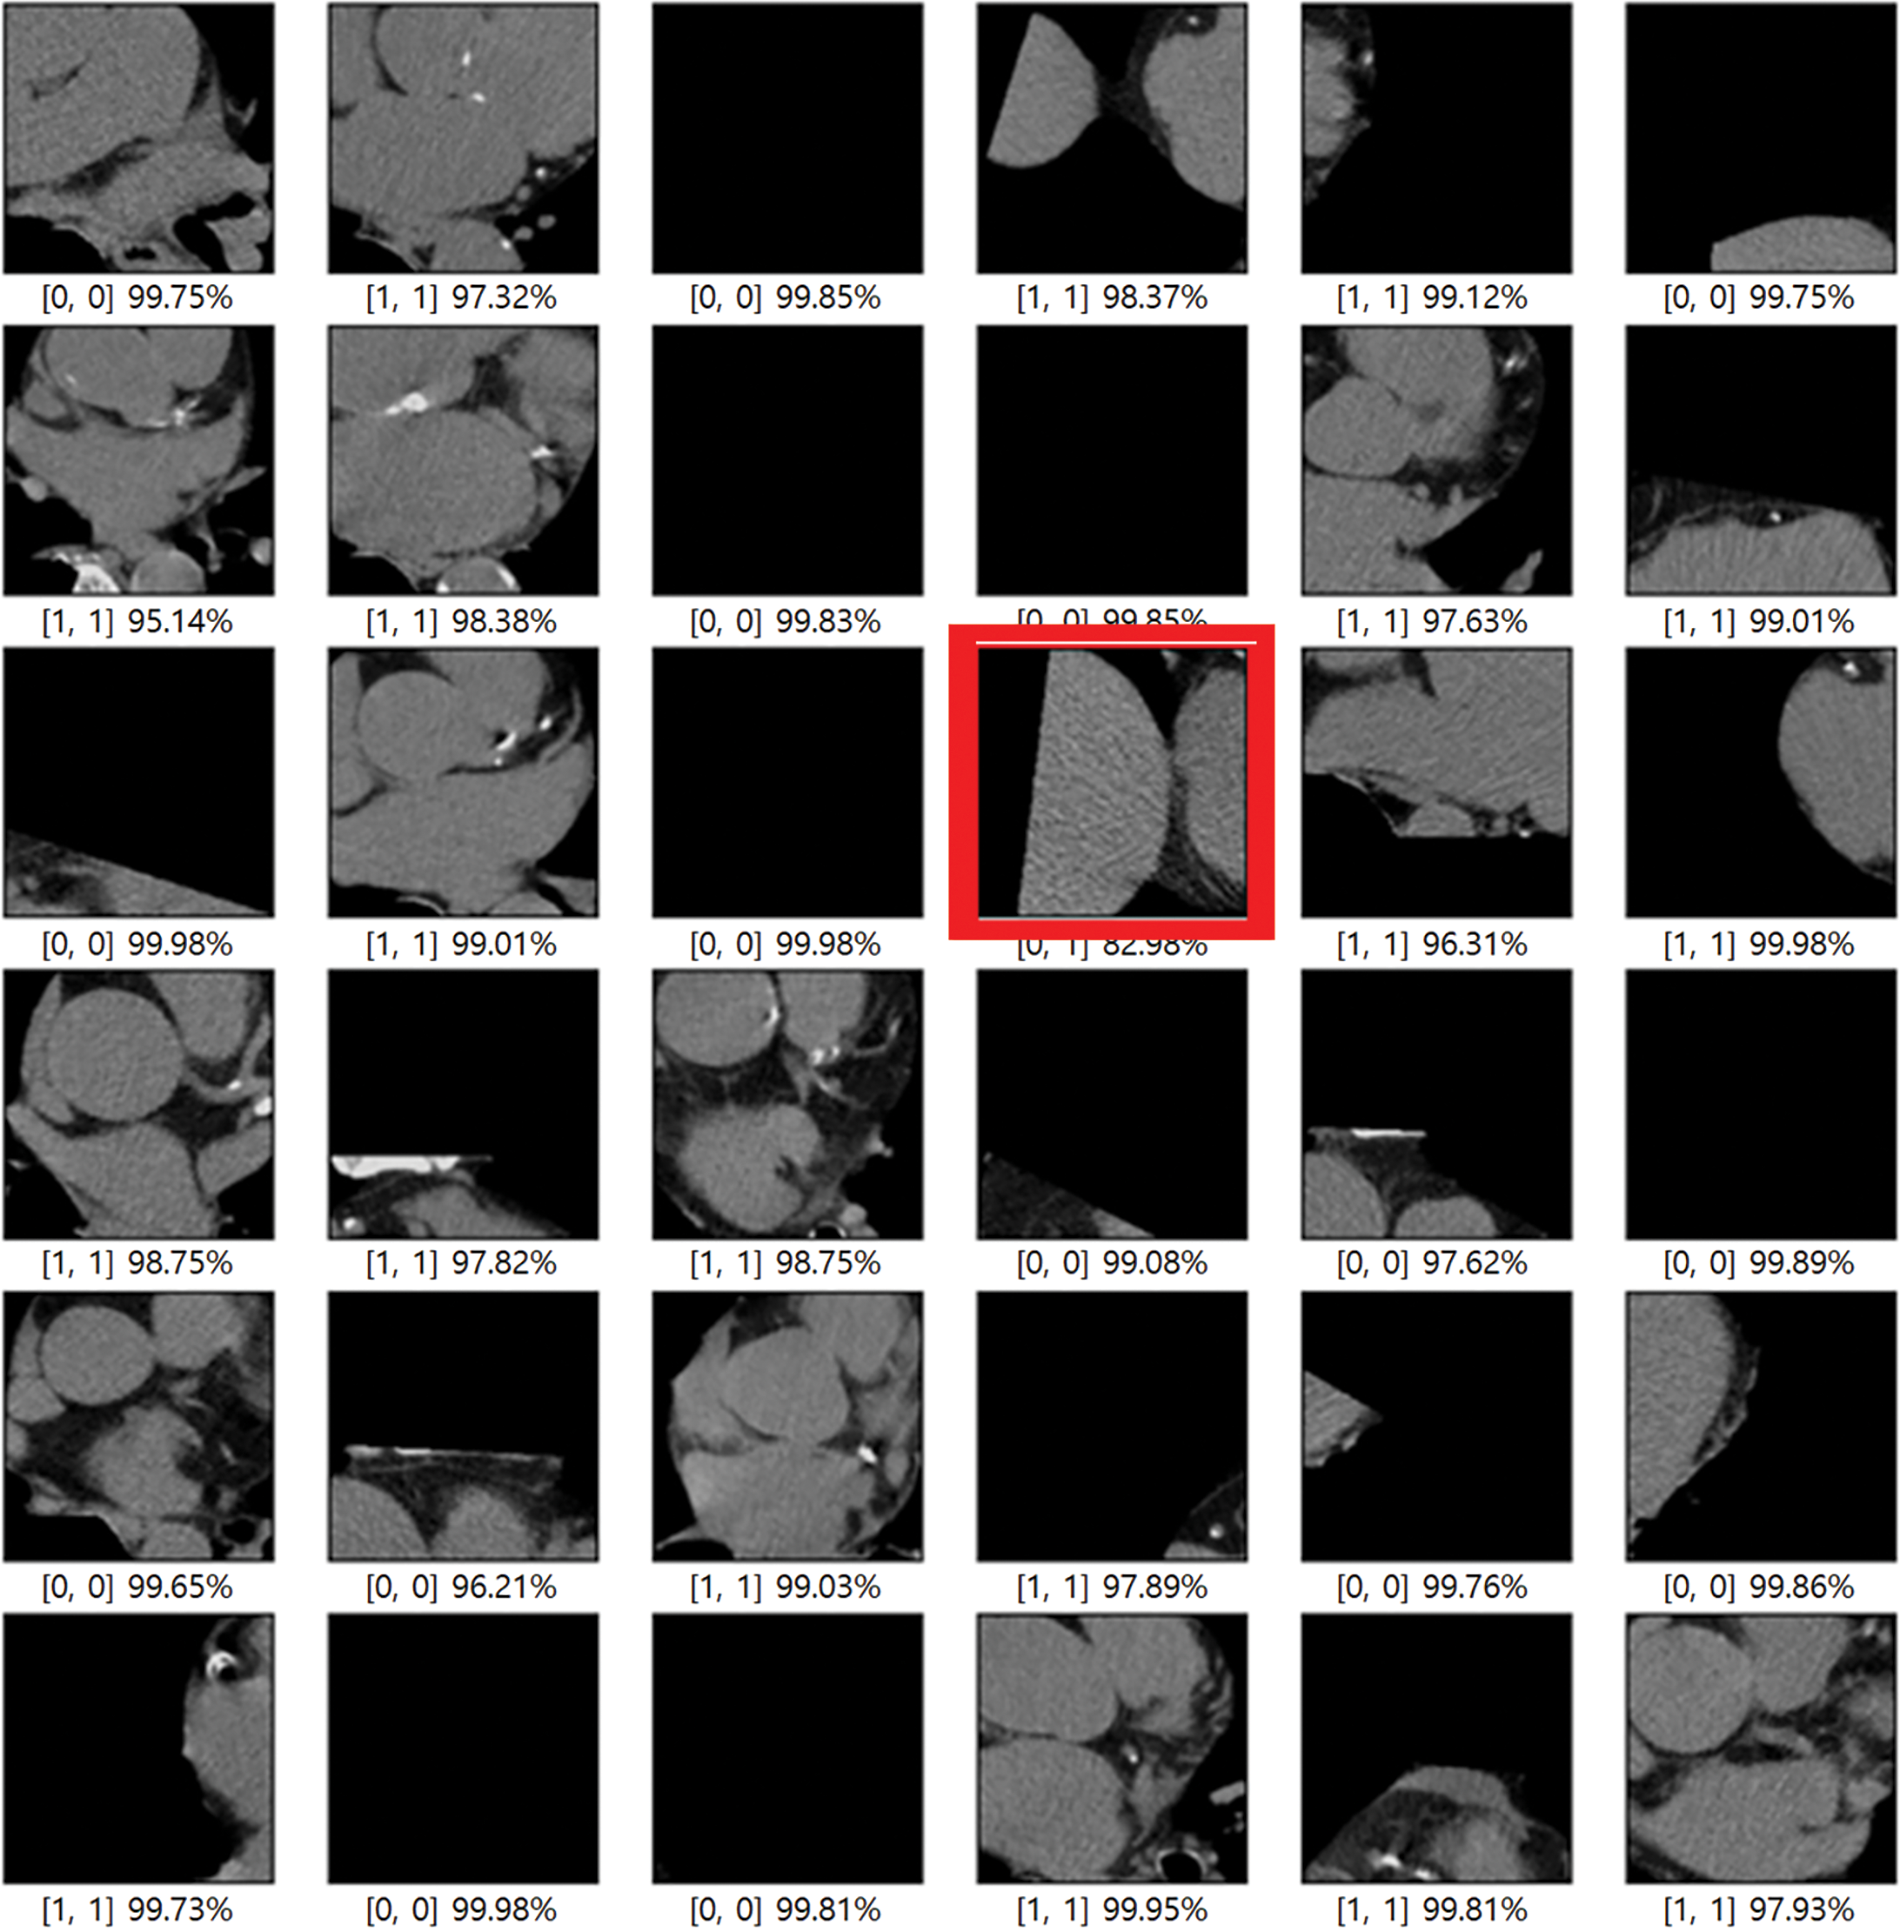
Figure 9: Error when testing 100 samples with training results
In this paper, the segmented data in the preprocessing stage has resulted in efficient deep learning compared to the original data through the experimental results. Since organs other than the heart adversely affected the deep learning of coronary artery calcification, original CT data, cardiac segmented data processed using K-means clustering algorithm, cardiac segmented data2 using K-means clustering algorithm, and Grabcut, cardiac segmented data, the output of each algorithm, and Cardiac cropped data obtained by dividing data2 and Cardiac cropped data2 were divided into five types of data to proceed with learning. All data were anonymized to remove specificity. When using data that passed only the K-means clustering algorithm, the cardiac segmented data did not show much difference from the original data training, but it showed high accuracy in the cardiac cropped data. For data using both K-means clustering and Grabcut, both Cardiac segmented data2 and Cardiac cropped data2 showed high accuracy. In conclusion, it can be seen that the learning result for the model is slightly improved in the segmented data compared to the original data. Each of the CNN models used in this paper had its pros and cons, and it was confirmed that learning more deeply about the data used in the paper leads to higher accuracy. Through this work, we saw the possibility of reducing the work time by extracting only the CT with calcification before the doctors analyze the CT image. In the future, we will use a more advanced version of the models used in this paper, and we will proceed with the final goal of heart anatomical segmentation learning by using weights for the learned data after preprocessing and using it for transfer learning.
Funding Statement: This research was supported under the framework of an international cooperation program managed by the National Research Foundation of Korea (NRF-2019K1A3A1A20093097), supported by the National Key Research and Development Program of China (2019YFE0107800), and was supported by the Soonchunhyang University Research Fund.
Availability of Data and Materials: No new data were created in this study. Data sharing does not apply to this article.
Conflicts of Interest: The authors declare that they have no conflicts of interest to report regarding the present study.
References
1. D. E. Bloom, S. Chatterji, P. Kowal, P. Lloyd-Sherlock, M. McKee et al., “Macroeconomic implications of population aging and selected policy responses,” The Lancet, vol. 385, no. 9968, pp. 649–657, 2015. [Google Scholar]
2. World Health Organization. Cardiovascular diseases, (accessed on 1 July 2021). Available online: https://www.who.int/news-room/fact-sheets/detail/cardiovascular-diseases-(CVD). [Google Scholar]
3. A. Krizhevsky and G. Hinton, “Learning multiple layers of features from tiny images,” Computer Science Department University of Toronto Tech. Rep, vol. 1, no. 4, pp. 7, 2009. [Google Scholar]
4. A. Krizhevsky, I. Sutskever and G. E. Hinton, “Imagenet classification with deep convolutional neural networks,” Advances in Neural Information Processing Systems, vol. 60, pp. 1097–1105, 2012. [Google Scholar]
5. B. Rim, S. Lee, A. Lee, H. W. Gil and M. Hong, “Semantic cardiac segmentation in chest CT images using K-means clustering and the mathematical morphology method,” Sensors, vol. 21, no. 8, pp. 2675, 2021. [Google Scholar]
6. S. Lee B. Rim, S. S. Jou, H. W. Gil, X. Jia et al., “Deep-learning-based coronary artery calcium detection from CT image,” Sensors, vol. 21, no. 21, pp. 7059, 2021. [Google Scholar]
7. X. Jia, C. Qian, Z. Yang, H. Xu, X. Han et al., “Boundary-aware dual attention guided liver segment segmentation model,” KSII Transactions on Internet and Information Systems (TIIS), vol. 16, no. 1, pp. 16–37, 2022. [Google Scholar]
8. X. Wang, Z. Li, Y. Huang, and Y. Jiao, “Multimodal medical image segmentation using multi-scale context-aware network,” Neurocomputing Elsevier, vol. 486, pp. 135–146, 2022. [Google Scholar]
9. C. Szegedy, W. Liu, Y. Jia, P. Sermanet, S. Reed et al., “A. going deeper with convolutions,” in Proc. of the (CVPR), Boston, USA, 2015. [Google Scholar]
10. E. Real, A. Aggarwal, Y. Huang, and Q. V. Le, “Regularized evolution for image classifier architecture search,” arXiv, 2018. [Google Scholar]
11. K. Simonayn, A. Vedaldi and A. Zisserman, “Deep fisher networks for large-scale image classification,” NIPS, vol. 1, pp. 163–171, 2013. [Google Scholar]
12. A. Mikolajczyk and M. Grochowski, “Data augmentation for improving deep learning in image classification problem,” in 2018 Int. Interdisciplinary Ph.D. Workshop (IIPhDW), Swinoujscie, Poland, IEEE, Mei- 2018. [Google Scholar]
13. J. Nalepa, M. Marcinkiewicz and M. Kawulok, “Data augmentation for brain-tumor segmentation: A review,” Frontiers in Computational Neuroscience, vol. 13, no. 83, pp. 1–18, 2019. [Google Scholar]
14. V. Sorin, Y. Barash, E. Konen and E. Klang, “Creating artificial images for radiology applications using generative adversarial networks (GANs)–A systematic review,” Academic Radiology, vol. 27, no. 8, pp. 1175–1185, 2020. [Google Scholar]
15. X. Yi, E. Walia and P. Babyn, “Generative adversarial network in medical imaging: A review,” Medical Image Analysis, vol. 58, pp. 1–20, 2019. [Google Scholar]
16. Y. Wang, S. Le and S. Sudha, “CAB: Classifying arrhythmias based on imbalanced sensor data,” KSII Transactions on Internet and Information Systems, vol. 15, no. 7, pp. 2304–2320, 2021. [Google Scholar]
17. S. Zhang, C. Y. Pei and W. Y. Liu, “A Real-time traffic flow model based on deep learning,” KSII Transactions on Internet & Information Systems, vol. 16, no. 8, pp. 2473–2489, 2022. [Google Scholar]
18. F. Ritter, T. Boskamp, A. Homeyer, H. Laue, M. Schwier et al., “Medical image analysis.” IEEE Pulse, vol. 2, no. 6, pp. 60–70, 2011. [Google Scholar]
19. P. B. Chanda and S. K. Sarkar, “Cardiac MR images segmentation for identification of cardiac diseases using fuzzy based approach,” in Proc. of the 2020 Third Int. Conf. on Smart Systems and Inventive Technology (ICSSIT), IEEE, Tirunelveli, India, pp. 1238–1246, 2020. [Google Scholar]
20. C. Y. Ning, S. F. Liu and M. Qu. “Research on removing noise in medical image based on median filter method,” in 2009 IEEE Int. Symp. on IT in Medicine & Education, Jinan,China, IEEE, vol. 1, 2009. [Google Scholar]
21. S. S. Martin, M. van Assen, S. Rapaka, H. T. Hudson Jr, A. M. Fischer et al., “Evaluation of deep learning–based automated CT coronary artery calcium scoring algorithm,” Cardiovascular Imaging, vol. 13, pp. 524–526, 2020. [Google Scholar]
22. K. Simonyan en and A. Zisserman, “Very deep convolutional networks for large-scale image recognition,” San Diego, USA, ICLR, pp. 1–14, 2015. [Google Scholar]
23. K. He, X. Zhang, S. Ren and J. Sun, “Deep residual learning for image recognition,” in Proc. of the IEEE Conf. on Computer Vision and Pattern Recognition, Las Vegas, USA, pp. 770–778, 2016. [Google Scholar]
24. C. Szegedy, S. Ioffe, V. Vanhoucke and A. Alemi, “Inception-v4, inception-resnet and the impact of residual connections on learning,” in Proc. of the Thirty-First AAAI Conf. on Artificial Intelligence, San Francisco, USA, 2017. [Google Scholar]
25. D. V. Arthur and S. Vassilvitskii, “K-Means++: The advantages of careful seeding,” in Proc. of the Eighteenth Annual ACM-SIAM Symp. on Discrete Algorithms, Society for Industrial and Applied Mathematics, New Orleans, USA, pp. 1027–1035, 2007. [Google Scholar]
26. F. Pedregosa, G. Varoquaux, A. Gramfort, V. Michel, B. Thirion et al., “Scikit-learn: Machine learning in python,” J. Mach. Learn. Res., vol. 12, pp. 2825–2830, 2011. [Google Scholar]
27. C. Allène, J. Y. Audibert, M. Couprie, J. County and R. Keriven, “Some links between min-cuts, optimal spanning forests, and watersheds,” ISMM, vol. 1, pp. 253–264, 2007. [Google Scholar]
Cite This Article
 Copyright © 2023 The Author(s). Published by Tech Science Press.
This work is licensed under a Creative Commons Attribution 4.0 International License , which permits unrestricted use, distribution, and reproduction in any medium, provided the original work is properly cited.
 Downloads
 Citation Tools