
 Submit a Paper
 Propose a Special lssue
 Open Access
ARTICLE

Artificial Intelligence Based Sentence Level Sentiment Analysis of COVID-19
1 Department of Software Engineering, University of Management and Technology, Lahore, 54770, Pakistan
2 School of Computer Science, The University of Sydney, Sydney, Australia
3 Department of Computer Science, College of Science, Nawroz University, Duhok, 42001, Kurdistan Region, Iraq
4 College of Computer Science and Information Technology, University of Anbar, Anbar, 31001, Iraq
5 Department of Computer Science, Umm Al Qura University, Mecca, 24211, Saudi Arabia
6 Computer Science Department, Faculty of Computers and Information, Kafrelsheikh University, Kafrelsheikh, Egypt
* Corresponding Author: Mazin Abed Mohammed. Email:
Computer Systems Science and Engineering 2023, 47(1), 791-807. https://doi.org/10.32604/csse.2023.038384
Received 10 December 2022; Accepted 20 March 2023; Issue published 26 May 2023
 View Full Text
 Download PDF
Abstract
Web-blogging sites such as Twitter and Facebook are heavily influenced by emotions, sentiments, and data in the modern era. Twitter, a widely used microblogging site where individuals share their thoughts in the form of tweets, has become a major source for sentiment analysis. In recent years, there has been a significant increase in demand for sentiment analysis to identify and classify opinions or expressions in text or tweets. Opinions or expressions of people about a particular topic, situation, person, or product can be identified from sentences and divided into three categories: positive for good, negative for bad, and neutral for mixed or confusing opinions. The process of analyzing changes in sentiment and the combination of these categories is known as “sentiment analysis.” In this study, sentiment analysis was performed on a dataset of 90,000 tweets using both deep learning and machine learning methods. The deep learning-based model long-short-term memory (LSTM) performed better than machine learning approaches. Long short-term memory achieved 87% accuracy, and the support vector machine (SVM) classifier achieved slightly worse results than LSTM at 86%. The study also tested binary classes of positive and negative, where LSTM and SVM both achieved 90% accuracy.Keywords
SARS-CoV-2, also known as severe acute respiratory syndrome coronavirus type 2, is a viral infection that was first confirmed in December 2019 in Wuhan, China. It has since spread globally, leading to the ongoing 2019-2021 SARS-CoV-2 pandemic [1]. On January 30, 2020, after the first case of COVID-19 was confirmed in Wuhan two months earlier, the World Health Organization (WHO) declared the disease a global pandemic and a public health emergency of international concern (PHEIC) [2]. There has been a total of 219,456,675 confirmed cases of the virus worldwide and 4,547,782 deaths. The virus is transmitted through close contact with an infected person and can also be spread through respiratory droplets produced when an infected person coughs or sneezes [3,4]. The virus can affect people of all ages; young children have also been reported to be infected. Artificial intelligence-based methods are very common to detect Covid-19 [5,6].
The self-regulating process of evaluating sentences and then categorizing them into positive, negative, and neutral sentiments is called sentiment analysis. Sentiment analysis has become increasingly relevant in the wake of the COVID-19 pandemic [7]. As a large amount of text data is generated every day on various platforms, sentiment analysis techniques can be used to extract the general sentiment and mood of individuals and communities towards the ongoing crisis. The use of sentiment analysis can help in understanding the psychological impact of the pandemic on people and their emotions towards the ongoing situation. Hence, sentiment analysis can play a crucial role in understanding the public’s perception of COVID-19 and help in devising better policies and solutions to tackle the current global crisis [8].
Twitter is one of the most popular social platforms for sharing views and thoughts. Sentiment analysis on Covid-19 related tweets has become an increasingly important topic in the field of machine learning and deep learning, providing valuable insights into public opinions and emotions towards the pandemic [9]. In deep learning, models are trained to perform specific tasks by taking input from large labels of data. Deep learning models can even exceed human-level performance by achieving ultra-high accuracy as models are trained using multiple-layered neural network architectures and large labeled Covid-19 sentimental datasets [10,11]. The ongoing COVID-19 pandemic has significantly impacted people’s emotions and attitudes, and social media platforms such as Twitter have become a major source for understanding these sentiments. However, traditional methods for sentiment analysis may not be sufficient to capture the complexity and nuances of these emotions. The problem is that there is a need for more effective methods to analyze and understand sentiments in COVID-19-related tweets, and to provide insights into public opinion and attitudes toward the pandemic. The objective of this study is to evaluate the effectiveness of artificial intelligence models for sentiment analysis of COVID-19-related tweets and to provide insights into the strengths and limitations of these models.
The aim of the study seems to be to evaluate the effectiveness of artificial intelligence (AI) models for sentiment analysis of COVID-19-related tweets and to provide insights into the strengths and limitations of these models. The study aims to compare the performance of deep learning and machine learning models for sentiment analysis, and to evaluate their accuracy in identifying and classifying sentiments in COVID-19-related text. The main contributions of this study can be summarized as follows:
• The 90,000 tweets named CovidSenti-A, CovidSenti-B, and CovidSenti-C datasets were prepared after case folding, hashtag removal, stop word removal, and lemmatization.
• The study evaluates the performance of different machine learning models as well as a deep learning model (LSTM), on a dataset of 90,000 tweets divided into three classes.
• The study finds that the deep learning-based model LSTM outperforms other machine learning models, achieving 87% accuracy on the three-class dataset and 90% accuracy on a two-class dataset.
In recent years, there has been an increased interest in sentiment analysis for various domains, including the field of healthcare, where the spread of the COVID-19 pandemic has prompted researchers to analyze sentiments on social media platforms such as Twitter. Many researchers have proposed various machine learning and deep learning models for sentiment analysis of tweets related to Covid-19. The study of student emotions is anticipated using sentiment analysis. The entire study was focused on Filipino students, and the majority of them have a favorable opinion of online education [12]. The study was on people’s emotions on social media and has accumulated 600,000 tweets under the hashtag COVID-19. The most prevalent team in the tweets, the researchers utilized the frequent pattern-growth algorithm to undertake frequent pattern mining. The researcher obtains 5-month Twitter data and around one million Twitter followers. The data is compared to a key mark from the COVID period in order to determine whether or not the population is wearing masks in the event of a pandemic [13].
The Arabic data for the sentiment analysis was acquired from Twitter in the Saudi Arabian zone. To improve outcomes, a variety of machine learning algorithms such as Support Vector Machine SVM, Naïve Bayes Classifier (NB), and others are used. The N-gram feature extraction approach was utilized, and an accuracy of 85 percent was reached. The study claims that the south has a higher knowledge of COVID-19 than the center [14]. The authors proposed a machine learning-based approach for sentiment analysis of COVID-19 tweets, using a dataset of 10,000 tweets that were manually annotated for the sentiment. The authors compared the performance of several machine learning algorithms, including Naive Bayes, Support Vector Machines (SVM), and Random Forest, and found that SVM achieved the best performance with an accuracy of 85.7% [15].
The study proposed a deep learning-based approach for sentiment analysis of COVID-19 tweets, using a dataset of 10,000 tweets that were annotated for the sentiment. The authors used a deep learning model called Convolutional Neural Network (CNN) to classify the tweets into positive, negative, and neutral sentiment classes. The results showed that the CNN-based approach outperformed traditional machine learning algorithms, achieving an accuracy of 89.1% [16]. These studies demonstrate the potential of machine learning and deep learning approaches for sentiment analysis of COVID-19 tweets, but also highlight the need for large annotated datasets and the importance of hybrid approaches that can leverage the strengths of both machine learning and deep learning methods.
The proposed study is a comparative analysis of some deep learning and machine learning techniques. The study performed classification on three-classed data as well as on binary data. Fig. 1 shows the whole workflow for the classification.
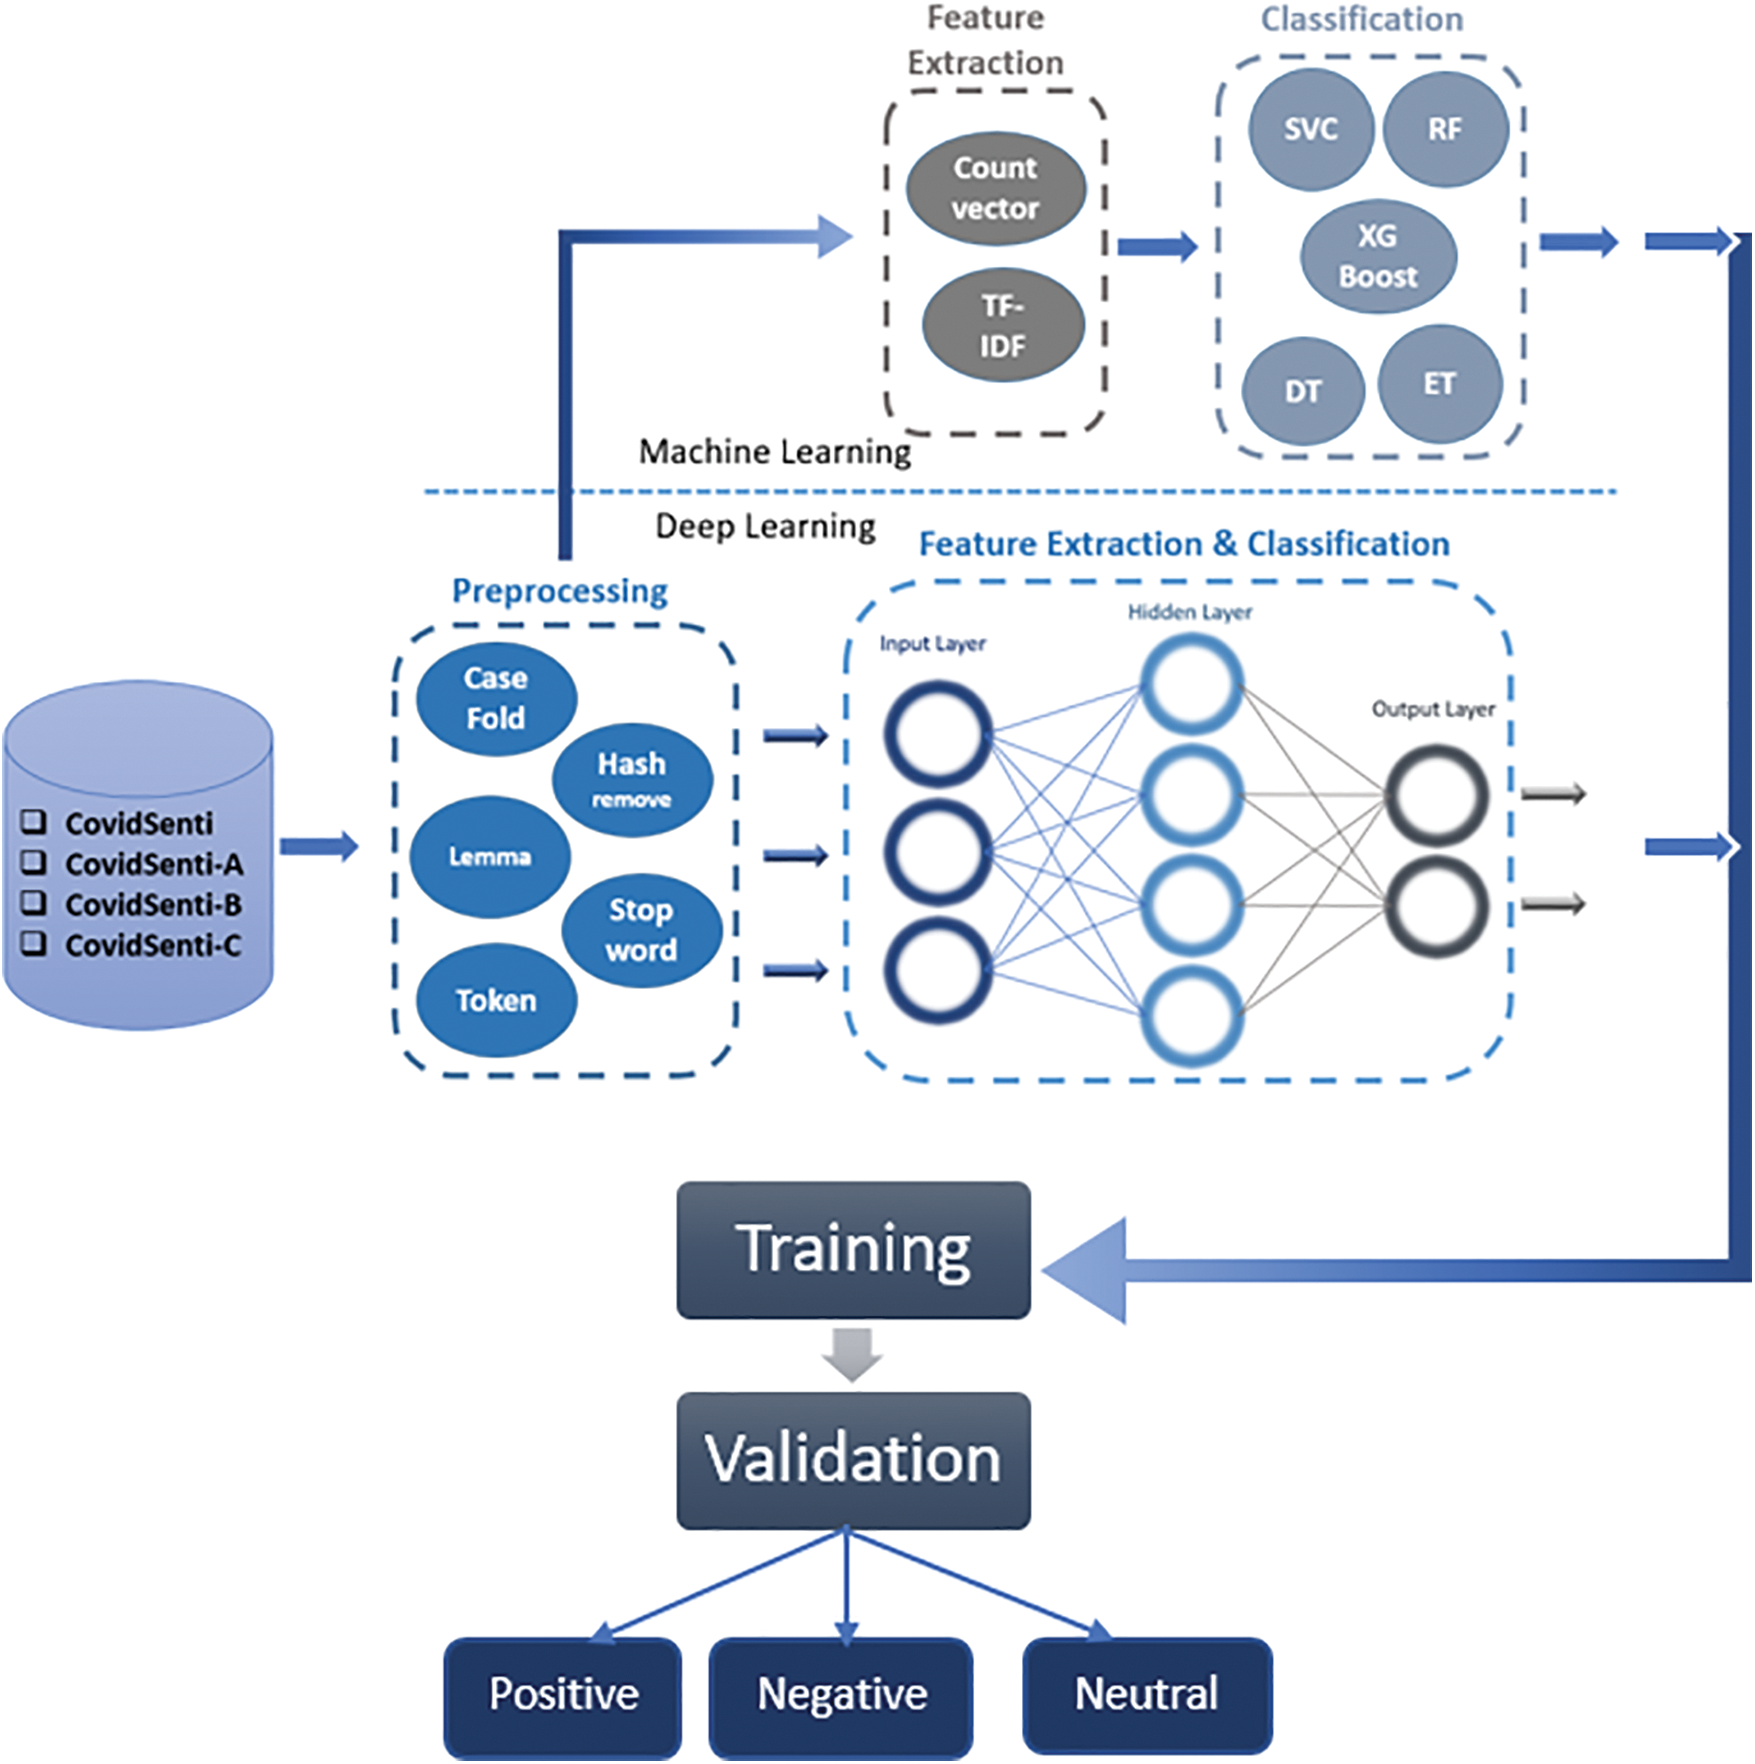
Figure 1: The framework of COVID-19 sentiment AI architecture
The benchmark dataset contains 90,000 tweets and is named CovidSenti. CovidSenti was further divided into three even subcategories called CovidSenti-A, CovidSenti-B, and CovidSenti-C in an equal emotion class for consideration and simplification [16]. The tweet categorization in CovidSenti-A involves the majority of the tweets associated with government and political acts based on COVID-19. For example, “the government is not trustworthy in any way, and the government is incapable of dealing with Corona at all.” CovidSenti-B involves tweets associated with the COVID-19 emergencies: territory, lockdown, pandemics, and stay safe. As a result, it focuses on the chronological alternation in people’s normal actions based on the number of circumstances, panic-related information, and so on. For instance, Corona is spreading so fast that people are dying from it, so please stay safe at home. CovidSenti-C contains tweets associated with COVID-19 cases, epidemics, and staying home. Therefore, it primarily displays the configurations of the behaviors of individuals in response to the growth in the number of cases. For instance, “There is no more oxygen for the patients of the coronavirus; they are just scared of how much worse the coronavirus outbreak can get.” Data is labeled into three classes: positive, negative, and neutral. where we have 6,280 positive tweets, 16,335 negative tweets, and 67,835 neutral tweets, respectively. Fig. 2 depicts the three COVID sentiment data sets.
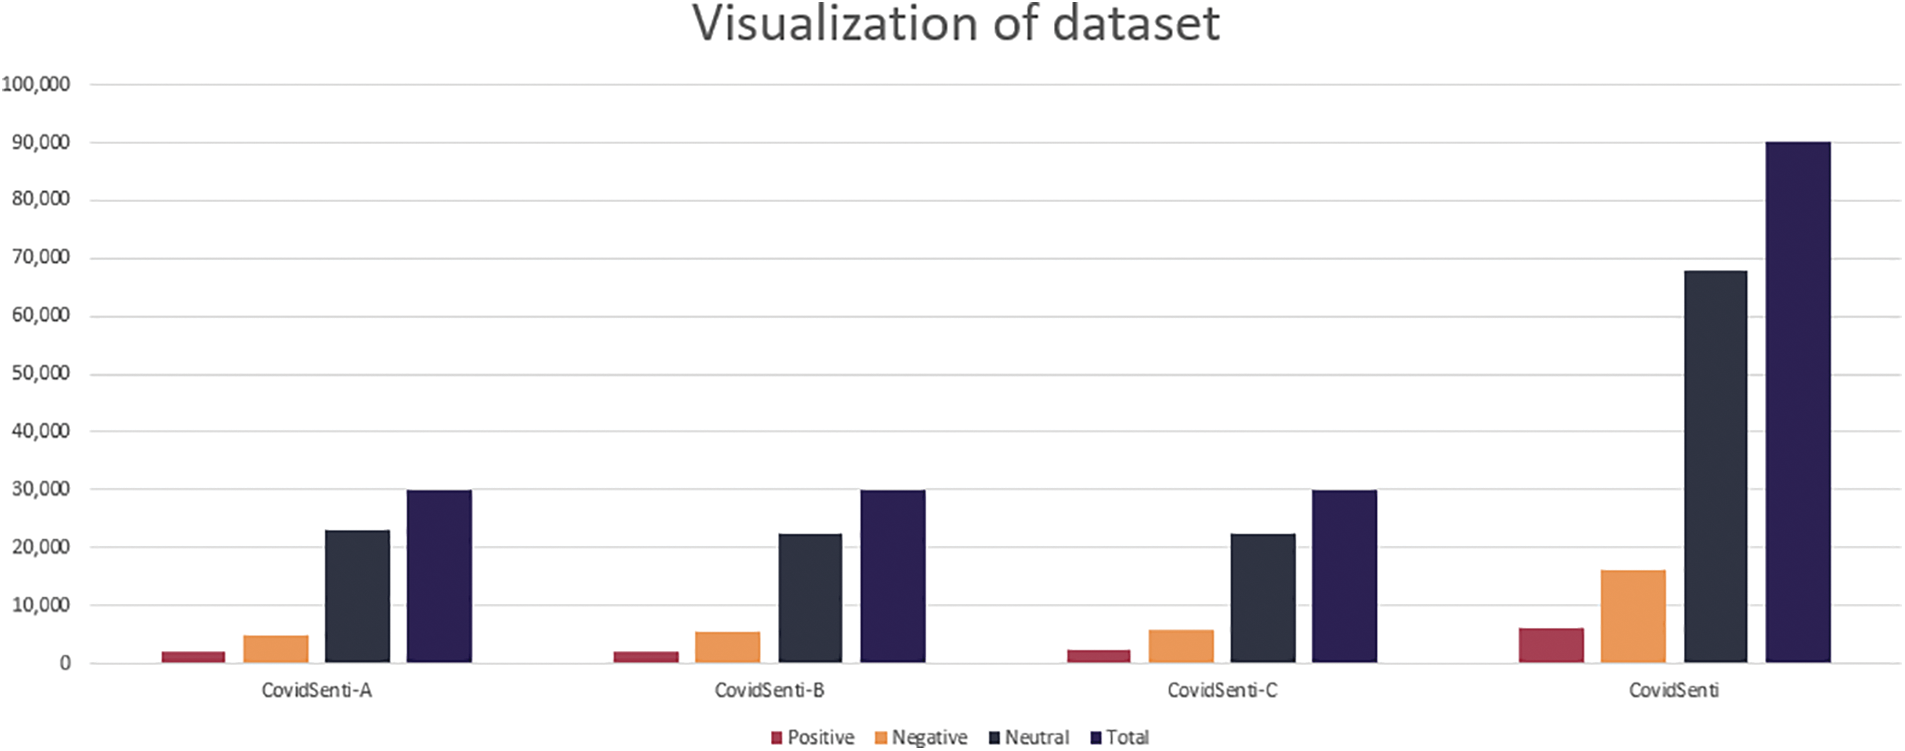
Figure 2: The three dataset samples bar chart
Digital data is produced to make the most of the benefits of intelligent decision-making. So, the categorization of text is one of the most important parts, and that includes preprocessing and feature extraction. The steps of data preprocessing in our study are: (a) The first step of the preprocessing was case folding where all the capital characters in the data were folded into lowercase. This step is taken to prevent similar words from being misinterpreted as different words due to capitalization, (b) In social media, people use hashtags to represent the category of their topic. For example, in my data, people are using #Covid19, #Coronavirus, etc. We do not necessarily need hashtags for sentiment analysis. Thus, hashtag characters are removed in this step. Hashtag words are useful in the analysis, and (c) Tokenization is one of the foremost pieces of work when it comes to functioning with textual data. Tokenization is basically splitting an expression, sentence, section, or even a complete text file into minor elements, for instance, separate words or expressions. Each of these minor elements is referred to as a “token.” Tokens are the finish line of one word and the starting point for another. Tokens are observed as the initial step for lemmatization, and (d) Stop words are one of the most standard methods for dropping noise in redundant data. Stop words remove minor semantic values such as the, of, is, an, etc. It has no negative impact on the understanding of sentence semantic valence lastly (e) Lemmatization is a common method and another technique for connecting many words to their root words. This technique studies a word inflectionally and eliminates its inflectional conclusion, generating its base arrangement, or lemmatize, as it discovered in a dictionary.
The count vectorizer is built unconditionally on the number of word events in the text. The count vectorization technique performs both the counting of how many times a token occurs and the process of tokenization [17]. The count vectorizer is based on various parameters that are used to purify the type of features. Individuals can construct features by means of any one of these three parameters: unigram, bigram, or trigram. where bigram is used for the experiment.
3.3.2 Term Frequency Inverse Document Frequency (TF-IDF)
The term frequency-inverse document frequency is a popular approach to calculating the state of a word in the text [18]. The term frequency (TF) of a specific phrase (t) is calculated as the number of times a phrase appears in a text in comparison to the total number of words in the document (Eq. (1)). IDF (Inverse Document Frequency) is used to estimate the significance of a word (Eq. (2)).
There are various words that occur frequently, but they don’t have any sentiment in them, such as an, are, is, etc. TF-IDF will remove all such null values because they affect the analysis of a model.
3.4.1 Support Vector Machine (SVM)
SVM is a linear approach and has been used for emotion mining and sentiment analysis in numerous research studies SVM is a well-known machine-learning approach for classifying linear problems. These hyperplanes are selected in a manner that optimizes the distance from the closest data point in every class. The linear SVM is the simplest and fastest procedure, assuming a linear division of classes [19,20]. The specific steps involved in training an SVM model for sentiment analysis are below:
– Creating feature vectors: Each text document is represented as a feature vector, with each element of the vector corresponding to a specific word in the vocabulary. The value of each element is the frequency of that word in the document or some other measure of its importance.
– Splitting the data into training and test sets: It is common to split the data into a training set, used to train the model, and a test set, used to evaluate the model’s performance.
– Training the SVM model: This involves finding the hyperplane that maximally separates the different classes by maximizing the margin. The SVM model is trained using an optimization algorithm that adjusts the model’s parameters to minimize the classification error.
– Evaluating the model’s performance: Once the model is trained, it can be tested on the test set to evaluate its performance.
This involves calculating metrics such as accuracy, precision, and recall, and comparing the results to those obtained with other algorithms. Fig. 3 shows the workings of the SVM. A simple linear SVM approach mechanism is that a straight line separates two classes, with data on one side of the line representing one class and data on the other side of the line representing a different category, which means there can be an infinite number.
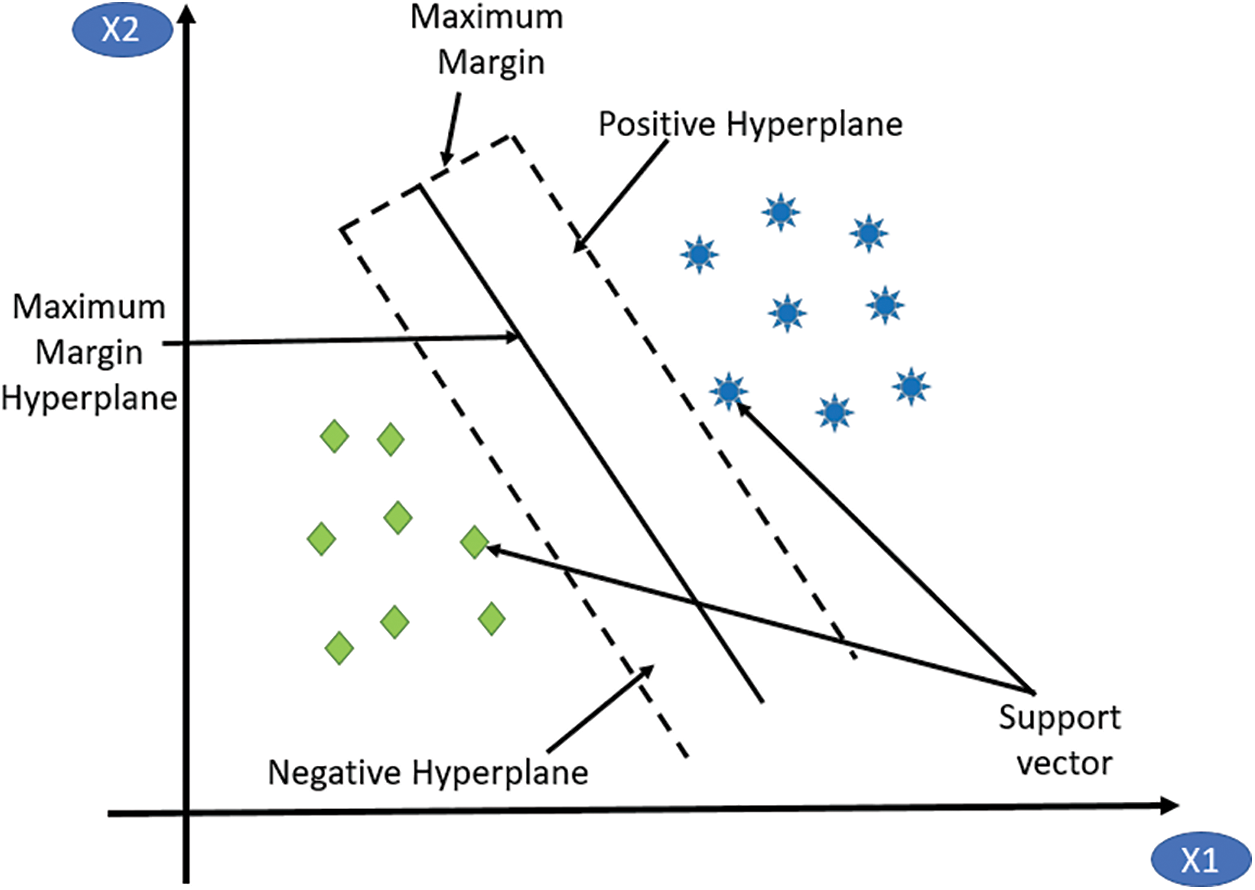
Figure 3: SVM algorithm [20]
3.4.2 Long Short-Term Memory (LSTM)
Regular neural networks are complicated by gradient information and are incapable of absorbing long-term dependencies. LSTM is a sort of repeated neural network; however, it can acquire those long-term dependencies. LSTM is a kind of RNN, but LSTM has some supplementary components that produce a more established model. It manages the stream of information and concludes that there is no harm in gradients [19]. It included a memory cell that stored complete information, as well as three main components: the input gate, the output gate, and the forget gate The LSTM architecture are shown in Fig. 4.
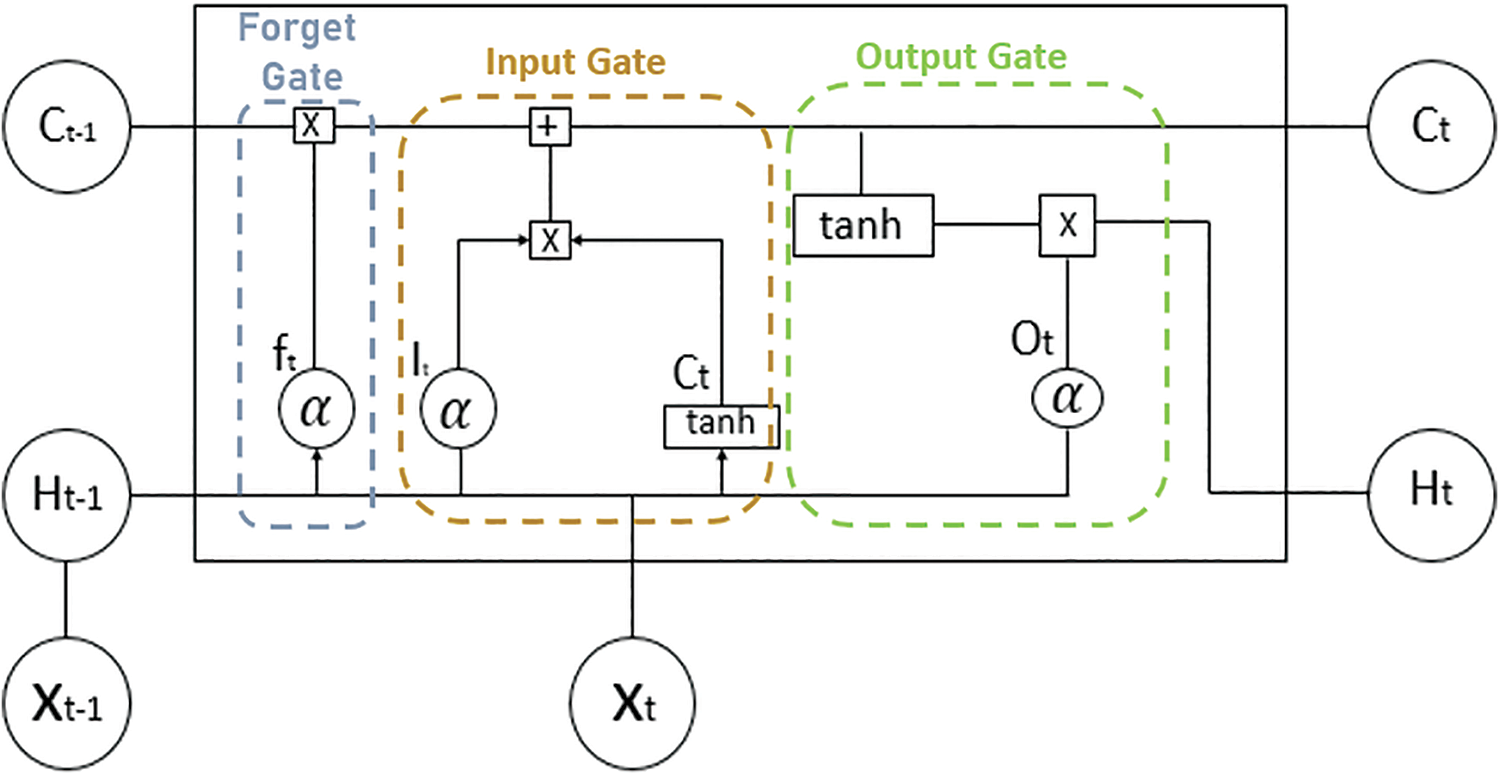
Figure 4: Architecture of LSTM [21]
The architecture of LSTM involves the following components:
• Xt-1 (current event) and Xt-2 (short-term memory) are combined so the important information we have learned recently from short-term memory can be applied to the current input.
• Ct-1 (long-term memory) goes through the forget gate, and it forgets all the unimportant and useless information.
• Information from long-term memory that we still remember and short-term memory and events, e.g., Xt-1, are blended together in an input gate that also worked like a modified learn gate.
• This gate also uses both long and short-term memory from the previous gate and blends useful information to create short-term memory for further processing and generating output from the current cell.
In the context of sentiment analysis, an LSTM model can be trained to classify text as having positive, negative, or neutral sentiment. To do this, the model first processes the input text to extract features such as word embeddings. These features are then input to the LSTM model, which processes the sequence of features and produces a prediction for the sentiment of the text. The specific steps they took to implement an LSTM model for sentiment analysis on Covid-19 tweets. This includes:
– Creating word embeddings: Word embeddings are dense vector representations of words that capture the meaning and context of the words in the text.
– Splitting the data into training and test sets: As with the SVM model, it is common to split the data into a training set and a test set.
– Training the LSTM model: The LSTM model is trained using an optimization algorithm such as stochastic gradient descent. The model’s parameters are adjusted to minimize the classification error on the training set.
– Evaluating the model’s performance: Once the model is trained, it can be tested on the test set to evaluate its performance. This could involve calculating metrics such as accuracy, precision, and recall, and comparing the results to those obtained with other algorithms.
After the preprocessing stage, the tweets were filtered, and as a result, only valid words or text remained. The maximum number of features is then set to 20,000, and the tokenizer is used to convert text into sequences that the network can use as input. After that, the data and text pads were added, and the sequence of input was truncated in order to maintain an equal length of text for modeling. Multiple layers and embedding were added to design the model. The initially added layer was the layer of embedding, which used vectors of length 100 in order to demonstrate every word in the text or data.
SpatialDropout1D was used to implement dropouts in the NLP models. The main reason behind using dropouts here with LSTM is to enhance the model’s performance and reduce overfitting. The activation function used for the model is Softmax, which adds non-linearity to the outcomes and results. And the Adam optimizer is used as it is one of the best among other adaptive optimizers and it takes less time with more efficiency. The model has a kind of multi-classification problem, and the loss function we used, categorical cross-entropy, does not resist the model’s attempts to classify between a limited number of classes. Table 1 displays the details of the LSTM model’s hyperparameters.

Then, training and test data were declared, and the model was trained with an epoch size of 5 and a batch size of 32, using 80% of the training dataset and 20% of the test dataset. The accuracy obtained by that is 0.87 on the COVIDSENTI dataset, as shown in Fig. 5, and that is one of the highest accuracy rates among all the machine learning and deep learning models. Moreover, the confusion matrix of LSTM is shown in Fig. 6.
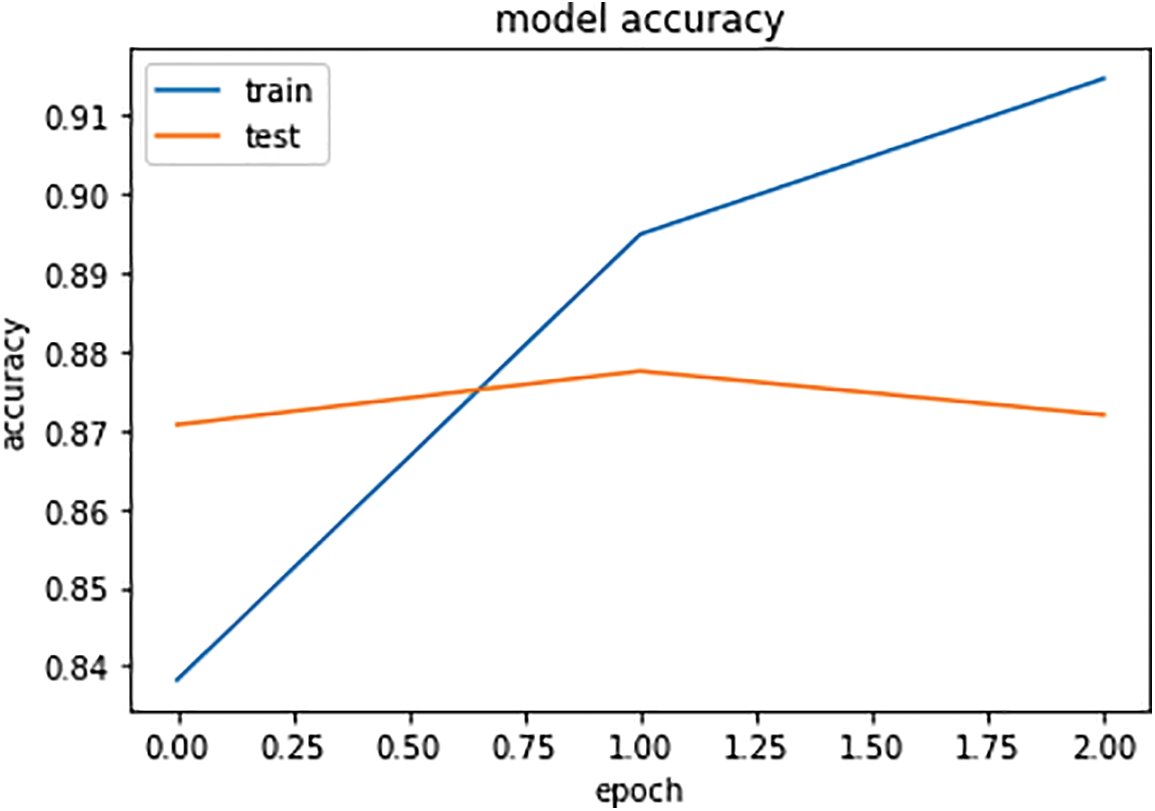
Figure 5: Accuracy graph of LSTM
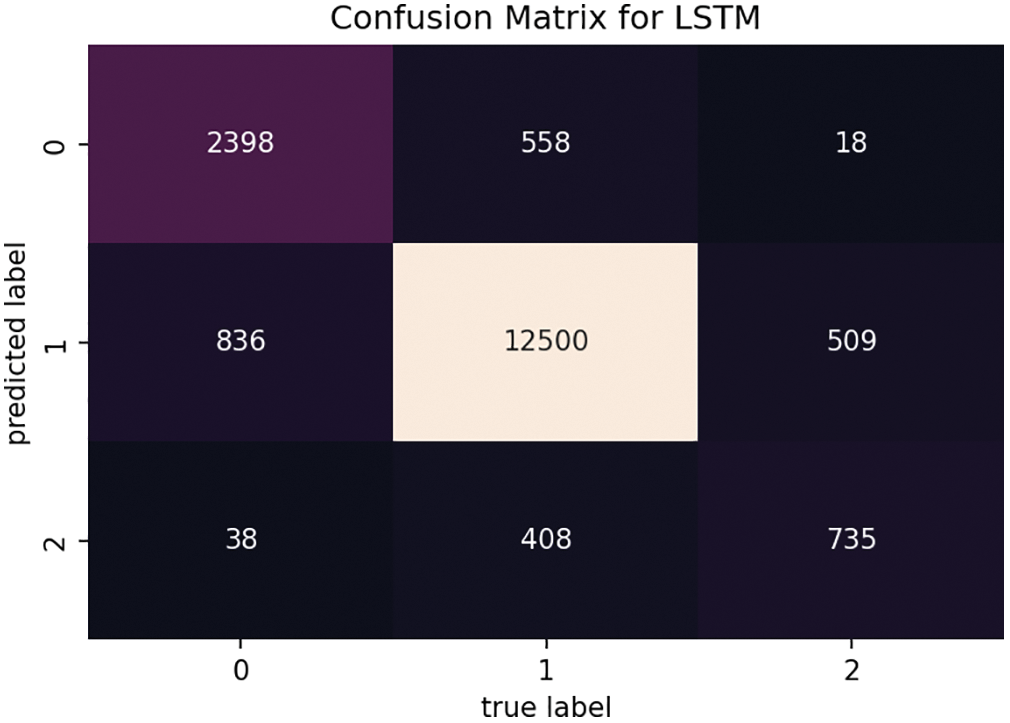
Figure 6: Confusion matrix of LSTM
4.2 Machine Learning-Based Models
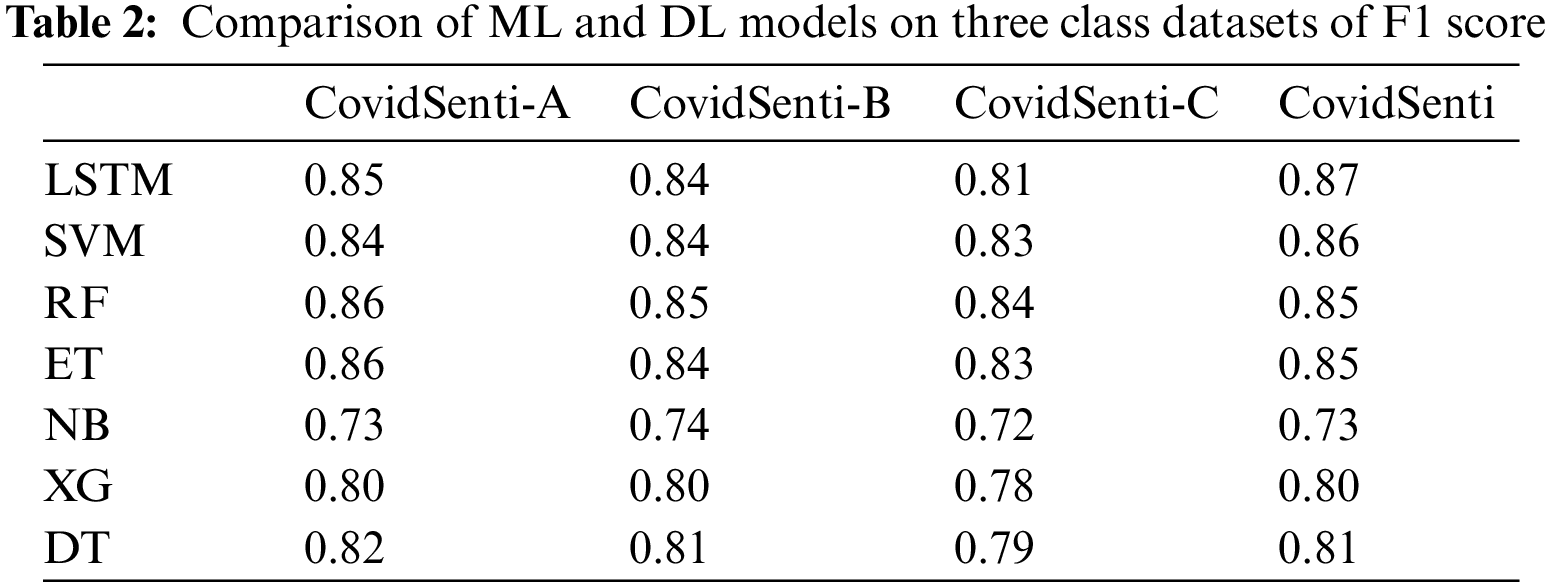
After the preprocessing stage, the class of train-test-split was used from the sklearn model-selection library to split the data into training and testing sets. The approach uses TF-IDF vectorization as the first parameter, preprocessing as the second, and the test size as the third. where a value of 0.2 has been assigned for test size, which means that 20% of the data is used for testing and the remaining 80% for training. Machine learning-based classifiers such as SVM, Decision Tree (DT), Random Forest (RF), Extra Tree (ET), and Extreme Gradient (XG)Boosting were applied to train the data. As shown in Table 2, the SVM predicts an F1-score of 0.86 which is slightly lower than the LSTM. Random forest and extra tree both predict 0.85, which is slightly lower than SVM. XG-Boost predicts a 0.80 F1-score, which is lower than other ML models. The decision tree predicts slightly better than XG-boost as demonstrated in Table 2, the F1-score of the Decision tree is 0.81.
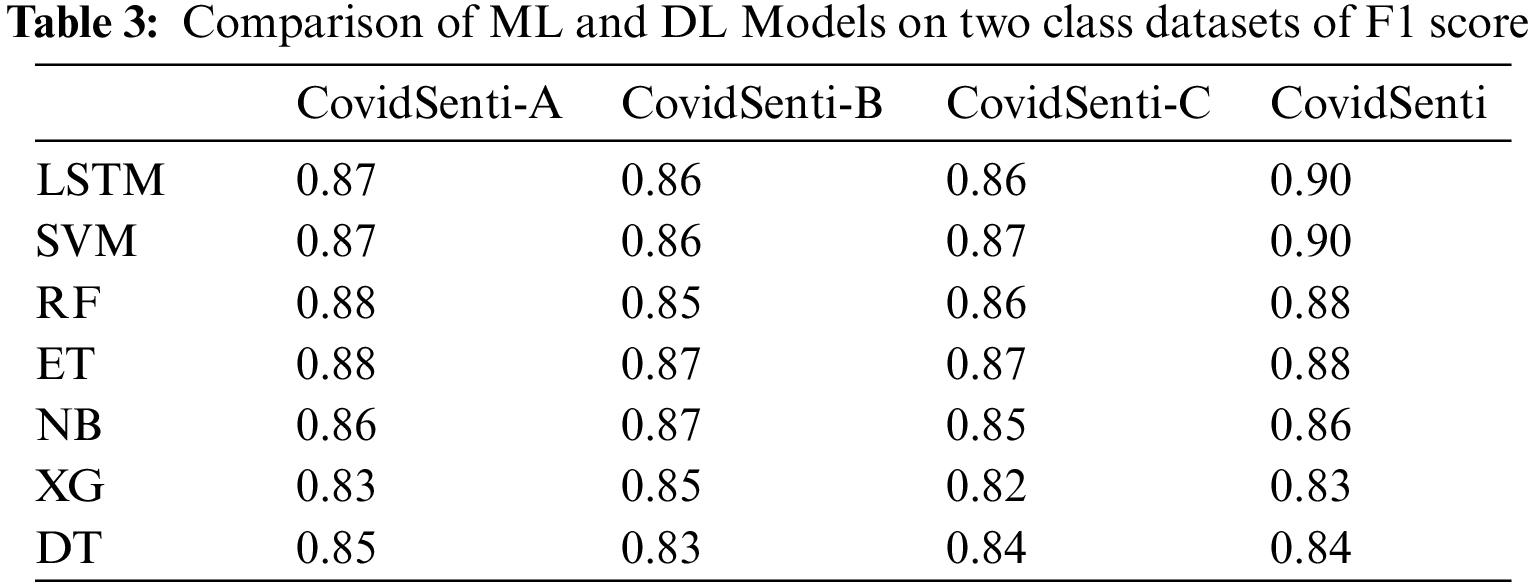
Machine-learning-based models give a lot better accuracy with two classes of data, as we can see in Table 3. SVM achieves the same F1 score as LSTM, proving that machine learning works best with binary features.
A confusion matrix of mass x × x corresponding with a classifier demonstrates the expected and authentic classification, where x is the number of various classes. Table 4 indicates a confusion matrix for x = 2, where the record has the following meaning field.
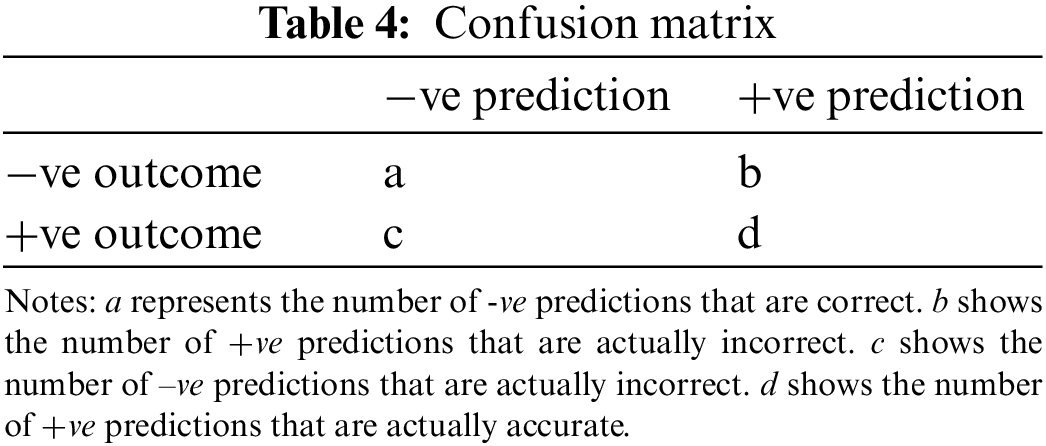
The accuracy and error of prediction can be obtained from the following matrix:
F-measure is calculated from precision and recall. F1 score is used as a valuation metric to investigate sentiment classification.
The overall performance of text-based mining is defined by precision and recall. Precision is used to estimate preciseness, and recall is the calculator of completeness. Precision means the ratio of the number of samples that are appropriately labeled as optimistic to the number of instances classified as positive labels. The recall is the section where the positives are correctly labeled according to the number of positively labeled samples.
The outcomes of sentiment analysis using machine learning and deep learning-based models such as long short-term memory, support vector classifier, random forest, extra trees, naïve Bayes, extreme gradient boost, and decision tree. The results are compared on the basis of two-class data and tree-class data. It is also stated that machine learning classifiers will provide us with better results than deep learning-based models, or that deep learning-based models are better than machine learning-based models. Following that, the study is compared to the cutting-edge study which uses the same dataset for sentiment analysis. Some of their best machine learning models will be compared with the proposed machine learning models, and their best deep learning models will be compared with the proposed deep learning models.
At first, classification was performed on the data using all three classes positive, negative, and neutral using ML and DL techniques. The following graph represents the F1-score of LSTM, SVM, Random Forest, Extra Tree, Naive Bays, XG-Boost, and Decision Tree implemented on all four sets of data: CovidSenti, CovidSenti-A, CovidSenti-B, and CovidSenti-C. As we can see using all three classes of data, the highest results are 0.87 on CovidSenti using a deep learning model, LSTM, as shown in Fig. 7 below.
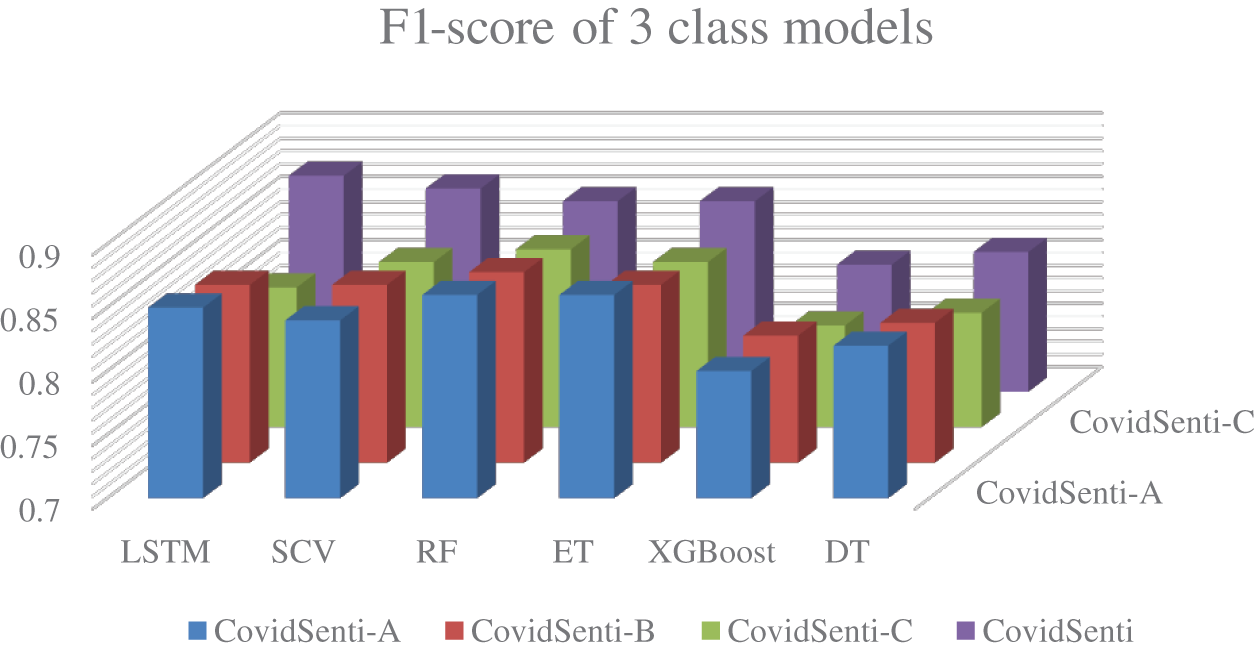
Figure 7: Comparison of ML and DL models on three class data
Secondly, the classification was performed on the data using only two classes, positive and negative, using ML and DL techniques, as ML is known for giving better results with two classes. The following graph represents the F1-score of LSTM, SVM, Random Forest, Extra Tree, Naive Bays, XG-Boost, and Decision Tree implemented on all four sets of data: CovidSenti, CovidSenti-A, CovidSenti-B, and CovidSenti-C. Long short-term memory and the support vector classifier achieve a 0.90 F1-score, which is the highest among other classifiers. Fig. 8 shows the comparison of ML and DL models for two classes.
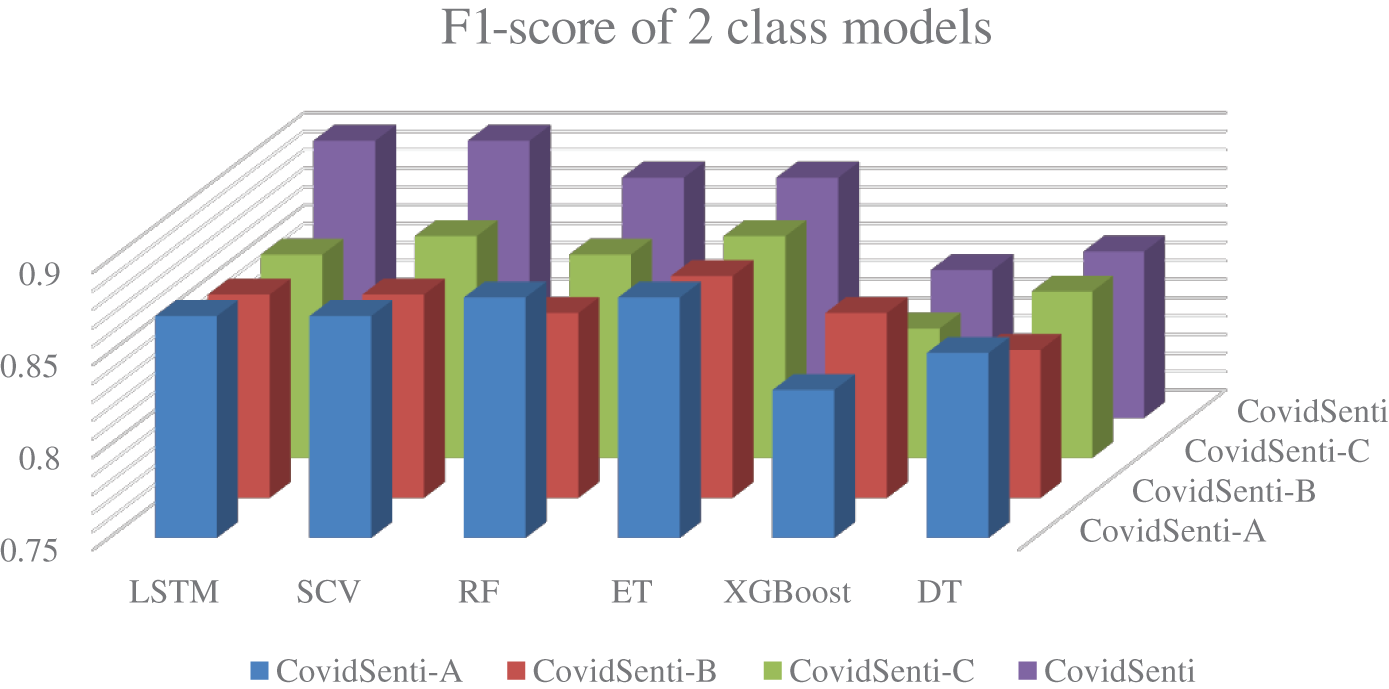
Figure 8: Comparison of ML and DL models on two class data
The purpose of the study was to analyze the sentiments of the people, what they were feeling during the pandemic, how they react to the disease, and how the government responds in coordination with COVID-19. The data was based on tweets, as Twitter is one of the most popular microblogging sites. The data were preprocessed to remove raw data and then driven through different ML and DL-based classifiers to evaluate which model is going to give us the best outcomes. Where we found it in 3-class data, LSTM outperformed all the other approaches, and SVM was just one point behind. In two-class data, LSTM and SVM both generate equally good results because SVMs are best known for binary data.
The study is compared with the previous study in terms of F1 scores produced by different machine learning models as well as deep learning models on all four sets of data. Mainly, the reason for comparing the outcomes of both studies is the common dataset used for the classification of that dataset. Table 5 demonstrates the performance of some machine learning-based models, where the first three ML models are the results from research study. It is obvious that machine learning models give us better results than state-of-the-art studies.
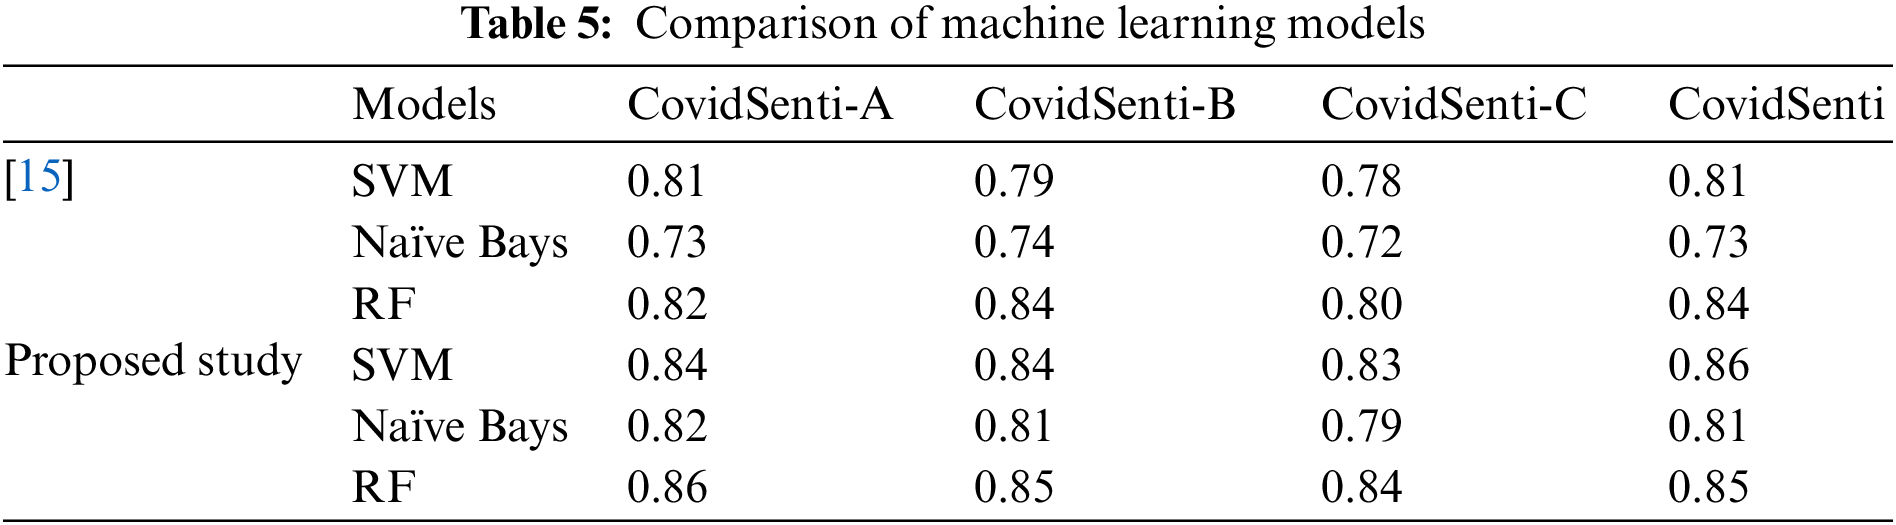
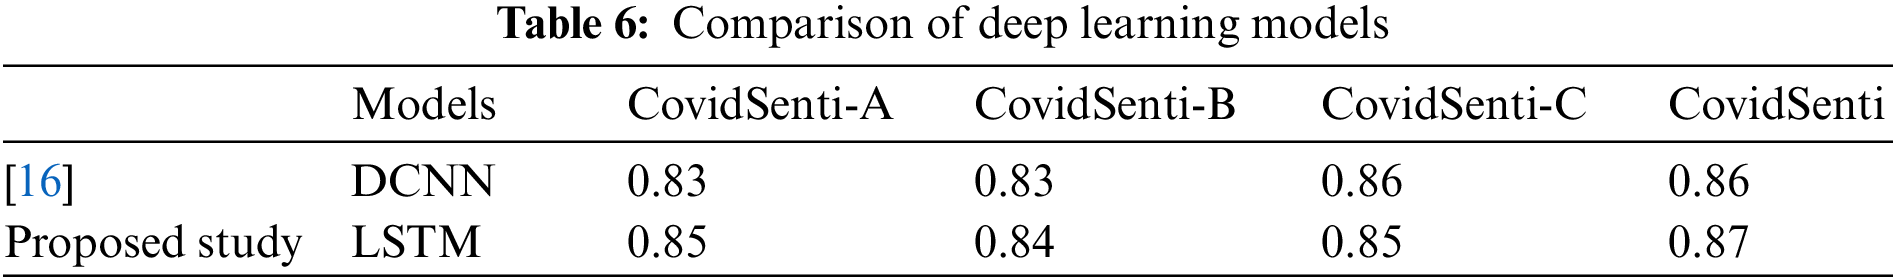
Table 6 shows the performance of the deep learning model DCNN, which achieves the highest accuracy among deep learning models in the research study, compared with the LSTM, which achieves the highest accuracy among both machine learning and deep learning approaches. LSTM is slightly better than DCNN.
The COVIDSenti dataset provides a valuable resource for sentiment analysis related to the COVID-19 pandemic. Similarly, the Hajj dataset also offers a valuable resource for analyzing sentiment related to the Hajj pilgrimage. The Hajj dataset contains tweets related to the annual Islamic pilgrimage to Mecca, which is a significant event for millions of Muslims worldwide. The dataset includes 5,000 tweets and is divided into three categories based on sentiment: 1798 positive, 1210 negative, and 1992 neutral. The sentiment analysis of the Hajj dataset can reveal the emotions and attitudes of the pilgrims and the broader Muslim community towards the annual Islamic pilgrimage during the COVID-19 pandemic. This analysis can provide insights into how the pandemic has affected the perceptions, experiences, and satisfaction levels of the pilgrims and the Muslim community. Analyzing the sentiment in tweets related to the Hajj pilgrimage during the pandemic can help researchers and organizations identify how the pilgrims are reacting to the disease and the measures taken by the government to manage the pandemic. Like the CovidSenti dataset, the Hajj dataset is divided into subcategories based on the sentiment expressed in the tweets. Fig. 9 shows the accuracy of 0.89 obtained by LSTM on the Hajj dataset, indicating that the model accurately predicted the sentiment of tweets within the dataset. Fig. 10 presents the confusion matrix for the LSTM model, which reveals that the LSTM model’s accuracy on the Hajj dataset is lower than that achieved on CovidSenti datasets, with accuracy rate of 80%. This disparity in performance could be attributed to differences in the nature and intricacies of the datasets as well as potential biases in the data annotation process. Additionally, the limited size of the Hajj dataset poses a challenge in terms of model training and generalization to unseen data.
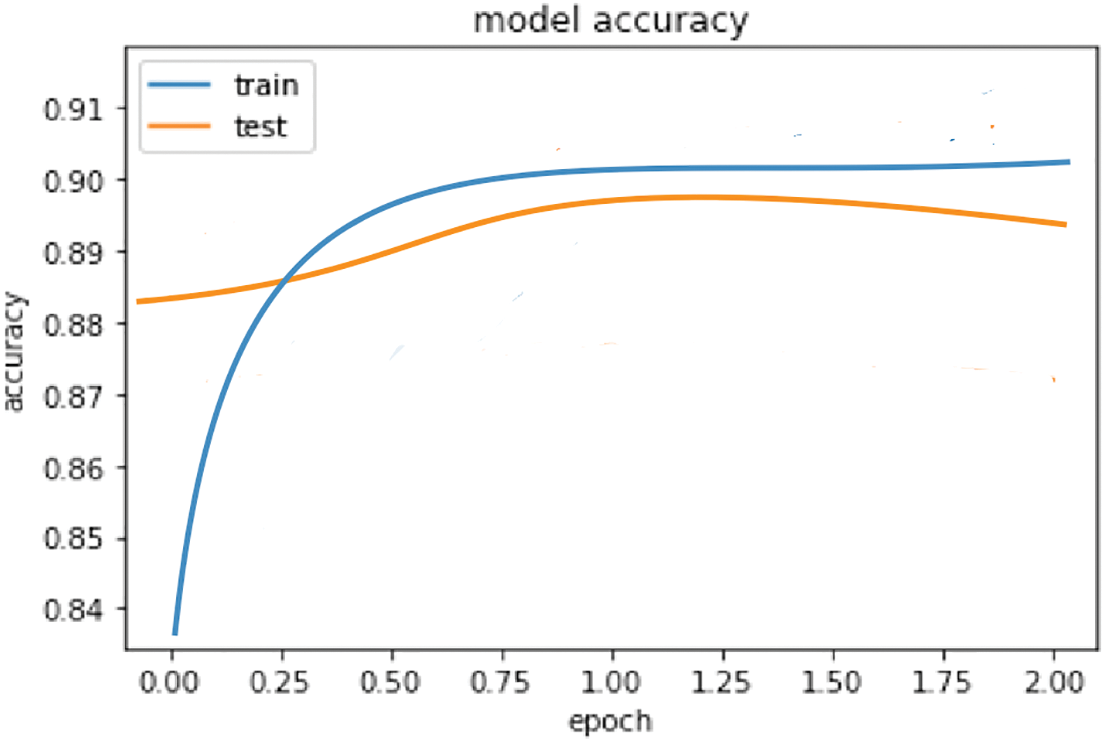
Figure 9: Accuracy graph of LSTM on Hajj dataset
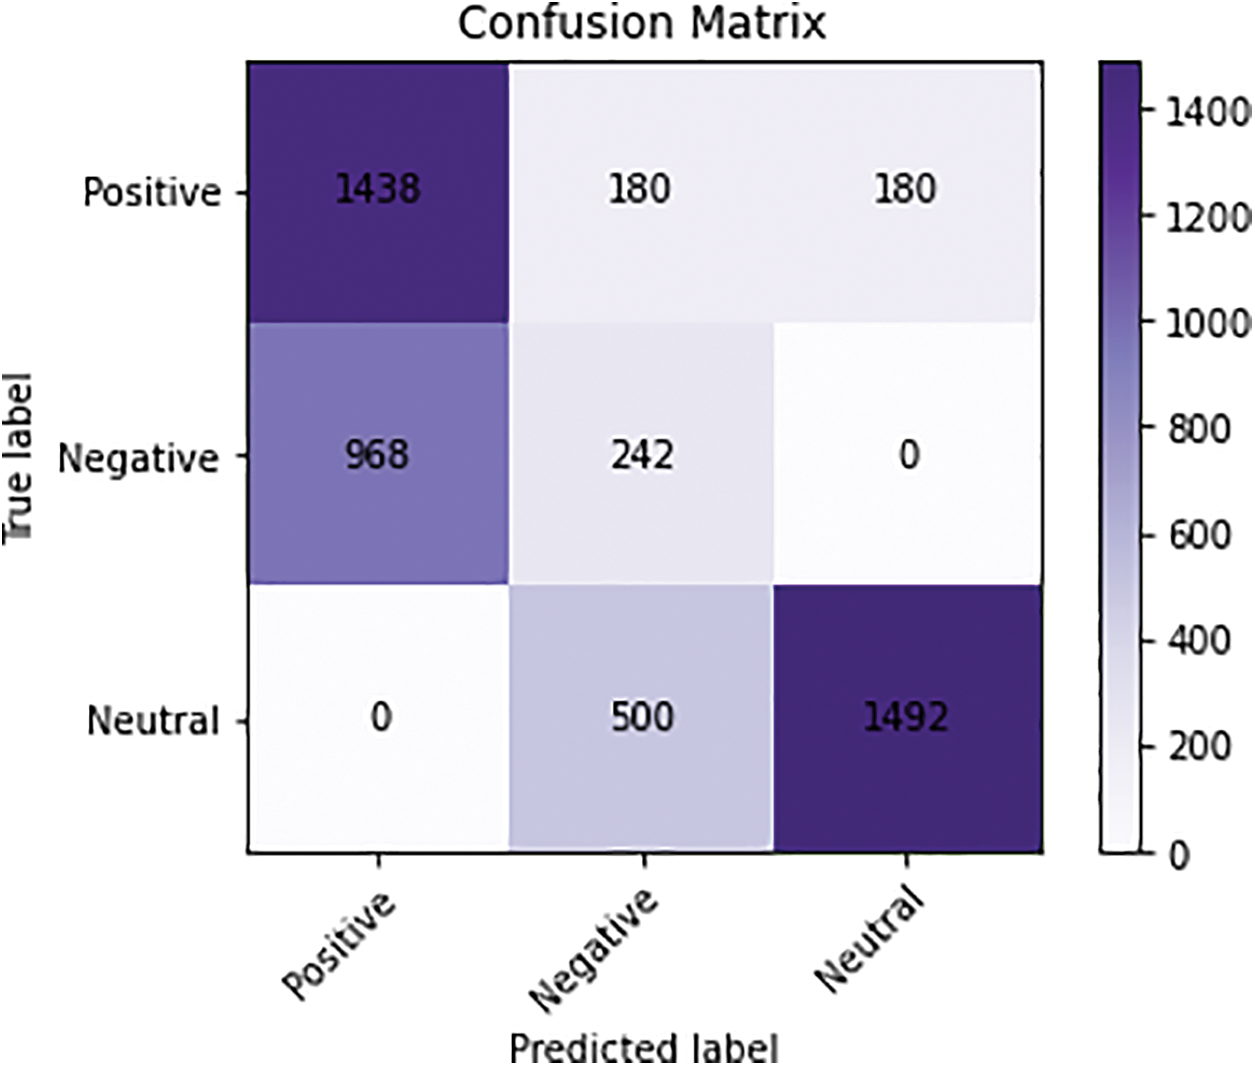
Figure 10: Confusion matrix of LSTM on Hajj dataset
At the end we can say the contributions could be in terms of academics, practical and policy as follow:
• The paper may contribute to the body of knowledge in the field of sentiment analysis by presenting new methods and approaches for identifying and classifying sentiments in text related to COVID-19.
• The paper may also provide insights into the effectiveness of different artificial intelligence models for sentiment analysis, and contribute to the understanding of the strengths and limitations of these models.
• The paper may provide practical guidance for organizations and individuals looking to perform sentiment analysis on COVID-19-related text, such as tweets.
• The results of the study may inform the development of sentiment analysis tools or software that could be used in various applications, such as crisis management, marketing and communication, and customer service.
• The paper may inform policy decisions related to COVID-19 by providing insight into public opinion and sentiment toward the pandemic.
• The results of the study could be used to inform the development of communication strategies or messaging related to COVID-19 by policymakers and public health officials.
The advantage of our method the Long Short-Term Memory (LSTM) is effective for sentiment analysis compared to traditional machine learning approaches as used in the proposed method. However, there are some limitations of our proposed method, firstly our method relies on a large dataset of tweets, which may not be available or accessible in all contexts. Secondly, there is a risk of overfitting when applying the LSTM model with three classes. Lastly, the proposed method also may not be able to capture the nuances of human emotions and attitudes and may lead to overgeneralization, and may not be accurate for all situations.
In this study, we have proposed architectures based on machine learning and deep learning for emotion mining, an emerging topic in machine learning. The challenge of manually sorting through vast amounts of text data is compounded by the complexities of English grammar and other languages, making precise identification of sentence-level sentiment analysis difficult. Our model was trained on 90,000 tweets that were further classified into three classes of 30 thousand tweets each, based on government actions related to the coronavirus pandemic. We evaluated the performance of a deep learning-based model (LSTM) against several machine learning models, including SVM, DT, RF, ET, and XG-Boost. Our experiments showed that the LSTM model outperformed the others, achieving 87% accuracy on a three-class dataset, while LSTM and SVM produced 90% accuracy on a two-class dataset. Due to limitations on time and computational resources, many possibilities for future research have been identified. For example, further improvement of the classifier could be achieved by extracting additional characteristics from tweets or by exploring other classifiers. Additionally, other deep learning models such as transformer-based models such as BERT or PyTorch may provide more accurate results. While the applications of this study are primarily relevant to issues surrounding the coronavirus pandemic and mental health, the methods used can be applied to other similar emotional research topics.
Funding Statement: The authors would like to thank the Deanship of Scientific Research at Umm Al-Qura University for supporting this work by Grant Code: (22UQU4400257DSR01).
Availability of Data and Materials: Data derived from public domain resources COVIDSenti: A large-scale benchmark Twitter data set for COVID-19 sentiment analysis, Accessed: March. 01, 2022. [Online]. Available: DOI:10.1109/TCSS.2021.3051189.
Conflicts of Interest: The authors declare that they have no conflicts of interest to report regarding the present study.
References
1. H. Lu, C. W. Stratton and Y. W. Tang, “Outbreak of pneumonia of unknown etiology in Wuhan, China: The mystery and the miracle,” Journal of Medical Virology, vol. 92, no. 4, pp. 401, 2020. [Google Scholar] [PubMed]
2. M. J. Awan, M. H. Bilal, A. Yasin, H. Nobanee, N. S. Khan et al., “Detection of Covid-19 in chest x-ray images: A big data enabled deep learning approach,” International Journal of Environmental Research and Public Health, vol. 18, no. 18, pp. 10147, 2021. [Google Scholar] [PubMed]
3. M. Lotfi, M. R. Hamblin and N. Rezaei, “COVID-19: Transmission, prevention, and potential therapeutic opportunities,” Clinica Chimica Acta, vol. 508, pp. 254–266, 2020. [Google Scholar]
4. Jr. J. A. Siordia, “Epidemiology and clinical features of COVID-19: A review of current literature,” Journal of Clinical Virology, vol. 127, no. 3, pp. 104357, 2020. [Google Scholar] [PubMed]
5. L. Haafza, A. M. J. Awan, A. Abid, A. Yasin, H. Nobanee et al., “Big data Covid-19 systematic literature review: Pandemic crisis,” Electronics, vol. 10, no. 24, pp. 3125, 2021. [Google Scholar]
6. A. T. Nagi, M. J. Awan, M. A. Mohammed, A. Mahmoud and A. Majumdar, “Performance analysis for COVID-19 diagnosis using custom and state-of-the-art deep learning models,” Applied Sciences, vol. 12, no. 12, pp. 6364, 2022. [Google Scholar]
7. M. J. Awan, M. Shafry, H. Nobanee, A. Munawar, A. Yasin et al., “Social media and stock market prediction: A big data approach,” Computers, Materials & Continua, vol. 67, no. 2, pp. 2569–2583, 2021. [Google Scholar]
8. M. Bhat, M. Qadri, M. Kundroo, N. Ahanger and B. Agarwal, “Sentiment analysis of social media response on the Covid19 outbreak,” Brain, Behavior, and Immunity, vol. 87, pp. 136, 2020. [Google Scholar] [PubMed]
9. D. Sharma, M. Sabharwal, V. Goyal and M. Vij, “Sentiment analysis techniques for social media data: A review,” in First Int. Conf. on Sustainable Technologies for Computational Intelligence, Singapore, Springer, pp. 75–90, 2020. [Google Scholar]
10. A. Mohamed, Z. M. Zain, H. Shaiba, N. Alturki, G. Aldehim et al., “Lexdeep: Hybrid lexicon and deep learning sentiment analysis using Twitter for unemployment-related discussions during covid-19,” Computers, Materials & Continua, vol. 75, no. 1, pp. 1577–1601, 2023. [Google Scholar]
11. A. V. Yeole, P. A. Dhakade and S. R. Kulkarni, “A review of deep learning techniques for detection and diagnosis of COVID-19 using CT images,” Journal of Medical Systems, vol. 44, no. 12, pp. 1–9, 2020. [Google Scholar]
12. C. K. Pastor, “Sentiment analysis of Filipinos and effects of extreme community quarantine due to coronavirus (Covid-19) pandemic,” pp. 3574385, 2020. Available at SSRN: https://doi.org/10.2139/ssrn.3574385 [Google Scholar] [CrossRef]
13. S. Renzo, L. Scarallo, L. M. Antoniello, M. Bramuzzo, A. Chiaro et al., “Impact of Covid-19 pandemic on pediatric endoscopy: A multicenter study on behalf of the sigenp endoscopy working group,” Digestive and Liver Disease, vol. 54, no. 5, pp. 572–579, 2022. [Google Scholar] [PubMed]
14. S. S. Aljameel, D. A. Alabbad, N. A. Alzahrani, S. M. Alqarni, F. A. Alamoudi et al., “A sentiment analysis approach to predict an individual’s awareness of the precautionary procedures to prevent Covid-19 outbreaks in Saudi Arabia,” International Journal of Environmental Research and Public Health, vol. 18, no. 1, pp. 218, 2021. [Google Scholar]
15. S. Akila, “Sentiment analysis tracking of COVID-19 vaccine through tweets,” Journal of Ambient Intelligence & Humanized Computing, pp. 1–9, 2022. https://doi.org/10.1007/s12652-022-03805-0 [Google Scholar] [PubMed] [CrossRef]
16. K. N. Alam, M. S. Khan, A. R. Dhruba, M. M. Khan, J. F. Al-Amri et al., “Deep learning-based sentiment analysis of COVID-19 vaccination responses from Twitter data,” Computational and Mathematical Methods in Medicine, vol. 2021, pp. 1–15, 2021. [Google Scholar]
17. U. Krzeszewska, A. Poniszewska-Marańda and J. Ochelska-Mierzejewska, “Systematic comparison of vectorization methods in classification context,” Applied Sciences, vol. 12, no. 10, pp. 5119, 2022. [Google Scholar]
18. F. Shehzad, A. Rehman, K. Javed, K. A. Alnowibet, H. A. Babri et al., “Binned term count: An alternative to term frequency for text categorization,” Mathematics, vol. 10, no. 21, pp. 4124, 2022. [Google Scholar]
19. B. AlBadani, R. Shi and J. Dong, “A novel machine learning approach for sentiment analysis on Twitter incorporating the universal language model fine-tuning and SVM,” Applied System Innovation, vol. 5, no. 1, pp. 13, 2022. [Google Scholar]
20. R. Muzzammel and A. Raza, “A support vector machine learning-based protection technique for MT-HVDC systems,” Energies, vol. 13, no. 24, pp. 6668, 2020. [Google Scholar]
21. D. Mahto, S. C. Yadav and G. S. Lalotra, “Sentiment prediction of textual data using hybrid convbidirectional LSTM model,” Mobile Information Systems, vol. 2022, no. 4, pp. 1–11, 2022. [Google Scholar]
Cite This Article
 Copyright © 2023 The Author(s). Published by Tech Science Press.
This work is licensed under a Creative Commons Attribution 4.0 International License , which permits unrestricted use, distribution, and reproduction in any medium, provided the original work is properly cited.
 Downloads
 Citation Tools