
 Submit a Paper
 Propose a Special lssue
 Open Access
ARTICLE
Applying Customized Convolutional Neural Network to Kidney Image Volumes for Kidney Disease Detection
1 Department of Computer Science, Prince Sattam Bin Abdulaziz University, Al-Kharj, 11942, Saudi Arabia
2 Faculty of Computing and Information Technology, King Abdulaziz University, Jeddah, 21589, Saudi Arabia
3 Department of Electrical and Computer Engineering, Lebanese American University, Byblos, Lebanon
* Corresponding Author: Ali Altalbe. Email:
Computer Systems Science and Engineering 2023, 47(2), 2119-2134. https://doi.org/10.32604/csse.2023.040620
Received 25 March 2023; Accepted 23 May 2023; Issue published 28 July 2023
A correction of this article was approved in:
Correction: Applying Customized Convolutional Neural Network to Kidney Image Volumes for Kidney Disease Detection
Read correction
 View Full Text
 Download PDF
Abstract
Kidney infection is a severe medical issue affecting individuals worldwide and increasing mortality rates. Chronic Kidney Disease (CKD) is treatable during its initial phases but can become irreversible and cause renal failure. Among the various diseases, the most prevalent kidney conditions affecting kidney function are cyst growth, kidney tumors, and nephrolithiasis. The significant challenge for the medical community is the immediate diagnosis and treatment of kidney disease. Kidney failure could result from kidney disorders like tumors, stones, and cysts if not often identified and addressed. Computer-assisted diagnostics are necessary to support clinicians’ and specialists’ medical assessments due to the rising prevalence of chronic renal illness, the lack of experts, and the rising rates of assessment and monitoring, mainly in developing nations. Artificial Intelligence (AI) approaches such as machine, and deep learning has been used in literature for kidney disease detection; however, they still lack performance. This paper implements a deep learning-based Convolutional Neural Network (CNN) model for the classification and prognosis of kidney disease. We use a benchmark Computed Tomography (CT) kidney dataset for experimentation. The data is pre-processed, and then CNN extracts the features from the images. Results reveal that the proposed approach accurately classifies kidney disease with a considerable accuracy of 0.992%, 0.994% precision, 0.982% recall, and 0.987% F1-score. This study suggests using the proposed fine-tuned CNN model for kidney disease detection.Keywords
Machine and deep learning have been extensively used for various healthcare applications such as kidney disease detection, diabetes, brain tumor, breast cancer and cataract disease detection [1–7]. Kidney disease is the most common healthcare repercussion for billions of people worldwide, significantly raising the risk of premature death [8–11]. The World Health Organization (WHO) claims that chronic diseases concern emerging regions [12,13]. Early-stage CKD is curable, while later-stage it leads to renal failure [14,15]. The prevalence of chronic renal disease was the 16th leading cause of death in 2016 and is expected to rise towards the 5th position by 2040, which is more significant than 10% worldwide [16]. Kidney disease grows progressively over time and impacts how the urine system works. The development of waste materials in the blood causes additional health issues, many of which have similar symptoms to cardiovascular disease, including high and low blood pressure, nerve damage, diabetes, and bone issues. Chronic kidney disease sufferers are at risk for developing heart disease, diabetes, and hypertension [17,18].
Diabetes is characterized by hyperglycemia, which can affect the kidneys, heart, arteries, and eyes. Furthermore, heart attack, stroke, and chronic renal disease can be attributed to poorly controlled high blood pressure [19]. Among the various diseases, the most prevalent kidney conditions affecting kidney function are cyst growth, kidney stones, and tumor. The kidney cyst is the fluid-filled region with a thin wall that develops on the surface of the kidney. A cyst with a high-water level may form inside the kidneys: Hounsfield units range from 0 to 20 [20,21]. A kidney illness known as kidney stone, characterized by the formation of crystal clasts inside the kidneys, affects 12% of people worldwide [22]. One of the ten malignancies with the highest incidence rates worldwide is Renal Cell Carcinoma (RCC), sometimes a kidney tumor [23]. Patients with chronic kidney disease experience adverse effects, particularly in the later stages, which weaken their neurological and immune systems. Patients in underdeveloped nations may get the illness later, necessitating dialysis or renal transplantation [24,25]. Experts use glomerular filtration rate, a measure of kidney damage, to identify renal disorders. Age, medical tests, gender, and additional factors affect a patient’s glomerular filtration rate [26]. Pathology tests in conjunction with X-ray, Magnetic Resonance Imaging (MRI), CT, B-ultrasound, and technology are typical for detecting kidney problems [27]. The CT scanner employs X-ray photons to analyze the targeted area of the human body to produce a cross-sectional image that provides three-dimensional data on the target anatomy. CT scans are helpful research tools because they provide information and slice-by-slice visuals for kidney investigations [28].
Early kidney disease detection and diagnosis is a significant challenge for the medical community. Renewal failure may ensue if kidney anomalies, including tumors, stones, and cysts, are not discovered early and treated [29]. That is why one of the critical steps in preventing kidney failure is the early detection of renal diseases such as kidney cysts, stones, and tumors [30]. The two medical procedures used to detect chronic kidney disease are a blood test to assess glomerular filtrate levels and urine analysis to examine protein levels. Due to the growing number of people with chronic renal disease, the scarcity of specialists, and the exorbitant prices of diagnosis and therapy, particularly in developing nations, computer-assisted diagnostics are required to support doctors’ and radiologists’ clinical choices. AI approaches have been used in the early phases of disease diagnosis and disease prediction in the medical image processing industry, where Machine Learning (ML) techniques [31–34] and Deep Learning (DL) techniques [35–39] have been implemented. AI techniques have significantly helped the early diagnosis of chronic kidney disease. ML methods are used to detect chronic kidney disease earlier. Support Vector Machines (SVM) and Artificial Neural Networks (ANN) are among the most popular technologies. These techniques offer significant benefits for diagnosing a variety of situations, including clinical diagnosis. However, the capacity of these techniques to provide better performance still needs to be improved [40,41]. Considering these limitations, this study uses the CT kidney disease dataset, which includes the normal, cyst, tumor, and stone classes, to implement the deep learning-based CNN model to diagnose kidney illness. The main contributions of the research are given below in the listed form.
• This study employs a convolutional neural network model to identify kidney disease and presents a thorough performance analysis that explains image processing, feature extraction and classification.
• The dataset CT kidney disease having normal, stone, cyst, and tumor classes is used with 12,446 unique instances. Results reveal that the proposed approach achieves the best accuracy of 99.94% compared to traditional methods and existing studies.
The following sections comprise the paper’s structure: The literature study of machine learning and deep learning methods for diagnosing renal illness is included in Section 2. The research methodology for the proposed work, which uses the CT kidney disease dataset and deep learning model, is described in Section 3. The results are explained and discussed in Section 4. The conclusion of the work and suggestions for more research are included in Section 5.
In the literature review section, the background of kidney disease detection is provided using machine and deep learning techniques.
2.1 Machine Learning Techniques
ML techniques have been employed for various healthcare applications such as tumor identification, activity recognition, health evaluation, dementia detection, and many others [42–46]. Authors in [32] proposed a technique for accurately detecting chronic kidney disease by combining an information gain-based feature selection strategy with an expense Adaptive Boosting (AdaBoost) classifier. A technique like this can shorten screening times and save costs for chronic renal disease because only some diagnostic test values would be necessary for the diagnosis. The proposed strategy is compared to CKD prediction algorithms and well-known classifiers recently put forward. Authors in [33] pursue a method that uses ML techniques to develop practical tools for forecasting the incidence of chronic kidney disease. To be more precise, the study first employs class balancing to address the non-uniform distribution of instances inside the two classes, after which features are ranked and analyzed. Finally, several ML models are developed and evaluated using various performance metrics. The conclusions showed that the Rotation Forest (RotF) outperformed the other models.
Using big data platforms (Apache Spark), the author in [34] presents hybrid ML methods incorporating feature selection techniques designed to recognize chronic kidney disease. The essential features are chosen using the Relief-F and chi-squared feature selection approach. This research uses six different ML techniques and ensemble Gradient-Boosted Trees techniques. Each algorithm’s cross-validation and testing results have been calculated using full features, features chosen using Relief-F, and features selected using the chi-squared feature selection approach. The findings yielded that ML Classifiers performed best when using the selected features. Authors in [9] determine whether ML could accurately predict the risk of End-Stage kidney disease (ESKD) in patients with CKD. A continuous CKD cohort provided the data. The patient’s baseline features and blood sampling outcomes were vital predictors. The existence or absence of ESKD at the end of 5 years resulted from interest. Multiple imputations were used to replace the missing information. Different ML algorithms are implemented on the given data. The model obtained the best 0.90% accuracy.
Numerous DL techniques can significantly enhance disease classification and identification procedures such as COVID-19 identification, lung illness prognosis, skin cancer detection and many others [47–51]. The author [36] proposed the Heterogeneous Modified Artificial Neural Network (HMANN) for diagnosing, detecting, and segmenting chronic renal failure using the Internet of medical things platform. Moreover, the suggested HMANN is also categorized as an SVM and Multilayer Perceptron (MLP) using a Backpropagation (BP) technique. The proposed HMANN method for segregating the kidneys offers great accuracy while significantly reducing the time required to draw the contour. The region of renal interest is divided into the ultrasound image, which is used as the foundation for the proposed algorithm’s operation. The proposed algorithm provides 97.5% accuracy and a 99.7% of prediction ratio.
The author developed the DL Algorithm [37] to diagnose chronic renal illness from retinal scans, which can supplement current screening methods. The data for this study come from three population-based, cross-sectional and multiethnic studies carried out in Singapore and China. The deep learning system is created using data from 5188 patients in the Singapore Epidemiology of Eye Diseases study (SEED; participants ≥ 40 years old), and it is validated using data from 1297 patients. External testing was performed on two separate datasets: the Beijing Eye Study (BES, 1538 patients ≥ 40 years) and the Singapore Prospective Study Program (SP2, 3735 patients ≥ 25 years). An estimated glomerular filtration rate of less than 60 mL/min per 173m2 was used to diagnose chronic renal disease. The AUC is 0.911 for the image DL algorithm, 0.916 for the risk factor, and 0.938 for the hybrid deep learning algorithm in the SEED validation dataset. Authors in [52,53] proposed machine and deep learning models for the prognosis and early identification of chronic renal disease. The research’s authors of [38] aim to construct a DNN and assess its performance compared to other state-of-the-art ML techniques. For classification purposes, selected features are provided to ML models. During tests, the database’s missing values have all been replaced using the average of the corresponding features. The optimal parameters of the Neural Network (NN) are then fixed by setting the parameters and doing numerous trials. The most important traits are chosen using Recursive Feature Elimination (RFE). The proposed method can be helpful for neurologists in diagnosing chronic renal disease. Authors in [54] developed a new classification model with optimized feature selection based on a metaheuristic algorithm to diagnose chronic kidney disease. Data having missing values were initially removed during the pre-processing phase. Then, an evolutionary algorithms algorithm known as the Oppositional based Firefly Optimization (FFO) method identified the best collection of features, which aids in the more precise prediction or classification of the disease. The opposite-based learning approach increases the firefly method's convergence rate. A DNN was suggested for classification to identify the presence of CKD. In comparison to the algorithms of the pre-existing classifier models, the findings showed that the suggested approach had a high accuracy rate.
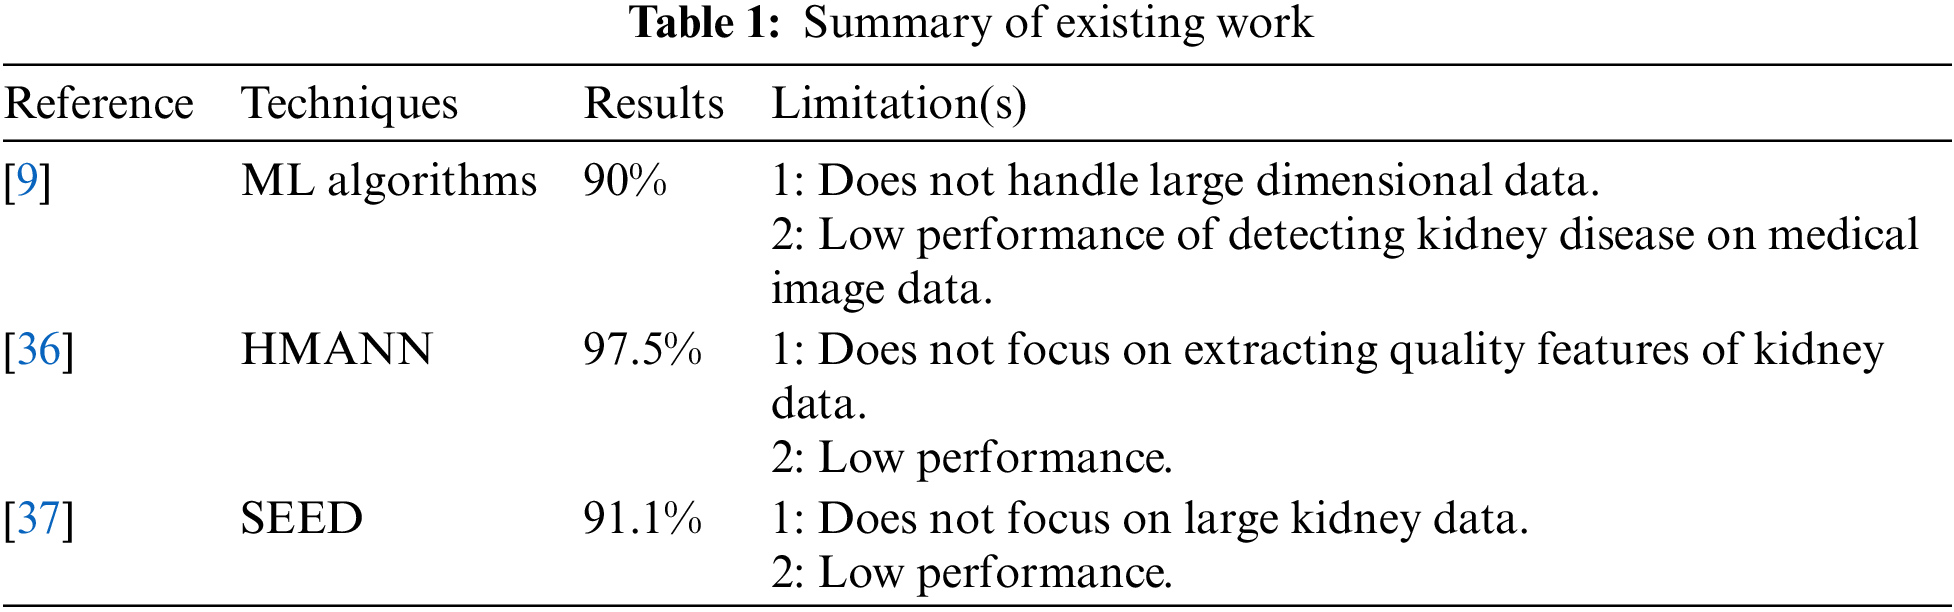
To assess the applicability of approaches like the kidney disease dataset and the deep learning approach to categorize the CT kidney disease images, a variety of datasets are being used along with ensemble classifiers, machine learning techniques, and ensemble classifiers to address some limitations. Table 1 presents the summary of existing work and limitations.
This section details the algorithm and proposed approach for classifying CT kidney disease using different evaluation metrics. In this study, the suggested model’s accuracy is the dependent variable, and independent factors are used to analyze their impacts. The proposed model is shown in Fig. 1. The proposed model consists of four phases, the first choosing the CT kidney dataset. Further, data pre-processing, which includes operations like grayscale conversion, image scaling, and bilinear interpolation, is carried out in the second stage. Feature extraction is carried out in the third stage. In the final phase, CNN is used to identify if a kidney is a tumor, cyst, normal, or stone.
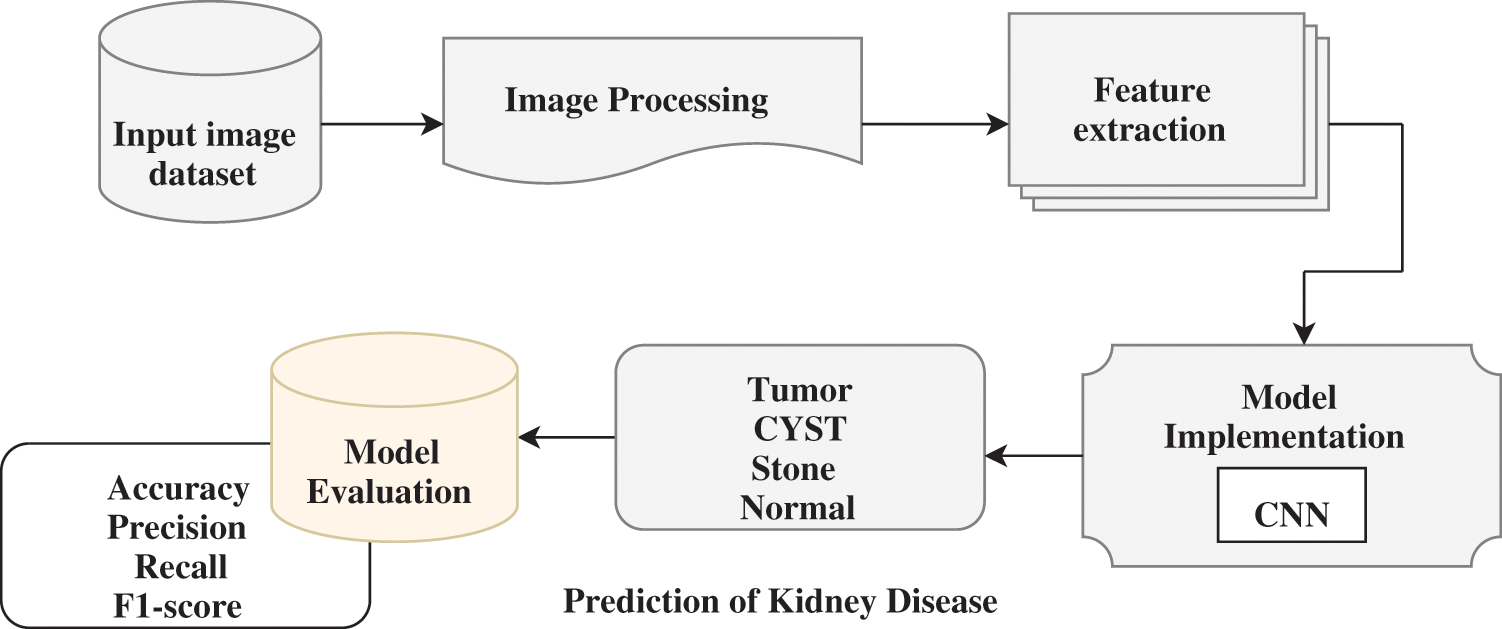
Figure 1: Workflow of the proposed methodology for kidney disease detection
The dataset was compiled using Picture archiving and communication systems (PACS) at different hospitals across Dhaka, Bangladesh. Patients recognized as having kidney cysts, tumors, and normal or stone findings. Each participant in the dataset who volunteered to participate in the research experiments had their informed consent obtained before data gathering. The testing and data collection were approved by the responsible Dhaka Central International Medical College and Hospital (DCIMCH) administration.
The data gathering and experimentation also adhere to all applicable protocols. The whole abdomen and urogram protocols follow for choosing the Coronal and Radial slices from chromatic and non-contrast studies. Then, researchers created a collection of images for every diagnostic finding from the carefully chosen Dicom study, one diagnosis at a time. The Dicom images are changed to a compact JPEG format after the researchers remove each patient's data and metadata. The Sante Dicom editor tool [55] converts data to jpg images. It is primarily used as a Dicom viewer with advanced features to help radiologists diagnose specific disease findings. The Philips IntelliSpace Portal 9.0 [56] application is used for data annotation and is an advanced image visualization tool for radiology images. A clinician and a medical consultant again verified each image finding to confirm the accuracy of the data after manual conversion and interpretation [57]. There are 12,446 unique data in the produced dataset, 3,709 of which are from cysts, 5,077 from normal data, 1,377 from stones, and 2,283 from tumors. Fig. 2 depicts a representative sampling of the datasets. The image shows the various sample of kidney scans such as stones, tumors, cysts and normal.
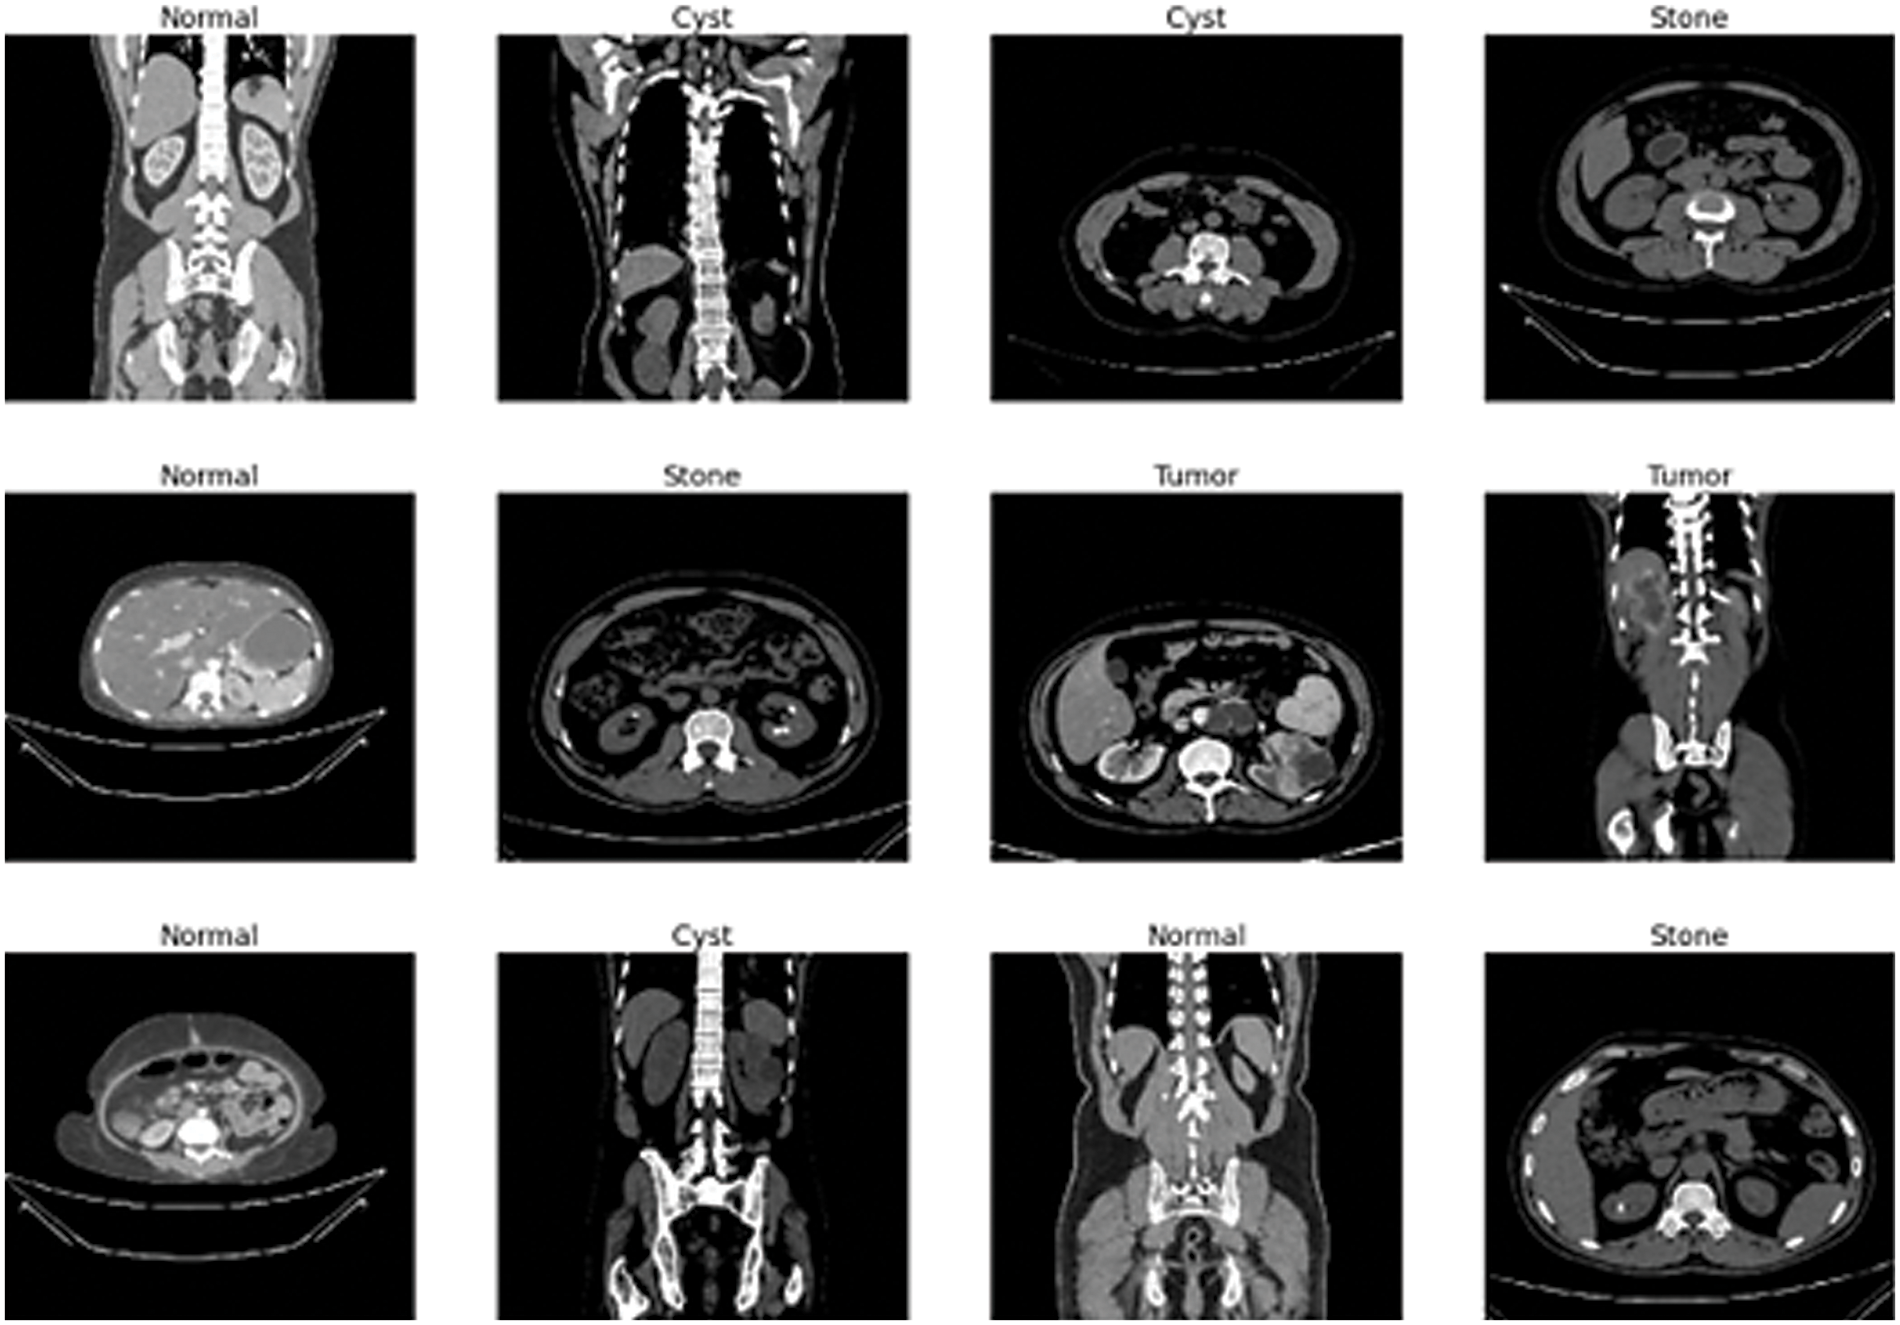
Figure 2: Sample data images of kidney tumor, cyst, normal, or stone results
This phase performed the data preparation stage to improve the model’s performance. Every dataset of kidney disease Dicom images includes undesirable places and areas. Therefore, re-scaling or resizing the images is essential to eliminate unnecessary space and use only the pertinent information. The first pre-processing step is resizing the images according to the typical size requirement of NN models after transferring DICOM images into jpg files. Images of various shapes, sizes, and widths can be found in the Dicom image dataset for kidney disease. To get the best results, resizing the images to be the same height and width is required. In this research, each image is resized 227 by 227 pixels for a CNN and uses bilinear interpolation. Bilinear interpolation transforms an image with matching pixels whenever possible, chooses and assigns the proper intensity distribution to each pixel, and produces a smoother-looking image. As a result, we found 12446 files belonging to 4 classes cyst, normal, stone, and tumor.
The pre-processed data is then used to train the Dicom picture dataset. Features are extracted representing the kidney cyst, stone, tumor, or normal. The CNN-based models automatically extract the essential features without any human involvement. Convolutional filters extract features from the training dataset following deep learning’s benefit. The CNN deep learning model is used in this study to classify the various forms of CT kidney illness and extract detailed information from an image. The deep learning models, such as a CNN with the Fully Connected (FC) layer, are then fed the extracted features.
3.4 Convolutional Neural Network (CNN)
It is helpful to extract an image’s spatial and temporal features [58]. CNN is the sub-type of Deep Neural Networks (DNN) that use various convolutional layers to process inputs for the useful information [59,60]. Convolutional filters are implemented to the input by the CNN convolutional layers to determine the result of the interconnected neurons to the various input areas.
The convolutional, max-pooling and fully connected layers are the three critical layers that compose the CNN model. Three essential parameters are incorporated in the convolutional layer: pitch, padding, and filter size. To extract features accurately, many filters are applied to each layer. The filters move inside the images according to stride. The stride size can only be one or two; CNN's performance suffers if it is more than two. When the filter does not entirely protect each input image in the convolutional layer, zero padding is required to maintain the structural assessment [61]. Each convolutional layer aims to accomplish a particular objective; for instance, the first layer highlights the lesions’ borders, the second layer extracts the features of complicated geometrical structures, and the third layer emphasizes the forms and colors of the lesions. The ReLU layer in the feature map transmits positive values while suppressing negative ones and setting them to zero. The extracted features are down-sampled or made less dimensional using the max-pooling layer. The two approaches for the max-pooling layer that are most frequently employed are average and max. The fully connected layer with 128 units divides the image into categories. The batch normalization layer is utilized for feature map normalization. These layers improve network regulation and training.
Fig. 3 represents the architecture of the CNN model. The max-pooling and 2D CNN are integrated into each convolutional block. The network comprises 15 layers, six convolutional layers, six max-pooling layers, and two dense and one flattened layer. The proposed approach first used the six convolutional layers with six max-pooling layers and then used the flattened and two dense layers. The convolutional layer with a 3 × 3 kernel size is used for feature extraction from the Dicom images (JPEG format) activated by the Relu function. The max-pooling layer with a 3 × 3 kernel size decreases the dimensionality of an input image. The six convolutional layers have different input sizes: the first two convolutional layers have 32 input sizes, the next two have 64, and the last two convolutional layers have 128 input sizes. The two dense layers have input sizes 512 and 4 with ReLU activation and softmax function, respectively. The internal characteristics and structures of the image are less distorted when there is less shrinkage.
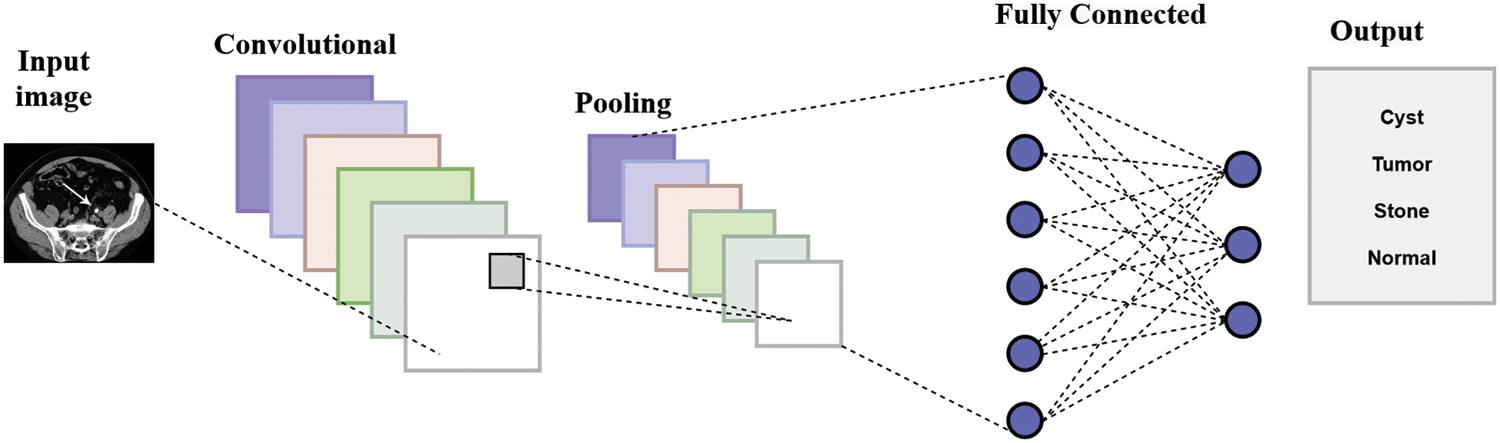
Figure 3: Architecture of CNN model
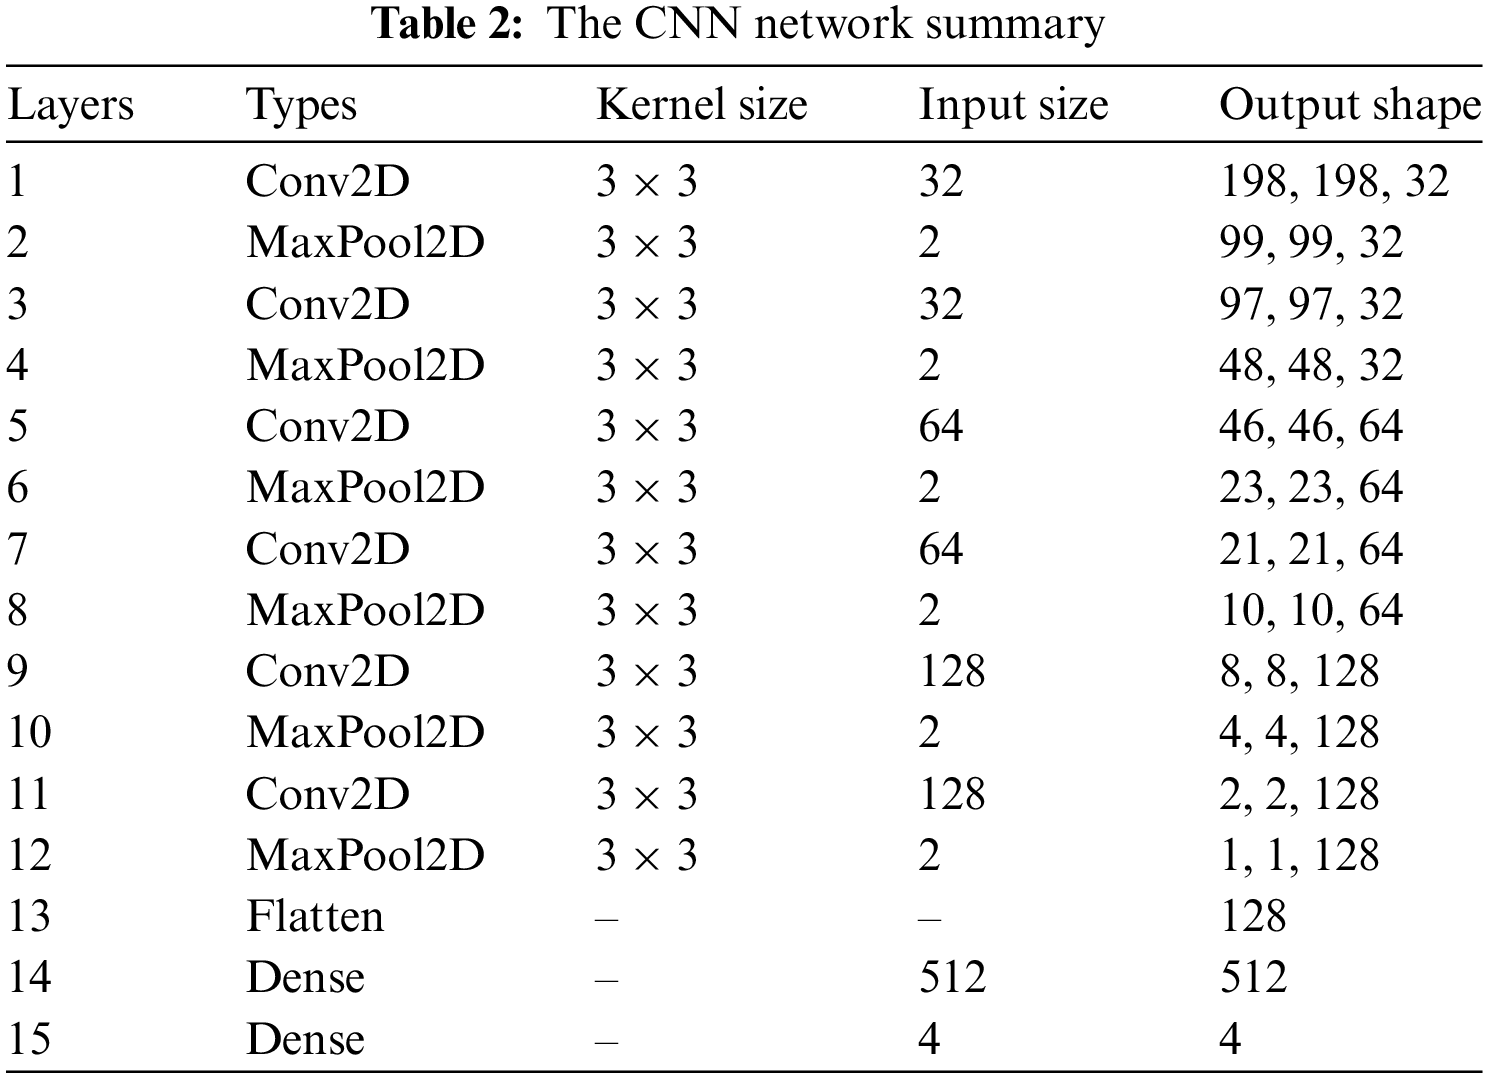
Table 2 provides the CNN architecture summary. The detail of the layer types, input size, and kernel size is given. The convolution layers (Conv2D) have 3 × 3 kernel size with distinct sizes of input 32, 64, and 128 and output shapes (198,198,32), (97,97,32), (46,46,64), (21,21,64), (8,8,128) and (2,2,128). The max-pooling layers (maxPool2D) have 3 × 3 kernel sizes with different input sizes 2 and output shapes (99,99,32), (48,48,32), (23,23,64), (10,10,64), (4,4,128) and (1,1,128). The input and output dimensions of the dense layer are 512 and 4, correspondingly. The max-pooling and convolutional layers achieve lower image reduction with various input sizes. Less contraction causes the internal characteristics and patterns of the image to be less distorted. After examining the characteristics of the time, the architecture sorts the Dicom image into cyst, normal, stone, and non-tumor categories using a fully connected layer. The proposed model is trained using the rmsprop optimizer with 10 training epochs, and categorical-cross entropy is employed for losses and metrics.
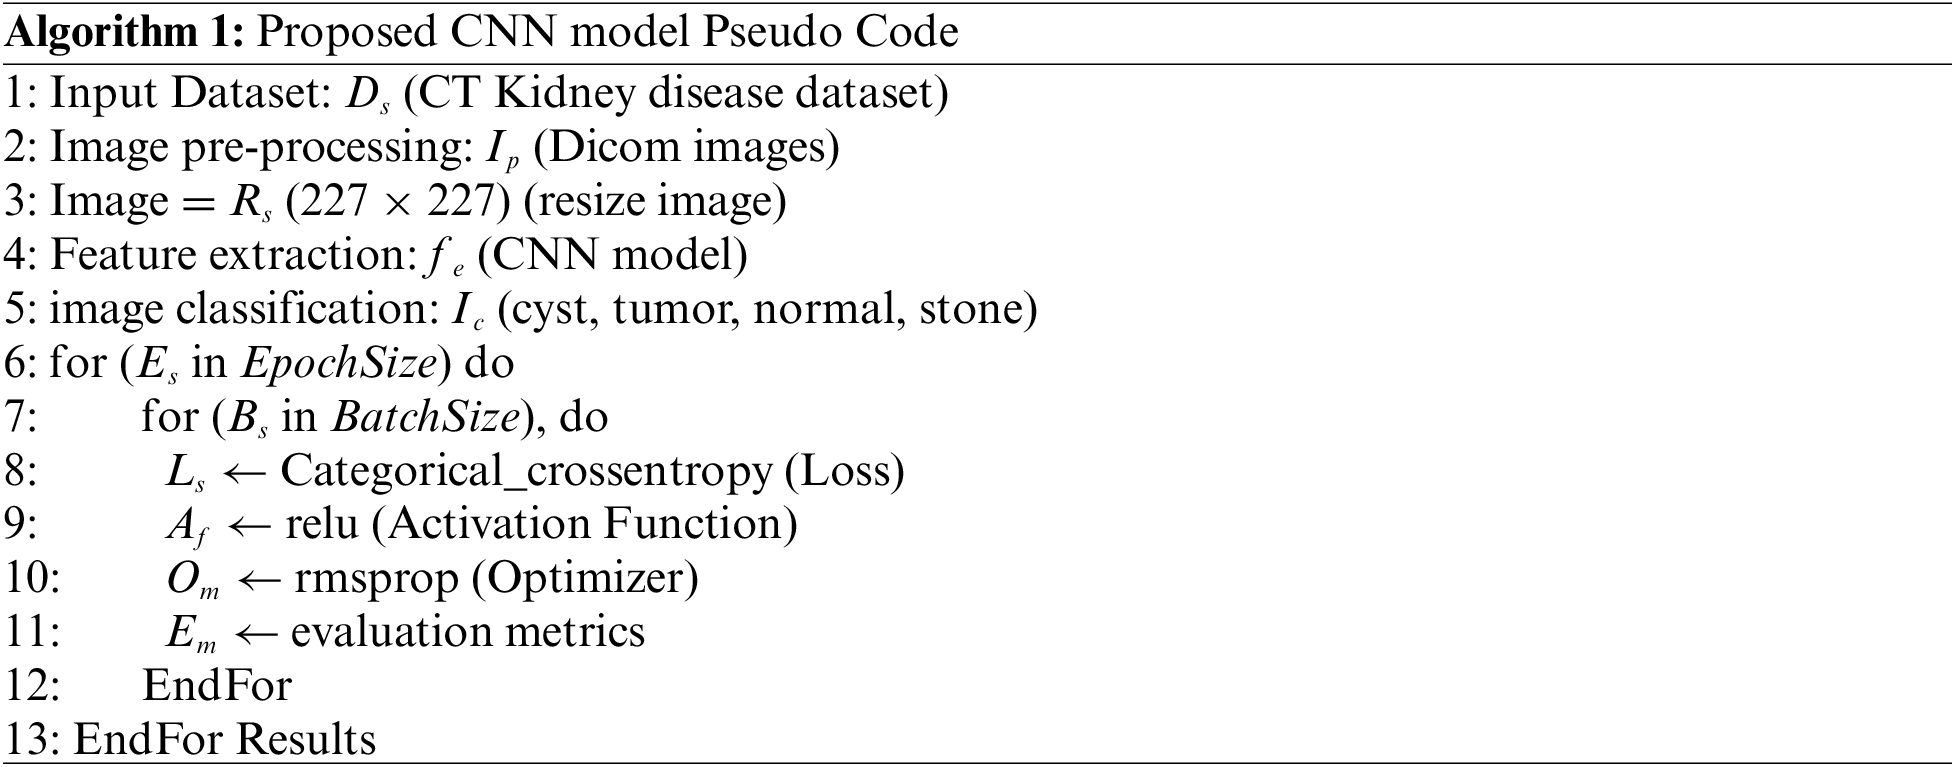
The steps to detect kidney disease are given in Algorithm 1. First, input the CT kidney disease dataset D_s, then performs the image processing I_p and convert the Dicom images into JPEG format. Resize R_s the images into 227 × 227 pixels and extract the features f_e using the CNN model. After feature extraction, classify the images and get the four classes cyst, tumor, normal, and stone. E_s is the current epoch, EpochSize represents the total number of epochs, similar B_s is the current batch size, and BatchSize shows the total number of batch sizes. The following parameter model parameters, such as an epoch value, activation function, and batch size, are utilized to compute the model loss. The procedure is repeated until the requisite is attained or the loss function is constantly minimized. Fig. 4 depicts the graphical representation of the proposed CNN architecture.
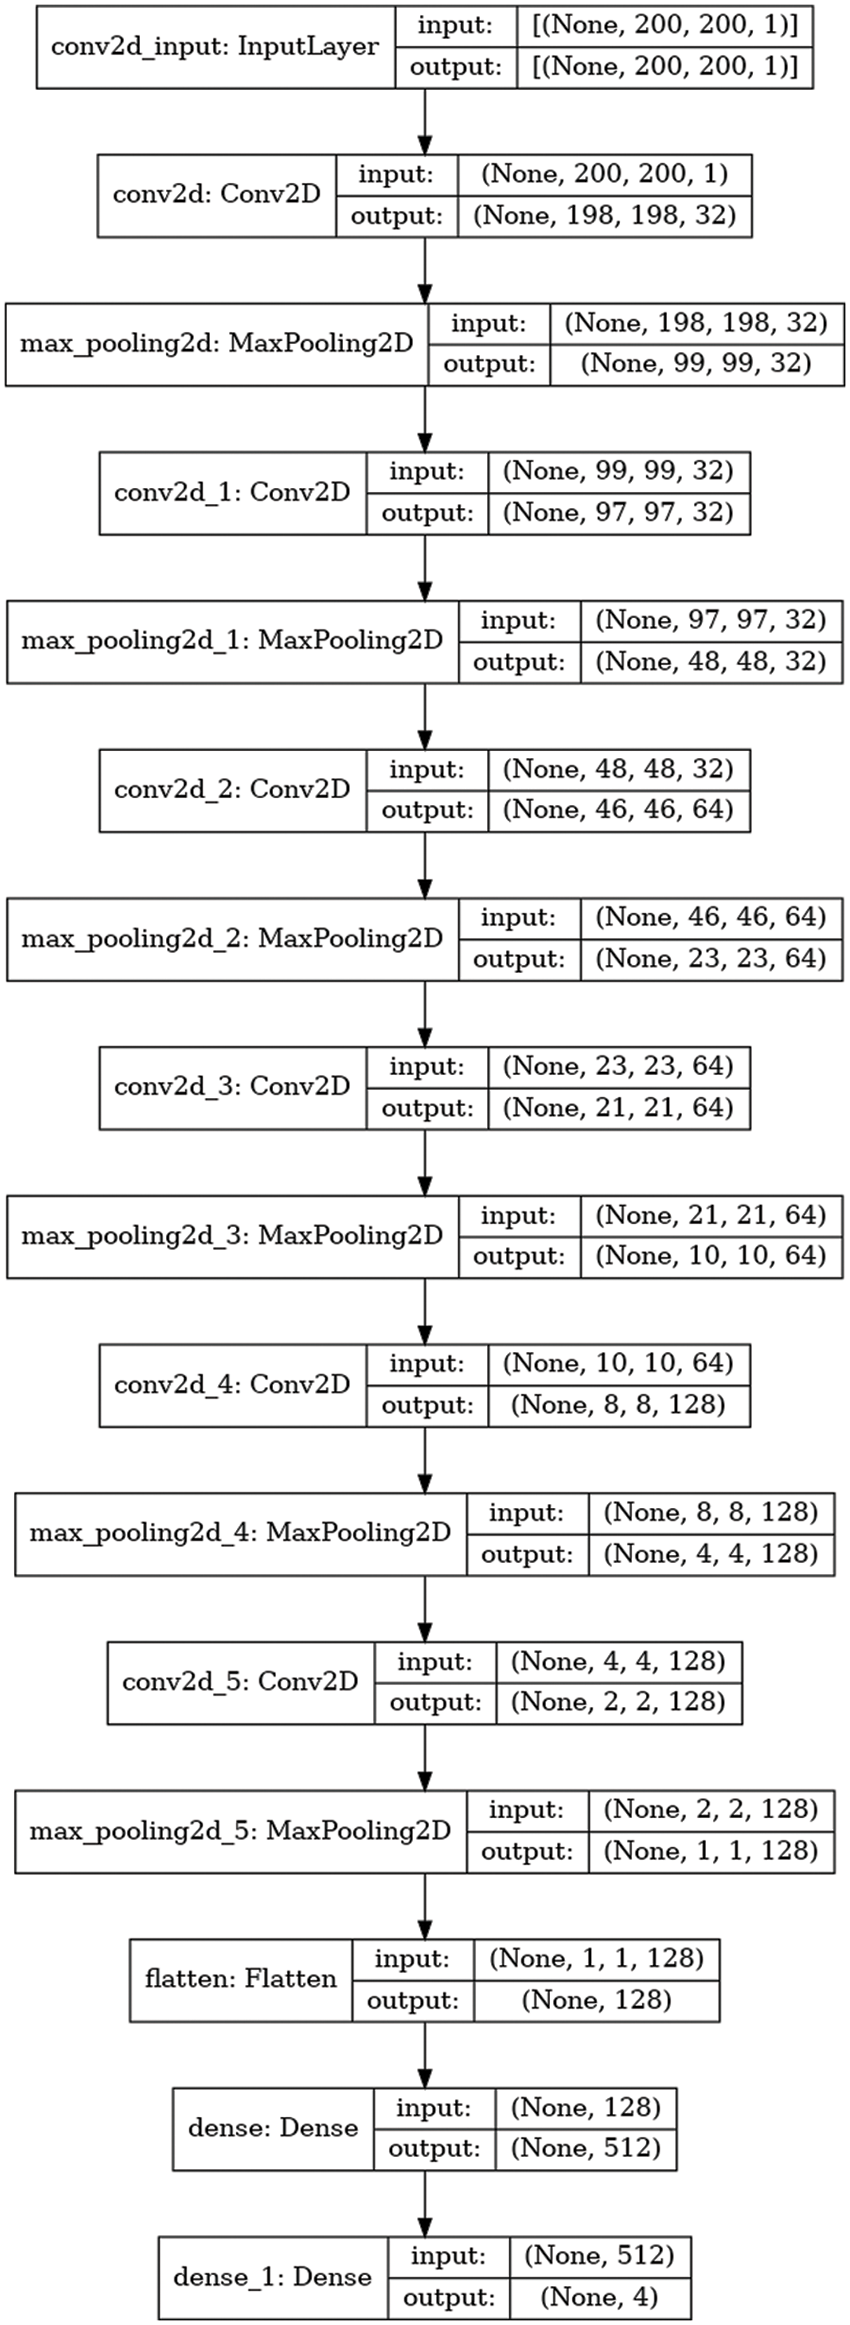
Figure 4: Proposed CNN architecture
The performance of the proposed model has been discussed in this part. The proposed model is assessed on many criteria, including accuracy, recall, precision, and f1-score. The proposed model is evaluated using these parameters to determine if it outperforms the existing approaches and whether it is suitable for the timely identification of kidney disease. The proposed model is implemented on a dataset of CT kidney disease images, and the CNN model is employed on this dataset.
The prediction and classification issues are assessed using a variety of measures, such as accuracy, F1-score recall, and precision. The following evaluation measures gauge how well the proposed model works.
Accuracy: To assess the precision of the suggested model, compute the proportion of false positives, true positives, true negatives, and false negatives. Eq. (1) represents the accuracy estimate.
Precision: The proportion of actual positives to all positives in the data (both false and true). Eq. (2) presents the precision rate. Alternatively known as a highly anticipated value.
Recall: A dataset’s ratio of real positives to true positives and false negatives is described using sensitivity, the likelihood of detection, and the probability of a genuine positive. Eq. (3) indicates the recall rate.
F1-Score: The weighted average of recall and precision is the F1-score. The F1-score is provided in Eq. (4).
4.2 Experimental Analysis and Results
The results of the proposed model are provided in Table 3. The CNN model accurately detects kidney illness, either cyst, normal, stone, or tumor, by achieving accuracy of 99.94%, 99.95% precision, 99.92% recall, and 99.94% F1-score. The proposed approach is implemented in a convolutional neural network model. The convolutional neural network’s accuracy, loss, precision, and recall during training and validation are graphically shown in Fig. 5. The first graph represents the precision curves where blue line represents the training precision curve; an orange line represents the validation precision curve. At the 0th epoch, the training precision is 0.65; after various fluctuations between falls and gains, it reached about 0.99 at the 8th epoch. At the 0th epoch, validation precision starts around 0.76; however, it also reaches to around 0.985. The second graph on the right side represents the recall curves. The training recall is 0.3 at the 0th epoch and varied between drops and gains until it reached roughly 0.99 at the 8th epoch. Validation recall start from 0.35 at the 0th epoch and reaches around 1.0.
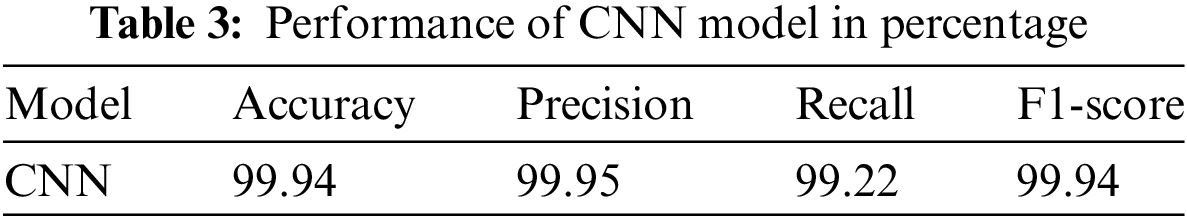
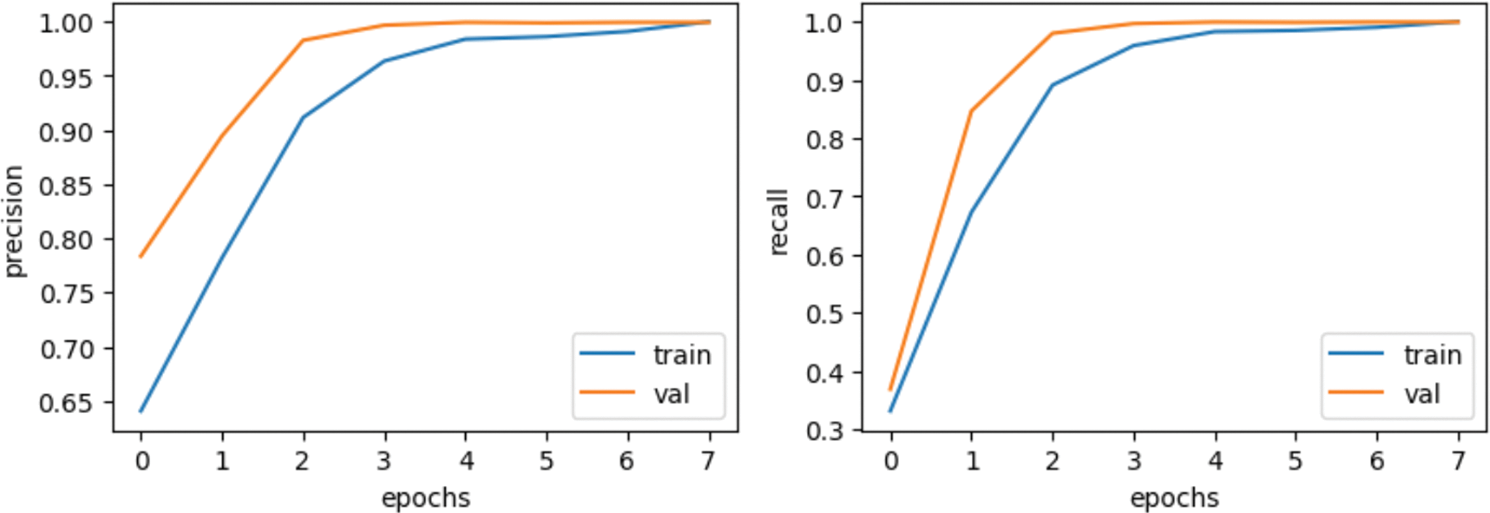
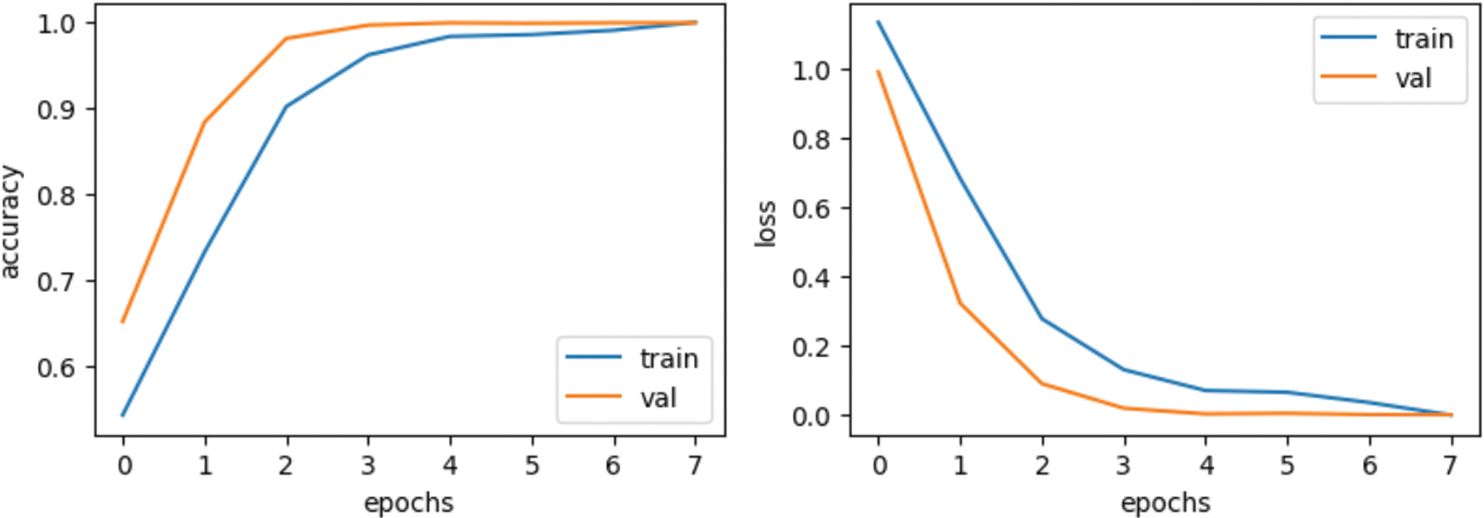
Figure 5: Results based on various evaluation metrics of CNN architecture
The third graph in Fig. 5 represents the accuracy curves of the model. Training accuracy started around 0.5 at the 0th epoch and improved to about 1.0 at the 8th. At the 0th epoch, validation accuracy initiated from about 0.65 and improved to around 1.0 by the 8th. The last graph depicts the loss model. During the training phase, the loss fluctuates at most of the epoch. Training loss initiated from 1.0 at the 0th epoch, after various fluctuations between falls and gains, decreased to 0.05 at the 8th epoch. Validation loss is 0.95 at the 0th; however, it fluctuates between drops and gains until reaching 0.1 loss at the 8th epoch.
Fig. 6 graphically shows the confusion matrix of the proposed approach. For CNN model, it diagnoses kidney disease in four categories: cysts, normal, stone, and tumor. Because it has more continuous, better true positive and negative results and fewer false positive and negative values, the proposed technique performs better.
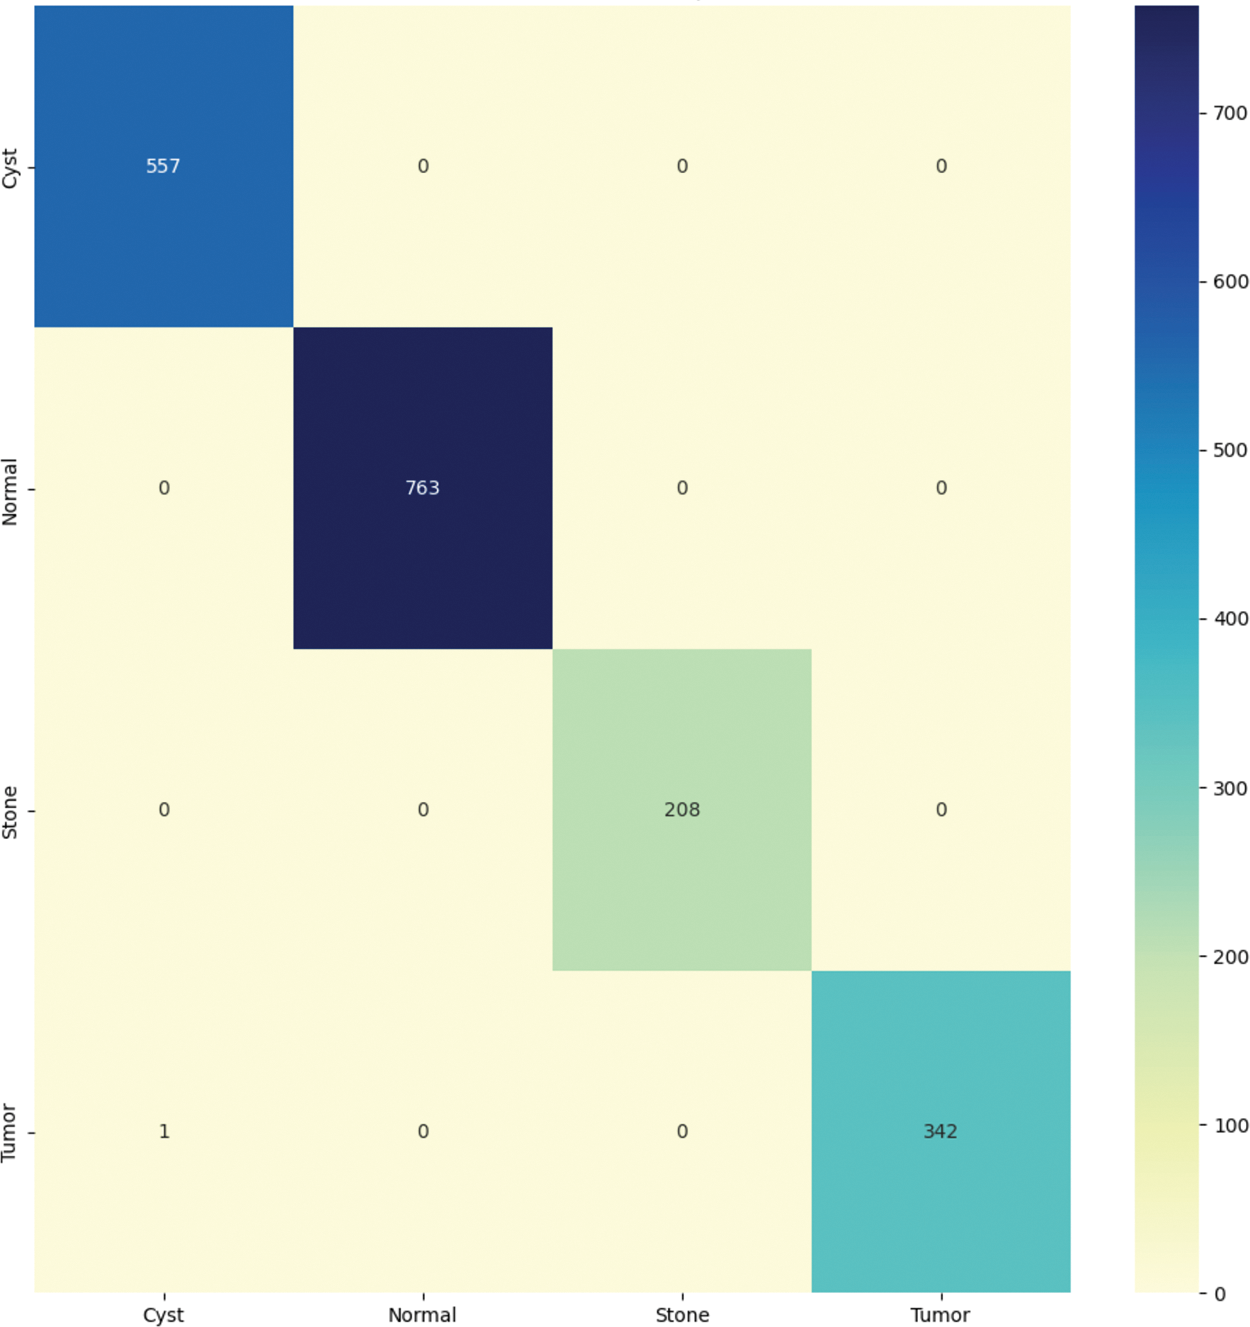
Figure 6: Confusion matrix of the proposed model
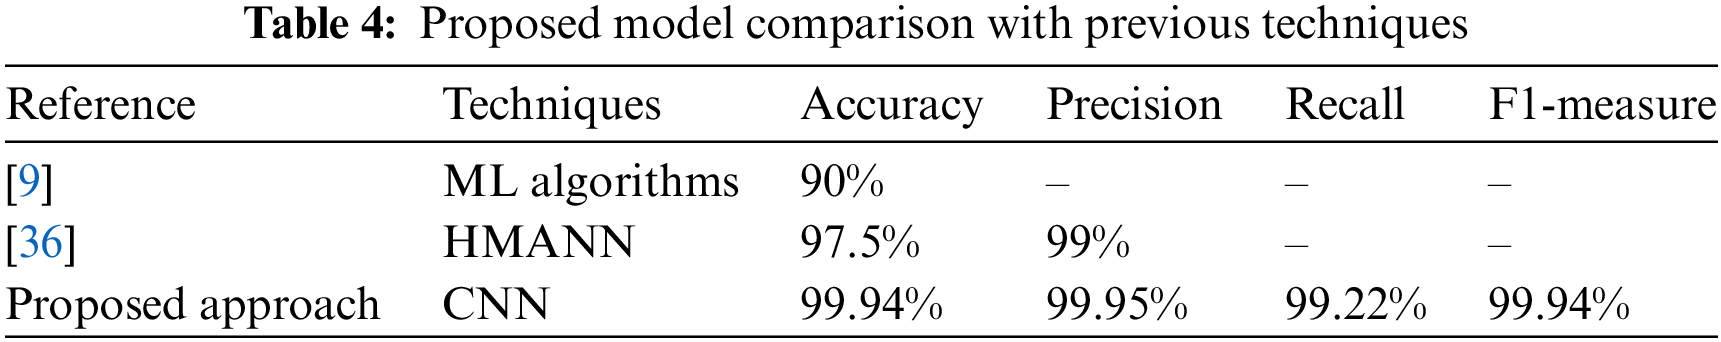
The comparison of the suggested model with existing techniques is presented in Table 4. In [9] researcher provides the outcomes in terms of accuracy 90%. In [36] author gave the result in terms of accuracy of 97.5% and precision of 99%. The provided results clearly show that the suggested model outperforms the existing techniques.
Kidney disease is a severe medical issue that considerably increases mortality risk and morbidity worldwide. Renal failure could result from kidney damage if not regularly diagnosed and treated. Computer-assisted diagnostics are necessary to help clinicians’ and experts’ diagnostic decisions since chronic renal disease is becoming more prevalent, fewer experts are available, and diagnosis and treatment are costly. Several methods have been used in the ML and DL domains of medical image processing in the early phases of disease detection and prediction. This research proposes the deep learning CNN model for classifying kidney disease using NN models after transferring DICOM images into jpg files. Second, the proposed model retrieves the features using a convolutional neural network. The proposed model performs best, obtaining accuracy of 99.94%, 99.95% precision, 99.92% recall, and 99.94% F1-score. The findings demonstrate that the proposed approach is more effective in identifying kidney disease, including cysts, tumors, or normal kidney disease. Future research would use a combination of extraction, optimization, and ensemble deep learning models to study the performance of the suggested approach. Additionally, the generalizability of the model will be examined using other datasets.
Acknowledgement: This work was supported by the Deanship of Scientific Research at Prince Sattam Bin Aziz University under the Research Project (PSAU/2023/01/22425).
Funding Statement: This work was supported by the Deanship of Scientific Research at Prince Sattam Bin Aziz University under the Research Project (PSAU/2023/01/22425).
Conflicts of Interest: The authors declare that they have no conflicts of interest to report regarding the present study.
References
1. A. Mohiyuddin, A. Basharat, U. Ghani, V. Peter, S. Abbas et al., “Breast tumor detection and classification in mammogram images using modified YOLOv5 network,” Computational and Mathematical Methods in Medicine, vol. 2022, no. 3, pp. 1–16, 2022. https://doi.org/10.1155/2022/1359019 [Google Scholar] [PubMed] [CrossRef]
2. M. Mehmood, M. Rizwan, M. G. ml and S. Abbas, “Machine learning assisted cervical cancer detection,” Frontiers in Public Health, pp. 2024, 2021. [Google Scholar]
3. S. Alsubai, H. U. Khan, A. Alqahtani, M. Sha, S. Abbas et al., “Ensemble deep learning for brain tumor detection,” Frontiers in Computational Neuroscience, vol. 16, pp. 788347, 2022. https://doi.org/10.3389/fncom.2022.1005617 [Google Scholar] [PubMed] [CrossRef]
4. A. R. Javed, L. G. Fahad, A. A. Farhan, S. Abbas, G. Srivastava et al., “Automated cognitive health assessment in smart homes using machine learning,” Sustainable Cities and Society, vol. 65, no. 9, pp. 102572, 2021. https://doi.org/10.1016/j.scs.2020.102572 [Google Scholar] [CrossRef]
5. A. Alqahtani, S. Alsubai, M. Sha, V. Peter, A. S. Almadhor et al., “Falling and drowning detection framework using smartphone sensors,” Computational Intelligence and Neuroscience, vol. 2022, pp. 1–12, 2022. https://doi.org/10.1155/2022/6468870 [Google Scholar] [PubMed] [CrossRef]
6. S. Alsubai, A. Alqahtani, M. Sha, S. Abbas, A. Almadhor et al., “Smart home-based complex interwoven activities for cognitive health assessment,” Journal of Sensors, vol. 2022, no. 2, pp. 1–10, 2022. https://doi.org/10.1155/2022/3792394 [Google Scholar] [CrossRef]
7. S. Safdar, M. Rizwan, T. R. Gadekallu, A. R. Javed, M. K. I. Rahmani et al., “Bioimaging-based machine learning algorithm for breast cancer detection,” Diagnostics, vol. 12, no. 5, pp. 1134, 2022. [Google Scholar] [PubMed]
8. E. M. Senan, M. H. Al-Adhaileh, F. W. Alsaade, T. H. Aldhyani, A. A. Alqarni et al., “Diagnosis of chronic kidney disease using effective classification algorithms and recursive feature elimination techniques,” Journal of Healthcare Engineering, vol. 2021, no. 2, pp. 1–10, 2021. https://doi.org/10.1155/2021/1004767 [Google Scholar] [PubMed] [CrossRef]
9. Q. Bai, C. Su, W. Tang and Y. Li, “Machine learning to predict end-stage kidney disease in chronic kidney disease,” Scientific Reports, vol. 12, no. 1, pp. 1–8, 2022. https://doi.org/10.1038/s41598-022-12316-z [Google Scholar] [PubMed] [CrossRef]
10. M. A. Khan, A. Khan, M. Alhaisoni, A. Alqahtani, S. Alsubai et al., “Multimodal brain tumor detection and classification using deep saliency map and improved dragonfly optimization algorithm,” International Journal of Imaging Systems and Technology, 2022. [Google Scholar]
11. T. Vaiyapuri, A. Binbusayyis and V. Varadarajan, “Security, privacy and trust in IoMT enabled smart healthcare system: A systematic review of current and future trends,” International Journal of Advanced Computer Science and Applications, vol. 12, no. 2, 2021. [Google Scholar]
12. L. Vita-Finzi, G. WHO, Preventing Chronic Diseases: A Vital Investment. 2005. [Google Scholar]
13. M. A. Khan, M. Alhaisoni, M. Nazir, A. Alqahtani, A. Binbusayyis et al., “A healthcare system for COVID19 classification using multi-type classical features selection,” Computers, Materials & Continua, vol. 74, no. 1, pp. 1393–1412, 2023. https://doi.org/10.32604/cmc.2023.032064 [Google Scholar] [PubMed] [CrossRef]
14. M. Aoun, R. Salloum, A. Dfouni, G. Sleilaty and D. Chelala, “A formula predicting the effective dose of febuxostat in chronic kidney disease patients with asymptomatic hyperuricemia based on a retrospective study and a validation cohort,” Clinical Nephrology, vol. 94, no. 2, pp. 61–69, 2020. https://doi.org/10.5414/CN109867 [Google Scholar] [PubMed] [CrossRef]
15. N. Skafi, D. Abdallah, C. Soulage, S. Reibel, N. Vitale et al., “Phospholipase D: A new mediator during high phosphate-induced vascular calcification associated with chronic kidney disease,” Journal of Cellular Physiology, vol. 234, no. 4, pp. 4825–4839, 2019. https://doi.org/10.1002/jcp.27281 [Google Scholar] [PubMed] [CrossRef]
16. K. J. Foreman, N. Marquez, A. Dolgert, K. Fukutaki, N. Fullman et al., “Forecasting life expectancy, years of life lost and all-cause and cause-specific mortality for 250 causes of death: Reference and alternative scenarios for 2016-40 for 195 countries and territories,” The Lancet, vol. 392, no. 10159, pp. 2052–2090, 2018. https://doi.org/10.1016/S0140-6736(18)31694-5 [Google Scholar] [PubMed] [CrossRef]
17. P. Budhiraja, B. Kaplan, M. Kalot, A. El Alayli, A. Dimassi et al., “Current state of evidence on kidney transplantation: How fragile are the results?” Transplantation, vol. 106, no. 2, pp. 248–256, 2022. [Google Scholar] [PubMed]
18. Z. Chen, X. Zhang and Z. Zhang, “Clinical risk assessment of patients with chronic kidney disease by using clinical data and multivariate models,” International Urology and Nephrology, vol. 48, no. 12, pp. 2069–2075, 2016. [Google Scholar] [PubMed]
19. D. N. Koye, D. J. Magliano, R. G. Nelson and M. E. Pavkov, “The global epidemiology of diabetes and kidney disease,” Advances in Chronic Kidney Disease, vol. 25, no. 2, pp. 121–132, 2018. [Google Scholar] [PubMed]
20. C. Rediger, L. Guerra, M. Keays, C. Wayne, D. Reddy et al., “Renal cyst evolution in childhood: A contemporary observational study,” Journal of Pediatric Urology, vol. 15, no. 2, pp. 188–e1, 2019. [Google Scholar] [PubMed]
21. A. J. Brownstein, S. U. B. Mahmood, A. Saeyeldin, C. V. Mejia, M. A. Zafar et al., “Simple renal cysts and bovine aortic arch: Markers for aortic disease,” Open Heart, vol. 6, no. 1, pp. e000862, 2019. [Google Scholar] [PubMed]
22. T. Alelign and B. Petros, “Kidney stone disease: An update on current concepts,” Advances in Urology, vol. 2018, no. 1, pp. 1–12, 2018. https://doi.org/10.1155/2018/3068365 [Google Scholar] [PubMed] [CrossRef]
23. J. J. Hsieh, M. P. Purdue, S. Signoretti, C. Swanton, L. Albiges et al., “Renal cell carcinoma,” Nature Reviews Disease Primers, vol. 3, no. 1, pp. 1–19, 2017. https://doi.org/10.1038/nrdp.2017.9 [Google Scholar] [PubMed] [CrossRef]
24. Q. A. Al-Haija and A. Adebanjo, “Breast cancer diagnosis in histopathological images using ResNet-50 convolutional neural network,” in 2020 IEEE Int. IOT, Electronics and Mechatronics Conf. (IEMTRONICS), Vancouver, BC, Canada, IEEE, 2020. [Google Scholar]
25. J. G. Rizk, J. G. Lazo, D. Quan, S. Gabardi, Y. Rizk et al., “Mechanisms and management of drug-induced hyperkalemia in kidney transplant patients,” Reviews in Endocrine and Metabolic Disorders, vol. 22, no. 4, pp. 1–14, 2021. https://doi.org/10.1007/s11154-021-09677-7 [Google Scholar] [PubMed] [CrossRef]
26. P. Budhiraja, M. A. Kalot, A. El Alayli, A. Dimassi, B. Kaplan et al., “Reporting and handling of missing participant data in systematic reviews of kidney transplant studies,” Transplantation, vol. 105, no. 8, pp. 1708–1717, 2021. https://doi.org/10.1097/TP.0000000000003503 [Google Scholar] [PubMed] [CrossRef]
27. S. Gilbert and D. E. Weiner, National Kidney Foundation Primer on Kidney Diseases, E-Book. New York City: Elsevier Health Sciences, 2022. [Google Scholar]
28. A. R. Javed, F. Shahzad, S. Ur Rehman, Y. B. Zikria, I. Razzak et al., “Future smart cities requirements, emerging technologies, applications, challenges and future aspects,” Cities, vol. 129, no. 3, pp. 103794, 2022. https://doi.org/10.1016/j.cities.2022.103794 [Google Scholar] [CrossRef]
29. K. C. Saw, J. A. McAteer, A. G. Monga, G. T. Chua, J. E. Lingeman et al., “Helical CT of urinary calculi: Effect of stone composition, stone size and scan collimation,” American Journal of Roentgenology, vol. 175, no. 2, pp. 329–332, 2000. https://doi.org/10.2214/ajr.175.2.1750329 [Google Scholar] [PubMed] [CrossRef]
30. T. Gunasekara, P. M. de Silva, E. Ekanayake, W. Thakshila, R. Pinipa et al., “Urinary biomarkers indicate pediatric renal injury among rural farming communities in Sri Lanka,” Scientific Reports, vol. 12, no. 1, pp. 1–13, 2022. https://doi.org/10.1038/s41598-022-10874-w [Google Scholar] [PubMed] [CrossRef]
31. Y. Bi, X. Shi, J. Ren, M. Yi and X. Han, “Transarterial chemoembolization of unresectable renal cell carcinoma with doxorubicin-loaded callispheres drug-eluting beads,” Scientific Reports, vol. 12, no. 1, pp. 1–8, 2022. https://doi.org/10.1038/s41598-022-12334-x [Google Scholar] [PubMed] [CrossRef]
32. A. Helwan, M. K. S. Maaitah, H. Hamdan, D. U. Ozsahin and O. Tuncyurek, “Radiologists versus deep convolutional neural networks: A comparative study for diagnosing COVID-19,” Computational and Mathematical Methods in Medicine, vol. 2021, no. 7, pp. 1–9, 2021. https://doi.org/10.1155/2021/5527271 [Google Scholar] [PubMed] [CrossRef]
33. S. A. Ebiaredoh-Mienye, T. G. Swart, E. Esenogho and I. D. Mienye, “A machine learning method with filter-based feature selection for improved prediction of chronic kidney disease,” Bioengineering, vol. 9, no. 8, pp. 350, 2022. https://doi.org/10.3390/bioengineering9080350 [Google Scholar] [PubMed] [CrossRef]
34. E. Dritsas and M. Trigka, “Machine learning techniques for chronic kidney disease risk prediction,” Big Data and Cognitive Computing, vol. 6, no. 3, pp. 98, 2022. https://doi.org/10.3390/bdcc6030098 [Google Scholar] [CrossRef]
35. M. A. Abdel-Fattah, N. A. Othman and N. Goher, “Predicting chronic kidney disease using hybrid machine learning based on Apache spark,” Computational Intelligence and Neuroscience, vol. 2022, no. 15, pp. 1–12, 2022. https://doi.org/10.1155/2022/9898831 [Google Scholar] [PubMed] [CrossRef]
36. A. Helwan, M. K. S. Maaaitah, S. Uzelaltinbulat, M. Z. Altobel and M. Darwish, “Gaze prediction based on convolutional neural network,” in Proc. of Int. Conf. on Emerging Technologies and Intelligent Systems: ICETIS 2021, Springer, vol. 2, pp. 215–224, 2021. [Google Scholar]
37. F. Ma, T. Sun, L. Liu and H. Jing, “Detection and diagnosis of chronic kidney disease using deep learning-based heterogeneous modified artificial neural network,” Future Generation Computer Systems, vol. 111, no. 15, pp. 17–26, 2020. https://doi.org/10.1016/j.future.2020.04.036 [Google Scholar] [CrossRef]
38. C. Sabanayagam, D. Xu, D. S. Ting, S. Nusinovici, R. Banu et al., “A deep learning algorithm to detect chronic kidney disease from retinal photographs in community-based populations,” The Lancet Digital Health, vol. 2, no. 6, pp. e295–e302, 2020. https://doi.org/10.1016/S2589-7500(20)30063-7 [Google Scholar] [PubMed] [CrossRef]
39. V. Singh, V. K. Asari and R. Rajasekaran, “A deep neural network for early detection and prediction of chronic kidney disease,” Diagnostics, vol. 12, no. 1, pp. 116, 2022. https://doi.org/10.3390/diagnostics12010116 [Google Scholar] [PubMed] [CrossRef]
40. A. Almadhor, M. U. Sattar, A. Al Hejaili, U. Ghulam Mohammad, U. Tariq et al., “An efficient computer vision-based approach for acute lymphoblastic leukemia prediction,” Frontiers in Computational Neuroscience, pp. 171, 2022. [Google Scholar]
41. M. Makino, R. Yoshimoto, M. Ono, T. Itoko, T. Katsuki et al., “Artificial intelligence predicts the progression of diabetic kidney disease using big data machine learning,” Scientific Reports, vol. 9, no. 1, pp. 1–9, 2019. https://doi.org/10.1038/s41598-019-48263-5 [Google Scholar] [PubMed] [CrossRef]
42. Q. Yuan, H. Zhang, T. Deng, S. Tang, X. Yuan et al., “Role of artificial intelligence in kidney disease,” International Journal of Medical Sciences, vol. 17, no. 7, pp. 970, 2020. https://doi.org/10.7150/ijms.42078 [Google Scholar] [PubMed] [CrossRef]
43. V. Kumar, G. S. Lalotra and R. K. Kumar, “Improving the performance of classifiers for diagnosis of critical diseases to prevent COVID risk,” Computers and Electrical Engineering, vol. 102, no. 1, pp. 108236, 2022. https://doi.org/10.1016/j.compeleceng.2022.108236 [Google Scholar] [PubMed] [CrossRef]
44. V. Kumar, G. S. Lalotra, P. Sasikala, D. S. Rajput, R. Kaluri et al., “Addressing binary classification over class imbalanced clinical datasets using computationally intelligent techniques,” Healthcare, vol. 10, pp. 1293, MDPI, 2022. [Google Scholar] [PubMed]
45. U. G. Mohammad, S. Imtiaz, M. Shakya, A. Almadhor and F. Anwar, “An optimized feature selection method using ensemble classifiers in software defect prediction for healthcare systems,” Wireless Communications and Mobile Computing, vol. 2022, no. 2, pp. 1–14, 2022. https://doi.org/10.1155/2022/1028175 [Google Scholar] [CrossRef]
46. V. Kumar, S. Biswas, D. S. Rajput, H. Patel and B. Tiwari, “PCA-based incremental extreme learning machine (PCA-IELM) for COVID-19 patient diagnosis using chest X-ray images,” Computational Intelligence and Neuroscience, vol. 2022, no. 1, pp. 1–17, 2022. https://doi.org/10.1155/2022/9107430 [Google Scholar] [PubMed] [CrossRef]
47. T. M. Ali, A. Nawaz, A. U. Rehman, R. Z. Ahmad, A. R. Javed et al., “A sequential machine learning-cum-attention mechanism for effective segmentation of brain tumor,” Frontiers in Oncology, vol. 12, pp. 1993, 2022. https://doi.org/10.3389/fonc.2022.873268 [Google Scholar] [PubMed] [CrossRef]
48. C. Dhasarathan, M. K. Hasan, S. Islam, S. Abdullah, U. A. Mokhtar et al., “COVID-19 health data analysis and personal data preserving: A homomorphic privacy enforcement approach,” Computer Communications, vol. 199, no. 16, pp. 87–97, 2023. https://doi.org/10.1016/j.comcom.2022.12.004 [Google Scholar] [PubMed] [CrossRef]
49. V. Ravi, H. Narasimhan, C. Chakraborty and T. D. Pham, “Deep learning-based meta-classifier approach for COVID-19 classification using CT scan and chest X-ray images,” Multimedia Systems, vol. 28, no. 4, pp. 1401–1415, 2022. https://doi.org/10.1007/s00530-021-00826-1 [Google Scholar] [PubMed] [CrossRef]
50. A. Tarhini, A. Harfouche and M. De Marco, “Artificial intelligence-based digital transformation for sustainable societies: The prevailing effect of COVID-19 crises,” Pacific Asia Journal of the Association for Information Systems, vol. 14, no. 2, pp. 1, 2022. [Google Scholar]
51. V. Ravi, V. Acharya and M. Alazab, “A multichannel efficientnet deep learning-based stacking ensemble approach for lung disease detection using chest X-ray images,” Cluster Computing, pp. 1–23, 2022. [Google Scholar]
52. V. Ravi, “Attention cost-sensitive deep learning-based approach for skin cancer detection and classification,” Cancers, vol. 14, no. 23, pp. 5872, 2022. https://doi.org/10.3390/cancers14235872 [Google Scholar] [PubMed] [CrossRef]
53. D. Alzuabi, M. Abdullah, I. Hmeidi, R. AlAzab, M. Gharaibeh et al., “Kidney tumor detection and classification based on deep learning approaches: A new dataset in CT scans,” Journal of Healthcare Engineering, vol. 2022, no. 1, pp. 1–22, 2022. https://doi.org/10.1155/2022/3861161 [Google Scholar] [PubMed] [CrossRef]
54. C. Mondol, F. J. M. Shamrat, M. R. Hasan, S. Alam, P. Ghosh et al., “Early prediction of chronic kidney disease: A comprehensive performance analysis of deep learning models,” Algorithms, vol. 15, no. 9, pp. 308, 2022. https://doi.org/10.3390/a15090308 [Google Scholar] [CrossRef]
55. J. R. Lambert and E. Perumal, “Oppositional firefly optimization based optimal feature selection in chronic kidney disease classification using deep neural network,” Journal of Ambient Intelligence and Humanized Computing, vol. 13, no. 4, pp. 1799–1810, 2022. https://doi.org/10.1007/s12652-021-03477-2 [Google Scholar] [CrossRef]
56. Sante dicom viewer pro, “Santesoft ltd,”. [Online]. Available: https://www.santesoft.com/products.html [Google Scholar]
57. Intellispace portal 9.0, “Radiology and cardiology diagnostic imaging solution | philips healthcare,” 2023. [Online]. Available: https://www.usa.philips.com/healthcare/product/HC881072/intellispace-portal-advanced-visualization-solution [Google Scholar]
58. M. N. Islam, M. Hasan, M. Hossain, M. Alam, G. Rabiul et al., “Vision transformer and explainable transfer learning models for auto detection of kidney cyst, stone and tumor from CT-radiography,” Scientific Reports, vol. 12, no. 1, pp. 1–14, 2022. https://doi.org/10.1038/s41598-022-15634-4 [Google Scholar] [PubMed] [CrossRef]
59. H. Abdellatef, M. K. Hani, N. S. Husin and S. O. Ayat, “Accurate and compact convolutional neural network based on stochastic computing,” Neurocomputing, vol. 471, no. 1, pp. 31–47, 2022. https://doi.org/10.1016/j.neucom.2021.10.105 [Google Scholar] [CrossRef]
60. F. Gerges, F. Shih and Danielle Azar., “Automated diagnosis of acne and rosacea using convolution neural networks,” in 2021 4th Int. Conf. on Artificial Intelligence and Pattern Recognition, Xiamen, China, pp. 607–613, 2021. [Google Scholar]
61. M. Goyal, R. Goyal and B. Lall, “Learning activation functions: A new paradigm for understanding neural networks,” arXiv preprint arXiv:1906.09529, 2019. [Google Scholar]
Cite This Article
 Copyright © 2023 The Author(s). Published by Tech Science Press.
This work is licensed under a Creative Commons Attribution 4.0 International License , which permits unrestricted use, distribution, and reproduction in any medium, provided the original work is properly cited.
 Downloads
 Citation Tools