
 Submit a Paper
 Propose a Special lssue
 Open Access
ARTICLE

Deep Learning-Based Stacked Auto-Encoder with Dynamic Differential Annealed Optimization for Skin Lesion Diagnosis
Department of Medical Equipment Technology, College of Applied Medical Sciences, Majmaah University, Al Majmaah, 11952, Saudi Arabia
* Corresponding Author: Ahmad Alassaf. Email:
Computer Systems Science and Engineering 2023, 47(3), 2773-2789. https://doi.org/10.32604/csse.2023.035899
Received 08 September 2022; Accepted 13 January 2023; Issue published 09 November 2023
 View Full Text
 Download PDF
Abstract
Intelligent diagnosis approaches with shallow architectural models play an essential role in healthcare. Deep Learning (DL) models with unsupervised learning concepts have been proposed because high-quality feature extraction and adequate labelled details significantly influence shallow models. On the other hand, skin lesion-based segregation and disintegration procedures play an essential role in earlier skin cancer detection. However, artefacts, an unclear boundary, poor contrast, and different lesion sizes make detection difficult. To address the issues in skin lesion diagnosis, this study creates the UDLS-DDOA model, an intelligent Unsupervised Deep Learning-based Stacked Auto-encoder (UDLS) optimized by Dynamic Differential Annealed Optimization (DDOA). Pre-processing, segregation, feature removal or separation, and disintegration are part of the proposed skin lesion diagnosis model. Pre-processing of skin lesion images occurs at the initial level for noise removal in the image using the Top hat filter and painting methodology. Following that, a Fuzzy C-Means (FCM) segregation procedure is performed using a Quasi-Oppositional Elephant Herd Optimization (QOEHO) algorithm. Besides, a novel feature extraction technique using the UDLS technique is applied where the parameter tuning takes place using DDOA. In the end, the disintegration procedure would be accomplished using a SoftMax (SM) classifier. The UDLS-DDOA model is tested against the International Skin Imaging Collaboration (ISIC) dataset, and the experimental results are examined using various computational attributes. The simulation results demonstrated that the UDLS-DDOA model outperformed the compared methods significantly.Keywords
Globally, skin cancer is referred to be a common disease that has increased progressively. The skin is generally composed of cells, and each cell is embedded with tissues. Therefore, cancer is caused because of abnormal cell development in the concerned tissues. Some specific reasons for skin cancer are acquaintance with UV (Ultra Violet) rays, weak immune system, family details, etc. It is a type of unidentified pattern of cell development that can be benign or malignant. Initially, a benign tumour is a type of cancer that is mistaken for non-infectious moles. Second, malignant tumours are cancerous tumours that are extremely dangerous and result in death. It also harms the human body’s other organs. The skin is composed of three types of cells: basal cells, squamous cells, and melanocytes. Melanoma is extremely dangerous and can develop even after cancer has been detected. Australia and the United States are countries affected by skin cancer.
Dermoscopy is another module applied for predicting skin cancer. The Dermoscopic image has to be clear, and a professional dermatologist can resolve the problems relevant to diseases. However, it is a time-consuming operation. Segmentation is performed using k-means clustering, and performance is estimated using four classification models, with Neural Network (NN) achieving the highest accuracy with a similar feature set.
Satheesha et al. [1] presented a 3D reconstruction approach that uses 2D images and processes 3D image shapes and RGB prediction. The image is pre-processed and converted to binary ideas of 0 and 1. Adaptive snake technology has been used to perform segmentation. Under the application of all features, a 3D depth evaluation attribute has been applied to increase classification efficiency. The initial prediction of melanoma in the earlier stage can reduce the impact of a disease. Here, Sundar et al. [2] developed a model that applies the multiclass support vector machine (MSVM) classification method. Gray-Level Co-Occurrence Matrix (GLCM) is employed for removing colour and texture-based attributes like contrast, gradient, and homogeneity. K-means clustering is utilized for segmentation operation. The tumour region is detected for all five kinds of images. Classification and segmentation outcomes are depicted with the graphical user interface (GUI) application.
Melanoma is a general type of skin cancer. Kumar et al. [3] presented a theme for classifying melanoma by applying the shearlet transform coefficient and naïve Bayes (NB) classification model. The considered dataset is degraded under the application of shearlet transform with existing values of shearlet coefficients. Next, for the NB classifier, the essential coefficient has been used. Ferreira et al. [4] introduced a basic concept of an annotation tool that updates the manual distribution models by developing a specific ground dataset for automated distribution and allotment operations deployed using dermatologists’ knowledge. It is highly beneficial for boundary reformation as well as freehand drawing. Feature removal or eradication is an effective procedure in the prediction model. It is used for extracting the required features from the input image and thus indicates the specified group of values. Chintawar et al. [5] proposed an optimized technique for predicting skin cancer using various methods of feature removal. Hair removal is a fundamental process, and the otsu segmentation technique is used. The extracted features are enclosed in the newly deployed approach. When compared to this model, shape and texture/colour features achieve the highest accuracy, indicating that it is a suitable model for feature extraction. A specific part must be investigated to prevent melanoma at an earlier stage [6]. The traditional process is applied to skin type images by assuming the frequency domain, in which the histogram profile is flat because the colour of the skin lesion may be consistent. As a result, Codella et al. [7] presented a model for examining texture using grey images instead of colour profiles. The GLCM is used to compute feature removal, whereas the support vector machine (SVM) is used as a classification strategy for classifying various skin lesions.
Deep Learning (DL) methods like Convolution Neural Networks (CNN) have gained maximum focus from various research fields in image classification, segmentation, object prediction, etc. It is an influential model because of the critical learning process of hierarchical features and extracted efficient features from the novel image. A different phase of CNN is applied in distinct operations like classification, localization, and segmentation. In the category of original images, CNN accomplished effectual deployment in diverse clinical issues such as the prediction of mitosis from histological photographs, breast cancer prediction in mammography, and so on. The concerned physicians use the current advancements in CNN structural methods for segmenting skin lesion-type images. For example, Yu et al. [8] created an exclusive deep network consisting of two levels: segregation and allotment. Deep residual networks project a complete convolutional residual network (FCRN) [9]. Bi et al. [10] used a multi-level type of FCN and parallel integration (PI) based methodologies to compute the skin lesion type image segmentation. The PI approach is combined with the FCN type to enhance the edge of divided skin lesions.
Furthermore, Yuan et al. [11] proposed a dermoscopic image segmentation operation using a Fully Convolutional Network (FCN) with a Jaccard distance enhancement of an irregular loss function. Mohamed et al. used Deep learning based on an automated skin lesion segmentation and intelligent classification model by combining a GrabCut algorithm and an ANFC model. The deployed model solves the imbalance problem among neighbouring skin and lesion-type images. Different types of skin cancer are available, and computer-assisted identification of skin lesions and allotment is essential for better skin cancer prediction. However, the automatic skin lesion segmentation and classification processes are highly complex because of noise, ambiguous boundaries, poor contrast, and modifying the shape and size of dermoscopic images.
This study develops an intelligent unsupervised DL-related stacked auto-encoder (UDLS) optimized by dynamic differential annealed optimization (DDOA) for skin lesion analysis, termed the UDLS-DDOA method. Pre-processing, distribution, feature eradication or removal, and allotment are all sequential processes in the proposed skin lesion diagnosis approach. The pre-processing procedure for skin lesion images is carried out in the initial phase to remove the impurities present in the image by using a Top hat filter and an inpainting approach. Followed by the fuzzy c-means (FCM) relied upon, the segmentation process is carried out along with a Quasi-Oppositional Elephant Herd Optimization (QOEHO) algorithm. Next, a new feature extraction model is used by applying the UDLS technique, where DDOA performs the parameter tuning.
At last, the classification process is performed by applying a SoftMax (SM) classifier. The function of the UDLS-DDOA model happens over the International Skin Imaging Collaboration (ISIC) dataset, and the obtained experimental results are analyzed under diverse evaluation metrics. The attained simulation outcome proved that the UDLS-DDOA model outperformed the compared techniques.
2 The Proposed UDLS-DDOA Model
The overall procedure adopted in the UDLS-DDOA structure is shown in Fig. 1. As depicted, the projected input image is pre-processed to remove the hair that exists in it using top hat filtering and painting techniques. Afterwards, the FCM-QOEHO algorithm is executed to distribute or bisect the pre-processed image. Then, the UDLS-DDOA algorithm is adopted and implemented to extract the required feature attributes. Finally, the SM function is applied for classification purposes.

Figure 1: Block diagram of UDLS-DDOA model
Hair removal plays a significant role in the pre-processing stage as it affects the classification-based performance levels of the proposed model. Firstly, the image colour transformation procedure establishes the place where the dermoscopic RGB image is transformed into grayscale. Subsequently, a black top-hat transformation termed or known as morphological image processing is employed for the grayscale image. It is useful for detecting thick and dark hair. The outcome provided by the previous processes differs significantly from the incoming image shown in Eq. (1):
where ∘ represents the closing task, P denotes the grayscale input image, and b represents the grayscale design element. Finally, the inpainting procedure is applied where the substitution of the hairline pixels takes place with that of the neighbouring pixel values. A sample pre-processed image, along with its original version, is depicted in Fig. 2.

Figure 2: Image enhancement: (a) Input image, (b) Hair removed image
FCM clustering technique is extremely utilized for image segmentation. It is the iterative method for optimizing the objective function and to partition the fuzzy datasets [12]. The objective clustering function is described by the membership function (MF) and is illustrated in Eq. (2):
By consuming the image pixel value as a set of N samples, X is represented as
l. Fix values for
2. Initiate the clustering centers
3. Calculate
4. Calculate
5. If
In FCM, the clustering technique is extremely implemented in image segmentation due to the optimal clustering implementation. But it can be sensitive to initial values and simply traps into the local optimum. To avoid this problem, the QOEHO algorithm is incorporated for the initialization of the FCM technique.
The elephant is, by definition, a social animal, and herds are made up of numerous clans of female elephants (FEs) and their calves [13]. The leadership of a matriarch determines each clan’s progress. The Female Elephant (FE) always lives with the family groups, whereas the Male Elephant (ME) is isolated from the clan once it has reached maturity by using low-frequency vibrations. Herding can be defined as follows:
• A considerable population of elephants is spitted into clans; all the clans have a suitable count of elephants.
• The suitable count of ME leaves their clan and tends to live alone.
• All the clans go under the control of a matriarch.
A particular group of matriarchs holds an optimal outcome in the herd of the considered elephants, as the worst outcome is decoded from the place of the set of MEs. For the purpose of updating the process of the EHO, the following has been illustrated below. At the time of the elephant position step, the location of all the elephants in several clans is specified except that of the matriarch and the ME, which tend to hold an optimal worst outcome, respectively. To all clans,
At times of the offered cases of the EHO, the entire clan source is integrated with that of a bit vector, where the vector is observed to be dependent on the complete volume of the features. Each of the individual features is then evaluated, and the quality that holds its value, ‘1’, is in the subset of better features. Better features are offered in the classifier technique for improving the introduced technology’s precision levels and rate of performance.
To improve the convergence rate of the EHO algorithm, a quasi-opposition-based learning (QOBL) technique is introduced into it [14]. OBL is implemented to improvise the candidate solution while jointly considering the population and its converse population. An evolutionary optimization model has been established with people and efforts in maximizing the attained result. While the previous constraints are met, an exploring function is implied. It is improved in this model by establishing at the adjacent point where fitter outcomes are approved with inverse results simultaneously. As a result, the exact one is chosen as an early result. According to the theory of possibility, the highest time the guess is different from the determined consequence if it is related to the conversion guess. So, the process starts with two close-to guesses. Also, it can be utilized to initial results and other results recently.
The QOBL gives improved candidate outcomes by assuming the current population and its QO population together. It can be enhanced with the initialization of a nearer fitter solution by concurrent verification of a quasi-opposite solution. It is repeated, and the fitter one can be elected as an early outcome. It can be invoked utilizing two closer guesses. Similarly, it can be repeated to every result in the current population. A quasi-opposite number is usually closer to the result than an arbitrary number. In addition, it can be agreed that a quasi-opposite number is generally nearby than a converse number. In QOBL model is mostly employed in population-based initialization and generation-based jumping. When x be a real number amongst
And
Consider that
The quasi-opposite point
By the function of the quasi-opposite point, a quasi-opposition-based optimization is explained in the following:
Consider
An Autoencoder (AE) is a class of feed-forward with an artificial neural network (FF-ANN) that is made up of input, hidden, and output layers. This model is trained unsupervised to generate the output of minimal construction error. Thus, the importance of results is the same as the input dimension. AE is trained for implanting input to code space where the measurements are compared with input space. Hence, the size of a code space is chosen as higher when compared with input space for enhancing the classification process at a specific cost. Next, AE attempts to provide a top way of offering the input vector by exchanging it with the appropriate code.
AE is commonly employed to recover the actual instances and identify the representative type of attributes from the corrupted versions in an unsupervised way [15]. The architecture of the AE approach is shown in Fig. 3. The Sigmoid (Sigm) and the rectified linear unit (ReLU) correspond to the two extremely utilized activation types of functions in planning the deep neural kind of networks (DNN). But, additionally to their implicit disadvantages, Sigm and ReLU both contain restrictions of standardizing input data on the individual. The scaled exponential linear unit (SELU) is defined as follows:
where
where

Figure 3: (a) Structure of autoencoder (b) Structure of stacked autoencoder
In addition, activation functions and newly proposed strategies for strengthening the outcome of denoising AE are introduced, specifically non-negative constraint and cross-entropy. The objective of the former is to improve the sparsity of the hidden features, while the latter is to improve the anti-noise capability to recognize the various sorts of signals. In this application, these techniques and SELU are combined and incorporated into the standard denoising AE to identify the feature conversion with the highest quality level. Finally, the necessary cost function is modified as follows:
where
where
Define loop: for
Initialization of arbitrary present solution C with the search space,
Determine the value of the present solution
Determine the value of the nearby solution En by the objective function. Compute the differences among the objective value of the present and neighbouring solutions
If
Else if
Where T implies, a variable is initialized with maximum value (Tmax) and concludes with the minimum value (Tmin). The termination criterion is a higher iteration value to attain a lower temperature (Tmin). SA and Genetic algorithm (GA) methodologies are integrated to reach the advantage of SA on local search and the merits of GA on global tracking. In addition, the concatenated impact of SA and Tabo search (TS) has been applied to deploy novel hybridization. Population-relied SS (PSA) has been employed to enhance the limitations of the SA method; PSA uses the population’s capability to find the search space. There are four search models; SA and Threshold Annealing (TA) methods, the Golden Ratio space search principle, and the Markovian Model have been implemented parallelly for implementing hybrid SA technology. The SA approach has been improved by incorporating linear programming as an intensifier.
Moreover, SA is applied as upper-level and DE as lower-level for developing a method for heat exchanging networks. Therefore, SA is enhanced by the integration of optimization models. DDAO is defined mathematically as given in the following:
1. The mass of steel, at the initial stage, is composed of a set of molecules that has to be enhanced to combine ferrite and martensite.
2. In the dual-phase steel configuration, the corresponding temperature is reduced, and the depreciation in the temperature level is regarded as an option to develop distinct phases of steel. When exploring a global solution, it is the same as the numerical optimization iteration process.
3. Internal energy exists in every section or zone of metal and is analogous to the measure of the objective function in numerical optimization.
4. The following equation indicates the cooling operation:
where
5. When the differential reduction, a metal is rolled, and the mechanical task should be evolved mathematically. For programming cases, the metal is forged than rolling. The dynamic nature of the hammer while forging is depicted as a parameter fluctuating among one as
where f implies a forging parameter and
6. In the actual annealing process, it approves the data of new levels at an elevated temperature compared to a low temperature. During optimization, it is repeated based on the probability formula defined by the SA approach:
where P defines the possibility of approving a novel solution,
7. It is followed by step 4, and an optimal solution is saved for all iterations.
The major search engine appears to be random, whereas the dynamic type of annealing technique is defined as a correction on the concerned search; and termed DDAO. A MATLAB mechanism is applied to execute DDAO. Fig. 4 illustrates the flowchart of the DDOA model.
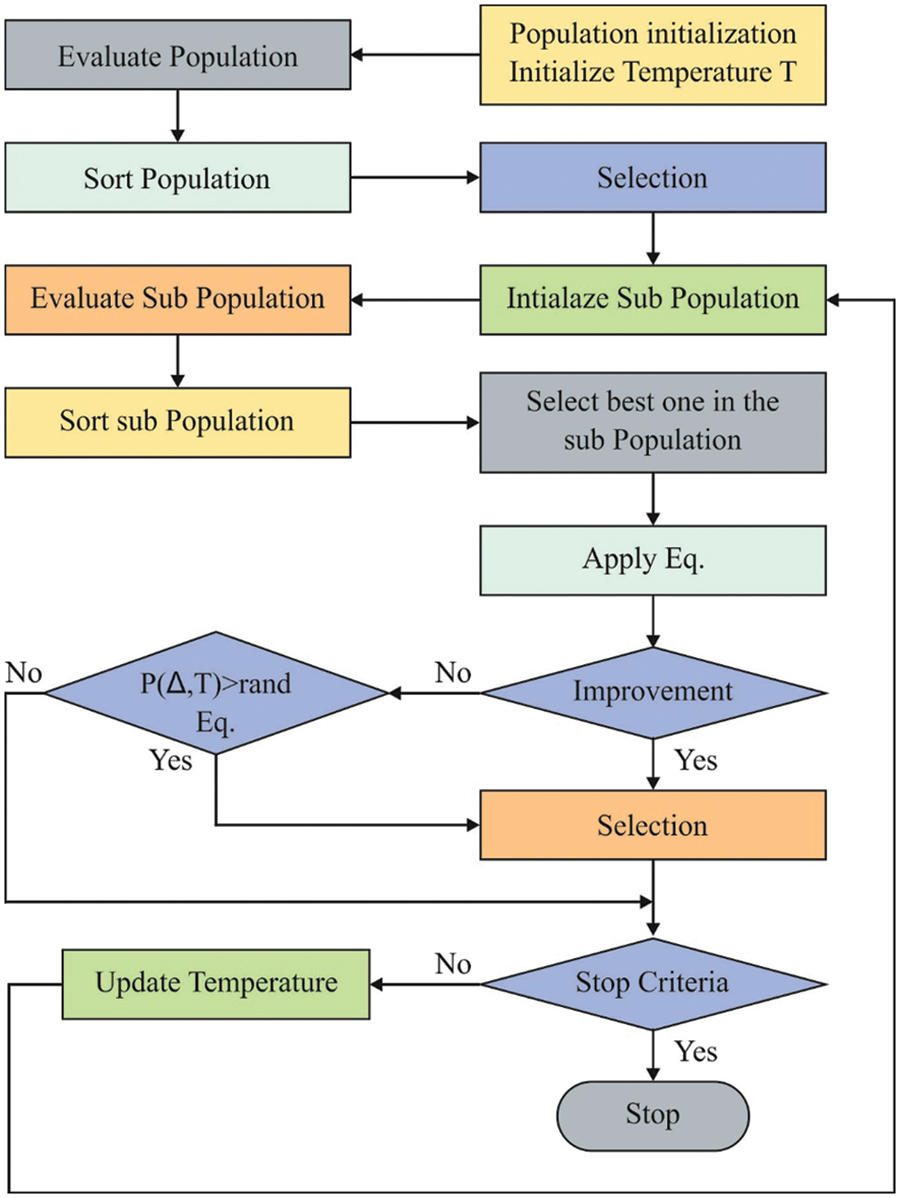
Figure 4: Flowchart of DDOA
The novel parameter, forging parameter f, contains a practical effect on the entire function of DDAO at the time of optimizing mathematical issues; DDAO is higher with f is 1 in Eq. (18), is inferior with f is the same as that of the random value, and for another group of issues. Therefore, Eq. (17) provides a solution for a problem while half of the iterations assume
2.4 Softmax-Based Classification
For general multiclass classification problems, it is represented as the classifying operator. An SM classification model computes the mapping of input vector c from N-dimensional space to K classes, which is expressed as follows:
where
This section effectively endorses the performance level of the UDLS-DDOA model using the ISIC dataset. The performance level of the UDLS-DDOA model has been estimated concerning the attributes such as sensitivity, specificity and accuracy, respectively.
The performance level of the UDLS-DDOA model has been evaluated against the ISIC dataset. The dataset comprises a group of various class labels such as 21 images under the Angioma, 46 images under the Nevus, 41 images under the Lentigo NOS, 68 images under the solar lentigo, 51 images under the melanoma, 54 images under the Seborrheic Keratosis and 37 images under the Basal Cell Carcinoma. The details related to the dataset are depicted in Table 1, and the sample type of test images are provided in Fig. 5.
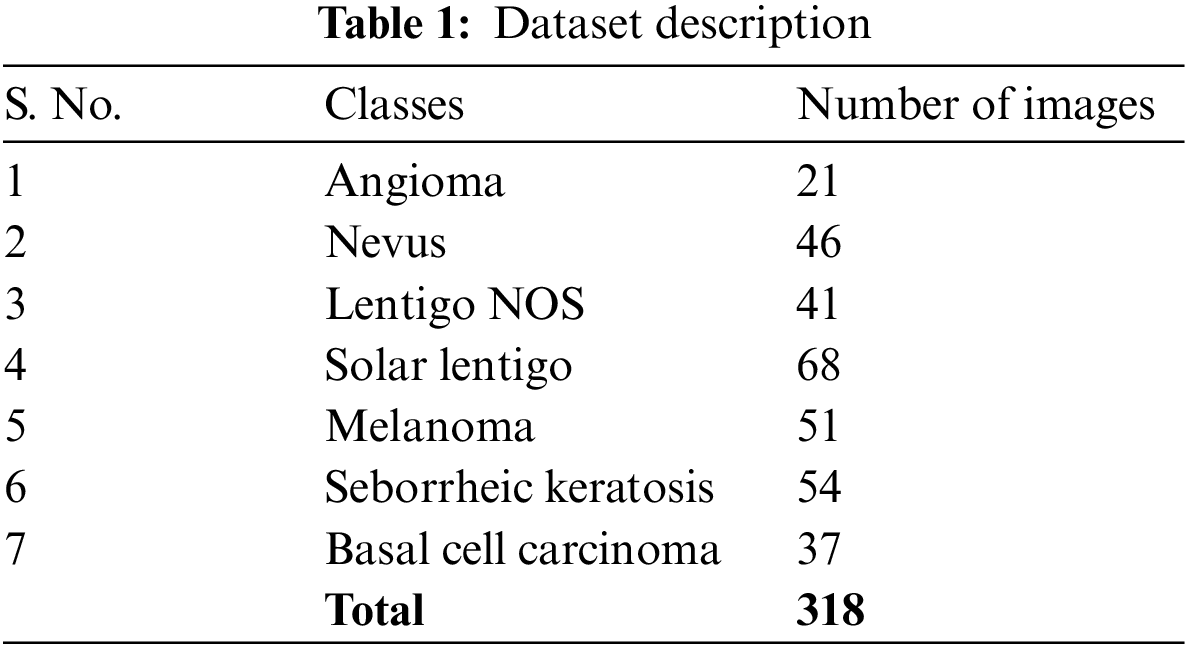

Figure 5: Sample test images
Figs. 6 and 7 illustrate the sample segmented and classified results. The first images represent the actual input image, the second one indicates the segmentation image, and the last represents the classified image. The figure depicted that the proposed model has effectively classified the images.

Figure 6: Sample visualization results of the UDLS-DDOA model

Figure 7: Visualization results of the UDLS-DDOA model
Table 2 and Fig. 8 illustrate the determinations of the outcomes of the UDLS-DDOA model to the attributes such as sensitivity, specificity, and accuracy, respectively. The experimental values indicated that the UDLS-DDOA model has effectively classified the Angioma class with a sensitivity of 96.89%, 97.82%, and 97.04%.
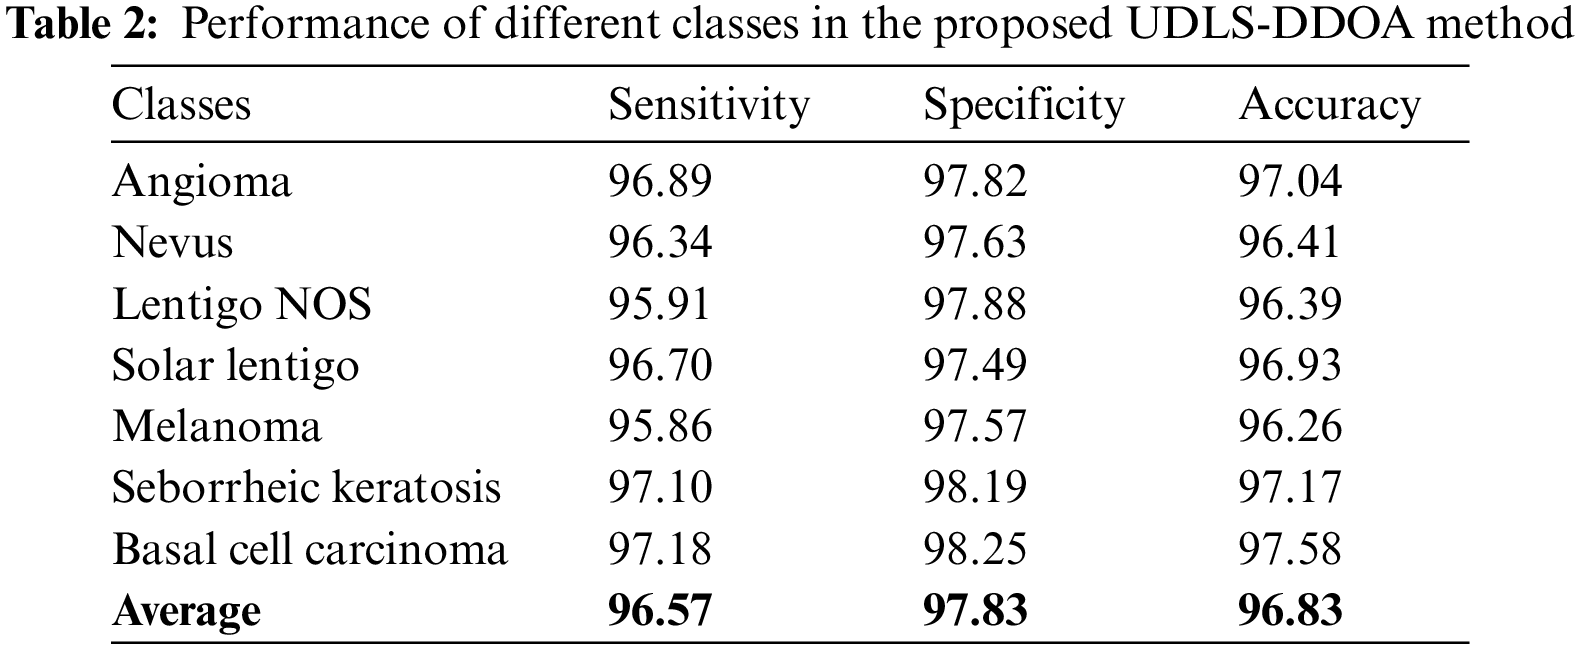

Figure 8: Results analysis of the UDLS-DDOA model
Table 3 and Fig. 9 depict the determination of the UDLS-DDOA model with that of the existing technologies such as the Hybrid Fully Convolution Neural Network (HFCNN), the Fully Convolutional-De-convolutional Networks (FCDN), the Deep Learning Networks (DLN), U-Net, and the You Only Look Once (YOLO) GrabCut (YOLO-GC).
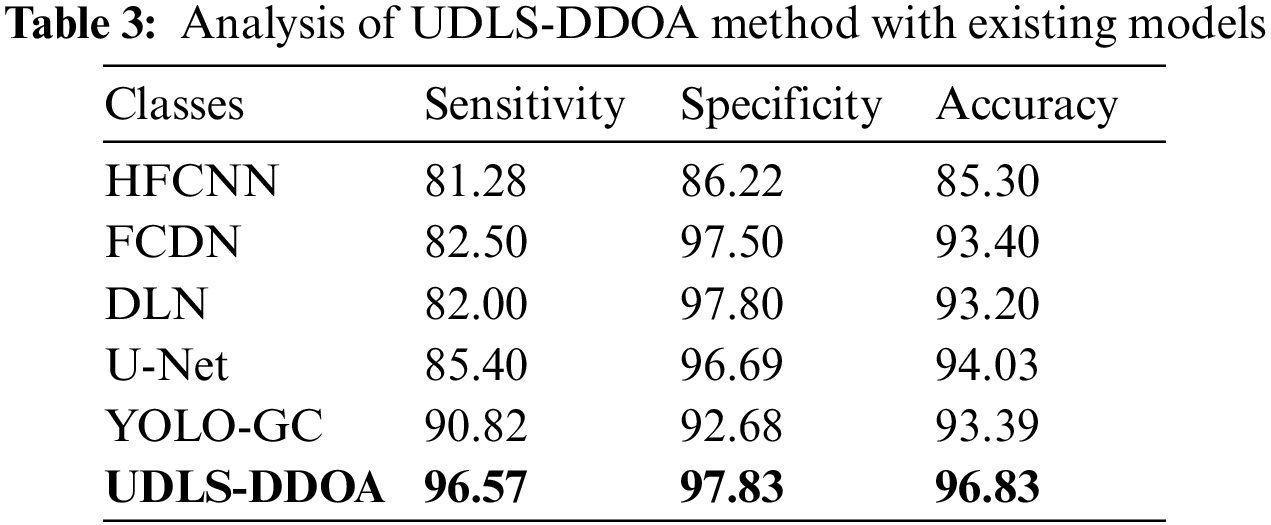

Figure 9: Comparative analysis of the UDLS-DDOA model
Fig. 9a investigates the identification of the UDLS-DDOA model with the conventional or the existing techniques to the sensitivity attribute. On analyzing the results, the simulation showed that the HFCNN model failed to show better performance by attaining the minor sensitivity of 81.28%. Concurrently, the FCDN model has tried to outperform the HFCNN model with a slightly higher sensitivity of 82.50%. Likewise, the DLN model has performed somewhat better outcomes with a sensitivity of 82%. The U-Net model has demonstrated moderate results with a sensitivity of 85.40%. The YOLO-GC model has attained significantly improved outcomes than the earlier models, with a sensitivity level of around 90.82%. But the UDLS-DDOA model has outperformed the other compared techniques with a sensitivity level of approximately 96.57%.
Fig. 9b shows the examination of the UDLS-DDOA method with previous methods to specificity. Examining the simulation outcome, the final results show that the HFCNN approach has failed to demonstrate moderate function by reaching a lower specificity of 86.22%. Simultaneously, the YOLO-GC technology has attempted to surpass the HFCNN scheme with medium specificity of 92.68%. In line with this, the U-Net approach has processed many results with a specificity of 96.69%. The FCDN method demonstrated good results with a specificity of 97.50%. The DLN approach then achieved effective good results compared to previous systems, with a specificity of 97.80%. However, the UDLS-DDOA framework outperformed the earlier models with a specificity of 97.83%.
Fig. 9c examines the investigation of the UDLS-DDOA method with traditional approaches using accuracy. In determining the results, the outcomes have implied that the HFCNN approach needs to illustrate considerable function by achieving a minimum accuracy of 85.30%. Simultaneously, the DLN technology has attempted to perform well in the HFCNN framework with acceptable accuracy of 93.20%. In line with this, the YOLO-GC technology has processed moderate outcomes with an accuracy level of around 93.39%. The FCDN approach has depicted reasonable outcomes with an accuracy of 93.40%. Then, the U-Net scheme reached intermediate results over the classical methodologies with an accuracy of 94.03%. Hence the UDLS-DDOA technique has surpassed the former methods with an accuracy of 96.83%.
From the figures mentioned earlier and tables, the experimental results depicted that the UDLS-DDOA model has projected improvised performance over the other compared techniques with a maximum sensitivity level of around 96.57%, specificity level of approximately 97.83%, and accuracy level of approximately 96.83%.
This study has developed an intelligent UDLS model optimized by DDOA for skin lesion diagnosis, named the UDLS-DDOA model. The suggested model for identifying skin lesions involves various operations, including pre-processing, segregation, feature removal, and classification. Using top hat filtering and in-painting techniques, the input image is initially pre-processed to eliminate any hairs present. The FCM-QOEHO method is then applied to divide the pre-processed image type. Then, the UDLS-DDOA technique is implemented and used to eliminate the required set of feature vectors. The SM function is then implemented for categorization purposes. The performance level of the UDLS-DDOA model vs. the ISIC-type dataset has been noticed, and the acquired experimental results are thus explored under various sorts of computational metrics. The simulation results have confirmed that the improved or enhanced performance level has a maximum sensitivity of around 96.57%, specificity of approximately 97.83%, and accuracy of roughly 96.83%. In the future, the introduced UDLS-DDOA model can be implemented in the real-time diagnosis of skin cancer.
Acknowledgement: The author extends their appreciation to the deputyship for Research & Innovation, Ministry of Education in Saudi Arabia, for funding this research work through Project Number (IFP-2020-133).
Funding Statement: The author received no specific funding for this study.
Author Contributions: It is a single author paper.
Availability of Data and Materials: International Skin Imaging Collaboration. SIIM-ISIC 2020 Challenge Dataset. International Skin Imaging Collaboration https://doi.org/10.34970/2020-ds01 (2020).
Conflicts of Interest: The author declares that he has no conflicts of interest to report regarding the present study.
References
1. T. Y. Satheesha, D. Satyanarayana, M. N. Giriprasad and K. N. Nagesh, “Detection of melanoma using distinct features,” in Proc. of 3rd MEC Int. Conf. on Big Data and Smart City (ICBDSC), Muscat, Oman, pp. 1–6, 2016. [Google Scholar]
2. R. S. Sundar and M. Vadivel, “Performance analysis of melanoma early detection using skin lesion classification system,” in Proc. of Int. Conf. on Circuit, Power and Computing Technologies (CPCT), Nagercoil, India, pp. 1–5, 2016. [Google Scholar]
3. S. M. Kumar, J. R. Kumar and K. Gopalakrishnan, “Skin cancer diagnostic using machine learning techniques-shearlet transform and Naïve Bayes classifier,” International Journal Engineering Advanced Technology (IJEAT), vol. 9, no. 2, pp. 2249–8958, 2019. [Google Scholar]
4. P. M. Ferreira, T. Mendonça, J. Rozeira and P. Rocha, “An annotation tool for dermoscopy image segmentation,” in Proc. of the 1st Int. Workshop on Visual Interfaces for Ground Truth Collection in Computer Vision Applications, ACM, New York, NY, USA, pp. 1–6, 2012. [Google Scholar]
5. V. Chintawar and J. Sanghavi, “Improving feature selection capabilities in skin disease detection system,” International Journal of Innovative Technology and Exploring Engineering (IJITEE), vol. 8, no. 8S3, pp. 247–251, 2019. [Google Scholar]
6. H. Sui, M. Samala, D. Gupta and N. Kudu, “Texture feature extraction for classification of melanoma,” International Research Journal of Engineering and Technology (IRJET), vol. 5, no. 3, pp. 1026–1029, 2018. [Google Scholar]
7. N. C. Codella, D. Gutman, M. E. Celebi, B. Helba, M. A. Marchetti et al., “Skin lesion analysis toward melanoma detection: A challenge at the 2017 international symposium on biomedical imaging (ISBNhosted by the international skin imaging collaboration (ISIC),” in Proc. of IEEE 15th Int. Symp. on Biomedical Imaging (ISBI), Washington DC, USA, IEEE, pp. 168–172, 2018. https://doi.org/10.1109/ISBI.2018.8363547 [Google Scholar] [CrossRef]
8. Z. Yu, X. Jiang, F. Zhou, J. Qin, D. Ni et al., “Melanoma recognition in dermoscopy images via aggregated deep convolutional features,” IEEE Transactions on Biomedical Engineering, vol. 66, no. 4, pp. 1006–1016, 2018. [Google Scholar] [PubMed]
9. N. C. Codella, D. Gutman, M. E. Celebi, B. Helba, M. A. Marchetti et al., “Skin lesion analysis toward melanoma detection: A challenge at the 2017 international symposium on biomedical imaging (ISBIhosted by the international skin imaging collaboration (ISIC),” in Proc. of IEEE 15th Int. Symp. on Biomedical Imaging (ISBI 2018), Washington DC, USA, 2018. [Google Scholar]
10. L. Bi, J. Kim, E. Ahn, A. Kumar, M. Fulham et al., “Dermoscopic image segmentation via multi-stage fully convolutional networks,” IEEE Transactions on Biomedical Engineering, vol. 64, no. 9, pp. 2065–2074, 2017. https://doi.org/10.1109/TBME.2017.2712771 [Google Scholar] [PubMed] [CrossRef]
11. Y. Yuan, M. Chao and Y. Y. C. Lo, “Automatic skin lesion segmentation using deep fully convolutional networks with jaccard distance,” IEEE Transactions on Medical Imaging, vol. 36, no. 9, pp. 1876–1886, 2017. [Google Scholar] [PubMed]
12. Y. Yang, S. X. Guo, R. L. Tian and P. Liu, “Fuzzy C-means clustering algorithm for image segmentation based on improved particle swarm optimization,” Advanced Materials Research, vol. 532, pp. 1553–1557, 2012. [Google Scholar]
13. M. A. Elhosseini, R. A. El Sehiemy, Y. I. Rashwan and X. Z. Gao, “On the performance improvement of elephant herding optimization algorithm,” Knowledge-Based Systems, vol. 166, pp. 58–70, 2019. [Google Scholar]
14. M. Basu, “Quasi-oppositional differential evolution for optimal reactive power dispatch,” International Journal of Electrical Power & Energy Systems, vol. 78, pp. 29–40, 2016. [Google Scholar]
15. S. Haidong, D. Ziyang, C. Junsheng and J. Hongkai, “Intelligent fault diagnosis among different rotating machines using novel stacked transfer auto-encoder optimized by PSO,” ISA Transactions, vol. 105, pp. 308–319, 2020. [Google Scholar] [PubMed]
16. H. N. Ghafil and K. Jármai, “Dynamic differential annealed optimization: New metaheuristic optimization algorithm for engineering applications,” Applied Soft Computing, vol. 93, pp. 106392, 2020. [Google Scholar]
Cite This Article
 Copyright © 2023 The Author(s). Published by Tech Science Press.
This work is licensed under a Creative Commons Attribution 4.0 International License , which permits unrestricted use, distribution, and reproduction in any medium, provided the original work is properly cited.
 Downloads
 Citation Tools