
 Submit a Paper
 Propose a Special lssue
 Open Access
ARTICLE
Optimal Operation of Electric Vehicles and Distributed Generation Resources in Smart Grid Considering Load Management
State Grid Ningxia Electric Power Co., Ltd. Eco-Tech Research Institute, Yinchuan, 750004, China
* Corresponding Author: Zheng Wang. Email:
(This article belongs to the Special Issue: Application of Artificial Intelligence for Energy and City Environmental Sustainability)
Energy Engineering 2022, 119(6), 2655-2679. https://doi.org/10.32604/ee.2022.021843
Received 08 February 2022; Accepted 17 May 2022; Issue published 14 September 2022
 View Full Text
 Download PDF
Abstract
Technology advancement and the global tendency to use renewable energy in distributed generation units in the distribution network have been proposed as sources of energy supply. Despite the complexity of their protection, as well as the operation of distributed generation resources in the distribution network, factors such as improving reliability, increasing production capacity of the distribution network, stabilizing the voltage of the distribution network, reducing peak clipping losses, as well as economic and environmental considerations, have expanded the influence of distributed generation (DG) resources in the distribution network. The location of DG sources and their capacity are the key factors in the effectiveness of distributed generation in the voltage stability of distribution systems. Nowadays, along with the scattered production sources of electric vehicles with the ability to connect to the network, due to having an energy storage system, they are known as valuable resources that can provide various services to the power system. These vehicles can empower the grid or be used as a storage supply source when parked and connected to the grid. This paper introduces and studies a two-stage planning framework for the concurrent management of many electric vehicles and distributed generation resources with private ownership. In the first stage, the aim is to increase the profit of electric vehicles and distributed generation sources; finally, the purpose is to reduce operating costs. The proposed scheduling framework is tested on a distribution network connected to bus 5 of the RBTS sample network. Besides distributed generation sources and electric vehicles, we integrate time-consistent load management into the system. Due to distributed generation sources such as photovoltaic systems and wind turbines and the studied design in the modeling, we use the Taguchi TOAT algorithm to generate and reduce the scenario to ensure the uncertainty in renewable energy. MATLAB software is used to solve the problem and select the optimal answer.Keywords
Nomenclature
| Charging/discharging status of electric vehicle v at hour t | |
| U(j, t) | On/off status of generator j at hour j and time t |
| Electric vehicle discharge power v at hour t | |
| Charging power of electric vehicle v at hour t | |
| Electric vehicle energy v at hour t | |
| Optimal charge profile for electric vehicle v | |
| Optimal discharge profile for electric vehicle v | |
| Dv | Number of switching modes from charge to discharge status, or vice versa, for electric vehicle v |
| Power purchased from the main network at hour t | |
| Wind turbine power at hour t | |
| Photovoltaic system power at hour t and scenario s | |
| Active power losses per hour t | |
| Radiation intensity at hour t | |
| Network load per hour t | |
| Electric car discharge price per hour t | |
| Active power injected into the busbar at hour t | |
| Power passing through transformer n at t | |
| Wind turbine speed per hour t | |
| Objective function related to the profit of electric vehicles | |
| Objective function related to the profit of distributed generation resources | |
| Size m and n in the network admittance matrix | |
| Angles n and m in the network admittance matrix | |
| Nominal power of wind turbine | |
| Nominal speed of wind turbine | |
| Low wind turbine cutting speed | |
| High wind turbine cutting speed | |
| Efficiency coefficient of photovoltaic system | |
| Total level of the photovoltaic system | |
| Ambient temperature | |
| Charge efficiency of electric vehicle v | |
| Discharge efficiency of electric vehicle v | |
| Maximum discharge power of electric vehicle v | |
| Maximum rechargeable power of electric vehicle v | |
| Maximum electric car battery capacity limit | |
| Minimum electric car battery capacity limit | |
| Maximum percentage of usable capacity of electric vehicle v | |
| Minimum usable percentage of battery capacity of electric vehicle v | |
| Battery capacity of electric vehicle v | |
| Weight factor related to the charge of electric vehicles | |
| Weight factor related to the discharge of electric vehicles | |
| Apparent power flowing from busbar m to n at hour t | |
| Index of dispersed production source number | |
| Index of network busbar numbers | |
| Index for optimization time intervals | |
| Index related to scenario number | |
| Index for electric vehicle numbers |
Advances in technology and the global trend toward renewable energy have introduced distributed generation units in the distribution network as one source of energy supply. Factors such as improving reliability, reducing peak clipping losses, demand response as well as economic and environmental considerations have expanded the influence of distributed generation resources in the distribution network [1]. Today, one concern of human societies is the safe and widespread use of renewable energy sources to reduce greenhouse gas emissions. Renewable energy sources are clean and inexhaustible and can be an excellent alternative to fossil fuels [2]. The emergence of renewable distributed generation sources and the need to supply the consumption load in the consumption place has created the concept of a microgrid. The microgrid can be operated in two ways: connected to the network and separate from the leading network. Where it is not possible to develop the power supply system, an island microgrid is recommended [3]. Currently, industrial, commercial and residential consumers are connected to energy grids such as electricity, natural gas, area heating, or cooling. So far, various studies have been conducted concerning energy infrastructure, but no comprehensive works have been undertaken on combining these systems, which have many advantages; one of these advantages is using composite and flexible properties of these systems.
Due to various reasons, such as limited fossil fuel resources, increasing effects of global warming, random nature of renewable energy systems, and political impacts of energy dependence, improving electricity efficiency methods has received great attention. High-cost thermal power stations must be put into operation during peak days and seasonal consumption. These peak loads will probably result in constructing new power plants and upgrading the existing equipment. Therefore, to avoid the need for serious investment in the construction and development of equipment, the perspective of the smart grid with consumer participation on the demand side can be considered [4]. The term demand response means a change in the consumption of electricity by consumers in response to changes in electricity prices or incentive costs set to reduce electricity consumption during peak hours of electricity consumption. In general, the purpose of demand response is to reduce power consumption during peak hours when the purchase price of energy in the market is very high or the storage level of the system is low due to the occurrence of possible events [5].
In countries with thriving economies, electricity distribution networks play a vital role in supplying essential and industrial electrical loads. In recent years, we have witnessed the emergence of various technologies that have changed how to generate, transmit and deliver electricity to consumers. Technologies such as distributed generation and electric vehicles, considering these two critical events in distribution networks, can create various challenges and opportunities for the power grid. Electric vehicles (EV) with grid-to-vehicle (G2V) and vehicle-to-grid (V2G) connectivity can significantly contribute to the efficient operation of the network energy management system [6]. Charging the vehicle battery at the off-peak time of the network, where prices are usually low, and then using this energy stored during peak hours through the vehicle mode to the grid can be an excellent strategy for running a demand response program. In this regard, different types of energy storage systems can also reduce peak consumption. Various studies have shown that distribution networks will be severely damaged by the high intrusion of electric vehicles charged and discharged in an uncoordinated manner. These effects can include increasing the maximum load, growing losses, decreasing the voltage and load factor of the system, and so on. Various studies have shown that the immediate solution for these adverse effects is to create a collaborative process for charging and discharging vehicles [7]. In [8], the energy in the batteries of electric cars remains unused due to the long park time. If these vehicles can connect to the grid, they can use the energy stored in the batteries to provide ancillary services, such as peak power reduction and rotational reservation. In [9], it was shown that the use of electric vehicles in frequency control programs could be more profitable for the owners of electric cars than the peak reduction programs by considering the battery life reduction parameter as a determining factor. According to [10,11], electric vehicles change the daily energy demand, and their economic effects on the power system are studied. In [12], the initial challenges of using electric vehicles are examined.
In [13], a charge control system was provided for car charge coordination in order to charge at off-peak hours with low energy costs and, at the same time, meet the technical limitations of the network. Search and neural network methods were used to make decisions in this system. In [14], first, the effect of charging and discharging electric vehicles on the distribution network was dealt with. Then, it was shown that the voltage and filling of the lines could be controlled by proper control of car charging and discharging. Also, more cars can be entered into the network without strengthening the network by controlling this issue. In [15], the fuzzy method of online synchronization in the intelligent distribution network was considered to reduce the overall cost of energy production and grid losses. In this study, the effect of different degrees of vehicle penetration on these indicators was investigated.
In [16], the technical and economic impacts of the arrival of electric vehicles on the US power grid were examined. This article showed that increasing vehicle arrivals could make network operation more difficult and reduce network reliability. In [17], the issues of the unit commitment, the on and off states of the units, and the amount of their production capacity were addressed provided that conditions such as the balance of production and consumption were met and the required revolving supply was provided within 24 h at the lowest cost. In [18], the short-term planning of power plants units was solved by considering the role of grid-connected electric vehicles with the particle swarm optimization method and cost reduction objective. In [19], the unit commitment formulation was done in the presence of renewable wind and solar sources as well as the presence of a battery as a source of energy storage. Authors in [20] and [21] have presented two methods of minimizing energy losses in microgrids to help vehicle management. In the first method, the problem is proposed as a two-stage optimization; in the second method, a locally square convex optimization problem is presented.
A two-stage programming framework has been conferred in [22] and examined to manage an outsized variety of electrical vehicles within the presence of DGs foremost with the aim of skyrocketing the profits of electric vehicles and DGs and ultimately geared toward reducing operational costs. The coordination among home energy management systems and electric vehicle parking zone management systems (PLEMS) is planned in [23], as a brand-new contribution to earlier studies. The EMSs organize by part sharing individual electric vehicle programs while not sharing personal data. Missing information is completed through public cloud repositories and services. An EV charging approach that shows intelligence and explores these long-parked times is presented in [24]. A new model of programming is presented in [25] for industrial virtual power plants (IVPP) through the DR and EV synchronization. Additionally, an overview of another, different and recent research on EV charging stations is presented in [26], with the aim of challenges, design, energy storage models, micro-grid constraints, and energy management strategies.
The most important advantage of the mentioned methods is that achieving the answer is guaranteed in the networks with a high number of consumers and a high penetration level of vehicles. Also, in these references, the impact of various vehicle power management policies, including active and reactive power management, has been examined. The best charging strategy to reduce energy losses has been proposed as well.
One of the main issues on which few studies have been conducted is the simultaneous management of distributed generation resources and electric vehicles as two completely independent and private entities. This is important because the owners of distributed generation resources and electric vehicles are trying to maximize their profits, which can cause many problems, such as increased losses, line filling, increased network reinforcement costs, etc., in distribution networks. Therefore, in this paper, we try to provide a two-stage planning framework, electric vehicles and distributed generation resources with private ownership to maximize their profits in a way that, besides high satisfaction, they address the critical issue of reducing operating costs by considering network constraints.
The innovation aspects of the article are as follows:
• Provide a two-stage planning framework for energy resource management by considering the role of the participant with the evolutionary algorithm of harmonic search.
• Considering the charge and discharge management of electric vehicles to cover the uncertainty of electricity prices.
• Scheduling of distributed generation sources and its effect on the issue of distribution network energy resources planning.
• In order to create uncertainty in renewable energy from Taguchi TOAT algorithm to generate and reduce the scenario.
The rest of the article can be followed in the following sections: In the second section, modeling and problem statement is presented. In the third part of the Taguchi TOAT orthogonal array test algorithm, this paper presents the proposal. In the fourth section, load management is presented. In the fifth section, the harmonic search algorithm is presented. In the sixth section, the results of simulation and numerical analysis are presented. At the end of your conclusion and suggestion are stated in the eighth section.
Another method by which the load curve can be tracked with the aim of peak clipping and valley filling is the use of an intelligent V2G (vehicle-to-grid) system, which can have beneficial capabilities for the network, such as power supply during peak moments, use as a source of energy storage and frequency control, improving the voltage profile and increasing the network’s reliability. In this way, electric vehicles can be connected to the grid when not in use and inject the energy stored in their batteries into the grid. Therefore, electric vehicles can operate as consumers or generators at different times of the day. Thus, the presence of electric vehicles in a significant volume causes severe changes in the load curve of the power system. An electric vehicle owner is connected to the electricity network 24 h a day to supply the required energy to the car and charge the battery. Depending on the type of consumption and needs, she/he uses the vehicle and consumes the stored energy at other times of the day. Indeed, if the car owner does not need it, they can sell the stored energy to the network during the hours when the price of electricity is high (peak load). Therefore, intelligent management of electric vehicles as decentralized and flexible energy storage can offer new supply and demand management opportunities in the electricity supply system. Researchers have proposed a way to charge and discharge electric vehicles, which solves the problem of peak power demand by electric vehicle batteries and makes the load curve more balanced. Therefore, the entry of electric vehicles into the car market is not only a problem for the electricity industry but also an opportunity for providing power during peak hours.
This section describes the process of modeling energy planning in the distribution network using the proposed method. First, the planning framework of the proposed model is described. Then, the formulation of the problem is given, along with the planning constraints.
2.1 Proposed Energy Planning Framework
Due to the increasing presence of electric vehicles and distributed generation sources in distribution networks, the need for an appropriate control program to control the process of charging and discharging vehicles as a new load and distributed generation sources as a source of energy production is felt more than ever. The following is a two-step algorithm for achieving a comprehensive planning framework that meets the network’s technical limitations and considers the privacy and comfort of owners of electric vehicles, distributed generation resources, and other actors. The proposed planning framework comprises two stages.
In the first stage, electric vehicle coordinators and owners of distributed generation resources try to maximize their profits during the planning period by implementing a separate optimization program, considering their demands and limitations. For this purpose, owners of electric vehicles provide coordinators with information such as arrival time at the parking lot, exit time from the parking lot, initial charge status, and final charge status to obtain the optimal charge/discharge program for the vehicles; On the other hand, owners of distributed generation resources try to maximize their profits by having information about distributed generation sources and electricity market prices. At the end of the first phase of the proposed planning, the optimal charge/discharge schedule for the vehicles and the production pattern of the units are reported to the network operator.
In the second stage of the proposed energy planning, the network operator, after receiving the optimal charge/discharge plan for vehicles and the optimal strategy for the production of distributed generation resources, tries in each scenario by purchasing energy from the market, changing the optimal production plan for distributed generation resources and changing the optimal vehicle charge/discharge program, and plans the energy of available resources in a way that reduces the operating costs while providing the required load to the network. Resource usage pattern, electric vehicle charging/discharging program, along with power purchased from the network are the primary outputs of this planning stage. Although these outputs are optimal from the car owners’ and distributed generation sources’ points of view, they do not guarantee the network’s technical constraints. Therefore, after performing load distribution calculations, the network operator checks all the technical constraints of the network and, if any of the constraints are not met, repeats the second stage of optimization by applying new constraints. This continues until all network constraints are met. The following is the formulation of each step.
2.2.1 Formulating the First Stage of the Proposed Planning
In the first stage of the proposed planning framework, coordinators and owners of distributed generation resources seek to maximize their profits by implementing the optimization problem. The following are the relationships related to each one.
Formulation Related to Vehicle Coordinator
The objective function for maximizing vehicle profits is calculated using Eq. (1) [22].
The restrictions for cars are:
In planning the charging and discharging of a car, at a specific moment, the vehicle should not be programmed in both charging and discharging modes simultaneously.
The continuity equation of car charge and discharge during the planning period is given in the following equation [22]:
The limits of rechargeable power and battery discharge of each car in each period are [22]:
Discharging an electric car’s battery to a certain extent and charging it to a certain amount prevent the premature failure of the battery and increase its useful life [22].
which are calculated as follows:
Battery charge and discharge limits per hour are proportional to the amount of energy stored in the battery in the previous period and maximum battery capacity [22]:
The desired amount of energy stored in the battery of each car when leaving the parking lot is given as follows:
The limit of the number of times to change the status from charge to discharge modes, and vice versa, according to the age of car batteries is given as follows:
y performing linear programming with binary variables, the desired charge/discharge profile of the vehicles is obtained as follows:
Formulations Related to Non-Renewable Distributed Generation Sources
Since non-renewable distributed generation sources are considered privately owned, their objective function (profit maximization) is in the form of Eq. (11) [22]:
Restrictions on non-renewable distributed generation sources are as follows:
The cost of non-renewable resources is modeled as a function of their output power. Therefore, to use the linear programming optimization method, cost functions with appropriate approximations are considered in the following form:
The limits on the maximum and minimum production capacity of non-renewable distributed generators are as follows:
The cost of setting up non-renewable distributed generators is calculated as follows:
The rate of increase and decrease of power related to non-renewable distributed generation sources is as follows:
By performing linear programming with binary variables, the optimal distribution generation resource production pattern is obtained as follows:
Formulating the Second Stage of the Proposed Planning
In the second stage, the network operator, after receiving the information of the first stage (Eqs. (14), (15), and (24)) in each scenario, buying energy from the market, changes the optimal production schedule of distributed generation resources and changing the profile of optimal charge/discharge of vehicles, try to do energy planning of available resources in a way that meets the demands of owners of electric vehicles and distributed generation sources as well as reduce the technical constraints of the network and operating costs. To achieve these goals then, the following optimization program is performed by the system operator for all the scenarios [22]:
As can be seen in Eq. (25), the objective function of the optimization program in this stage consists of four parts. The first part shows the cost of energy purchased from the market and the cost of losses. The paid cost to the owners of distributed generation sources and electric vehicles to participate in the proposed program is given in the second, third, and fourth parts. The constraints related to this planning stage are as follows:
The total power generated and power purchased from the electricity market must be equal to the amount consumed [22]:
Technical Constraints of the Network
The technical constraints related to the network are [22]:
Constraints Related to Electric Vehicles
Eqs. (2)–(19) are constraints on electric vehicles that must be considered in this stage of energy planning.
Constraints Related to Distributed Generation Sources
Non-renewable resources
Eqs. (11)–(29) are constraints on non-renewable distributed generation sources that must be considered in energy planning.
Renewable resources
Since the primary energy source for wind turbines and photovoltaic units is wind and solar energy, the existing studies have used probabilistic functions to model their output power, as described below.
Probabilistic Model of a Photovoltaic System
In this study, the beta probability density function is used to model the power of the photovoltaic system.
According to the distribution of the predicted radiation intensity in each region and the function of converting radiation into power, the output power of the photovoltaic system can be calculated for each radiation intensity at any time.
A Probabilistic Model of Wind Turbine
The Rayleigh probability density function is used in this study to model the wind speed behavior.
Also, the output power of the wind turbine can be calculated at any time using the power conversion function given in the following equation:
Co-coordinators and owners of distributed generation resources obtain distributed sources and report them to the network operator by implementing an optimization program, vehicle charge/discharge profile, and production pattern. The operator must then determine the output power for each distributed generation source, the power purchased from the network, and the vehicle charge/discharge correction strategy for all the scenarios by performing nonlinear programming with binary variables (Eq. (25)). Since the second optimization stage has nonlinear sentences (absolute value sentences in Eq. (25)), there is no guarantee to derive a conclusive optimal answer. Hence, this equation is first linearized as follows:
Assuming two variables
Finally, the network operator checks the technical constraints of the network (Eqs. (29)–(32)) by performing the load distribution. Suppose any of the constraints are not met. In that case, the second planning stage is repeated by imposing a load limit on sensitive parking lots (sensitive busbars) until the constraints are fully satisfied. It should be noted that sensitivity analysis has been used to determine sensitive parking lots, meaning that for each time per parking lot, the amount of parking load is increased by 10%, and changes related to the parking voltage are stored. After applying this algorithm, sensitive parking, lots are identified at any time interval.
3 Taguchi Orthogonal Array Test (TOAT) Algorithm
One advantage of using microgrids is increasing the production of renewable resources in the network. However, a significant problem with these devices is their intermittent nature. The power generated by renewable sources depends only on climatic indicators such as wind speed and solar radiation. Therefore, the uncertainty in these sources is not due to continuous changes in renewable electricity generation but the unpredictability of wind and solar energy due to their forecast errors. One of the main reasons for the uncertainty is the unexpected changes in system demand during the day. However, despite the uncertainty of the solution obtained, it may not be desirable or even possible. Therefore, to achieve a reliable solution, the uncertainty of renewable resources in power generation planning in microgrids must be considered. In this paper, the Taguchi method is used to consider the uncertainty. In [27], Taguchi developed Taguchi’s orthogonal array testing (TOAT) to obtain robust solutions for production design practical problems. In the uncertainty operation, TOAT with the minimum number of scenarios ensures that the considered test scenarios provide good statistical information and significantly reduce the number of tests.
For different models, it has been proven that TOAT can choose the optimal scenario from all the possible scenarios [28]. Compared to the Monte Carlo method, TOAT offers much fewer test scenarios and leads to a reduction in computation time. This method has proven its ability as an optimization algorithm in solving the load distribution and economic emission of power in power systems [29].
Load management, also known as demand-side management, balances the power supply in an electric load network by adjusting or controlling the load instead of the power station output. This can be achieved via directly intervening in real-time use by frequency-sensitive relays (wave control), time clocks or by using specific tariffs to influence consumer behaviors. Load management allows programs to reduce demand for electricity at peak times (peak modification), reducing costs by eliminating the need for peaking power plants. In addition, some peak power plants can take more than an hour to generate a line, which makes load management more unexpected. For example, it goes offline unexpectedly. Load management can also help reduce emissions. Peaking power plants or backup generators are often dirtier and less efficient than base-load power plants. New load management technologies are constantly evolving by private industry and government agencies. Because electrical energy is a form of energy that cannot be stored efficiently, it must be generated, distributed, and consumed immediately. When loads are generated on a system close to maximum capacity, network operators must either find additional energy sources or reduce the load due to load management. The system will become unstable if they fail, and blackouts can occur.
Long-term load management planning may begin by creating complex models to describe the physical properties of the distribution network (i.e., the topology of capacity and other line characteristics) as well as the load behavior. This analysis may include scenarios that consider weather forecasts, the expected impact of proposed load warehouse orders, estimated time to repair offline equipment, and other factors. Using load management can help a power plant achieve a higher capacity factor as a measure of average capacity utilization. The capacity factor measures the output of a power plant compared to the maximum output it can produce. The capacity factor is often defined as the average load to capacity ratio or the average load to peak load over an alternation period. The higher load factor is beneficial because a power plant with lower load factors may be less efficient. A high load factor means ongoing costs are spread over more than each kilowatt-hour of output (resulting in less price per unit of electricity). A higher load factor means higher total output. If the power factor is affected by fuel unavailability, maintenance, unplanned downtime, or declining demand (as the consumption pattern fluctuates throughout the day), production must be adjusted as the grid energy storage is often costly. Smaller programs that buy power instead of them can also benefit from installing a load control system. The fines they have to pay for peak consumption can be significantly reduced. Many people report that a load control system can pay for itself in one season [30]. In the time-based load response program, the operator transfers a part of the load to other time intervals, the equation of which is as follows:
In the following, we review the technical constraints related to the load response program. It is important to note that no-load decreases or increases but is transferred from peak intervals to medium or low load intervals. When operating the system, the relationship between decreasing and increasing loads is defined as:
The following equation states that the amount of incremental load must be less than a percentage of the baseload:
Based on the following equation, the percentage of load decrease and increase must be less than a specific value:
According to the tools they have to make music, musicians first randomly play music with the existing instruments. This harmony is stored in the musician’s memory and in the next part, the musician, according to the harmonies in their memory, plays new music that differs from the previous one. When a musician makes an improvised sound, they usually follow one of the three rules:
Playing one sound they have in their memory;
Playing an adjacent voice close to the sound they have in their memory;
Playing a random sound of the degree of tolerable sound.
Suppose triple jazz comprises the saxophone, violin, and guitar. There is a certain amount of justifiable sound in the memory of every musician; the saxophonist, violinist, and guitarist. If the saxophonist accidentally plays the sol note, the guitarist does note, and the violinist the si note, the existing harmony (sol, si, do) creates a new harmony. If the new harmony is better than the existing harmony in memory, the new harmony is placed in memory, and the previous harmony is removed. This process continues until reaching the unique harmony. The problem is formulated according to the structure of the harmonic search algorithm, and the structure of the problem response is considered harmonic. The algorithm then creates a harmony randomly by observing the conditions of possibility and putting them in the harmony memory. The workflow of a harmonic search algorithm is fully explained [31]. First, the optimization problem is specified by the following formula:
In this section, the values of the following parameters are specified:
Harmonic memory size, harmonic memory consideration rate (HMCR), pitch adjustment rate (PAR) and full scale.
The second part of the algorithm is to create and shape a harmonic memory, which is as follows according to the matrix [31]:
In this part, the memory matrix is randomly solved by generating vectors and the actual performance function is made by f(x), which plays the role of memory.
The most important part of a harmonic search algorithm is this part because changing the harmonies in memory is done in this part. According to the previous equation, the HMCR estimate determines the extent to which the construction of a new harmonium uses the harmonic memory, and (1-HMCR) indicates the possibility of a new harmonic occurrence.
For example, a 95% HMCR, i.e., the harmonic search algorithm, selects new harmonic values with the probability of 95% of the values stored in harmonic memory and is likely to generate the 5% chance. When a value is transferred from memory, it may change depending on the probability of PAR, which can be altered by adding the correct amount to the value. In the following equations, bw is the optional distance for the survey width, and rand () is a random number between 0 and 1.
If the new harmony is better than the worst member of the harmony memory, the new harmony is placed in memory, and the worst harmony in memory is removed. In the last part, the condition for the end of the algorithm is checked, which is the number of repetitions in the harmonic search algorithm.
The flowchart of the proposed method of problem solving is shown in Fig. 1.

Figure 1: The main flowchart of proposed solution method
6.1 Introduction of the Studied System
The proposed programming framework is tested on a distribution network connected to bus 5 of the RBTS sample network with four feeders at 20 kV voltage [32]. For this network, data related to the type and number of subscribers connected to different load points and the average load value of each are presented in Table 1. This network is shown in Fig. 2, along with the subdivisions of the coordinators. The voltage limit of the busbars is equal to 0.05–0.9 per unit [22].
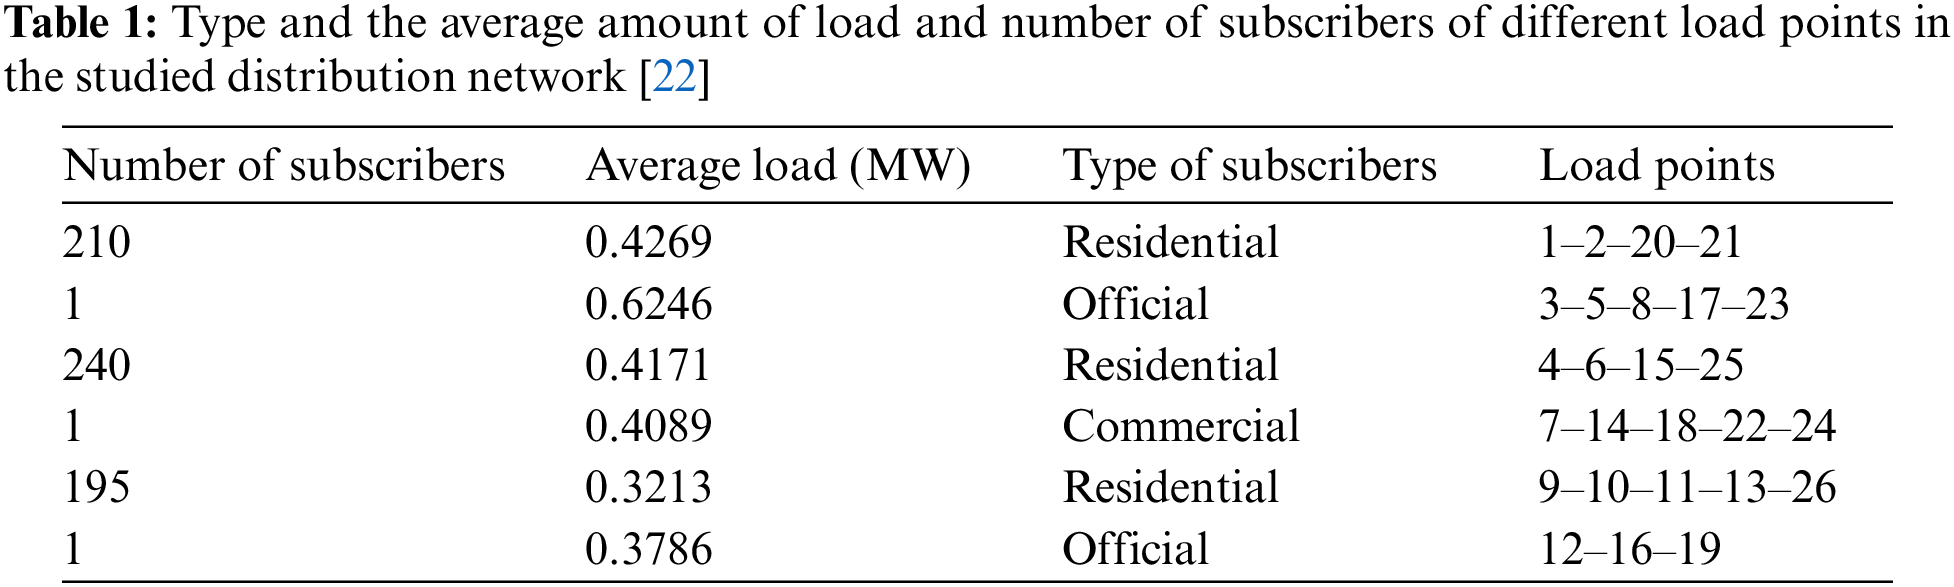
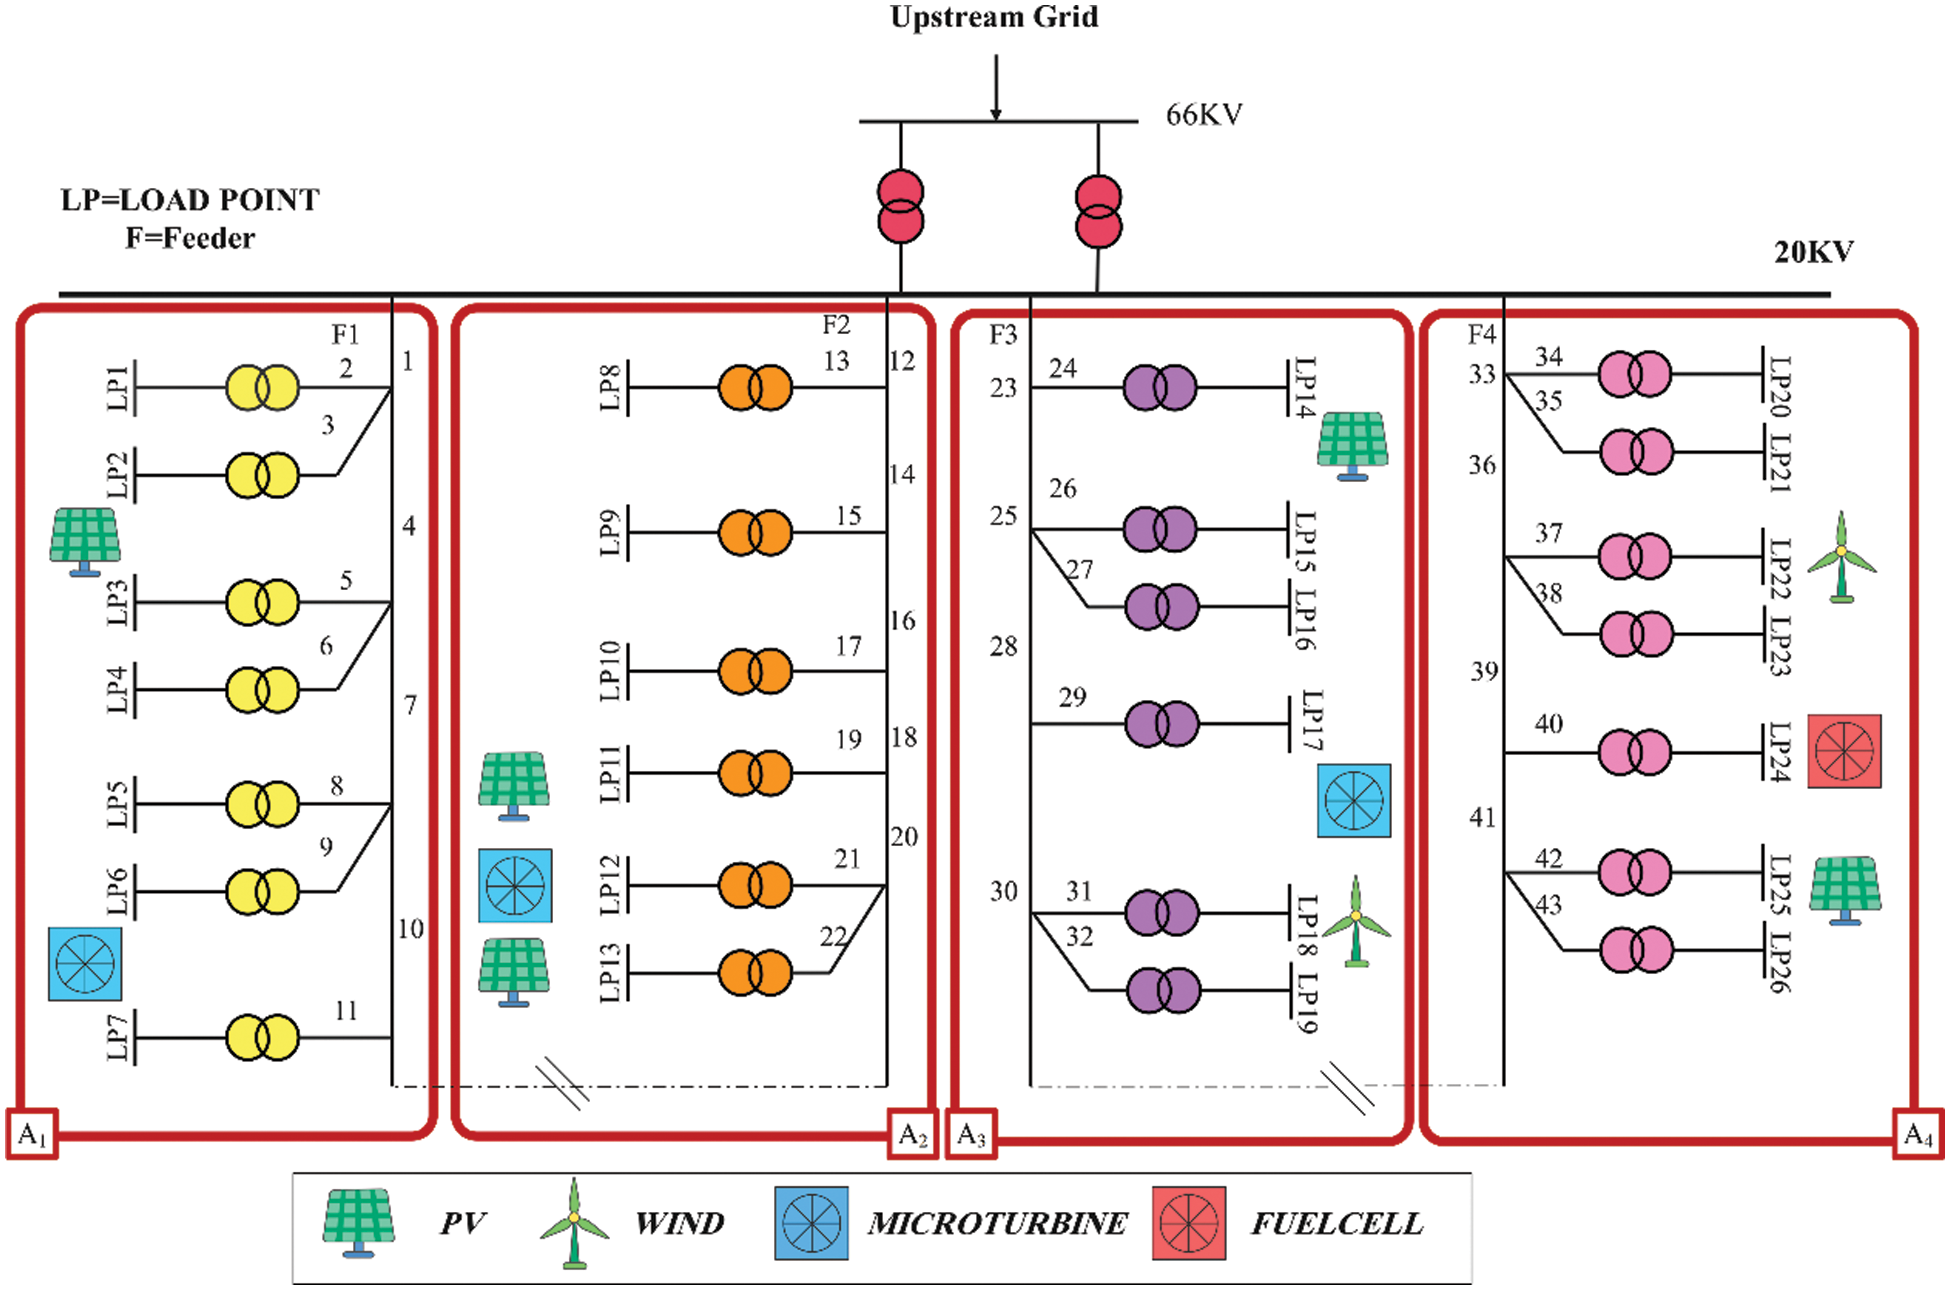
Figure 2: Single-line distribution network diagram connected to bus 5 of the RBTS sample network
The hourly price of the electricity market is given in Table 2. The capacity of the network’s medium and low voltage transformers is 15 MVA and 1 MVA, respectively. Four coordinators named A1, A2, A3 and A4 are considered in this network. The predicted hourly load of each coordinator in the 24-h planning interval is shown in Fig. 3 [22].
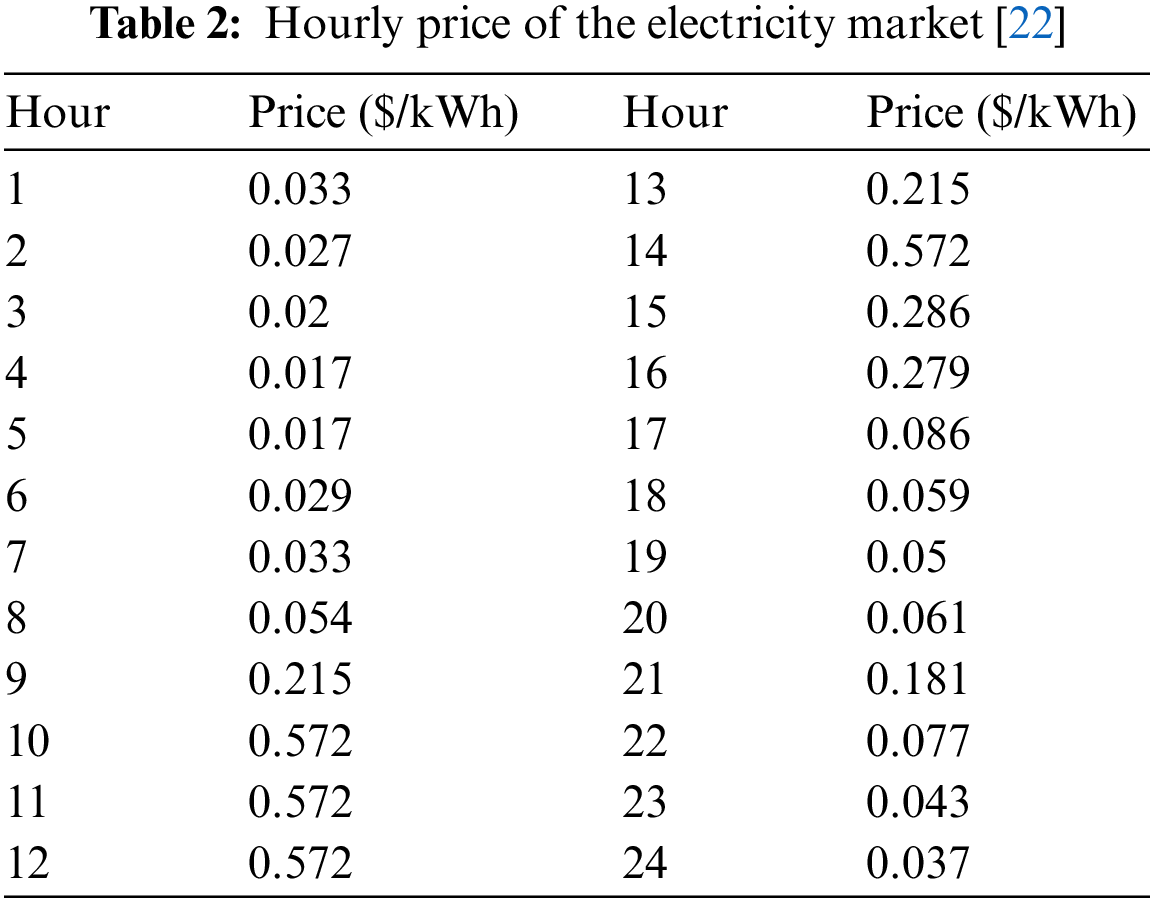

Figure 3: Hourly load demand of coordinators
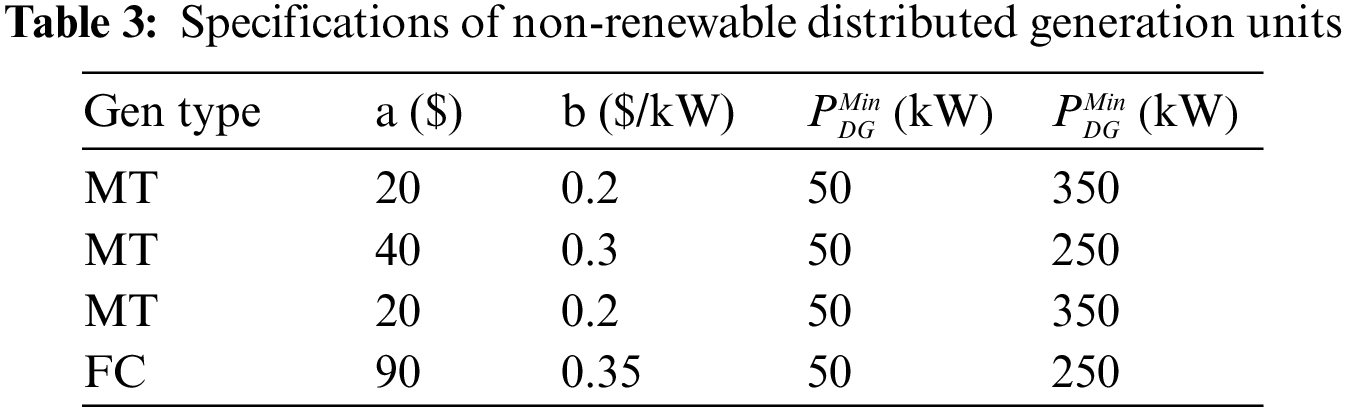
Also, three microturbine units and one fuel cell unit are installed in this network. Specifications of the cost functions of each unit are given in Table 3. The maximum rates of increase and decrease of power related to each unit at each time are equal to 20% of their maximum capacity.
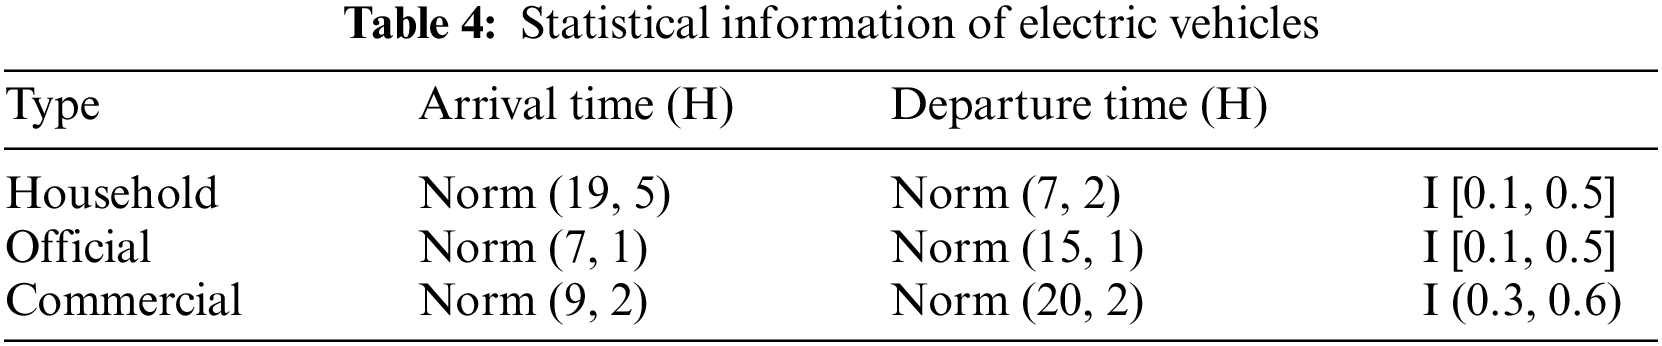
According to a statistical study in Tehran, the pattern of car use is obtained. The obtained information includes the hours of entry and exit of vehicles, the amount of initial energy when entering the parking lots and other information related to vehicles. A summary of car owners’ patterns of behavior in using their vehicles is given in Table 4.
The first step is to know the number of residential subscribers covered by the network to calculate the number of cars. In this regard, the information presented in Table 1 is used and, finally, for 35% of the penetration, the total number of vehicles in the network is estimated to be 4004 vehicles.
Battery capacity is one of the essential features of cars. According to [33], the battery capacity range in each class is considered in Table 5. It should be noted that a uniform distribution is used to distribute the battery capacity in each class.

The maximum charge and discharge rates of cars are 4 kWh, and the charge and discharge weight coefficients equal 60% of the peak market price. Some energy is normally lost in charging and discharging car batteries, so the efficiency of charging and discharging cars is considered 90% and 95%.
Also, to prevent premature aging of car batteries, discharging the battery up to 15% is allowed, and the number of permitted switching times is considered according to Table 6. It should be noted that their battery age is randomly selected for the studied vehicles.

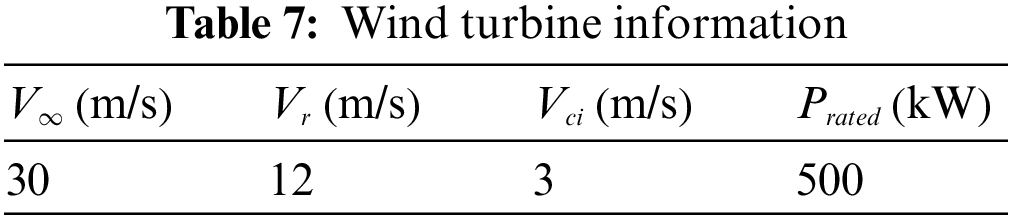
This study assumes that all the wind turbines installed in the network are of the same model and their specifications are in accordance with Table 7.
Also, photovoltaic systems with the power of 100 kW (10 panels of 10 kW) are installed at the network level, the specifications of which are given in Table 8. All the studies assume that the photovoltaic system and wind turbines are operated at a single power factor.

The planning results performed in both stages of the proposed planning are shown in Figs. 4 and 5. The results show that most cars are charged during low-load network hours (1–7 am) because the electricity market price is low during these hours. Also, unloading vehicles during peak network hours reduces the peak load of the network and provides the technical constraints of the network. According to Figs. 4 and 5, the highest cost paid to cars to participate in peak hours is the highest cost.
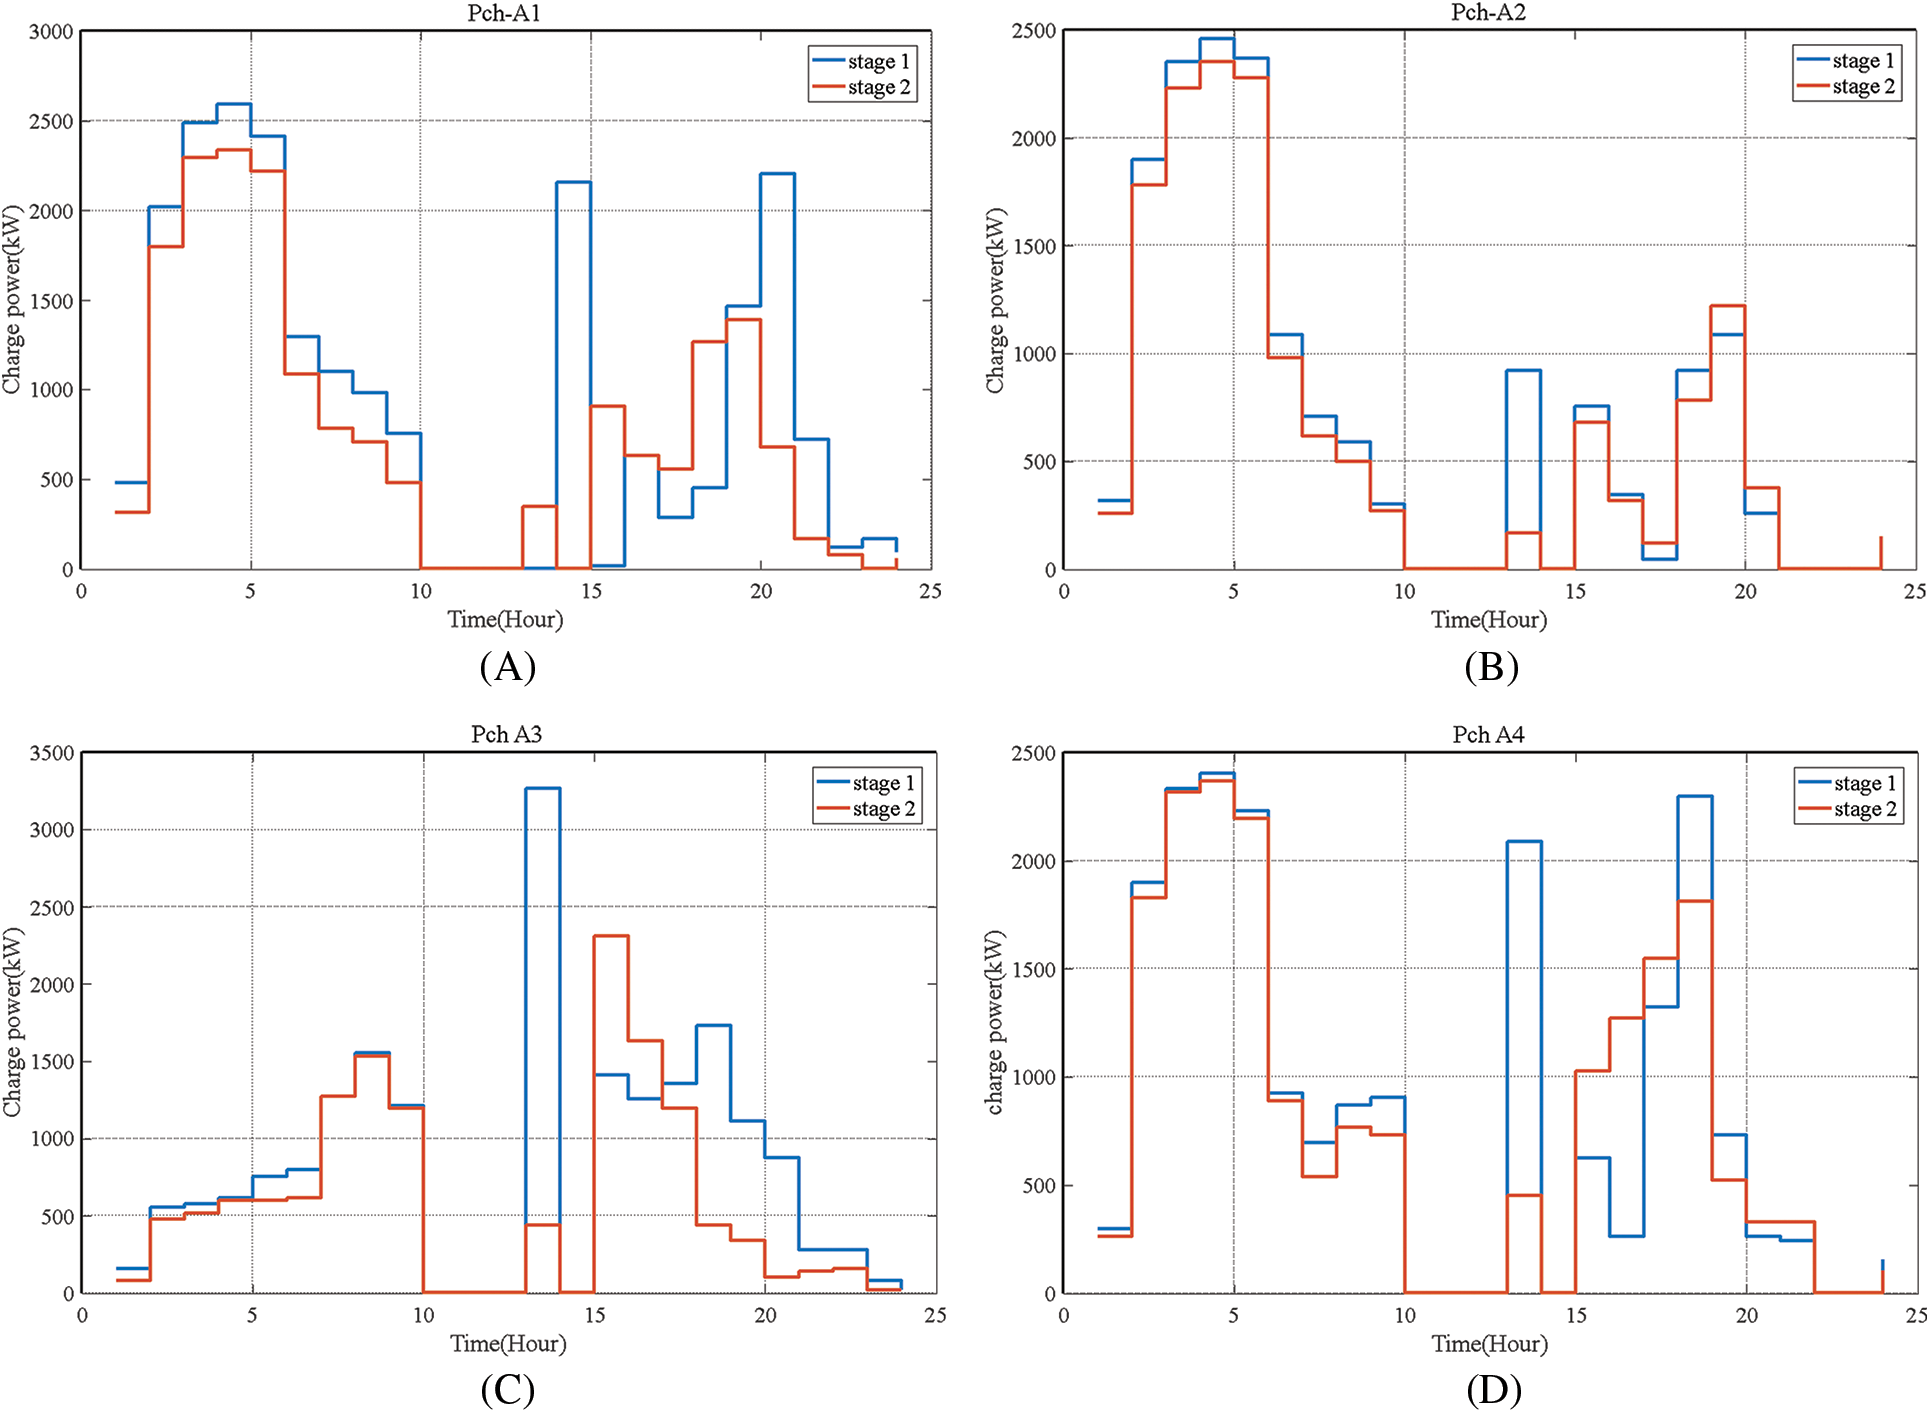
Figure 4: Charging profiles of electric vehicles in different areas after applying the proposed two-stage method
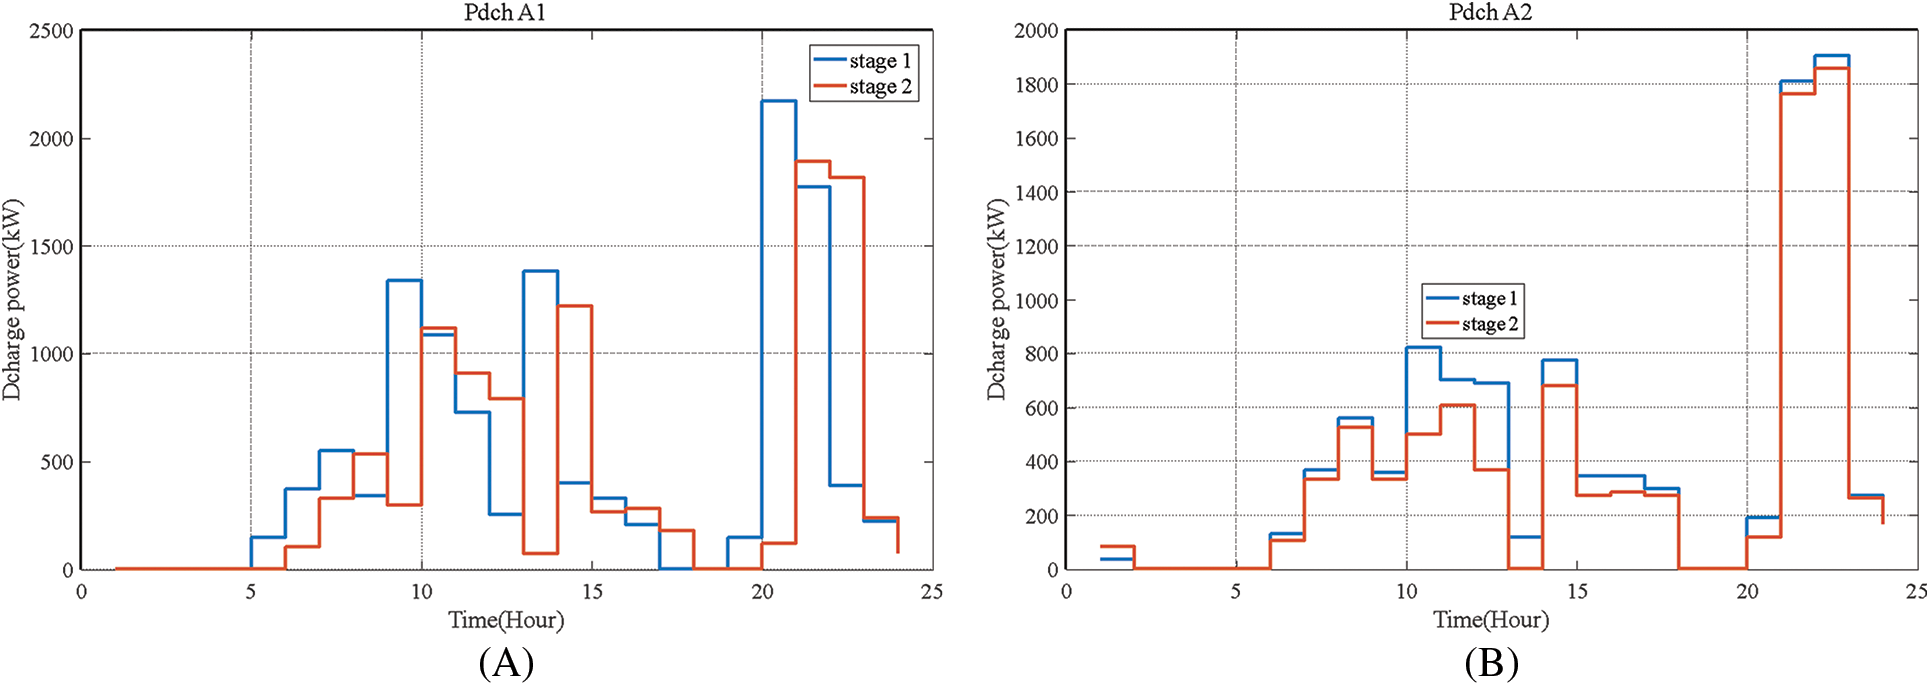
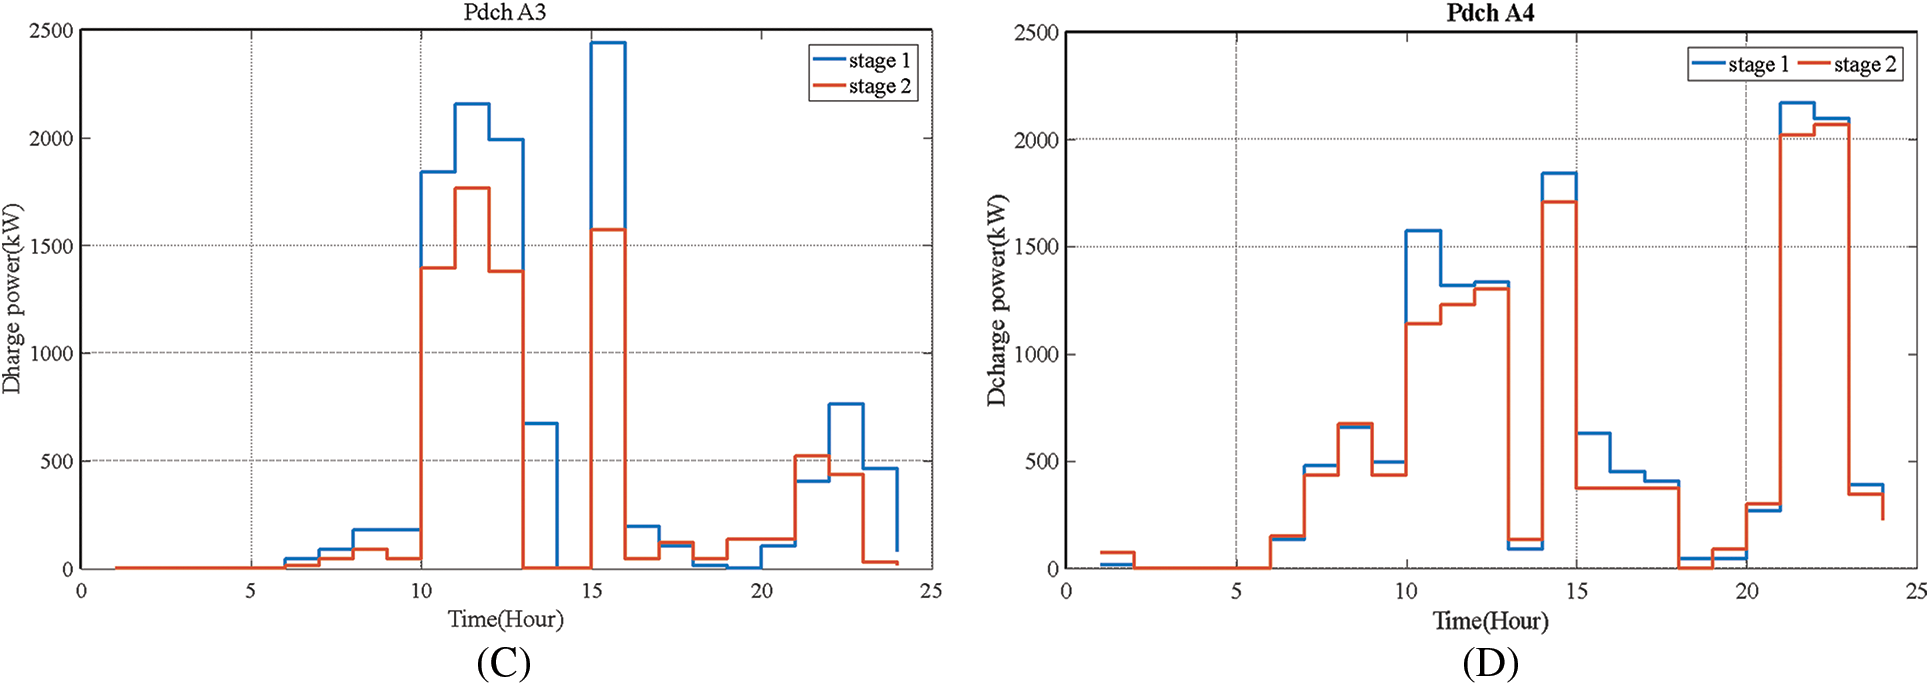
Figure 5: Discharge profile of electric vehicles in different areas after applying the proposed two-stage method
Fig. 6 shows the planned power of non-renewable distributed generation sources for the two stages of the proposed algorithm. As is known, non-renewable resources produce their maximum power during the busy hours of the network due to the high price of the energy market. In the off-peak hours, due to the low cost of the electricity market, they produce their minimum power. The upstream network provides the available load.
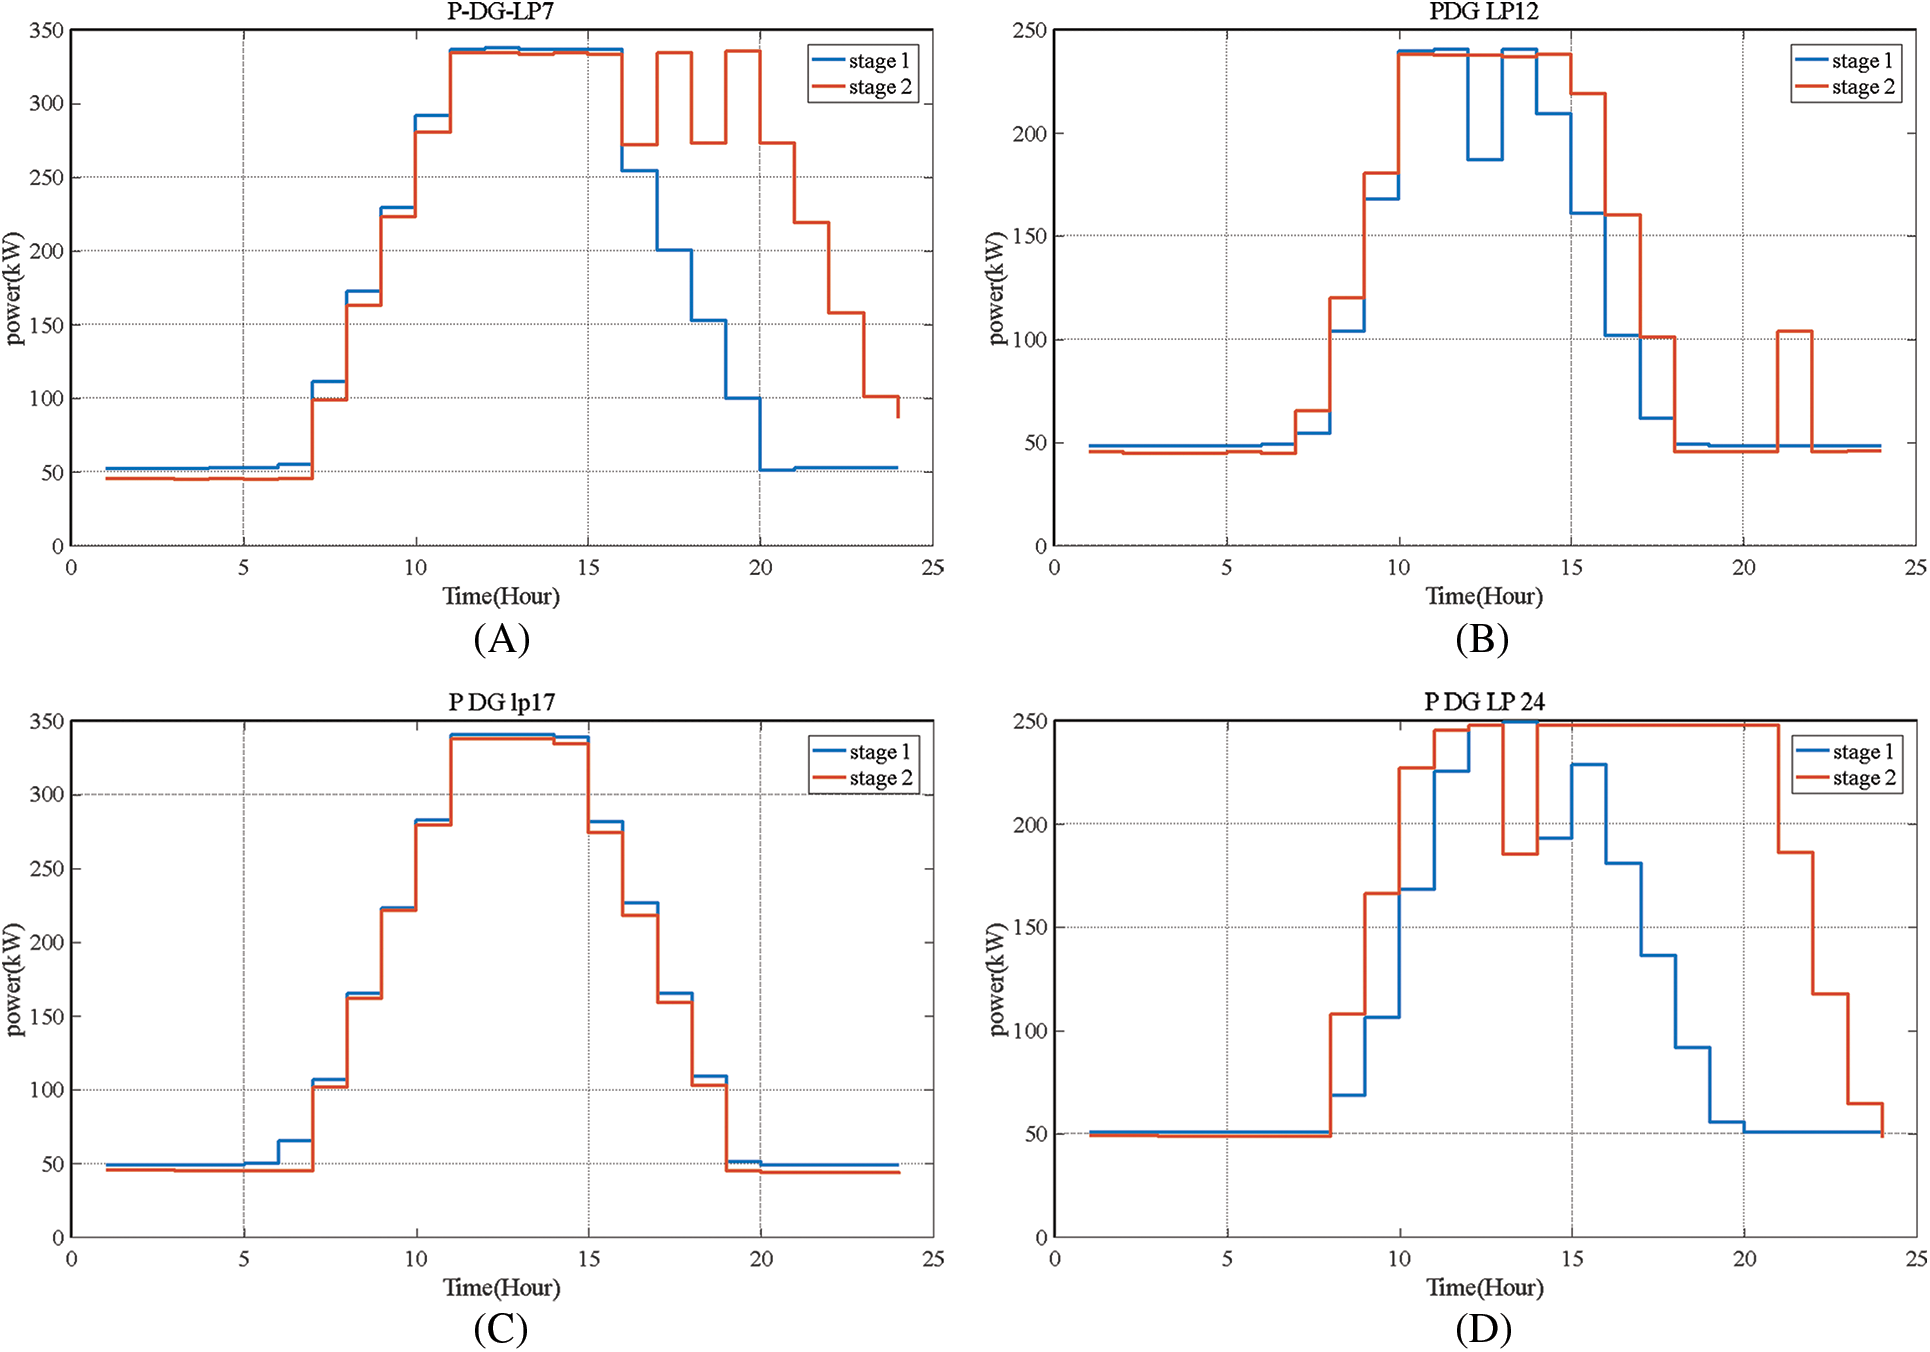
Figure 6: Production capacity of each of the non-renewable distributed generation sources (first stage-second stage)
Fig. 7 shows the network load profile for three different network operating conditions. As is known, the presence of electric vehicles as a new load changes the shape of the network load profile. The gray curve-cars increase the peak load of the network. Applying the proposed planning framework does not increase the amount of electrical load on the network during peak hours. In other words, the electricity supply-demand curve of the distribution network decreases during peak hours and increases during off-peak hours, which makes the network load profile curve more uniformly.
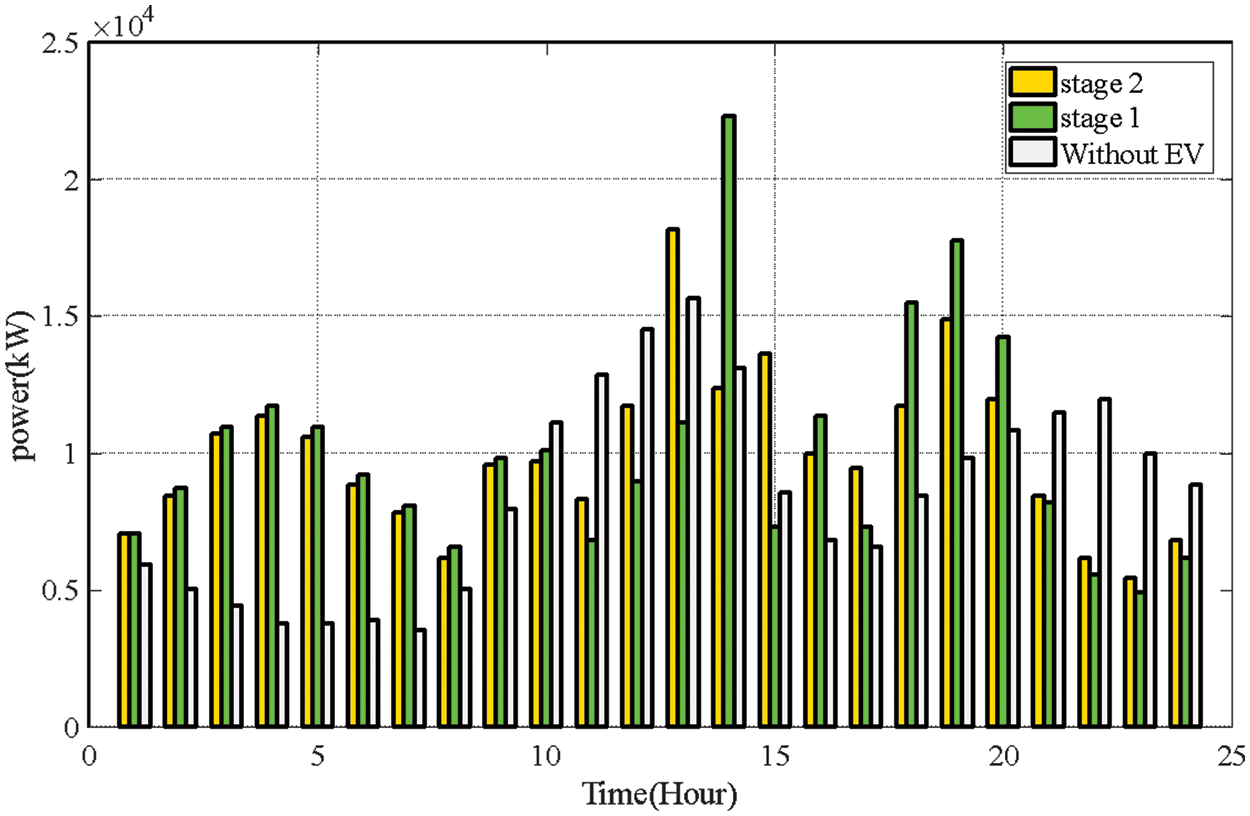
Figure 7: Network load profiles for three different operating conditions
To evaluate the efficiency of the proposed method, studies have been performed for the case that vehicles and distributed generation sources do not participate in the proposed design. According to the results, the existing network is not responsible for supplying the required load of vehicles.
Therefore, the costs related to one year of implementing the proposed plan are compared with the expenses related to the network strengthening plan. The network reinforcement plan is carried out so that studies related to the network reinforcement plan with the 35% penetration of vehicles for a 20-year horizon are conducted, and the relevant costs are obtained. Finally, for comparison, network reinforcement costs are equated to a 10% interest rate for one year. Table 9 shows the costs incurred after implementing the two projects. As is clear, the increase in network strengthening costs is more than the increase in the implementation costs of the proposed plan.

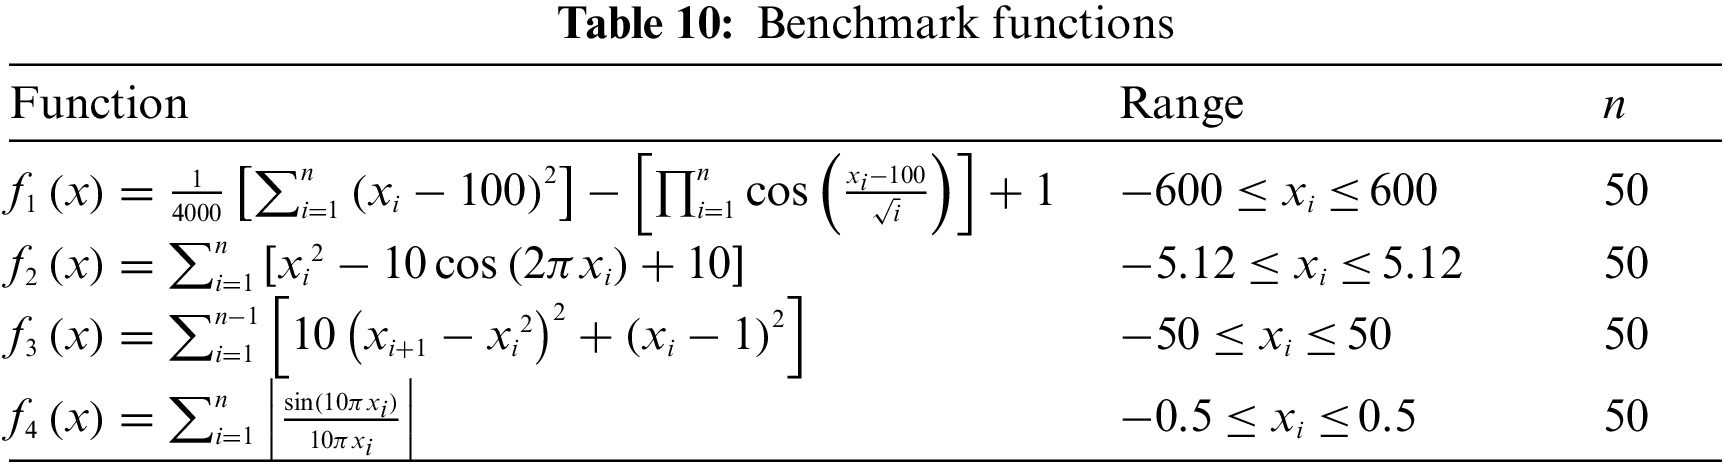
Additionally, to show the efficiency of the proposed method, an additional comparison is added in this part to compare the efficiency of the proposed optimization algorithm. For this purpose, the suggested algorithm is compared with other metaheuristic methods, i.e., artificial bee colony (ABC), honey bee mating optimization (HBMO), improved honey bee mating optimization (IHBMO), and particle swarm optimization (PSO). The considered benchmark functions are presented in Table 10 with the related range [34]. Also, the obtained results of these benchmarks are presented in Table 11. As shown here, the proposed optimization algorithm could outperform other algorithms, which proves the superiority of the proposed approach. In this table, the standard deviations (SD) and mean value of the optimization process has been indicated, while the proposed algorithm provides better results than all compared methods [34].

Advances in technology and the global trend toward renewable energy have introduced distributed generation units in the distribution network as one of the sources of energy supply. Despite the complexity of protection and operation of distributed generation resources in the distribution network, factors such as improving the reliability, increasing the production capacity of the distribution network, stabilizing the voltage of the distribution network, reducing peak clipping losses, as well as economic and environmental considerations have expanded the influence of distributed generation resources in the distribution network. The location of DG sources and their capacity are the main factors for the effectiveness of distributed generation in the voltage stability of distribution systems. Nowadays, in addition to distributed generation sources, electric vehicles with the ability to connect to the grid due to having an energy storage system are known as valuable resources that can provide various services to the power system.
This paper has centrally examined a two-stage planning framework for optimal electric vehicles and privately-owned distributed generation resources. The basic approach in this paper was the optimal charging/discharging planning of electric vehicles along with distributed generation sources to reduce operating costs by considering the demands of car owners and distributed generation sources. Finally, as shown by the results, using the proposed planning model, in addition to the high satisfaction of electric vehicles and distributed generation resources, can reduce operating costs and delay network reinforcement costs. In addition to distributed generation sources and electric vehicles, we added time-consistent load management to the studied system. Due to distributed generation sources such as photovoltaic systems and wind turbines and the studied system in the modeling, we employed the Taguchi TOAT algorithm to ensure the uncertainty in renewable energy and to generate and reduce the scenario. MATLAB software was used to solve the problem and select the optimal answer. Given that the presence of electric vehicles in the smart grid requires a charging station, in future work, we want to examine the impact of fast and conventional charging stations in power system planning. Also, these sources can supply part of their power from local sources providing the presence of hydrogen systems.
Funding Statement: The authors received no specific funding for this study.
Conflicts of Interest: The authors declare that they have no conflicts of interest to report regarding the present study.
References
1. Zou, Y., Zhao, J., Ding, D., Miao, F., Sobhani, B. (2021). Solving dynamic economic and emission dispatch in power system integrated electric vehicle and wind turbine using multi-objective virus colony search algorithm. Sustainable Cities and Society, 67, 102722. DOI 10.1016/j.scs.2021.102722. [Google Scholar] [CrossRef]
2. Abedinia, O., Lotfi, M., Bagheri, M., Sobhani, B., Shafie-Khah, M. et al. (2020). Improved EMD-based complex prediction model for wind power forecasting. IEEE Transactions on Sustainable Energy, 11(4), 2790–2802 DOI 10.1109/TSTE.5165391. [Google Scholar] [CrossRef]
3. Nurmanova, V., Bagheri, M., Abedinia, O., Sobhani, B., Ghadimi, N. et al. (2018). A synthetic forecast engine for wind power prediction. 2018 7th International Conference on Renewable Energy Research and Applications (ICRERA), pp. 732–737. Paris, France. DOI 10.1109/ICRERA.2018.8567010. [Google Scholar] [CrossRef]
4. Abedinia, O., Ghasemi-Marzbali, A., Nurmanova, V., Bagheri, M. (2021). Optimal strategy for bidding in deregulated-structure of electricity market: A competitive model. 2021 IEEE International Conference on Environment and Electrical Engineering and 2021 IEEE Industrial and Commercial Power Systems Europe (EEEIC/I&CPS Europe), pp. 1–5. Bari, Italy. DOI 10.1109/EEEIC/ICPSEurope51590.2021.9584511. [Google Scholar] [CrossRef]
Biswas, M. M., Akhter, S. R., Paul, K. C. (2020). Power quality analysis for distributed generation and electric vehicle integrated distribution system. 2020 55th International Universities Power Engineering Conference (UPEC), pp. 1–6. Turin, Italy. DOI 10.1109/UPEC49904.2020.9209796. [Google Scholar] [CrossRef]
6. Abedinia, O., Lu, M., Bagheri, M. (2019). An improved multicriteria optimization method for solving the electric vehicles planning issue in smart grids via green energy sources. IEEE Access, 8, 3465–3481. DOI 10.1109/Access.6287639. [Google Scholar] [CrossRef]
7. Barbeiro, P. P., Soares, F. J., Almeida, P. R., Gouveia, C. S., Ribeiro, M. L. et al. (2011). Evaluating the impacts of electric vehicles and micro-generation in distribution networks. 3nd European Conference on Smart Grids and E-Mobility. [Google Scholar]
8. White, C. D., Zhang, K. M. (2011). Using vehicle-to-grid technology for frequency regulation and peak-load reduction. Journal of Power Sources, 196(8), 3972–3980. DOI 10.1016/j.jpowsour.2010.11.010. [Google Scholar] [CrossRef]
9. Denholm, P., Short, W. (2006). Evaluation of utility system impacts and benefits of optimally dispatched plug-in hybrid electric vehicles (Revised) (No. NREL/TP−620–40293). National Renewable Energy Lab.(NREL), Golden, CO (USA). DOI 10.2172/888683. [Google Scholar] [CrossRef]
10. Scott, M. J., Kintner-Meyer, M. C., Elliott, D. B., Warwick, W. M. (2007). Economic assessment and impacts assessment of plug-in hybrid vehicles on electric utilities and regional US power grids (No. PNNL-SA-53523). Pacific Northwest National Lab.(PNNL), Richland, WA (USA). [Google Scholar]
11. Hadley, S., Tsvetkova, S. (2008). Potential impacts of PHEVs on regional power generation. The Electricity Journal, 22(10), 56–68. DOI 10.1016/j.tej.2009.10.011. [Google Scholar] [CrossRef]
12. Papadopoulos, P., Jenkins, N., Cipcigan, L. M., Grau, I., Zabala, E. (2013). Coordination of the charging of electric vehicles using a multi-agent system. IEEE Transactions on Smart Grid, 4(4), 1802–1809. DOI 10.1109/TSG.2013.2274391. [Google Scholar] [CrossRef]
13. Clement-Nyns, K., Haesen, E., Driesen, J. (2011). The impact of vehicle-to-grid on the distribution grid. Electric Power Systems Research, 81(1), 185–192. DOI 10.1016/j.epsr.2010.08.007. [Google Scholar] [CrossRef]
14. Masoum, A. S., Deilami, S., Abu-Siada, A., Masoum, M. A. (2014). Fuzzy approach for online coordination of plug-in electric vehicle charging in smart grid. IEEE Transactions on Sustainable Energy, 6(3), 1112–1121. DOI 10.1109/TSTE.2014.2327640. [Google Scholar] [CrossRef]
15. Kintner-Meyer, M., Schneider, K., Pratt, R. (2007). Impacts assessment of plug-in hybrid vehicles on electric utilities and regional US power grids. Part 1: Technical analysis. Pacific Northwest National Laboratory, 1, 1–20. [Google Scholar]
16. Falahati, B., Fu, Y., Darabi, Z., Wu, L. (2011). Reliability assessment of power systems considering the large-scale PHEV integration. 2011 IEEE Vehicle Power and Propulsion Conference, pp. 1–6. Chicago, IL, USA. DOI 10.1109/VPPC.2011.6043042. [Google Scholar] [CrossRef]
17. Wood, A. J., Wollenberg, B. F. (1996). Power generation operation and control. New York: John Wiley & Sons. Inc. [Google Scholar]
18. Saber, A. Y., Venayagamoorthy, G. K. (2009). Unit commitment with vehicle-to-grid using particle swarm optimization. 2009 IEEE Bucharest PowerTech, pp. 1–8. IEEE. DOI 10.1109/PTC.2009.5282201. [Google Scholar] [CrossRef]
19. Keyhani, A., Marwali, M. (2012). Errata to: Smart power grids 2011. In: Smart power grids 2011, pp. E1–E18. Springer, Berlin, Heidelberg. DOI 10.1007/978-3-642-21578-0. [Google Scholar] [CrossRef]
20. Nafisi, H., Askarian Abyaneh, H., Abedi, M. (2016). Energy loss minimization using PHEVs as distributed active and reactive power resources: A convex quadratic local optimal solution. International Transactions on Electrical Energy Systems, 26(6), 1287–1302. DOI 10.1002/etep.2134. [Google Scholar] [CrossRef]
21. Nafisi, H., Agah, S. M. M., Abyaneh, H. A., Abedi, M. (2015). Two-stage optimization method for energy loss minimization in microgrid based on smart power management scheme of PHEVs. IEEE Transactions on Smart Grid, 7(3), 1268–1276. DOI 10.1109/TSG.2015.2480999. [Google Scholar] [CrossRef]
22. Shafiee, M., Ghazi, R., Aghtaie, M. M. (2019). Optimal utilization of electric vehicles and DG resources in smart distribution system. Tabriz Journal of Electrical Engineering, 49(1), 281–294. [Google Scholar]
23. Lotfi, M., Almeida, T., Javadi, M. S., Osório, G. J., Monteiro, C. et al. (2022). Coordinating energy management systems in smart cities with electric vehicles. Applied Energy, 307, 118241. DOI 10.1016/j.apenergy.2021.118241. [Google Scholar] [CrossRef]
24. Soares, J., Almeida, J., Gomes, L., Canizes, B., Vale, Z. et al. (2022). Electric vehicles local flexibility strategies for congestion relief on distribution networks. Energy Reports, 8, 62–69. DOI 10.1016/j.egyr.2022.01.036. [Google Scholar] [CrossRef]
25. Azimi, Z., Hooshmand, R. A., Soleymani, S. (2021). Energy management considering simultaneous presence of demand responses and electric vehicles in smart industrial grids. Sustainable Energy Technologies and Assessments, 45, 101127. DOI 10.1016/j.seta.2021.101127. [Google Scholar] [CrossRef]
26. Wu, Y., Wang, Z., Huangfu, Y., Ravey, A., Chrenko, D. et al. (2022). Hierarchical operation of electric vehicle charging station in smart grid integration applications—An overview. International Journal of Electrical Power & Energy Systems, 139, 108005. DOI 10.1016/j.ijepes.2022.108005. [Google Scholar] [CrossRef]
27. Karna, S. K., Sahai, R. (2012). An overview on taguchi method. International Journal of Engineering and Mathematical Sciences, 1(1), 1–7. [Google Scholar]
28. Atkinson, A. C., Donev, A. N., Tobias, R. D. (2007). Optimum experimental designs, with SAS, vol. 34. Oxford University Press, Oxford. [Google Scholar]
29. Byrne, D., Taguchi, S. (1987). Taguchi approach to parameter design. Quality Progress, 20, 19–26. [Google Scholar]
30. Tsao, Y. C., Thanh, V. V., Wu, Q. (2021). Sustainable microgrid design considering blockchain technology for real-time price-based demand response programs. International Journal of Electrical Power & Energy Systems, 125, 106418. DOI 10.1016/j.ijepes.2020.106418. [Google Scholar] [CrossRef]
31. Lee, K. S., Geem, Z. W. (2004). A new structural optimization method based on the harmony search algorithm. Computers & Structures, 82(9–10), 781–798. DOI 10.1016/j.compstruc.2004.01.002. [Google Scholar] [CrossRef]
32. Billinton, R., Jonnavithula, S. (1996). A test system for teaching overall power system reliability assessment. IEEE Transactions on Power Systems, 11(4), 1670–1676. DOI 10.1109/59.544626. [Google Scholar] [CrossRef]
33. Hadley, S. W., Tsvetkova, A. A. (2009). Potential impacts of plug-in hybrid electric vehicles on regional power generation. The Electricity Journal, 22(10), 56–68. DOI 10.1016/j.tej.2009.10.011. [Google Scholar] [CrossRef]
34. TSai, P. W., Pan, J. S., Liao, B. Y., Chu, S. C. (2009). Enhanced artificial bee colony optimization. International Journal of Innovative Computing. Information and Control, 5(12), 5081–5092. [Google Scholar]
Cite This Article
 Copyright © 2022 The Author(s). Published by Tech Science Press.
This work is licensed under a Creative Commons Attribution 4.0 International License , which permits unrestricted use, distribution, and reproduction in any medium, provided the original work is properly cited.
 Downloads
 Citation Tools