
 Submit a Paper
 Propose a Special lssue
 Open Access
ARTICLE
Optical Fibre Communication Feature Analysis and Small Sample Fault Diagnosis Based on VMD-FE and Fuzzy Clustering
1 Gannan Power Supply Company of State Grid Gansu Electric Power Supply Company, Hezuo, 747000, China
2 Digital Communication Department, Gannan Power Supply Company of State Grid Gansu Electric Power Supply Company, Hezuo, 747000, China
* Corresponding Author: Xiangqun Li. Email:
Energy Engineering 2024, 121(1), 203-219. https://doi.org/10.32604/ee.2023.029295
Received 11 February 2023; Accepted 06 April 2023; Issue published 27 December 2023
 View Full Text
 Download PDF
Abstract
To solve the problems of a few optical fibre line fault samples and the inefficiency of manual communication optical fibre fault diagnosis, this paper proposes a communication optical fibre fault diagnosis model based on variational modal decomposition (VMD), fuzzy entropy (FE) and fuzzy clustering (FC). Firstly, based on the OTDR curve data collected in the field, VMD is used to extract the different modal components (IMF) of the original signal and calculate the fuzzy entropy (FE) values of different components to characterize the subtle differences between them. The fuzzy entropy of each curve is used as the feature vector, which in turn constructs the communication optical fibre feature vector matrix, and the fuzzy clustering algorithm is used to achieve fault diagnosis of faulty optical fibre. The VMD-FE combination can extract subtle differences in features, and the fuzzy clustering algorithm does not require sample training. The experimental results show that the model in this paper has high accuracy and is relevant to the maintenance of communication optical fibre when compared with existing feature extraction models and traditional machine learning models.Keywords
Optical fibre communication has the characteristics of a wide transmission band, fine wire diameter, lightweight and low loss [1–3], which is the primary way of communication transmission. With the rapid development of optical fibre technology in the communications industry, the stable and efficient operation of optical fibre has become an essential guarantee for safe communications [4]. The fibre cable line is the main body of optical transmission, and the faults in the communication optical fibre have a great impact on the normal operation of the communication network. The timely diagnosis and location of optical fibre faults are a prerequisite for rapid repair.
In recent years, scholars at home and abroad have conducted some research on intelligent fault diagnosis methods of communication optical fibre and proposed many practical diagnosis algorithms [5–8], but these methods have certain limitations. Reference [5] used chaotic light to detect the breakpoint of the reference signal and the detection signal of the optical channel to obtain the fault location value, but this method is applicable to limited fault types. Reference [6] was based on data-driven to accurately and quickly detect, diagnose and locate optical fibre anomalies, but when the fault data is insufficient, the diagnosis effect is not ideal. Reference [7] proposed a method to detect optical fibre faults using a multi-level split light method, which can detect optical fibre faults distributed in multiple optical fibre channels, however, this method cannot distinguish micro-differential faults and diagnose them as similar ones. To address these limitations, optical time domain reflectometry (OTDR) has been applied to diagnose faults in optical fibre. OTDR is a non-destructive photoelectric integrated measuring instrument widely used in the construction, maintenance, and fault diagnosis of communication optical fibre [8–12]. References [13,14] analyzed the relationship between power and distance in the OTDR curve to determine various faults in optical fibre circuits and their accurate location. References [15,16] discussed applying wavelet analysis to ODTR analysis. Experimental results demonstrated that the performance of OTDR was significantly improved under strong noise, but the model analysis was insufficient, and the algorithm was too complex. The above methods are suitable for optical fibre fault diagnosis through simple analysis of the OTDR curve. In fact, some OTDR state curves are slightly different. Due to insufficient feature extraction, the methods mentioned above cannot distinguish these subtle differences, and the fault diagnosis accuracy is low.
To realize the fault diagnosis of communication optical fibre, extracting the characteristics of the OTDR curve is the primary problem. As for the feature extraction method, Reference [17] proposed a signal modal recognition algorithm based on the BP neural network, which extracted the variance, Fourier transform, disturbance time, and other characteristics of the fault curve and applied the fault data for training to achieve fault recognition. However, BP neural network training requires a large amount of data, the convergence speed is slow, and the accuracy is not high. References [18,19] proposed a feature extraction and recognition algorithm based on LMD decomposition, which has adaptive characteristics and can effectively identify different optical fibre fault types. But in the signal decomposition process, the signal noise reduction effect is easily reduced, and the effective components of the signal are lost due to the modal blending and singular value selection.
To solve the above problems, a method combining variational modal decomposition (VMD) and fuzzy entropy (FE) is used to extract the characteristic information of non-stationary signals. Modal decomposition using VMD can extract the corresponding frequency band more accurately than traditional modal decomposition methods (including DWT and WPT) [20]. At the same time, fuzzy entropy can also identify the subtle features of the signal, so that the subtle features of multiple dimensions of the original signal can be obtained as the characteristic parameters under various optical fibre faults. After fault feature extraction, fault classification needs to be carried out according to the feature. A support vector machine (SVM) based faulty optical fibre fault diagnosis method was proposed in the reference [21] to solve the optical fibre fault feature classification problem, but it requires training on a large number of data samples. However, OTDR fault data is small, which can not meet the requirements of SVM diagnosis. The fuzzy clustering algorithm uses different confidence factors to construct a dynamic clustering map, thus intuitively representing the fault classification. As it does not require training, it is mostly used for real-time evaluation and analysis. This paper, therefore, uses a fuzzy clustering algorithm to classify the fault states without the need for training on the feature vector matrix.
Through the above analysis, this paper proposes a communication optical fibre fault diagnosis model based on VMD-FE feature extraction and fuzzy clustering algorithm based on OTDR measurement data. First, the optical fibre is detected using OTDR, and the VMD and fuzzy entropy calculation are performed on the optical fibre OTDR curve to obtain the feature vector; then, the fuzzy clustering algorithm is used to select the feature vectors of the optical fibre in different states to construct a fuzzy matrix, and the fuzzy equivalence matrix is calculated using the transfer closure method to generate a dynamic clustering map with the change of the confidence factor (
2 Optical Fibre Communication and OTDR Technology
2.1 Optical Fibre Communication
Total reflection is the basis of optical fibre communication, that is when light is injected from one medium into another medium, the optical line will reflect and refract. The so-called optical fibre communication is to transmit the light wave with information through optical fibre, so that the light wave can reach the destination, and then the information can be transmitted through total reflection. Fig. 1 shows the schematic diagram of optical fibre propagation.
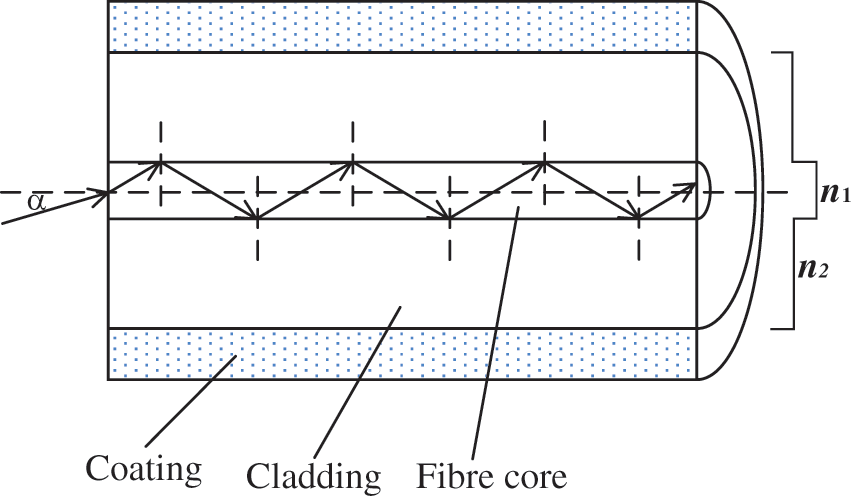
Figure 1: Schematic diagram of optical fibre propagation
When the incident light is incident into the optical fibre at an angle
where n1 and n2 are the refractive index of the fibre core propagation medium and the refractive index of the cladding material. When the incident angle of light
In recent years, optical fibre communication has developed rapidly due to its characteristics of large bandwidth and low communication loss, but it has also been decided that optical fibre communication will be the focus of communication line maintenance. Optical fibre is made of brittle glass susceptible to environmental influences affecting its transmission performance. As optical fibre communication networks become more complex, the number of faults in optical fibre is increasing yearly. Relying on manual fault diagnosis for communication optical fibre no longer meets the current requirements for smooth communication.
OTDR, an optical time domain reflectometer, is a precision optoelectronic integrated instrument. The principle of operation is similar to that of radar: the OTDR injects the laser pulse used for testing into the tested optical fibre at a suitable angle, and then the OTDR captures the backscattered signal of the pulse at the transmitting end of the pulse. As the pulse propagates in the optical fibre, it is reflected and scattered due to the inherent nature of the optical fibre itself, or when it encounters optical fibre connectors, fusion joints, excessive bending or other event points, and this information will be captured by OTDR.
2.3 Optical Fibre OTDR Curve Analysis
2.3.1 Optical Fibre OTDR Curve in Normal State
As shown in Fig. 2, f0 is the curve obtained using the OTDR instrument to test the optical fibre line under normal conditions. Set the two cursors as A and B, where cursor A is set at the back edge of the first Fresnel reflection, and cursor B is set at the front edge of the second Fresnel reflection. Cursor A is the start of the optical fibre line under test, and the part before cursor A is the test blind zone of the OTDR instrument. After cursor A, the normal recording of the optical fibre line test data starts, and cursor B is the end of the optical fibre line under test. The distance between cursors A and B is the length of the line under test.
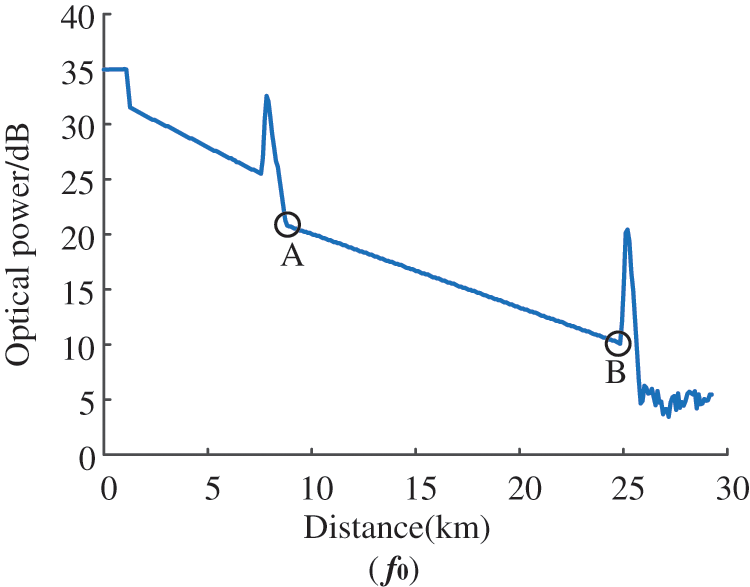
Figure 2: Optical fibre OTDR curve in normal state
2.3.2 Optical Fibre OTDR Curve in Fault State
According to the field results, Fig. 3 shows the OTDR curves obtained when the optical fibre is in some typical fault states.
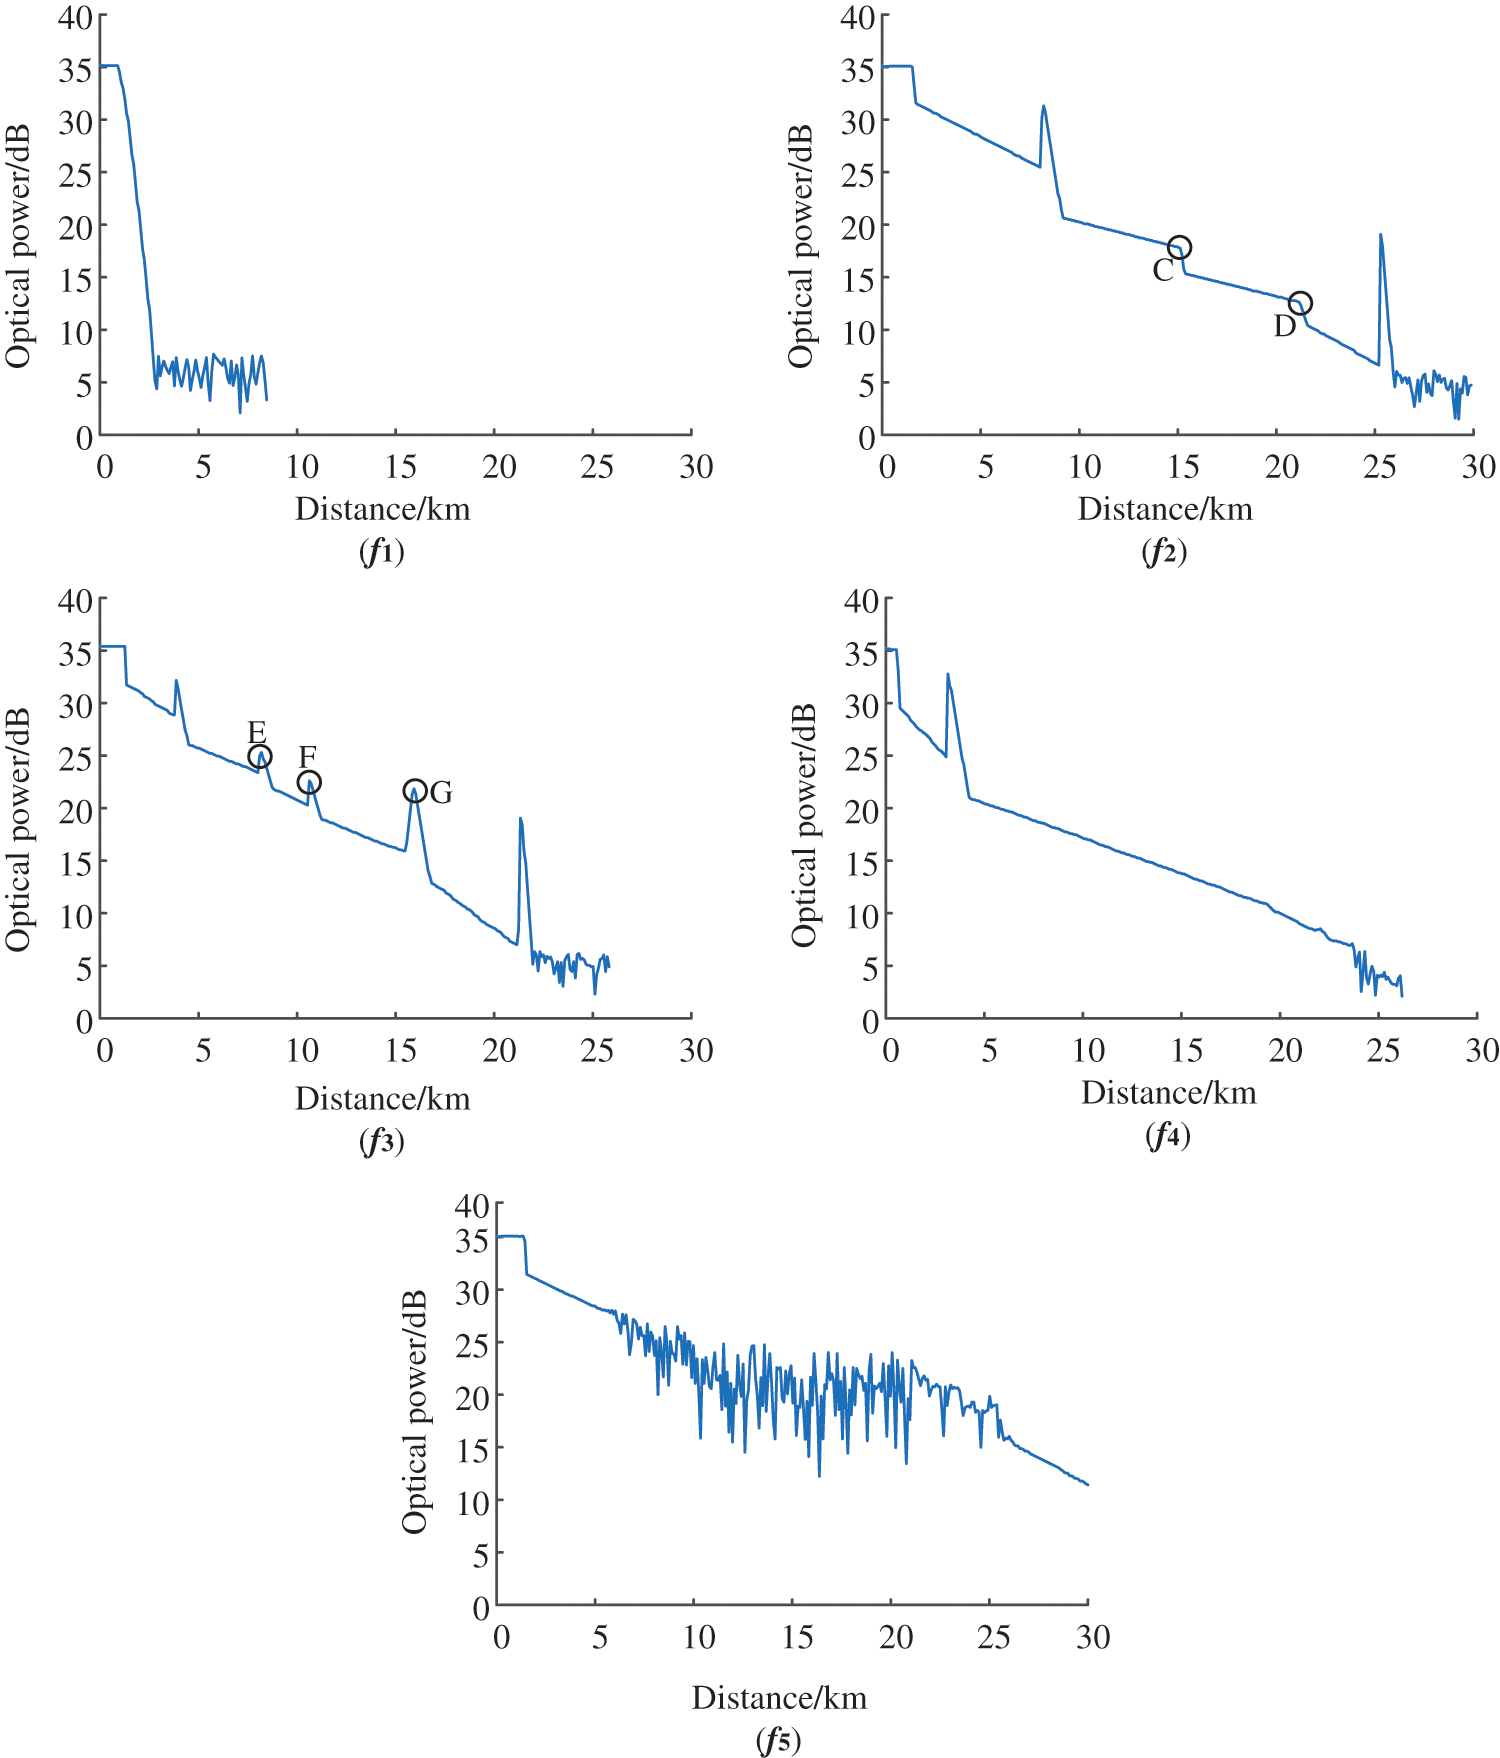
Figure 3: Optical fibre OTDR curves in fault state
The curve f1 is initially with signal, then suddenly drop to disappear. OTDR should be able to emit light source normally, otherwise the curve will not have signal initially, but the subsequent signal suddenly disappears. The fibre maybe is broken. First, check whether the fibre is under test and whether it is connected properly; next, check whether the fibre connectors are the same type and cleaned. After checking, if the test signal is still in an abnormal state, it indicates a break in the fibre, and if the break is too close to the test point, it means the OTDR cannot be recognized.
The optical power value of point C in curve f2 shows a step decrease, and the slope of the curve at both ends is basically the same, which should be the optical power decrease due to fibre line transmission loss, and can be judged as a normal fibre fusion point. The optical power value at point D shows a slope decline, and the slope of the curve at both ends is different, and the slope of the curve at the back section is obviously larger than that at the front section, which can be judged as an abnormal optical power decrease at point D. The reason should be the optical fibre construction process or maintenance process due to improper construction of the fibre bending angle which resulted in the bending loss.
In curve f3, there is a high Fresnel peak at the end of the curve, but the slope of the curve is different at both ends. It can be judged that points E and F are active connectors, which is a normal event in OTDR fibre testing. Since the peak Fresnel reflection at point G is significantly higher than that at points E and F, and the slope of the latter section is significantly larger than that of the former section, it can be judged that point G is a fibre breakpoint.
The initial end of curve f4 is normal, but the end of the curve does not have the Fresnel reflection peak phenomenon. We can determine the initial end of the fibre but can not determine the end of the fibre, and we can not confirm the fibre length and loss. First, check the end of the fibre to determine whether the end surface is dirty and the OTDR can not detect the reflected light signal. Then clean the end face of the fibre and retest. If the fault still exists, the end face of the fibre may be of poor quality.
Curve f5 before and after the curve is smooth and normal, the middle part of the curve appears with irregular changes, and the entire fibre line optical attenuation indicators are basically normal. First of all, the parts are cleaned and retested to check whether the cause is fibre cleaning. Also adjust the wavelength setting to see if the fibre attenuation slope is back to normal. After excluding the above factors, it is confirmed that the cause of the failure of the fibre bending radius is too small.
In the optical fibre monitoring system, OTDR is used to test the optical fibre, and analyse the curves to locate the location of fault points, splice losses and fibre lengths. However, the event point cannot be determined automatically, and the curves need to be analysed, after which the type of various events in the optical fibre line can be accurately determined.
3 Fault Diagnosis Model of Communication Optical Fibre
3.1 Variational Modal Decomposition
VMD (variational modal decomposition) is an adaptive signal decomposition method proposed by Dragomiretskiy et al. in 2014 [22]. The original signal sequence is decomposed into several “intrinsic modal function” by iteratively searching for the optimal solution of the modal under constraints, thus to determine the modal components’ central frequency and finite bandwidth. The algorithm consists of two main steps.
3.1.1 Construct Variational Constraint Problem
Assume that VMD decomposes the original signal f(t) to obtain K modal components, it is necessary to minimise the sum of the finite bandwidths of each modal component while ensuring that all modal components uk(t) are added up to f(t).
For each modal component uk(t), its one-sided spectrum is obtained by Hilbert transform and converted to the fundamental band by an estimated central frequency
The finite bandwidth of the modal component uk(t) is estimated by squaring the norm of the gradient of the fundamental band above. The expression for the variational constraint problem is:
3.1.2 Solve Variational Constraint Problems
Introduct the Lagrangian operator λ(t) and the quadratic penalty factor α, the constrained problem is transformed into an unconstrained problem, and the expression becomes:
Update and iterating
The fuzzy entropy (FE) reflects the slight variations between modal components (IMF) and thus characterises the subtle differences between different OTDR curves. For a certain IMF sequence
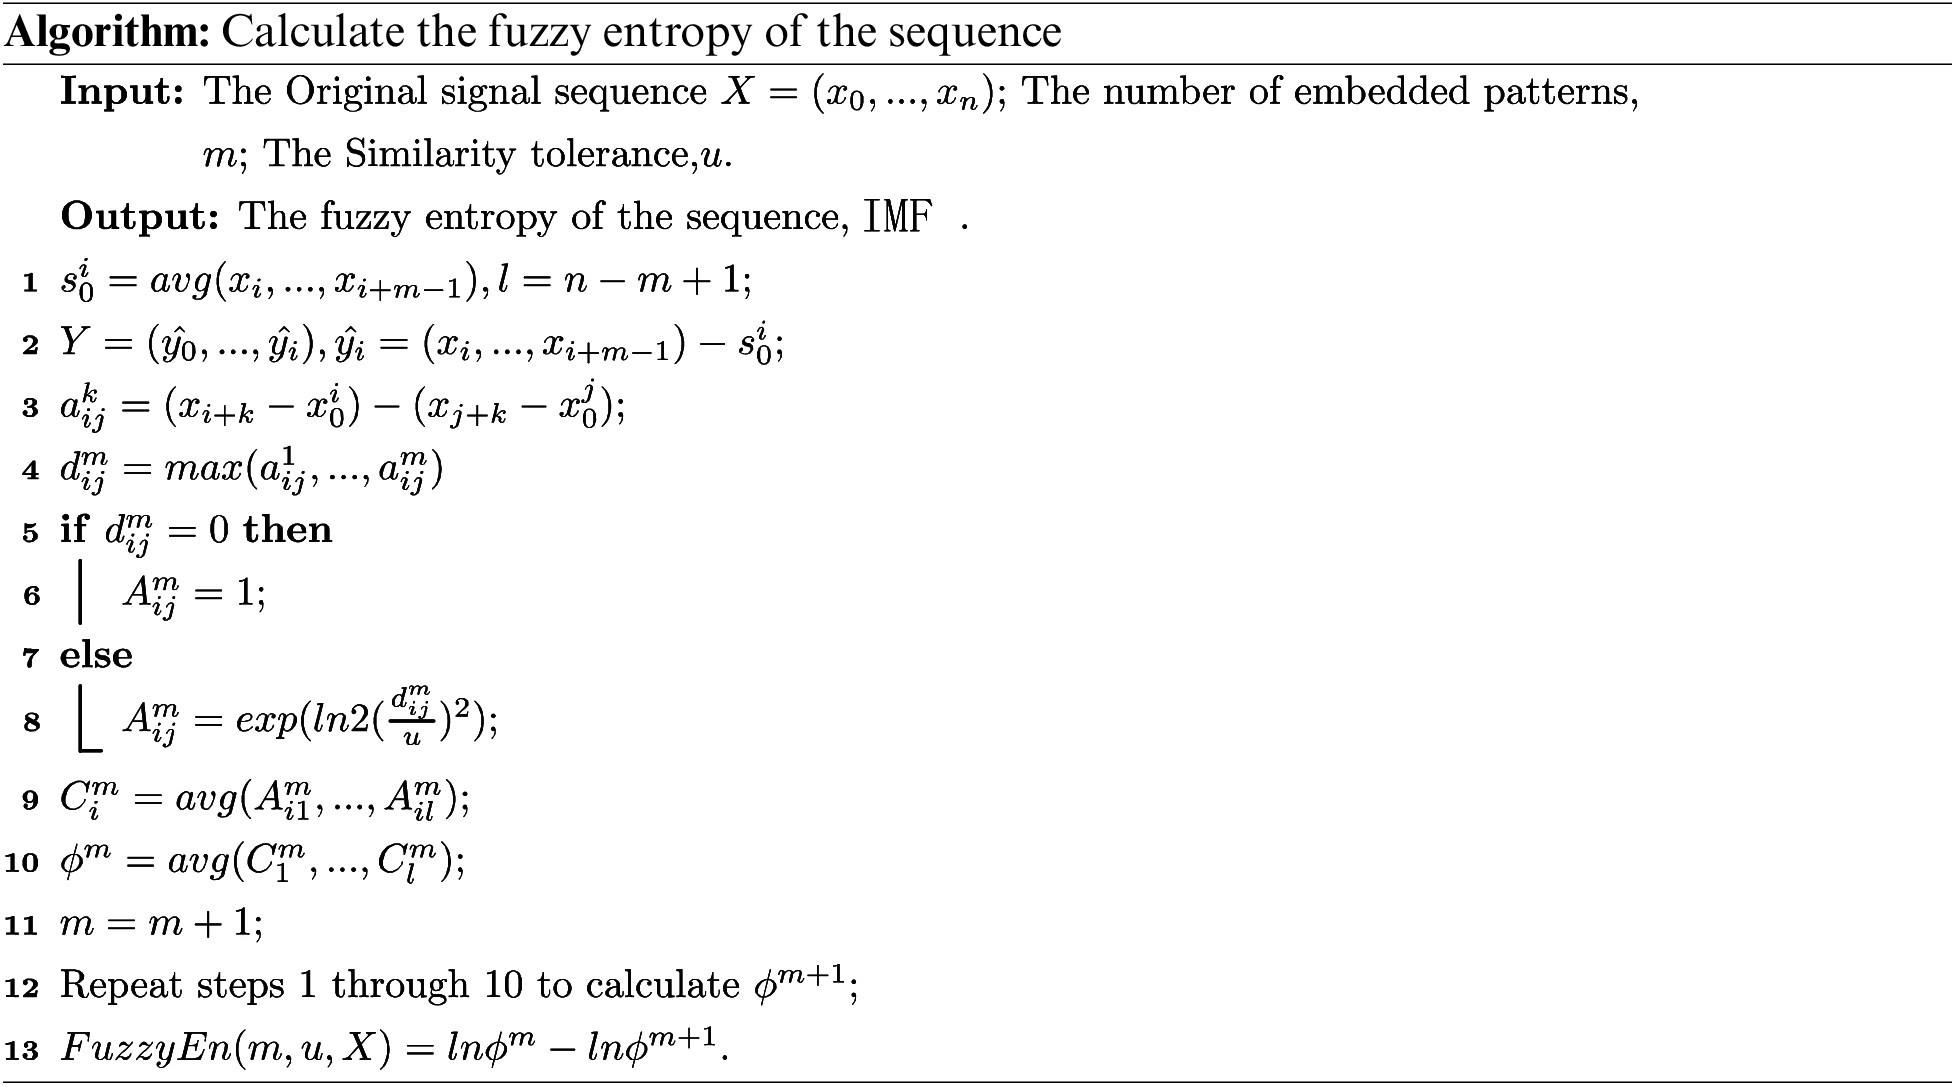
Through the above steps, the fuzzy entropy values of different IMF components of optical fibre OTDR signals are extracted, and the arranged entropy sequences are taken as the feature vectors of optical fibre signals and as the inputs of the subsequent clustering algorithm.
3.3 Fuzzy Clustering Algorithm
Fuzzy clustering (FC) is a division-based clustering idea that takes a series of samples of an unknown class and divides them into subsets according to rules that maximise the similarity of objects in the same cluster and minimise the similarity between different clusters. The main steps of the algorithm implementation are as follows:
3.3.1 Build the Fuzzy Matrix X
Denote
Maximum value specification for X
3.3.2 Establish the Fuzzy Similarity Matrix R
By using a similarity coefficient to measure the similarity between samples, the fuzzy similarity matrix
3.3.3 Establish the Fuzzy Equivalence Matrix
The matrix obtained in Eq. (9) is not transitive. The transitive closure method is used to calculate the fuzzy equivalence matrix from the matrix R. Compute
3.3.4 Generate the Dynamic Clustering Map
Calculate the
Select each column element of behavior 1 in the Boolean matrix, and its corresponding samples should be clustered into a class. Clustering results will be different when
4 Fault Diagnosis Model of Communication Optical Fibre
Communication optical fibre has been widely used in various industries today, and fault diagnosis of communication optical fibre can effectively improve manual maintenance. In this paper, we propose a fuzzy entropy algorithm based on variational modal decomposition to extract the features of the optical fibre OTDR curves, and then use fuzzy clustering to diagnose its state. The flows of the algorithm are shown in Fig. 4.
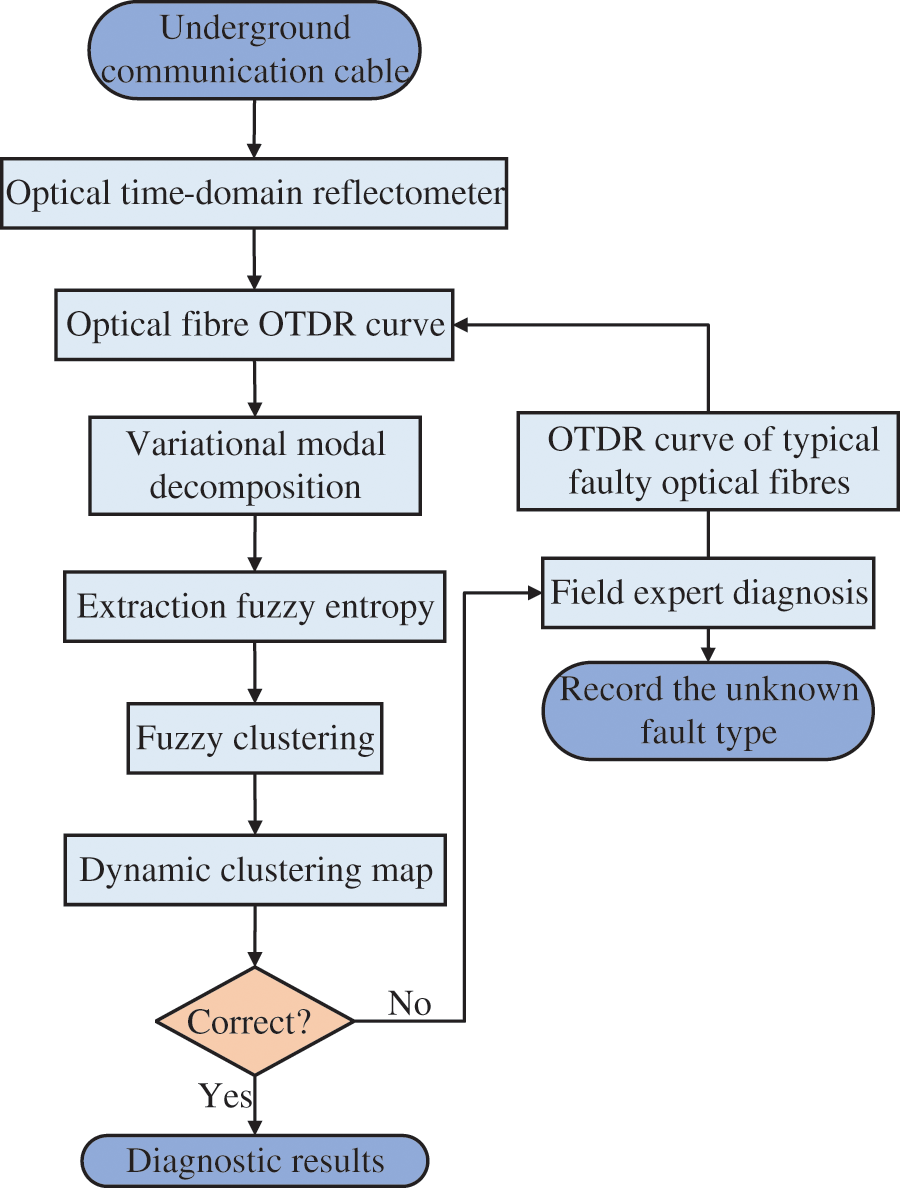
Figure 4: Flow chart of communication optical fibre fault diagnosis
The selection of wavelength is very important in the OTDR curve test. The signal wavelength in optical fibre communication is 1310 or 1550 nm. According to the theory of Rayleigh scattering, the power of Rayleigh scattering is related to the wavelength of the transmitted laser signal. The power is weaker if the wavelength is longer, and vice versa. The backscattering power of the 1550 nm laser signal is weaker than that of the 1310 nm signal. Rayleigh scattering will be reduced at a high wavelength, but infrared attenuation will occur at a high wavelength, which will lead to an increase in the attenuation value of the whole fibre. Therefore, 1550 nm is the lowest attenuation wavelength, so 1550 nm was selected as the test signal wavelength. In Fig. 5, the field staff is collecting optical fibre OTDR data.
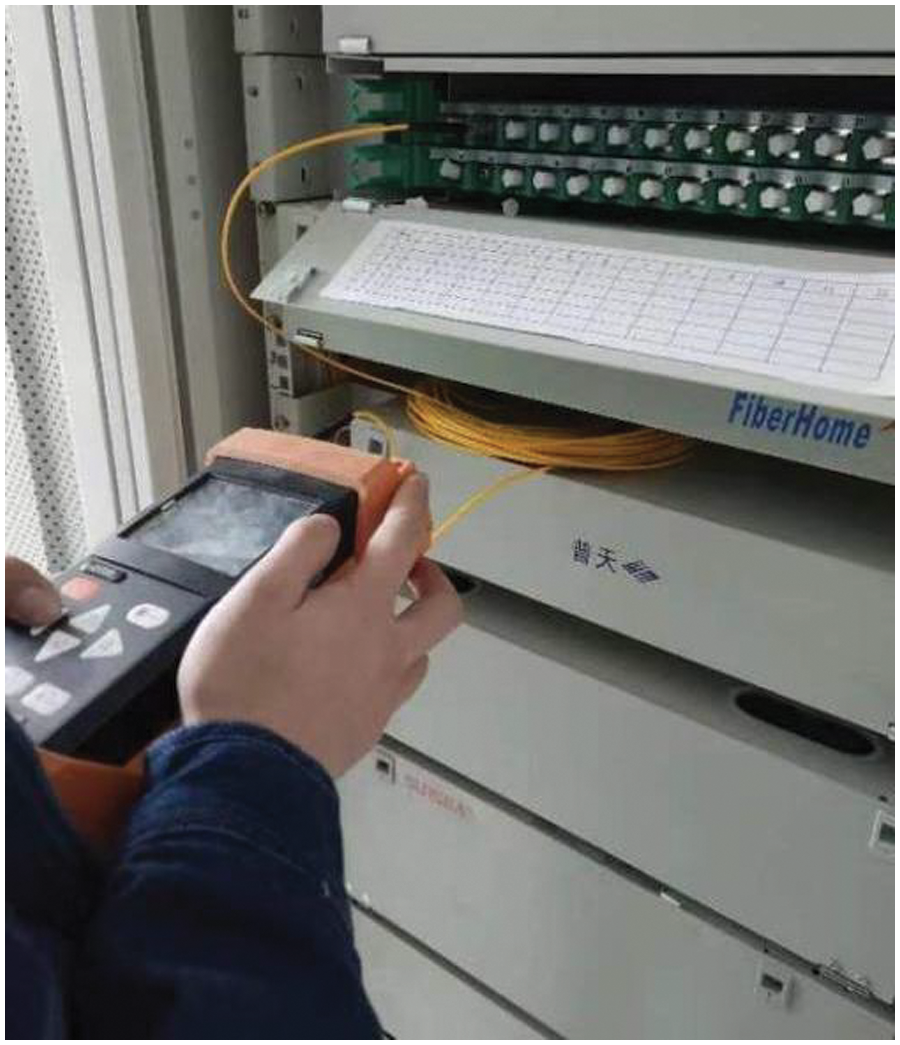
Figure 5: Optical fibre OTDR curve acquisition
Perform VMD on the collected data samples, where the decomposition level K is set to 5, the penalty factor α is set to 2000, and the rest are the default values. The 5 IMF components are obtained by VMD, then the fuzzy entropy algorithm is used to extract the FE of each IMF component, and the aligned FEs are used as the feature vector of this sample. Taking the OTDR curve when the optical fibre had broken as an example, the VMD was performed on it to obtain the IMF components, as shown in Fig. 6.
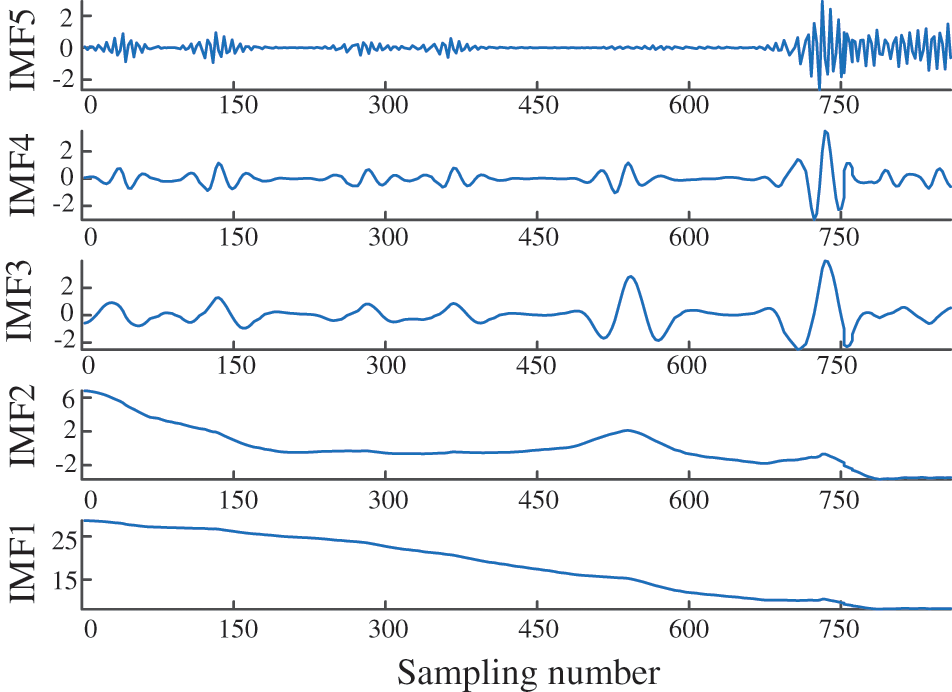
Figure 6: IMF components of OTDR curve when optical fibre had broken
Take the OTDR curves of typical fault optical fibre diagnosed by experts on-site as the sample set, after feature vector extraction, combine the curves to be tested to build a fuzzy matrix, then the fuzzy clustering algorithm is used to cluster them to generate a dynamic clustering map, so as to realize the matching clustering between the curves to be tested and their corresponding fault types, and finally realize the fault diagnosis of communication optical fibre. When the dynamic clustering map clusters the different fault types in the sample set into the same class, the situation is considered a misclassification. In this case, experts need to carry out on-site diagnosis. If there are the unknown type of faults in the curves to be tested, the curves will be recorded for the update of the sample set in the future.
When an unknown fault occurs, the fault information, including the burial environment of the faulty fibre, the deformation of the fibre and the OTDR curve of the faulty fibre, is collected to analyze the correlation between it and the cause of the fault. For OTDR curve data that have been grouped into fault types, we will select the most representative ones to be added to the standard sample set so that they can be accurately identified when similar faults occur in the future.
5 Model Validation and Analysis
To verify the feasibility of the model, OTDR fault curves collected randomly from the site were selected as an example, and each curve was processed with a maximum of 900 sampling points, as shown in Fig. 7. The signal in curve d0 has a cliff drop subsequent to no signal response, so first the fibre connection and the model of the fibre connector are checked, then the connector is cleaned. If the fault is still not eliminated, check whether it is the same type of fault as f1. Curve d1 in the last slope point, after the slope of the curve is significantly greater than the slope of the curve in the previous section, there is an abnormal optical power drop, after repair found that the fibre bending angle is large, and f2 for the same type of fault.
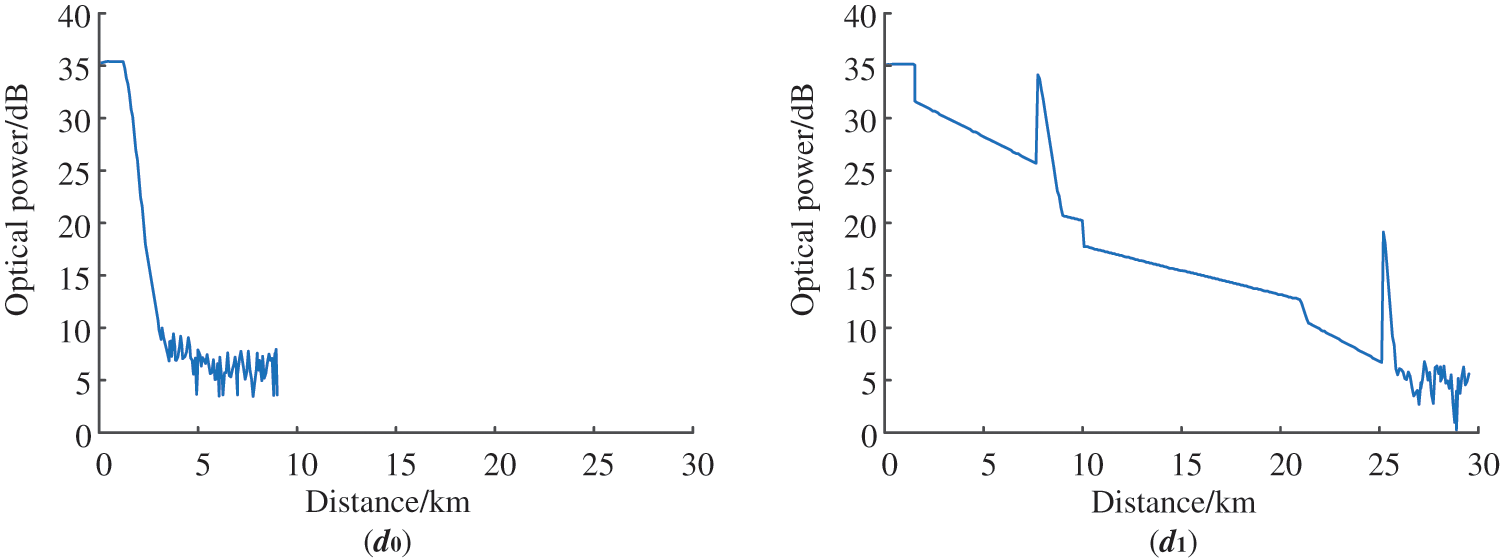
Figure 7: OTDR curves of optical fibre to be tested
Feature vector extraction for curves d0 and d1 is performed. Firstly, different IMF components are obtained through VMD, as shown in Fig. 8.
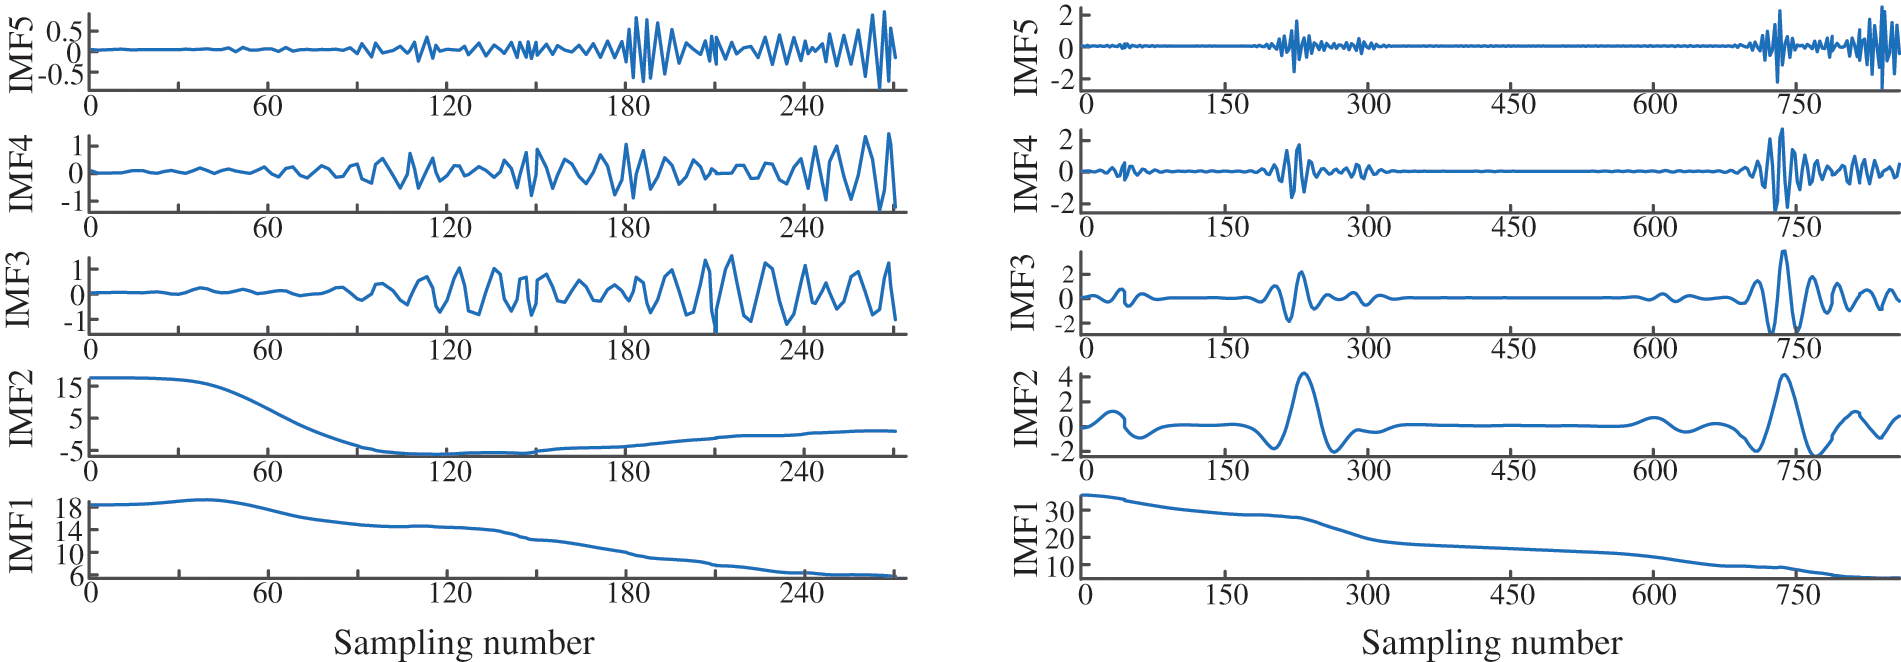
Figure 8: IMF components of OTDR curves of optical fibre to be tested
The FEs of the components IMF1~IMF5 are extracted and then they are arranged to obtain the feature vector. At the same time, the OTDR curve of typical fault optical fibre verified by experts is taken as a comparison, and the feature vector library is established, as shown in Table 1.
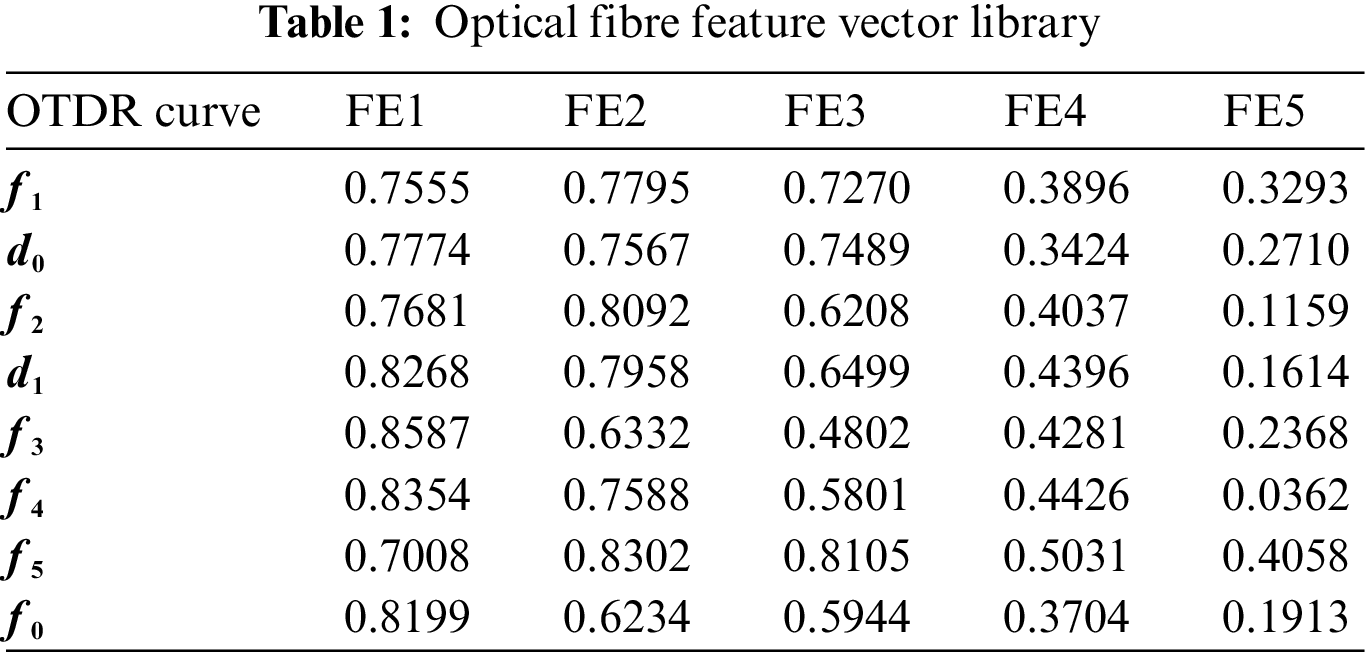
In the experimental part of this paper, eight data are selected for fuzzy clustering, which contains typical fault curves commonly found in the field and also ensures fault diagnosis at a faster rate. The feature vector matrix is constructed according to Table 1, the steps in Eq. (8) are taken and the feature vector matrix to get the fuzzy matrix X is standardized:
The X is Processed according to Eq. (9) to obtain the fuzzy similarity matrix R:
The square of R is calculated by using the transfer closure method until two identical terms appeared, and took it as the fuzzy equivalence matrix R*:
The
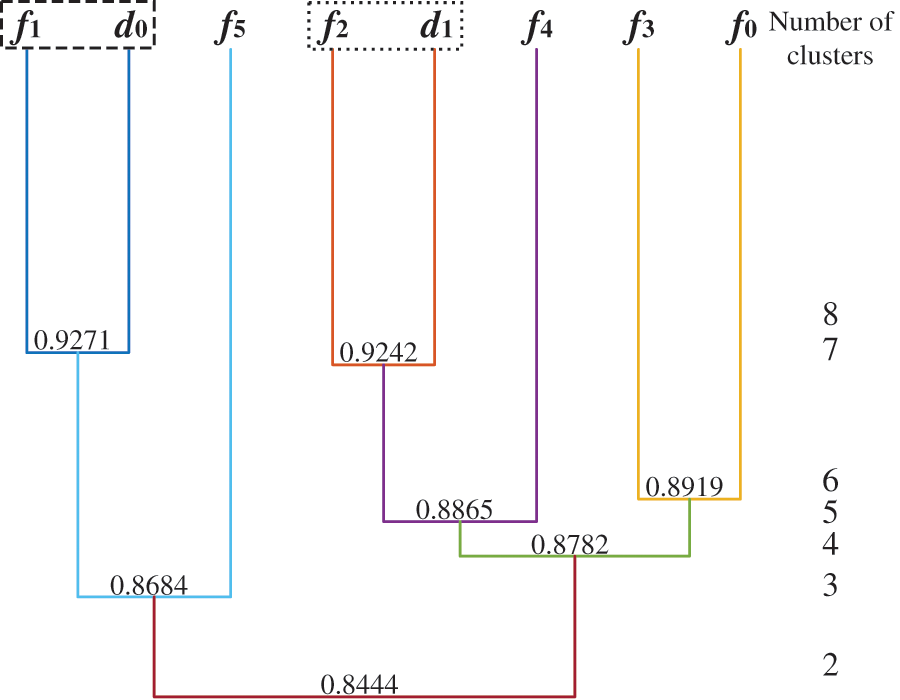
Figure 9: Clustering results
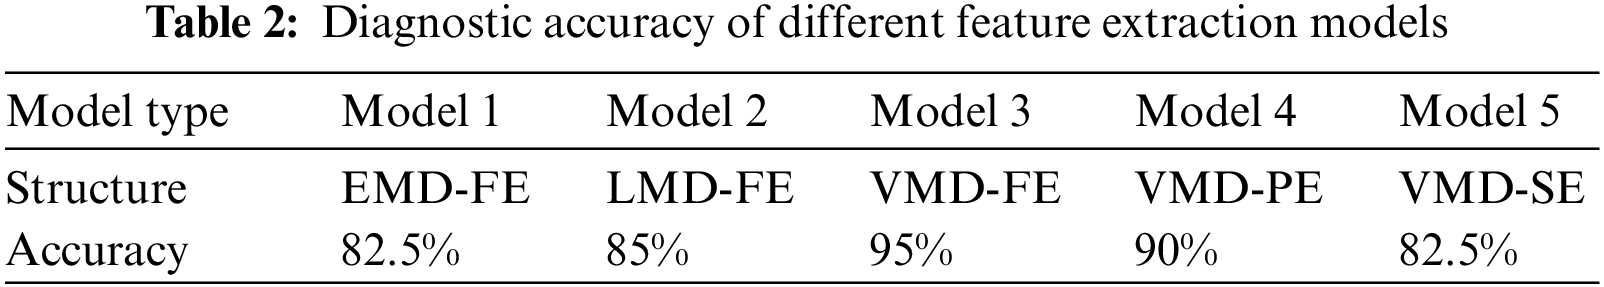
To verify the effectiveness of using VMD-FE for OTDR feature extraction of communication optical fibre, four common feature extraction models, EMD-FE, LMD-FE, VMD-PE and VMD-SE, were selected and compared in this paper. The clustering results are shown in Fig. 10. Only the VMD-PE clustering result is correct, but when
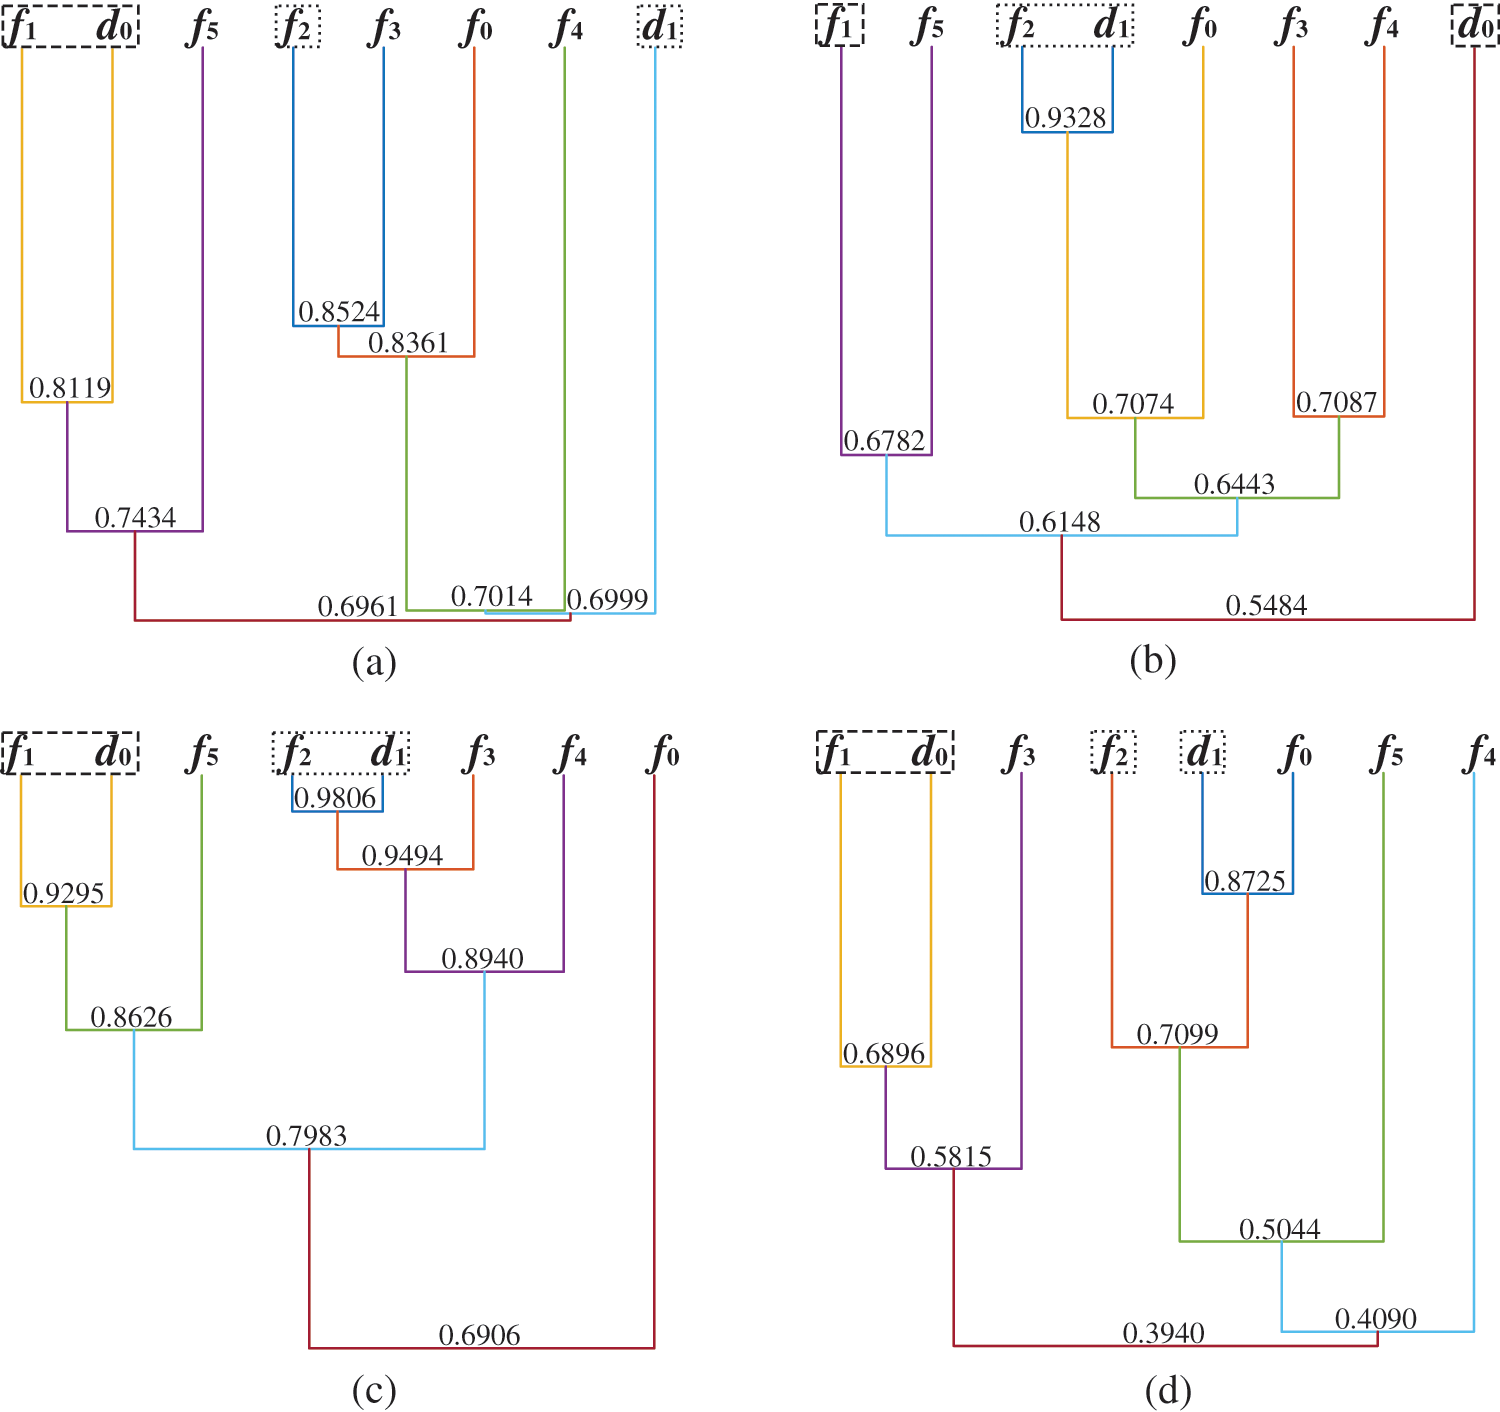
Figure 10: Clustering results using different feature extraction models: (a) EMD-FE; (b) LMD-FE; (c) VMD-PE; (d) VMD-SE
To test the accuracy of the above models in the fault diagnosis of communication optical fibre, 50 sets of data collected on-site were selected for fault diagnosis experiments. Each set of data consisted of 8 curves with the fault type already detected, and the fault type distribution is shown in Fig. 11. The experimental accuracy of each model is shown in Table 2. The results show that the feature extraction model proposed in this paper is superior to the other four models.
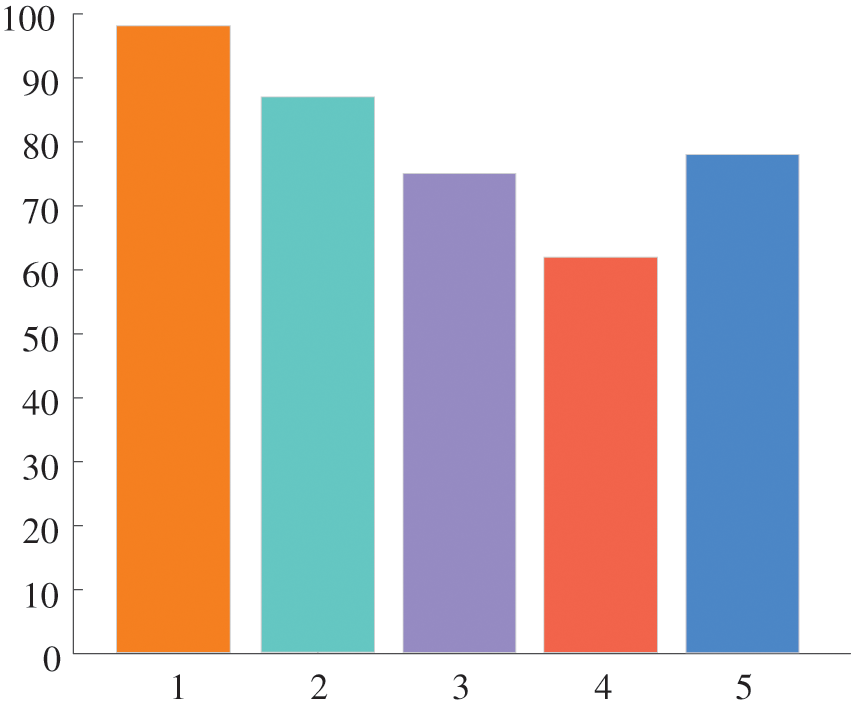
Figure 11: Fault type distribution diagram
Fault type 1: the optical fibre breaks and the breakpoint is too close to the test point; Fault type 2: the bending angle of the optical fibre is too large to produce bending loss; Fault type 3: the optical fibre breaks; Fault type 4: poor manufacturing quality of optical fibre end; Fault type 5: the bending radius of the optical fibre is too small.
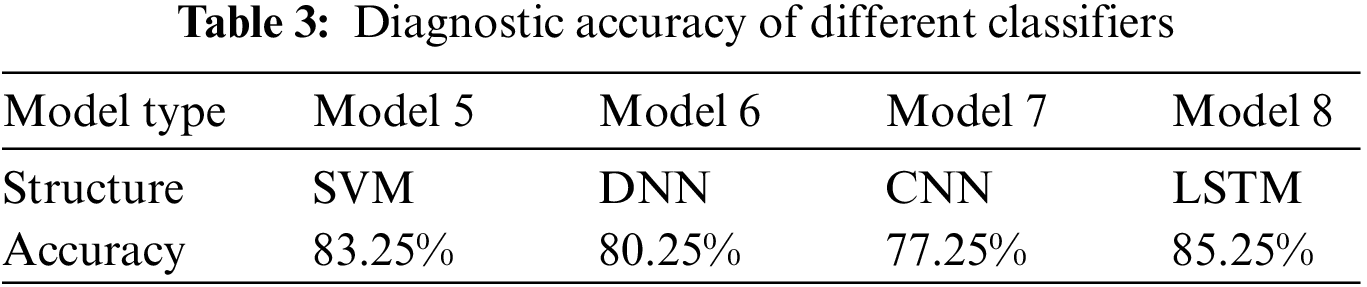
At the same time, this paper compared it with four common classifiers, SVM, DNN, CNN and LSTM. The result of classification using SVM is shown in Fig. 12. The experimental accuracy of each model is shown in Table 3. The results show that the traditional machine learning algorithms are unsuitable for communication fibre optical due to their demand for a certain number of training samples, which are not easily accessible to fault data. Also, direct clustering of the raw data is not ideal, as the fault data may contain minute features.
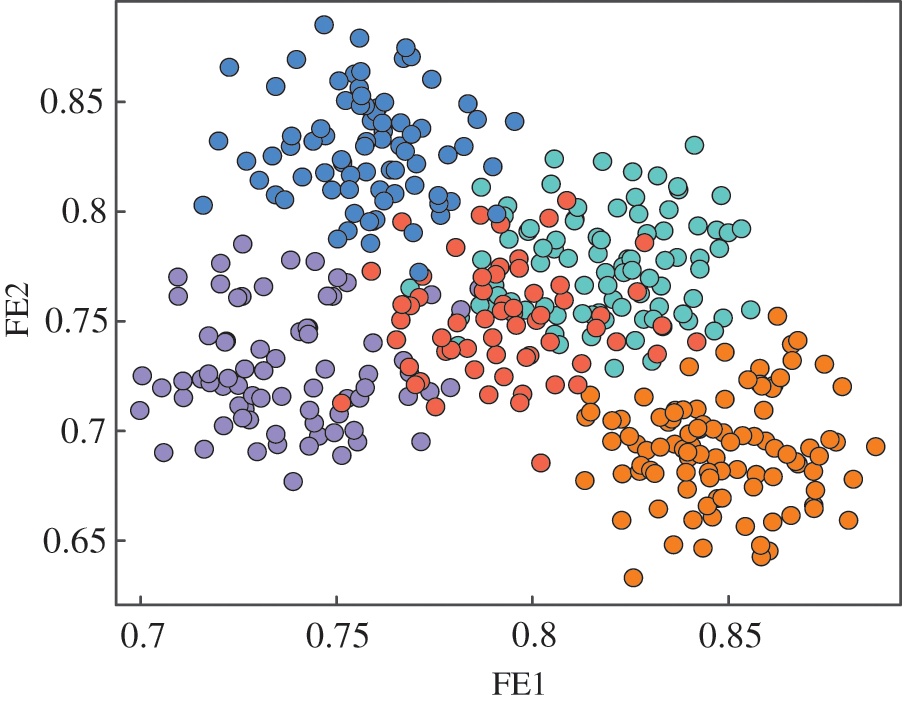
Figure 12: SVM clustering results
1. To realize the fault diagnosis of communication optical fibre, combining with the typical fault optical fibre OTDR curves and the OTDR curves collected on-site, for the nonlinear and unstable characteristics of the curves, variational modal decomposition and fuzzy entropy algorithm were combined for the feature extraction of OTDR curve. According to the feature vector library, to build the fuzzy matrix, use the fuzzy clustering algorithm to generate a dynamic clustering map. With the change of confidence factor, the optical fibre of the same fault type can be gathered together.
2. Considering the situation of sparse optical fibre fault data, the VMD-FE-FC communication optical fibre fault diagnosis model proposed in this paper can effectively achieve optical fibre fault diagnosis due to its small sample and no training characteristics, which can help reduce the maintenance cost of communication optical fibre and improve the efficiency of field staff to overhaul optical fibre equipment.
3. Due to the complexity and diversity of factors such as the environment in which the optical cables is buried and the length of optical cables in the actual situation, it is necessary to take the optical fibres with similar situations as the clustering objects in the faults diagnosis of communication fibre. At the same time, there are various causes of fibre optical communication failures. It is impossible to make accurate judgments on all the failures that occur, so when there are unknown failures in fibre optical communication, the curve data and the actual situation must be summarized and organized. Then the corresponding maintenance process and troubleshooting measures are recorded. It can narrow the troubleshooting scope and improve the efficiency of troubleshooting.
Acknowledgement: This paper does not have an author’s Acknowledgement.
Funding Statement: This paper is supported by State Grid Gansu Electric Power Company Science and Technology Project (20220515003).
Author Contributions: The authors confirm contribution to the paper as follows: study conception and design: Xiangqun Li; data collection: Jianpeng Sun, Bo Liu; analysis and interpretation of results: Jiawen Liang; draft manuscript preparation: Shengping Shi, Fangyu Ding. All authors reviewed the results and approved the final version of the manuscript.
Availability of Data and Materials: The data that support the findings of this study are available on request from the corresponding author, Li, upon reasonable request.
Conflicts of Interest: The authors declare that they have no conflicts of interest to report regarding the present study.
References
1. Zin, A. M., Bongsu, M. S., Idrus, S. M., Zulkifli, N. (2010). An overview of radio-over-fiber network technology. International Conference on Photonics, pp. 1–3. Langkawi, Malaysia. [Google Scholar]
2. Chen, S., Zhang, Z., Cai, S. (2018). High power budget coherent free space optical communication system based on fiber laser phased array. 2018 Asia Communications and Photonics Conference (ACP), pp. 1–3. Hangzhou, China. [Google Scholar]
3. Zhou, H. Y., Zhang, L., Long, S. Y., Wang, R. C. (2015). A novel fiber with ultra-low-loss and large-effective-area for the next generation communication. International Conference on Optical Communications and Networks, pp. 1–3. Nanjing, China. [Google Scholar]
4. Law, C. T., Bhattarai, K., David, C. Y. (2008). Fiber-optics-based fault detection in power systems. IEEE Transactions on Power Delivery, 23(3), 1271–1279. https://doi.org/10.1109/TPWRD.2008.919233 [Google Scholar] [CrossRef]
5. Dou, X. Y., Yin, H. X., Hao, Y., Yue, H. H., Qi, X. Y. et al. (2015). Demonstration of chaotic-laser based WDM-PON secure optical communication and real-time online fiber-fault detection and location. Opto Electronics Communications Conference (OECC), pp. 1–3. Shanghai, China. [Google Scholar]
6. Abdelli, K., Cho, J. Y., Azendorf, F., Griesser, H., Tropschug, C. et al. (2022). Machine-learning- based anomaly detection in optical fiber monitoring. Journal of Optical Communications and Networking, 14(5), 365–375. https://doi.org/10.1364/JOCN.451289 [Google Scholar] [CrossRef]
7. Dou, X., Yue, H., Zhou, Y., Yin, H., Wu, C. et al. (2014). A novel method of the fiber-link fault detection and location with multi-channel and multi-fiber based on chaotic light theory. 7th International Conference on Biomedical Engineering and Informatics, pp. 960–964. Dalian, China. [Google Scholar]
8. Urban, P. J., Getaneh, A., von der Weid, J. P.,, Temporao, G. P., Vall-Ilosera, G. et al. (2013). Detection of fiber faults in passive optical networks. Journal of Optical Communications and Networking, 5(11), 1111–1121. https://doi.org/10.1364/JOCN.5.001111 [Google Scholar] [CrossRef]
9. Qian, H. M., Zhang, Z. L., Ma, J. C. (2008). Fiber optical gyro fault diagnosis based on wavelet transform and neural network. IEEE/ASME International Conference on Mechatronic and Embedded Systems and Applications, pp. 608–611. Beijing, China. [Google Scholar]
10. Chen, M. M., Zhang, M. J., Chen, S. X., Zhang, J. G., Yan, S. L. et al. (2020). Health monitoring of long-haul fiber communication system using chaotic OTDR. China Communications, 17(5), 1–11. https://doi.org/10.23919/JCC.2020.05.001 [Google Scholar] [CrossRef]
11. Dong, X. Y., Wang, A. B., Zhang, J. G., Han, H., Zhao, T. et al. (2015). Combined attenuation and high-resolution fault measurements using chaos-OTDR. IEEE Photonics Journal, 7(6), 6. https://doi.org/10.1109/JPHOT.2015.2501650 [Google Scholar] [CrossRef]
12. Feng, Z., Qiu, S., Wei, Y., Li, L., Liu, G. N. et al. (2009). Coherent OTDR used for fibre faults detection. 2009 Asia Communications and Photonics Conference and Exhibition (ACP), pp. 1–5. Shanghai, China. [Google Scholar]
13. El-Sayed, M., Ibrahim, P. J., Gunzer, F. (2010). Investigation of the precision regarding fiber fault location with a commercial optical time domain reflectometer. 7th International Symposium on High-Capacity Optical Networks and Enabling Technologies, pp. 237–241. Cairo, Egypt. [Google Scholar]
14. Lalam, N., Westbrook, P. S., Li, J., Lu, P., Buric, M. P. (2021). Phase-sensitive optical time domain reflectometry with Rayleigh enhanced optical fiber. IEEE Access, 9, 114428–114434. https://doi.org/10.1109/ACCESS.2021.3105334 [Google Scholar] [CrossRef]
15. Zhang, Z., Liu, R. (2009). Application of wavelet analysis technique in the faults diagnosis of optical fiber fusion. International Conference on Wireless Networks and Information Systems, pp. 226–229. Shanghai, China. [Google Scholar]
16. Gu, X., Sablatash, M. (1994). Estimation and detection in OTDR using analyzing wavelets. Proceedings of IEEE-SP International Symposium on Time-Frequency and Time-Scale Analysis, pp. 353–356. Philadelphia, USA, IEEE. [Google Scholar]
17. Shan, Y., Liu, Y. J., Guan, F. J. (2015). The Application of BP neural network algorithm in optical fiber fault diagnosis. International Symposium Distributed Computing and Applications Business Engineering and Science, pp. 509–512. Guiyang, China. [Google Scholar]
18. Chen, B. J., Chen, X. F., He, Z. J., Tan, J. Y. (2009). Mechanical fault diagnosis based on local mean decomposition method. International Conference on Measuring Technology and Mechatronics Automation, Zhangjiajie, China. [Google Scholar]
19. Yu, J. B., Lv, J. X. (2017). Weak fault feature extraction of rolling bearings using local mean decomposition-based multilayer hybrid denoising. IEEE Transactions on Instrumentation and Measurement, 66(12), 3148–3159. https://doi.org/10.1109/TIM.2017.2751878 [Google Scholar] [CrossRef]
20. Liu, S. Y., Dong, L., Liao, X. Z., Cao, X. D., Wang, X. X. et al. (2019). Application of the variational mode decomposition-based time and time-frequency domain analysis on series DC Arc fault detection of photovoltaic arrays. IEEE Access, 7, 126177–126190. https://doi.org/10.1109/ACCESS.2019.2938979 [Google Scholar] [CrossRef]
21. Zhang, H. P., He, H. Y., Gu, M. X. (2014). Research of fiber-optical fault diagnosis based on support vector machine (SVM) mining. 5th International Conference on Intelligent Systems Design and Engineering Applications (ISDEA), pp. 803–807. Zhangjiajie, China. [Google Scholar]
22. Dragomiretskiy, K., Zosso, D. (2014). Variational mode decomposition. IEEE Transactions on Signal Processing, 62(3), 531–544. https://doi.org/10.1109/TSP.2013.2288675 [Google Scholar] [CrossRef]
Cite This Article
 Copyright © 2024 The Author(s). Published by Tech Science Press.
This work is licensed under a Creative Commons Attribution 4.0 International License , which permits unrestricted use, distribution, and reproduction in any medium, provided the original work is properly cited.
 Downloads
 Citation Tools