
 Submit a Paper
 Propose a Special lssue
 Open Access
ARTICLE

Investigating Load Regulation Characteristics of a Wind-PV-Coal Storage Multi-Power Generation System
1 Sinopec Star Co., Ltd., Zhengzhou, 450000, China
2 Hebei Key Laboratory of Low Carbon and High Efficiency Power Generation Technology, North China Electric Power University, Baoding, 071003, China
* Corresponding Author: Enhui Sun. Email:
(This article belongs to the Special Issue: Key Technologies of Renewable Energy Consumption and Optimal Operation under )
Energy Engineering 2024, 121(4), 913-932. https://doi.org/10.32604/ee.2023.043973
Received 17 July 2023; Accepted 09 October 2023; Issue published 26 March 2024
 View Full Text
 Download PDF
Abstract
There is a growing need to explore the potential of coal-fired power plants (CFPPs) to enhance the utilization rate of wind power (wind) and photovoltaic power (PV) in the green energy field. This study developed a load regulation model for a multi-power generation system comprising wind, PV, and coal energy storage using real-world data. The power supply process was divided into eight fundamental load regulation scenarios, elucidating the influence of each scenario on load regulation. Within the framework of the multi-power generation system with the wind (50 MW) and PV (50 MW) alongside a CFPP (330 MW), a lithium-iron phosphate energy storage system (LIPBESS) was integrated to improve the system’s load regulation flexibility. The energy storage operation strategy was formulated based on the charging and discharging priority of the LIPBESS for each basic scenario and the charging and discharging load calculation method of LIPBESS auxiliary regulation. Through optimization using the particle swarm algorithm, the optimal capacity of LIPBESS was determined to be within the 5.24–4.88 MWh range. From an economic perspective, the LIPBESS operating with CFPP as the regulating power source was 49.1% lower in capacity compared to the renewable energy-based storage mode.Graphic Abstract
Keywords
Nomenclature
| PV | photovoltaic |
| AGC | automatic generation control |
| CFPP | coal-fired power plant |
| ESS | energy storage systems |
| PSO | particle swarm optimization |
| LIPBESS | lithium iron phosphate energy storage system |
| SOC | the state of charge |
| B | the rated capacity of LIPBESS |
| vr,max | the maximum climb rate of the actual data of the unit |
| b | the beginning time of the power grid instruction for the load evaluation |
| e | the end time of the power grid instruction |
| VAVR | the average load climbing rate of the load adjustment of a certain system |
| Pwave | the load fluctuation |
| tej | the end time of this AGC instruction |
| QT | the number of qualified times |
| QR | the number of qualified times of daily load evaluation |
| QR | the qualified rate of daily load evaluation |
| Objectcoal | the objective function of solving the CFPP load model |
| B | the rated capacity of LIPBESS |
| Subscripts | |
| act | the actual data |
| simulate | values for the model |
| SYS | the supply system |
| Greek Symbols | |
| ΔP | the load increment of the load model at the current time |
Within the green energy discipline, renewable energy represented by wind power (wind) and photovoltaic (PV) is developing rapidly [1,2]. Fig. 1(a) illustrates the operation of an existing power plant in response to grid dispatch, specifically the Automatic Generation Control AGC. In this context, the randomness and volatility associated with wind and PV affect the safe and stable operation of power grids [3–5]. Studies have shown that when wind and PV operate together, there is a complementary load output that can reduce the regulation pressure on the power system [6–8]. However, as the installed capacity of wind and PV systems increases, there is still a need to enhance the flexibility of the power supply side and the capacity of the load side to maintain a balance between the power supply and load demand [9,10].
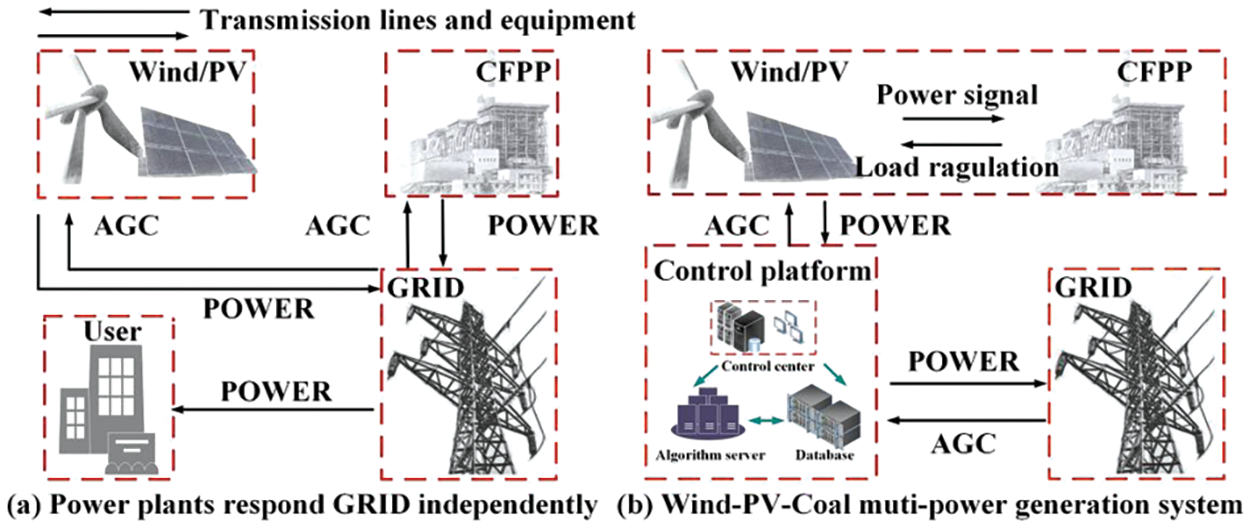
Figure 1: Schematic diagram of the operation mode of the power plant responding to the grid
Although coal-fired power plants (CFPP) still play a significant role in the current energy supply in many countries, there are ongoing global efforts to transition towards cleaner and more sustainable energy sources [11,12]. The benefits of CFPP, such as their flexibility and geographic advantages, should be carefully weighed against their environmental impacts and long-term sustainability [13,14]. Owing to their geographical flexibility and load regulation advantages, CFPP can be used as a flexible regulatory power source to build a multi-power generation system. In this study, the integration of wind, PV, and CFPP in a multi-power generation system was investigated to assess both the potential benefits and challenges associated with such a configuration. The objective of this study was to examine the power-matching dynamics between CFPP, wind, and PV, to better understand the feasibility and effectiveness of integrating these diverse energy sources. The wind–PV–coal multipower generation system, shown in Fig. 1(b), is designed to enhance the utilization of renewable energy power by using a CFPP as a regulating source. By examining the power-matching dynamics within a multi-power generation system, valuable insights can be gained regarding the optimal utilization of available resources, potential for reducing emissions, and feasibility of transitioning towards a more sustainable energy combination [15,16]. The theoretical support provided by this research can serve as a foundation for policymakers and energy planners to make informed decisions regarding the future development of large-scale multi-power generation systems.
Research has explored multi-power dispatch, providing valuable insights into the potential advantages of CFPP with renewable energy sources and energy storage systems in multi-power generation systems. Lei et al. [17] suggested that the maximum penetration rate of wind could be realized through the rational allocation of the wind curtailment load and CFPP peak regulation. This implies that the combination of these different power sources can optimize their utilization and improve overall cost-effectiveness. Sun et al. [18] demonstrated that the addition of a CFPP and energy storage can effectively improve the power utilization level of a multi-power generation system, particularly under ideal conditions. This highlights the potential of incorporating CFPP to enhance the overall performance and reliability of a system. Additionally, Zhang et al. [19] proposed a multipath transformation planning model for CFPPs, in which the embedded operational problem is a unit commitment problem that considers flexibility and frequency safety constraints. This implies that CFPP in power systems can increase their flexibility through modifications and unit commitments. Studies conducted by Lei et al. [17–19] provided valuable insights into the potential benefits of integrating CFPP with renewable energy sources and energy storage systems in a multi-power generation system. These studies emphasize the economic efficiency, power utilization, emission reduction, and load regulation aspects of such integration. Furthermore, the incorporation of energy storage systems (ESS) into wind and PV setups can mitigate the grid peaking pressure and enhance power supply stability [20,21]. Similarly, integrating an ESS with a CFPP can enhance the load regulation flexibility of the power system and further optimize the utilization of various energy sources [22]. However, the direct combination of CFPP with ESS and renewable energy sources on the supply side still requires further exploration [23,24]. There is a pressing need to investigate the feasibility, technical complexities, and potential synergies to fully realize the benefits of combining CFPP with energy storage and renewable energy technologies [25,26]. Overall, these studies highlight the potential advantages of integrating CFPP, ESS, and renewable energy sources into a multi-power generation system. Continued research and exploration are necessary to optimize the coordination and operation of these energy sources, leading to a more sustainable and efficient energy system.
This study examined the coupling of wind, PV, and CFPP in a multi-power generation system, aiming to reveal the power-matching characteristics of different power sources and provide theoretical support for effectively using the flexibility of CFPP to regulate wind/PV. The research described in the study focused on constructing an integrated wind-PV-coal storage multi-power generation system based on the power matching characteristics of renewable energy and CFPP. This study aims to investigate the following aspects:
(1) Classification of basic regulation scenarios: This study identified and classified the different scenarios that arise during the load regulation process of a wind-PV-coal multi-power generation system. By analyzing each scenario, the impact on the system operation was revealed. This classification helps understand the challenges and opportunities associated with the dynamic interplay between the different energy sources in the system.
(2) ESS operation strategy: An operation strategy was formulated for the ESS within the constructed multipower generation system. The goal of this strategy is to minimize ESS capacity allocation and reduce investment costs. The overall efficiency and cost-effectiveness of the system can be improved by optimizing the operation of the ESS.
(3) Analysis of grid-side stability and power demand: This study assessed the constructed wind-PV-coal storage multi-power generation system according to the grid-side stability demand criteria. Through optimization, the system can meet the stability requirements and power demand of the power grid, so that the system can meet the power supply demand while maintaining the feasibility and reliability of the power grid stability.
This study reviewed one year of historical data for a 50 MW rated wind farm, 50 MW PV, and 330 MW CFPP. The mathematical description of the CFPP load regulation model is as follows:
where
2.2 Grid-Side AGC Instruction Construction
The mathematical description of instruction construction on the grid side of a multi-power supply system is as follows:
where
where
2.3 Load Regulation Evaluation Parameters
The power grid must ensure a real-time balance between generation and load to ensure power supply stability. Therefore, it is necessary to evaluate the load regulation process and power output of power plants [18,27]. Three parameters–load level, average load-climbing rate, and load fluctuation–were studied to evaluate the load regulation process of the system.
where
where
where
where
2.4 Multi-Power Generation System Model Solving Method
Fig. 2 shows a flowchart of the model construction process. The solution steps for the system were as follows:

Figure 2: Model construction flow chart
(1) Solve the CFPP load response model using the actual operation data of the CFPP for one year, solve the CFPP load response model according to the objective function with the actual data, and determine the model parameters.
(2) Calculate the multi-power generation system model based on the actual one-year operation data of wind and PV. According to the optimization parameters obtained in the first step, calculate the multi-power generation system model. Load evaluation was performed according to the model and, according to the results, it was determined whether ESS should be added.
(3) If an ESS needs to be added, the ESS capacity in the multipower generation system model of the coupled ESS is calculated through PSO according to the objective function, and load evaluation is carried out for the system.
This comprehensive approach ensures that both the multipower generation system model and the energy storage model are based on actual data, enhancing the accuracy of the models. In this study, particle swarm optimization (PSO) was used to solve the CFPP load–response model [18]. The objective function of the CFPP load model was based on the relative error between the simulated value of the model and the actual operational data of the unit, and is described as follows:
where
To determine the model parameters, the data set with the smallest error was selected as the parameter. The maximum stable adjustment rate of the actual data was 1.83% Pe/min, which served as the constraint condition in the load model. The remaining daily data were used for validation purposes, ensuring that the maximum error was less than 5% to validate the effectiveness of the model. In addition, the average adjustment rate evaluation index was set to 80% of the maximum value. In this study, an iterative approach was adopted to generate a random population and enhance the learning factor to avoid becoming trapped in local optima. The CFPP load model was calculated using typical daily data for each month. and the result of

Figure 3: Load regulation model of CFPP load response
3 Load Regulation Characteristics of Multi-Power Generation System
3.1 Load Evaluation Results of Wind-PV-Coal System
In this study, the load was evaluated based on the benchmark of independent CFPP operations, considering the mature technology of grid-connected CFPP. The objective was to achieve a stable power supply by relying solely on the CFPP as a regulating power source in an ideal scenario.
To provide a more comprehensive analysis of the multi-power generation system’s performance, a simulation of the wind-PV-coal system was conducted, and the results of the load evaluation are illustrated in Fig. 4. When compared to the grid-side benchmark, it was observed that the load assessment qualification rate of the wind-PV-coal multi-power generation system exhibited a monthly declining trend. On average, the load assessment qualification rate decreased by approximately 19.61% per month. These findings suggest that the wind-PV-coal system is less effective in meeting the load evaluation criteria compared to the grid-side benchmark set by the independent CFPP operation. Further analysis and improvement are necessary to enhance the performance and efficiency of the wind-PV-coal multipower generation systems.

Figure 4: Load evaluation qualified rate of grid-side reference level and wind-PV-coal multi-power generation
3.2 Multi-Power Generation System Load Regulation Scenario Division
The results of the load evaluation show that relying on the CFPP alone as a regulating power source is not sufficient to absorb the target capacity of Wind and PV. This study reveals the basic regulation scenarios in the system load regulation process by dividing the power supply process into scenarios and determining the impact of each scenario on load regulation. There were eight basic regulation scenarios consisting of four wind-coal supply time load-matching scenarios and four scenarios with wind-PV-coal supply times.
3.2.1 Four Load Matching Scenarios of Wind-Coal Coupling
Scenario 1 is shown in Fig. 5(a), showing that when the CFPP AGC command increased, whereas the wind AGC command decreased. Scenario 2 is shown in Fig. 5(b) and illustrates that when the CFPP AGC command decreased, the wind AGC command increased. Both scenarios reduce the value of the load variation for a single regulation compared with the load variation trend for CFPP-independent operation.

Figure 5: Schematic diagram of load response in Scenarios 1 and 2
Scenario 3 is shown in Fig. 6(a), where the AGC commands for wind and CFPP were lowered simultaneously. Scenario 4 is shown in Fig. 6(b), where the AGC commands for wind and CFPP were increased simultaneously. These two scenarios increased the value of the load change for a single regulation of the combined wind and CFPP operation. When wind power exhibits an anti-peak phenomenon, it will increase the time required for the system to reach the target load.
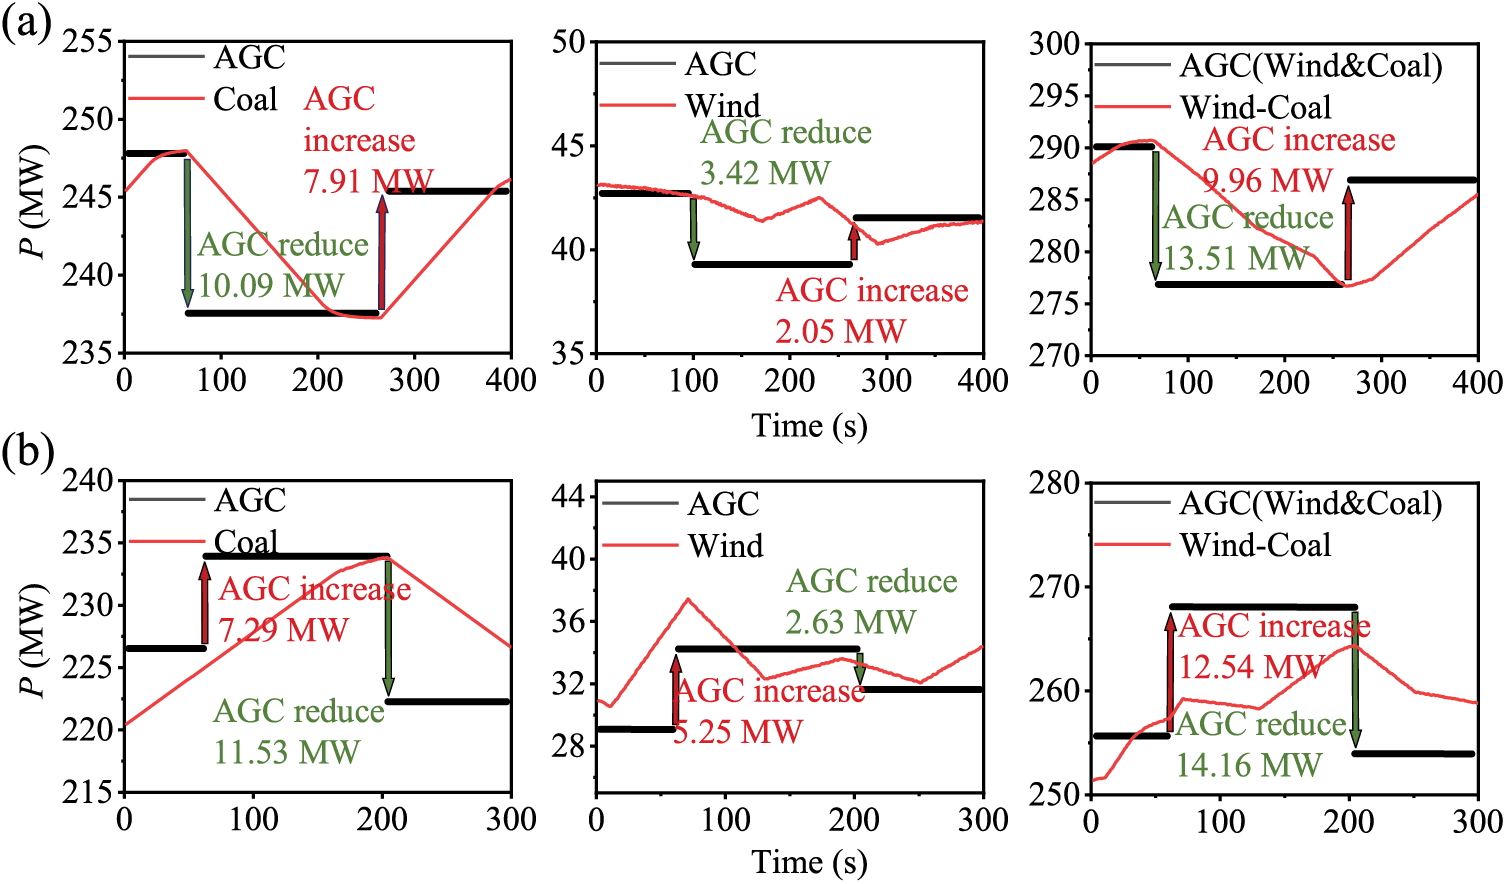
Figure 6: Schematic diagram of load response in Scenarios 3 and 4
3.2.2 Four Load Matching Scenarios of Wind-PV-Coal Coupling
During the wind–PV–coal multi-power supply period, the system is supplied by three sources of power: PV, wind, and CFPP. For this time period, in contrast to the wind-coal scenario division mode, the load scenario is divided in terms of the combination of wind and PV, considering the impact of the load change trend on the system load regulation after the coupling of the two. The coupling between wind and PV, four scenarios were considered to analyze their different operational characteristics and impacts.
Scenario 5 is shown in Fig. 7(a). In a certain period, the PV load increased and the wind load decreased. Scenario 6 is shown in Fig. 7(b). In a certain period, the PV load decreased and the wind load increased. In both scenarios, the wind and PV loads complemented each other, reducing the volatility of the new energy power.

Figure 7: Schematic diagram of load response in Scenarios 5 and 6
Scenario 7 is shown in Fig. 8(a), in which the PV and wind power loads increased simultaneously. Scenario 8 is shown in Fig. 8(b), in which the PV and wind power loads decreased simultaneously. In both scenarios, the wind and PV loads were synergistic, that is, the rate of change of the wind and PV loads increased after coupling.
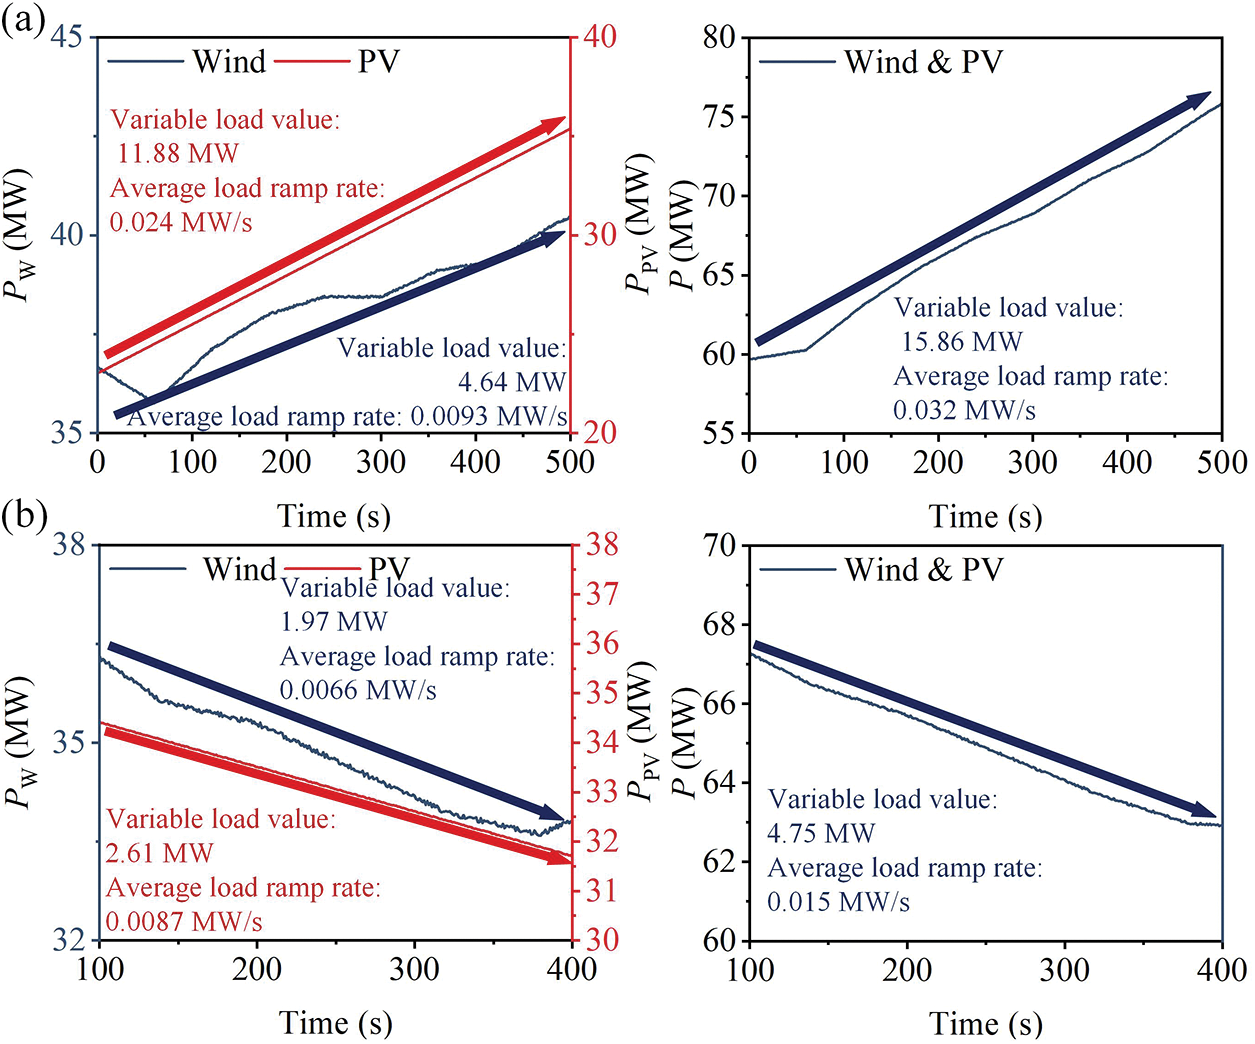
Figure 8: Schematic diagram of load response in Scenarios 7 and 8
3.3 Load Response Capability Analysis of Multicomponent Power Generation System
The probability of each scenario occurring in a multi-power generation system was calculated and divided into two categories: adjustable and difficult to regulate, as shown in Fig. 9.
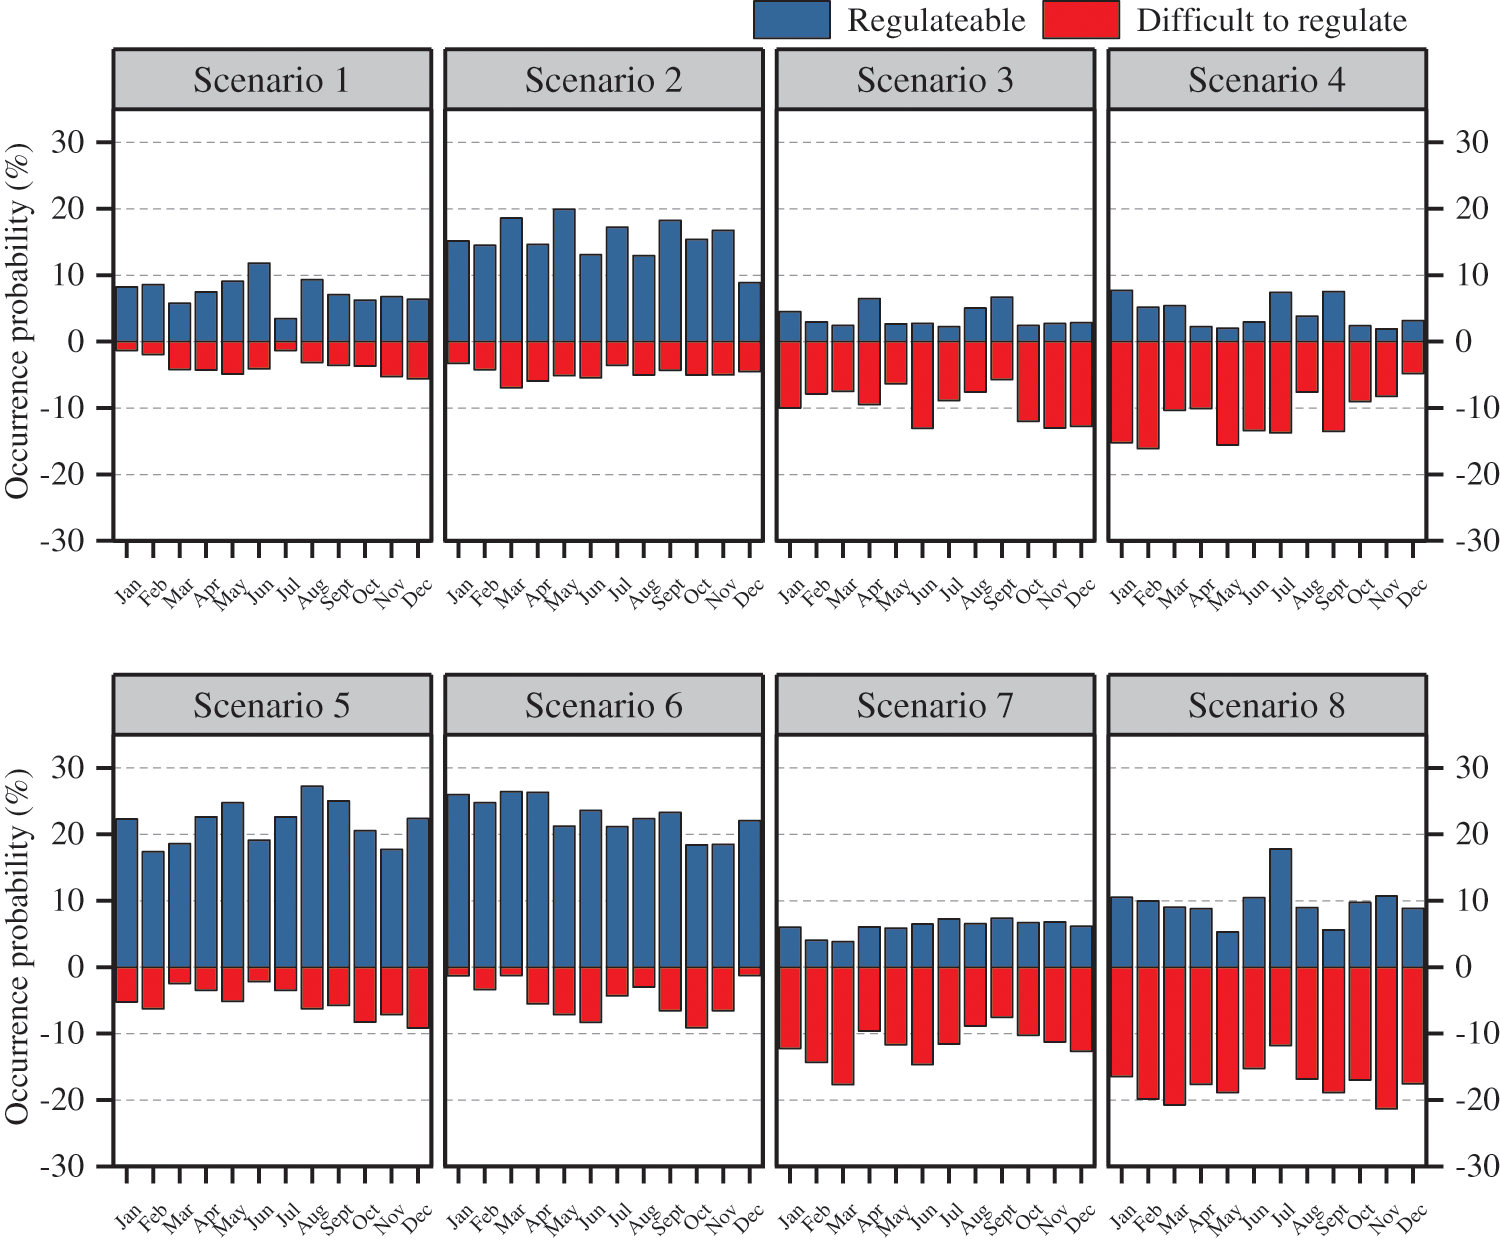
Figure 9: Probabilities of different scenarios in each month
The probability of difficult regulation in Scenario 1 was 3.8%, with a conditional probability of 32.4%. In Scenario 2, the probability of difficult regulation was 4.9%, with a conditional probability of 23.9%. In Scenarios 3 and 4, on average, 9.5% and 11.4% of the system load were difficult to regulate, with conditional probabilities of 72.3% and 74.7 %, respectively.
For Scenarios 5 and 6, the probabilities of difficult regulation were 5.3% and 4.6%, respectively, with conditional probabilities of 19.9% and 17.4% for the wind–PV–coal multi-power supply periods. In Scenarios 7 and 8, on average, 11.8% and 17.7% of the system load were difficult to regulate, with conditional probabilities of 66.1% and 64.8 %, respectively.
These calculations provide insights into the likelihood of encountering difficult regulatory situations in multipower generation systems. Understanding the probabilities and conditional probabilities is important for effectively managing and optimizing the load regulation capabilities of a system.
The results show that Scenarios 1, 2, 5, and 6 of the load regulation of the multi-power generation system have a small impact on load regulation. The occurrence of Scenarios 3, 4, 7, and 8 have a greater impact on the load regulation of the multipower generation system.
4 Wind-PV-Coal Storage Multi-Power Generation System
To address the challenges associated with the coupling of wind power and photovoltaic systems, which may lead to a lower level of system load evaluation, a lithium iron phosphate energy storage system (LIPBESS) was introduced. The purpose of incorporating LIPBESS is to enhance the flexibility of load regulation and assist the CFPP in effectively regulating the system load.
Fig. 10 illustrates the configuration of the wind-PV-coal storage multi-power generation system with LIPBESS. The addition of LIPBESS allows the storage of excess energy generated by wind and PV systems during periods of high production. This stored energy can then be dispatched during periods of low production or increased demand, thereby providing support to the CFPP in regulating the system load.

Figure 10: Diagram of wind-PV-coal storage multi-power generation system
By integrating LIPBESS, the system can store and release energy as required, thereby improving its overall load regulation capability. This modification aims to optimize the performance and efficiency of the wind-PV-coal storage multi-power generation system to balance power supply and demand.
4.1.1 LIPBESS Charge and Discharge Constraint
In this study, the LIPBESS was modelled with reference to battery parameters from references [28,29]. When operating in a multi-power generation system, LIPBESS is charged and discharged to improve the load regulation capacity of the system during a specific running time, and the system load regulation rate is increased to the maximum ramp rate of the CFPP load response model, thereby increasing the load regulation flexibility of the system. The LIPBESS charge/discharge power was obtained using the following equation:
where
The state of charge (SOC) of a battery is a state parameter that characterizes the battery charge. The SOC was calculated as follows:
where
where
4.1.2 LIPBESS Operation Period
In this study, the operating hours of the energy storage system were governed by a 2-h single operation constraint for energy storage plants. This constraint ensures that the energy storage system operates at 2-h intervals. To determine the operating hours, the study divided them based on primitive scenarios of wind-coal power supply hours and wind-PV-coal multi-power supply hours. These scenarios reflect different power generation conditions and patterns.
Fig. 11 illustrates the typical daily power generation curve of PV, from which it can be observed that the active power interval of PV power generation was from 8:00 to 18:00. Consequently, for the wind-PV-coal multi-power supply scenario, the operating hours were set from 8:00 to 18:00.

Figure 11: Typical daily power generation capacity of PV power generation
This study determined the appropriate operating hours for different scenarios by considering specific power generation characteristics and patterns, such as the active power interval of PV power generation. This helps to optimize the performance and utilization of the energy storage system within a multipower generation system.
The time periods in the wind–PV–coal diversified power supply were divided according to the power supply characteristics of the PV supply: 8:00–10:30 and 15:30–18:00 were the two time periods with fixed variations along with sunrise and sunset, and 10:30–15:30 was the peak load period. The PV power generation fluctuated significantly during peak load hours. When the PV load was zero, the wind and CFPP supply periods were 0:00–8:00 and 18:00–24:00. If the energy storage had a single action time that was too long, it was difficult to regulate it effectively. Concurrently, to ensure the balance of charge and discharge times of LIPBESS in a day, the power supply period was further divided into eight periods, which were 0:00–4:00, 4:00–8:00, 18:00–21:00, and 21:00–24:00. The power supply times were 8:00–10:30, 10:30–13:00, 13:00–15:30, and 15:30–18:00.
Based on the analysis results presented in Section 2.2, the energy storage system prioritizes charging and discharging based on certain scenarios, namely, Scenarios 3, 4, 7, and 8. In Scenarios 3 and 7, LIPBESS was charged to increase the system load reduction regulation rate to meet the grid-side demand. Similarly, Scenarios 4 and 8 required LIPBESS discharge to increase the system load–lift adjustment rate. Moreover, Scenarios 1, 6, 2, and 5 had similar requirements for charging and discharging as Scenarios 4, 8, 3, and 7, respectively, which are suitable for discharging and charging. By prioritizing the specific charging and discharging actions based on different scenarios, the LIPBESS can effectively respond to the varying demands of the grid and enhance the overall load regulation flexibility of the multi-power generation system.
According to the statistical analysis conducted in Fig. 12, the charging and discharging periods for the LIPBESS were determined based on the probability of occurrence of the eight load scenarios within the wind-coal supply periods and the wind-PV-coal multipower supply periods. The charging and discharging operations break down during different time periods.

Figure 12: Time segment probability statistics of Scenarios 5 through 8
Within the 8:00–10:30 period, the load scenarios consisted primarily of Scenarios 5 and 7, with average occurrence probabilities of 52.16% and 45.92%, respectively. Consequently, LIPBESS was given priority for charging in this time interval.
During the 10:30-13:00 period, Scenario 8 had an average occurrence probability 5.67% higher than that of Scenario 7. Consequently, LIPBESS is prioritized for discharging operations.
Within the 13:00–15:30 interval, LIPBESS was prioritized for the discharging operations. Scenario 7 had an average occurrence probability 16.83% higher than that of Scenario 8, leading to the decision for the LIPBESS to operate with priority charging.
During the 15:30–18:00 period, the load scenarios primarily consisted of Scenarios 6 and 8, with average occurrence probabilities of 44.42% and 47.25% for each month, respectively. Accordingly, energy storage was prioritized for discharge during this period.
Based on the statistical findings presented in Fig. 13 for the Wind and CFPP operation periods, the following operation strategy was determined for LIPBESS within the wind–coal–storage multi-power generation system.
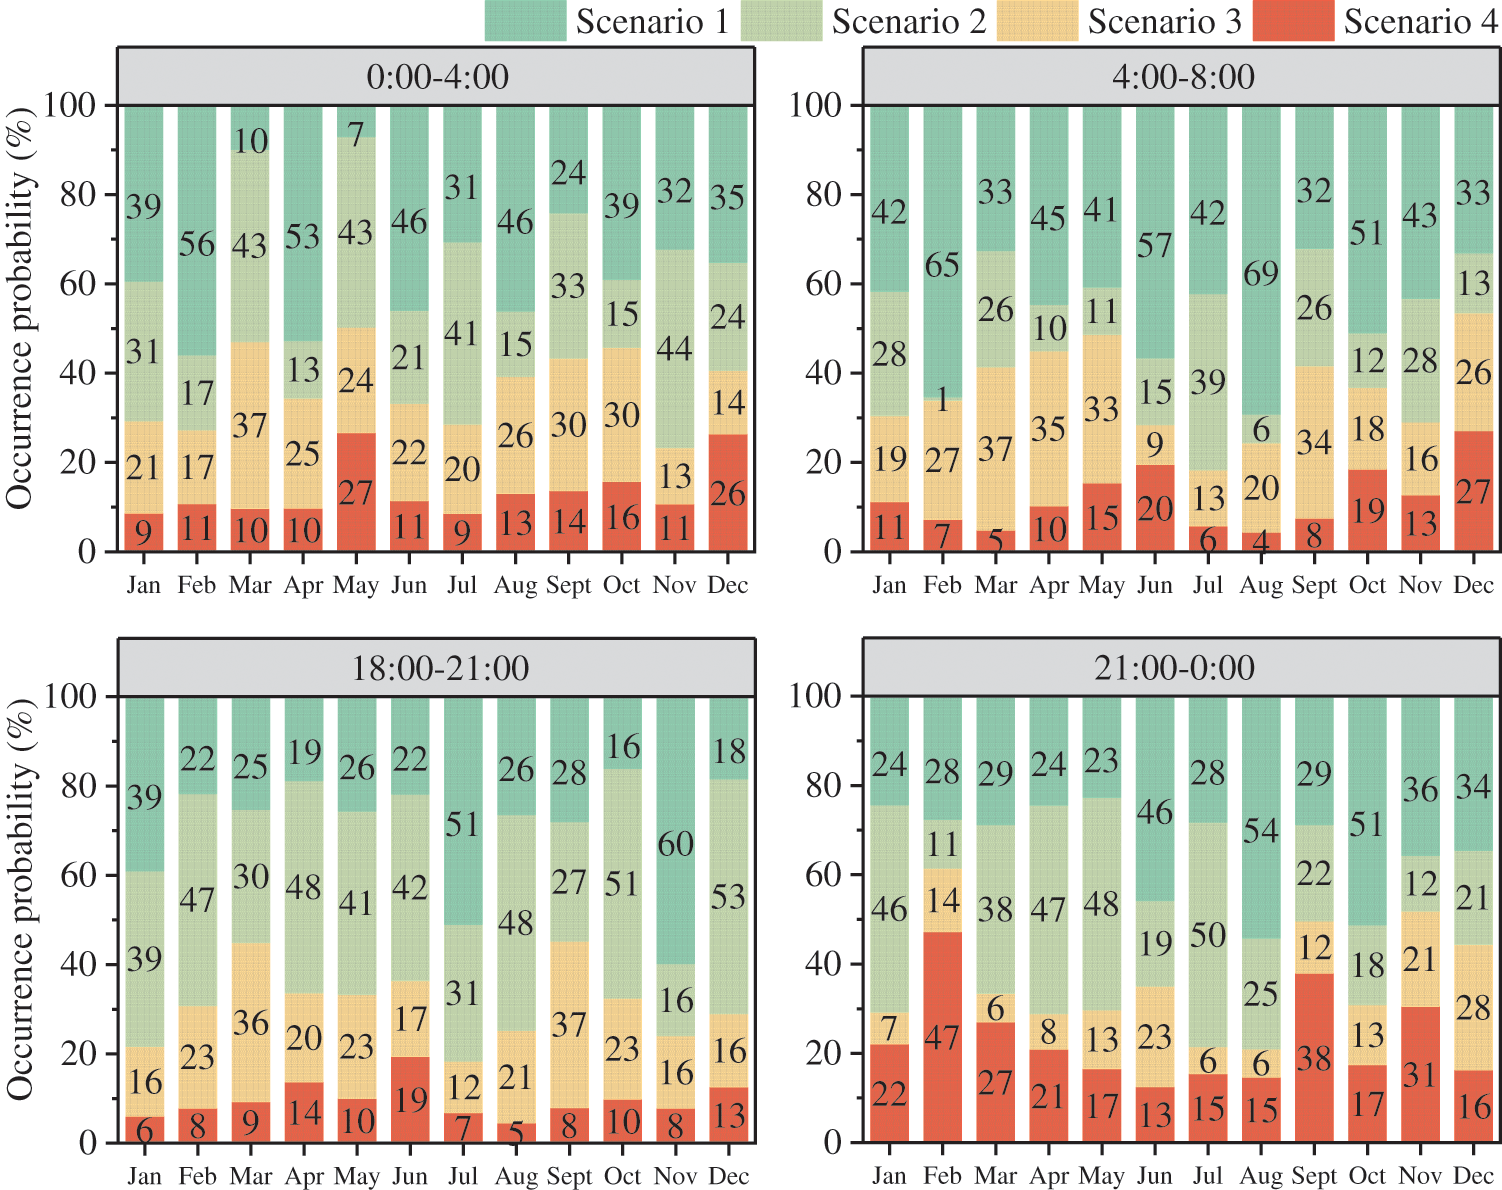
Figure 13: Time segment probability statistics of Scenarios 1 through 4
During the 0:00–4:00 period, the average probability of the occurrence of Scenario 3 was 9.33% higher than that of Scenario 4. Consequently, energy storage is prioritized for charging during this time interval.
Although the probability of occurrence of Scenario 3 is, on average, 11.83% higher than that of Scenario 4, the 4:00-8:00 period was determined to be a discharge period. This decision was made to ensure a suitable State of Charge (SOC) operating interval for the energy storage system, as the two adjacent periods are the charging periods.
Within the 18:00–21:00 period, the average probability of the occurrence of Scenario 3 was 11.92% higher than that of Scenario 4. Accordingly, LIPBESS should be operated with priority for charging.
During the 21:00–0:00 interval, Scenario 4 had an average probability of occurrence 10.17% higher than that of Scenario 3. Consequently, LIPBESS was prioritized for discharge operations.
Therefore, the LIPBESS operation strategy within the wind-PV-coal-storage multigeneration system followed a four-charge-four-discharge operation mode in one day. By aligning the charging and discharging operations based on the occurrence probabilities of different scenarios during specific time periods, the energy storage system can effectively adapt to the varying demands of the system and enhance the overall load regulation capabilities within the power supply periods.
To address the issue of one-way lockout in the single LIPBESS operation mode, a solution was proposed by configuring a second set of LIPBESS with complementary operation modes. This resulted in the establishment of a wind-PV-coal-storage operation mode with dual-battery storage. The configuration and operating modes of the dual-battery storage system are listed in Table 1.
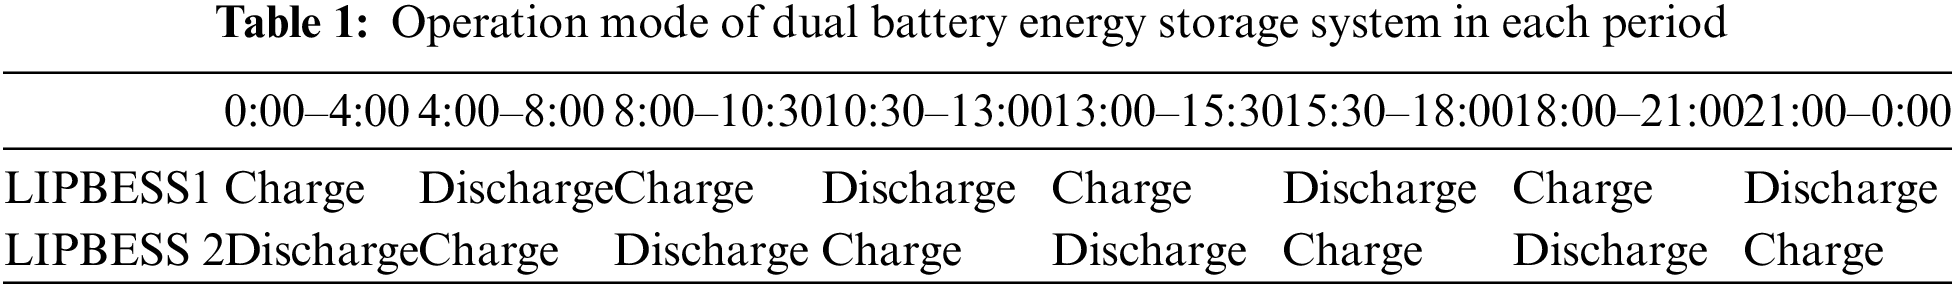
By introducing a second set of LIPBESS with complementary operation modes, the energy storage system gained increased flexibility and versatility. The dual-battery storage system enables bidirectional charging and discharging operations, which helps mitigate the limitations and constraints associated with the single LIPBESS mode of operation. This approach enhances the overall performance and capabilities of the energy storage system in the wind-PV-coal storage operation mode.
4.2 Energy Storage Configuration of Wind-PV-Coal-Storage Multi-Power Generation System
The optimal configuration of LIPBESS was determined based on the operation strategy of the wind-PV-coal storage multi-power generation system. The addition of LIPBESS was shown to improve the load evaluation qualification rate of the system, and this qualification rate further improved with an increase in the energy storage capacity, as depicted in Fig. 14.
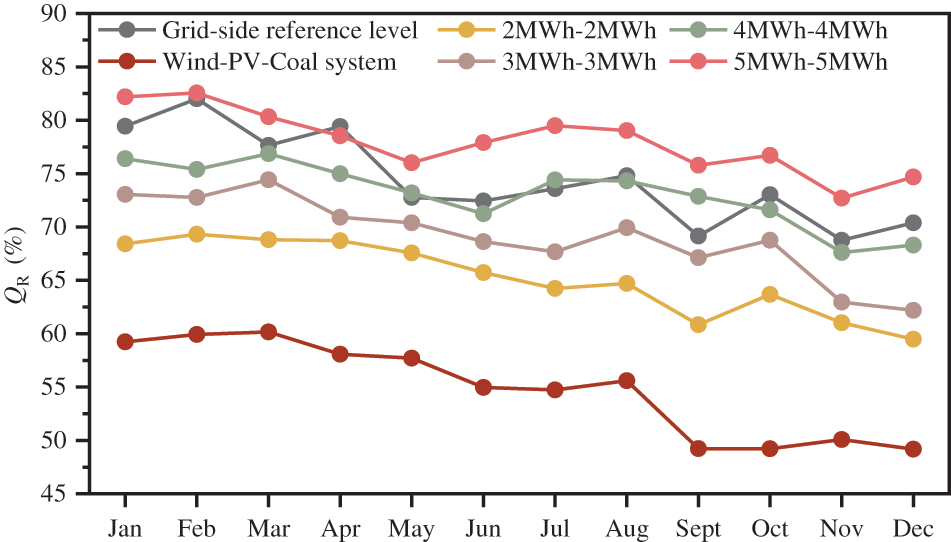
Figure 14: The qualified rate of multi-power generation under each LIPBESS capacity
When the capacity of the dual storage system was configured at 5 MWh, the average monthly load qualified rate of the multi-power generation system reached a level comparable to the grid-side reference level. This demonstrates that the wind-PV-coal storage multi-power generation system with the configured LIPBESS capacity can adequately satisfy the stability requirements of the grid.
To determine the optimal capacity of LIPBESS, the PSO algorithm was utilized based on an objective function. Through this optimization process, the optimal LIPBESS capacity was calculated to be 5.24–4.88 MWh. This capacity ensures the highest performance and efficiency of the LIPBESS within the established operation mode of the wind-PV storage multi-power generation system.
The load evaluation qualification rate of the wind-PV-coal storage multi-power generation system is presented in Fig. 15. A comparison with the wind-PV-coal system without storage revealed that the load evaluation qualification rate of the wind-PV-coal multi-generation system increased by an average of 23.59% per month. These results demonstrated that the wind-PV-coal storage multi-power generation system achieves an annual operating effect that meets the grid-side benchmark level, indicating improved performance and reliability.
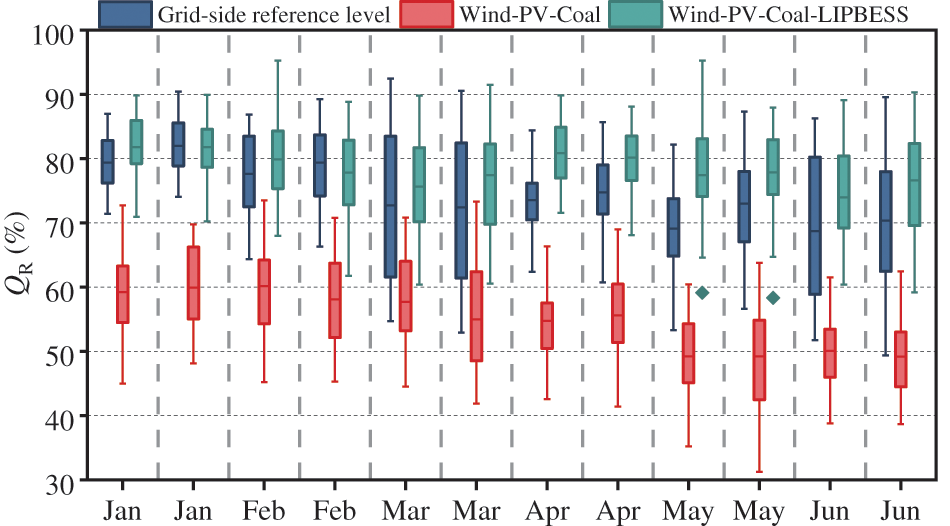
Figure 15: The qualified rate of wind-PV-coal-storage multi-power generation system
Furthermore, when compared to the renewable energy storage operation mode discussed in reference [30], the capacity requirements for LIPBESS in this study were significantly lower. The operating model, which couples renewable energy and storage, requires 12.36 MWh of LIPBESS to accommodate 50 MW of wind and 7.52 MWh of LIPBESS to accommodate 50 MW of PV. By using the operation mode that combines the CFPP in this study, the LIPBESS capacity was reduced by 49.1%.
The wind-PV-coal storage multi-power generation system with LIPBESS has several advantages over other energy storage operation modes. These advantages include improved load evaluation qualification rates, reduced LIPBESS capacity requirements, and lower construction costs. These advantages contribute to the economic viability and feasibility of the system.
This study investigated a wind-PV-coal-storage multi-power generation system and draws the following conclusions:
(1) Through the scenario division of the power supply process, the basic adjustment scenarios in the system load regulation process and the impact of each scenario on the load regulation were revealed.
(2) To improve the flexibility of system load regulation, a LIPBESS was added to assist in regulating the system load, and a wind-PV-coal-storage multi-power generation system operation mode was constructed. The LIPBESS operation strategy for dual-battery energy storage was developed based on the charging and discharging priorities of the energy storage system for each basic scenario.
(3) The optimal LIPBESS capacity of the wind-PV-coal-storage multi-power generation system was 5.24–4.88 MWh, as calculated by PSO. The annual operation of the system reached the grid-side benchmark level and met the grid-side stability requirements. Compared to the renewable energy storage operation mode, using the operation mode of the coupled CFPP in this study, the LIPBESS capacity was reduced by 49.1%.
This study contributes to understanding the potential benefits and operational characteristics of an integrated wind-PV-coal-storage multi-power generation system. These findings provide insight into the ability of the system to effectively utilize different energy sources, optimize energy storage operations, and meet grid-side stability and power demand requirements.
Acknowledgement: None.
Funding Statement: The study was supported by the Natural Science Foundation of China (Grant Nos. 52076079, 52206010), Natural Science Foundation of Hebei Province, China (Grant No. E2020502013), the Fundamental Research Funds for the Central Universities (2021MS076, 2021MS079).
Author Contributions: The authors confirm contribution to the paper as follows: study conception and design: Zhongping Liu, Enhui Sun, Lei Zhang, Jiahao Shi; data collection: Jiahao Shi, analysis and interpretation of results: Jiahao Shi, Enhui Sun, Qi Wang, Jiali Dong; draft manuscript preparation: Zhongping Liu, Enhui Sun, Lei Zhang, Jiahao Shi. All authors reviewed the results and approved the final version of the manuscript.
Availability of Data and Materials: The data that support the findings of this study are available from Sinopec Star Co., Ltd., Zhengzhou. Restrictions apply to the availability of these data, which were used under licence for this study. Data are available from Sinopec Star Co., Ltd. with the permission of Zhongping Liu.
Conflicts of Interest: The authors declare that they have no conflicts of interest to report regarding the present study.
References
1. Stevens, K. A., Tang, T., Hittinger, E. (2023). Innovation in complementary energy technologies from renewable energy policies. Renewable Energy, 209, 431–441. [Google Scholar]
2. Pali, B. S., Vadhera, S. (2021). A novel approach for hydropower generation using photovoltaic electricity as driving energy. Applied Energy, 302, 117513. [Google Scholar]
3. Gao, X., Liu, W., Fu, M., Zhang, S., Zhang, S. et al. (2021). Strategy decision game approach of the combination generation system of wind and thermal power participating in the direct power purchase transaction of large consumer. Electric Power Systems Research, 200, 107463. [Google Scholar]
4. Zhang, J., Lu, J., Pan, J., Tan, Y., Cheng, X. et al. (2022). Implications of the development and evolution of global wind power industry for China–An empirical analysis is based on public policy. Energy Reports, 8, 205–219. [Google Scholar]
5. Wang, L., Lin, J., Dong, H., Wang, Y., Zeng, M. et al. (2023). Demand response comprehensive incentive mechanism-based multi-time scale optimization scheduling for park integrated energy system. Energy, 270, 126893. [Google Scholar]
6. Lei, K., Chang, J., Wang, X., Guo, A., Wang, Y. et al. (2023). Peak shaving and short-term economic operation of hydro-wind-PV hybrid system considering the uncertainty of wind and PV power. Renewable Energy, 215, 118903. [Google Scholar]
7. Li, Y., Janik, P., Schwarz, H. (2023). Prediction and aggregation of regional PV and wind generation based on neural computation and real measurements. Sustainable Energy Technologies and Assessments, 57, 103314. [Google Scholar]
8. Maciel, L. B. B., Viola, L., de Queiróz Lamas, W., Silveira, J. L. (2023). Environmental studies of green hydrogen production by electrolytic process: A comparison of the use of electricity from solar PV, wind energy, and hydroelectric plants. International Journal of Hydrogen Energy, 48, 05334. [Google Scholar]
9. Duan, J., Liu, F., Yang, Y., Jin, Z. (2022). Two-stage flexible economic dispatch for power system considering wind power uncertainty and demand response. Energy Sources, Part A: Recovery, Utilization, and Environmental Effects, 44, 650–668. [Google Scholar]
10. Fan, L., Peng, T., Yu, H., Ding, L., Zhang, Y. et al. (2023). Optimization method of flexible response capability of power system with limited cost constraint. Energy Reports, 9, 1069–1076. [Google Scholar]
11. Wang, D., Xie, X., Zhou, Y., Han, X., Si, L. (2023). Improved coordinated control strategy of coal-fired power units with coupled heat storage based on supercritical carbon dioxide cycle. Applied Thermal Engineering, 230, 120850. [Google Scholar]
12. Song, F., Mehedi, H., Liang, C., Meng, J., Chen, Z. et al. (2021). Review of transition paths for coal-fired power plants. Global Energy Interconnection, 4, 354–370. [Google Scholar]
13. Gonzalez-Salazar, M., Poganietz, W. R. (2021). Evaluating the complementarity of solar, wind and hydropower to mitigate the impact of El Niño Southern Oscillation in Latin America. Renewable Energy, 174, 453–467. [Google Scholar]
14. Yong, Q., Tian, Y., Qian, X., Li, X. (2022). Retrofitting coal-fired power plants for grid energy storage by coupling with thermal energy storage. Applied Thermal Engineering, 215, 119048. [Google Scholar]
15. Huang, Y., Masrur, H., Lipu, M. S. H., Howlader, H. O. B., Gamil, M. M. et al. (2023). Multi-objective optimization of campus microgrid system considering electric vehicle charging load integrated to power grid. Sustainable Cities and Society, 98, 104778. [Google Scholar]
16. Nayak, S. R., Khadanga, RK., Arya, Y., Panda, S., Sahu, P. R. et al. (2023). Influence of ultra-capacitor on AGC of five-area hybrid power system with multi-type generations utilizing sine cosine adopted dingo optimization algorithm. Electric Power Systems Research, 223, 109513. [Google Scholar]
17. Lei, C., Wang, Q., Zhou, G., Bu, S., Zhou, N. et al. (2023). Probabilistic wind power expansion planning of bundled wind-thermal generation system with retrofitted coal-fired plants using load transfer optimization. International Journal of Electrical Power & Energy Systems, 151, 109145. [Google Scholar]
18. Sun, E., Shi, J., Zhang, L., Ji, H., Zhang, Q. et al. (2023). An investigation of battery energy storage aided wind-coal integrated energy system. Energy Engineering, 120, 1583–1602. [Google Scholar]
19. Dong, Y., Jiang, X., Ren, M., Yuan, J. (2019). Environmental implications of China’s wind-coal combined power generation system. Resources, Conservation and Recycling, 142, 24–33. [Google Scholar]
20. Pradhan, S. K., Sekaran, S., Chakraborty, I. (2023). A novel non-isolated high gain multiport DC-DC converter for integrating fuel cell/solar PV and battery energy storage system. Energy Sources, Part A: Recovery, Utilization, and Environmental Effects, 45, 1994–2012. [Google Scholar]
21. Ni, F., Li, K. (2023). The full load voltage compensation strategy in capacity configuration of UPQC integrated PV-BESS. Energy Engineering, 120, 1203–1221. [Google Scholar]
22. Kayal, P., Kumar, B., Samantary, S. (2022). Allocation of battery energy storage in power distribution network: Placement, sizing, and scheduling. Energy Sources, Part A: Recovery, Utilization, and Environmental Effects, 44, 7544–7563. [Google Scholar]
23. Zhao, F., Li, Y., Zhou, X., Wang, D., Wei, Y. et al. (2023). Co-optimization of decarbonized operation of coal-fired power plants and seasonal storage based on green ammonia co-firing. Applied Energy, 341, 121140. [Google Scholar]
24. Fida, K., Imran, K., Mehmood, K. K., Bano, P., Abusorrah, A. et al. (2023). Optimal battery energy storage system deployment from perspectives of private investors and system operators for enhancing power system reliability. Journal of Energy Storage, 69, 107882. [Google Scholar]
25. Al-falahi, M. D. A., Jayasinghe, S. D. G., Enshaei, H. (2017). A review on recent size optimization methodologies for standalone solar and wind hybrid renewable energy system. Energy Conversion and Management, 143, 252–274. [Google Scholar]
26. Shi, M., Zhang, J., Ge, X., Fei, J., Tan, J. et al. (2023). Power optimization cooperative control strategy for flexible fast interconnection device with energy storage. Energy Engineering, 120, 1885–1897. [Google Scholar]
27. Shandong Energy Regulatory Office (2021). Shandong power auxiliary service market operating rules (In Chinese). http://sdb.nea.gov.cn/tzgg/content_6873 (accessed on 20/06/2023). [Google Scholar]
28. Hannan, M. A., Wali, S. B., Ker, P. J., Rahman, M. S., Mansor, M. et al. (2021). Battery energy-storage system: A review of technologies, optimization objectives, constraints, approaches, and outstanding issues. Journal of Energy Storage, 42, 103023. [Google Scholar]
29. Wang, Y., Pan, R., Liu, C., Chen, Z., Ling, Q. (2018). Power capability evaluation for lithium iron phosphate batteries based on multi-parameter constraints estimation. Journal of Power Sources, 374, 12–23. [Google Scholar]
30. Teleke, S., Baran, M. E., Bhattacharya, S., Huang, A. Q. (2010). Rule-based control of battery energy storage for dispatching intermittent renewable sources. IEEE Transactions on Sustainable Energy, 1, 117–124. [Google Scholar]
Cite This Article
 Copyright © 2024 The Author(s). Published by Tech Science Press.
This work is licensed under a Creative Commons Attribution 4.0 International License , which permits unrestricted use, distribution, and reproduction in any medium, provided the original work is properly cited.
 Downloads
 Citation Tools