
 Submit a Paper
 Propose a Special lssue
 Open Access
ARTICLE

A Novel Defender-Attacker-Defender Model for Resilient Distributed Generator Planning with Network Reconfiguration and Demand Response
Nanjing Power Supply Company, State Grid Jiangsu Electric Power Co., Ltd., Nanjing, 210019, China
* Corresponding Author: Wenlu Ji. Email:
Energy Engineering 2024, 121(5), 1223-1243. https://doi.org/10.32604/ee.2024.046112
Received 19 September 2023; Accepted 01 December 2023; Issue published 30 April 2024
 View Full Text
 Download PDF
Abstract
To improve the resilience of a distribution system against extreme weather, a fuel-based distributed generator (DG) allocation model is proposed in this study. In this model, the DGs are placed at the planning stage. When an extreme event occurs, the controllable generators form temporary microgrids (MGs) to restore the load maximally. Simultaneously, a demand response program (DRP) mitigates the imbalance between the power supply and demand during extreme events. To cope with the fault uncertainty, a robust optimization (RO) method is applied to reduce the long-term investment and short-term operation costs. The optimization is formulated as a tri-level defender-attacker-defender (DAD) framework. At the first level, decision-makers work out the DG allocation scheme; at the second level, the attacker finds the optimal attack strategy with maximum damage; and at the third level, restoration measures, namely distribution network reconfiguration (DNR) and demand response are performed. The problem is solved by the nested column and constraint generation (NC&CG) method and the model is validated using an IEEE 33-node system. Case studies validate the effectiveness and superiority of the proposed model according to the enhanced resilience and reduced cost.Keywords
Nomenclature
| Abbreviations | |
| MT | Micro turbine |
| MG | Microgrid |
| DRP | Demand response program |
| DNR | Distribution network reconfiguration |
| DSO | Distribution system operator |
| DAD | Defender-attacker-defender |
| EDS | Electrical distribution system |
| HILP | High-impact and low-probability |
| CL | Critical load |
| IL | Interruptible load |
| I/C | Interruptible/curtailable |
| Indices and Sets | |
| S | Index of PV output scenarios |
| Index and set of timeslots | |
| Index and set of buses | |
| Set of interruptible loads (ILs) | |
| Index and set of lines | |
| Set of all parent buses and child buses of the jth bus | |
| Index and set DR blocks of the the ith load | |
| Parameters and Constants | |
| Load shedding cost | |
| Cost of DR block d of the the ith load | |
| Line attack budget | |
| Maximum number of DGs to be installed | |
| Capacity cost for installing a DG unit | |
| Fixed cost for installing a DG unit | |
| Maintenance cost of DG unit after a HILP event | |
| Real, reactive power of the peak load at the jth bus | |
| Resistance, inductance of line (i, j) | |
| Thermal limit of the line (i, j) | |
| Maximal, minimal bus voltage | |
| Rated voltage | |
| Proportion of the dth DR block in the ith load | |
| Large numbers | |
| Variables | |
| Binary variable whether the ith bus is installed with a DG (1) or not (0) | |
| Rated power of the DG at the ith bus | |
| Binary variable indicating whether a branch is on outage (0) or not (1) | |
| Power flow of line (i, j) in the virtual network | |
| Active/reactive power flow of the line (i, j) at time t | |
| Active/reactive DG power output the jth bus at time t | |
| Critical load shedding at the jth bus at time t | |
| Interruptible load reduced by DRP of the jth bus at time t | |
| The used portion of DR block d of the load j | |
| Voltage magnitude of the jth bus at time t | |
| Binary variable indicating whether a line (i, j) is attacked (1) or not (0) | |
| Binary variable indicating whether the jth bus is chosen as a root bus (1) or not (0) | |
| Binary variable indicating whether the jth bus is at one end of one/more faulted lines (1) or not (0) | |
| Binary variable indicating whether a line (i, j) is available (1) or not (0) | |
The electrical distribution system (EDS) provides an economical, safe, and reliable means of energy supply. However, the traditional EDS is to vulnerable high-impact and low-probability (HILP) events, such as extreme weather events, cyberattacks, and natural disasters [1]. These HILP events can cause blackouts, and significantly impact power consumption. For example, in 2016, a tornado hitting Jiangsu province, China, caused a power outage for 135,000 households [2]; hurricane Alma hit Florida in 2017, affecting ~6.7 million households [3]; and the Great East Japan earthquake of 2011, resulted in a power outage for >4 million households for 7–9 days [4]. These heavy losses revealed the vulnerability of EDS. Extensive forecasting efforts have projected a total annual loss of >$480 billion due to electric power outages in the US between the years 2080–2099 [5]. Therefore, the development of a resilient EDS, capable of quickly recovering to an acceptable operational state after HILP events has become a research hotspot.
Previous studies on DG suggested optimal siting and sizing decisions to minimize the long-term, cumulative EDS operating costs [6,7]. These approaches are focused on normal operating conditions and use load profiles or renewable energy output as the stochastic variables. In contrast, resilience-oriented DG planning aims to minimize the load-shedding amount under stochastic N-K fault scenarios. Shi et al. [8,9] formulated resilience-oriented DG planning as a two-stage stochastic optimization problem. Firstly, the system planner deploys an optimal DG siting and sizing plan. Subsequently, the system operator minimizes load shedding through an outage management strategy. Khaledi et al. proposed [10] a three-stage resilience-oriented battery energy storage system allocation method, which combines distributed energy resource integration, intentional islanding, and identifying consumer preferences into the resilient operation. An emergency generator planning coordinated with a distribution line hardening method was proposed by Yu et al. [11], modeling the HILP events (especially typhoons) in both temporal and spatial dimensions. However, these studies primarily focus on applying investment strategies (e.g., DG planning and line-hardening) to enhance the EDS resilience, while not fully considering operational measures, such as DNR and DRP.
1.3 Distribution Network Reconfiguration (MG Formation)
Generally, EDS resilience enhancing approaches include line-hardening [12], installing DGs [13], and DNR [14]. Although they can improve EDS reliability and resilience, an excessive number of DGs will increase both the economic burden and EDS control complexity [15]. The development of MG and active distribution systems provide alternate approaches to constructing a EDS. Chen et al. [16] proposed a post-disaster EDS reconstruction model based on DGs and remote switches. After a failure, non-fault areas are reconstructed into multiple MGs, and the DGs within these MGs secure the continuous power supply to consumers. Lei et al. [17] proposed a double-layer optimization of the deployment and dispatch of mobile emergency vehicles, which are connected to form an MG with the local generators. Farzin et al. [18] adopted a hierarchical management of energy resources in the MG to minimize post-disaster power failure losses. Ding et al. [19] proposed an MG formation method considering DG master-slave operations as a mixed-integer second-order conic programming (MISOCP) model, where the islanding operation considers the dispatchable DG as the master unit with voltage control, and renewable sources as the slave units.
The demand response (DR) technology has rapidly developed with the improvements in the power market. During a HILP event, a serious supply-demand imbalance is created within the MG. DRP can reduce or shift energy consumption by affecting the user behavior, to relieve the pressure of power supply and accelerate the load recovery process [20]. Effective load recovery is well-known to improve EDR resilience. Therefore, DRPs are non-negligible operational resources to increase EDS resilience [21]. Based on the step-type elastic load curve modeling method, Gan et al. [22] applied ten price levels to express the relationship between the incentive price and the user load response. However, in practical situations, price-based DRPs exhibit poor controllability, making it difficult to quickly respond to sudden HILP events [23]. In comparison, incentive-based DRPs require the consumers to sign a treaty with the distribution system operator (DSO) in advance. As a result, to get compensation rather than punishment, users are more willing to participate in the DRP [24]. Specifically, in emergencies (e.g., unplanned outages and sudden changes in renewable energy sources), the utilities perform incentive-based DRP actions, frequently referred to as emergency demand response (EDR) [25,26]. Sasaki et al. [25] proposed a power imbalance preventive control method for unpredictable events, with EDR to mitigate the sudden power changes in the renewable energy output. Osman et al. [26] utilized a cost-effective emergency DRP that can be applied after severe extreme disasters to help decrease the total load-shedding amount and minimize the total outage penalty cost.
1.5 Tri-Level Robust Optimization Approach
HILP events may cause random damages to the EDS components, making it difficult to pin-point the part of the EDS that will face power outages. Therefore, to deal with such uncertainty, stochastic programming [14,27] and robust optimization (RO) [28–31] have been widely applied. However, stochastic programming generally requires random variables to obey a given probability distribution. In comparison, RO does not require a random variable probability distribution function, thus avoiding the establishment of component vulnerability models in HILP events. As an extension of the classical RO, the DAD structure clearly represents the defender-attacker interaction. Firstly, the DSO (defender) deploys an optimal planning strategy (typically, an investment strategy, such as line-hardening or DG allocation). Secondly, a HILP event (attacker) maximizes the load shedding amount under the given number of opponent faults (i.e., the worst-case N-K scenario is selected). Finally, the DSO minimizes the load shedding through operational resources. Yuan et al. [29,31] proposed a two-stage RO solved by the column and constraint generation (C&CG) method, where the first stage determines the line hardening and DG allocation and the second stage minimizes the load shedding. However, they neglected the function of the operational resources in resilience improvement. Lin et al. [32] considered the DNR and proposed a DAD structure, but it failed to take advantage of the DRP. This suggests that we need DGs with larger capacities to support critical loads (CLs) during HILP events, which will certainly increase the economic burden.
1.6 Gaps in Previous Works and Our Contributions
Previous works typically focused on investment strategies to improve EDS resilience. However, the operational flexibility of the EDS to provide resilience against HILP events has not been thoroughly explored in these studies. In practicality, there can often be strict limitations to the investment budget. Therefore, operational resources have great potential for improving EDS resilience without additional equipment and investment. In this study, we propose a resilience-oriented tri-level robust planning model that considers the EDS operational resources. The main contributions of this paper are summarized as follows:
1) We propose a novel tri-level robust planning model that innovatively coordinates DG allocation and operational resources and vastly expands the traditional DAD model. Unlike the previous studies, this model considers both DG siting and sizing as assuming the same size of all DGs might result in surplus or insufficient power supply.
2) From the system operation perspective, topology reconfiguration (MG formation) and DRP are both performed to achieve a novel EDS restoration algorithm as the defense mechanism. In this manner, the system defenders can be prepared for the worst-case attacks while considering the operational resources to achieve cost-effective and efficient resilience planning.
3) To deal with the 0/1 variables caused by fault uncertainty and network reconfiguration, we employed the nested column and constraint generation (NC&CG) algorithm to separate the original problem into upper and lower-level problems, with the latter further divided into a main and a sub-problem. The upper-level problem determines the allocation of DGs while the lower-level problem finds the worst case caused by the HILP events.
This paper is organized as follows: Section 2 describes the mathematical formulation of the problem; Section 3 introduces the solution; Section 4 discusses the case studies; and Section 5 presents conclusions.
Previous works generally considered only the EDS operational cost. However, we primarily considered resilience to extreme events for DG siting and sizing, i.e., the investment cost was taken into account. Thus, the whole problem was formulated as a typical DAD model based on three stages [33]: planning (DG siting and sizing), attack, and operation (DNR and DRP). The objective function can be expressed as follows:
where
where
Since the RO model adapts to the uncertainty of line failures caused by HILP events, the key lies in constructing uncertainty sets. We assumed that as long as the line is being attacked, it will remain unavailable until the fault is cleared. In addition, if the line is not attacked, its final switching state will be determined by the DSO.
where the
If a line is not attacked (
Here, Eq. (4) indicates no more than k branches are on outage simultaneously and the k-value can be selected according to the branch outage samples.
The linearized DistFlow model used to represent the power flow constraints in this study is described as follows:
Here, the power flow balance is represented in Eq. (5). The power balance constraint considers the power injection at node i by substation and DGs to attend the in-service load after load curtailment and DRP. Note that we assumed that the reactive power demand following the active power demand variations considering a constant power factor
A radial graph is a connected graph without cycles (example in Fig. 1) [34]. Based on graph theory, it can be defined as a connected graph with n buses and n – 1 lines. Spanning tree [35,36] and single commodity flow (SCF) [19] are two effective methods to model the radial-topology constraints as a set of linear equations; we adopted the latter in this study.
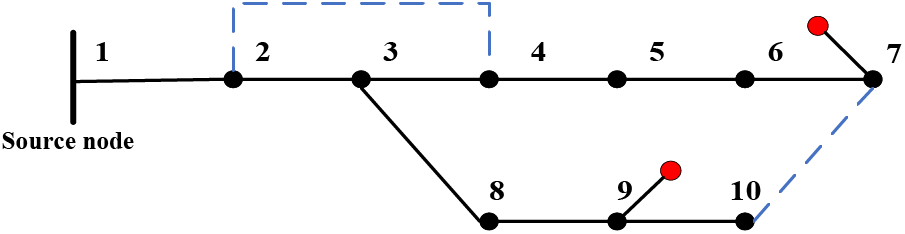
Figure 1: Schematic representation of a radial EDR network. The blue dashed line indicates normally opened tie lines and the red dots denote installed DGs
According to the SCF method, the graph is radial when it strictly satisfies the following two conditions: (a) the number of closed lines equals the number of buses minus the number of sub-graphs; and (b) connectivity of each sub-graph is guaranteed. We introduced a fictitious network that has the same topology and group of switching status variables,
where
Here,
Here, Eq. (15) ensures that on the faulted lines, the fictitious power flow is maintained at 0. During the network reconfiguration process, the EDS contains three types of sub-graphs: (a) MGs installed with controllable DGs; (b) isolated islands experiencing power outages; and (c) buses supplied by the substation (Fig. 2).
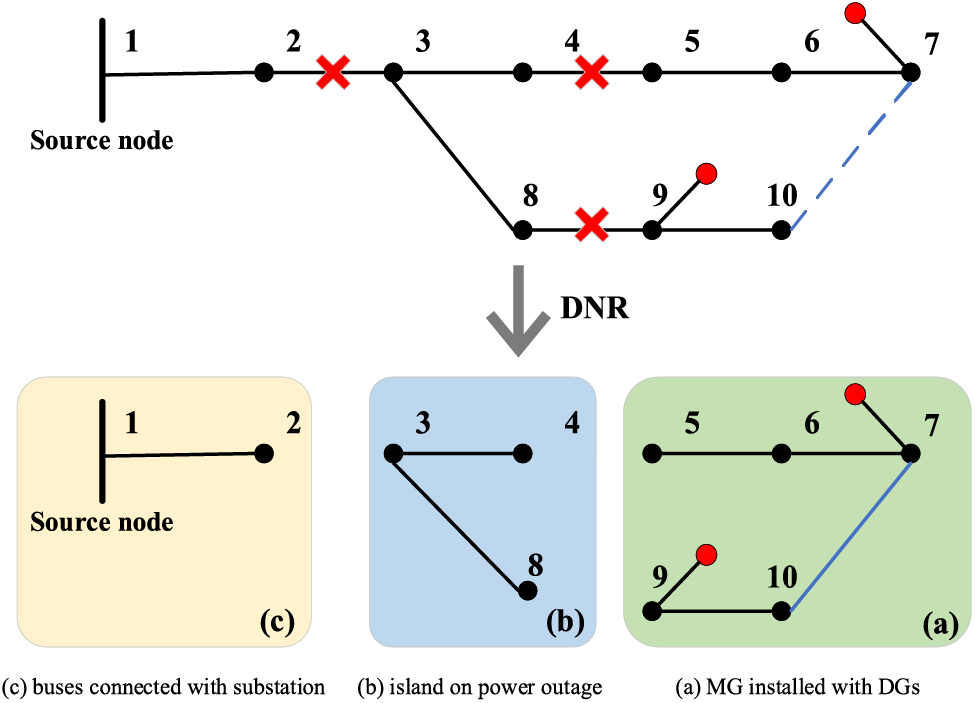
Figure 2: Types of sub-graphs contained in the EDS after DNR
One needs to identify the kind of bus that is qualified to be the source. Since the on-outage island is also counted as a type of sub-graph, we cannot simply consider the bus installed with DGs as the source bus. Thus, the bus at the end of any faulted line (
where
i.e., if
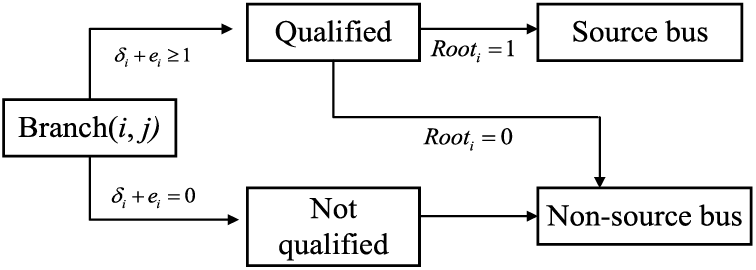
Figure 3: Source bus qualification logical diagram for the ith bus
When the ith bus qualifies (
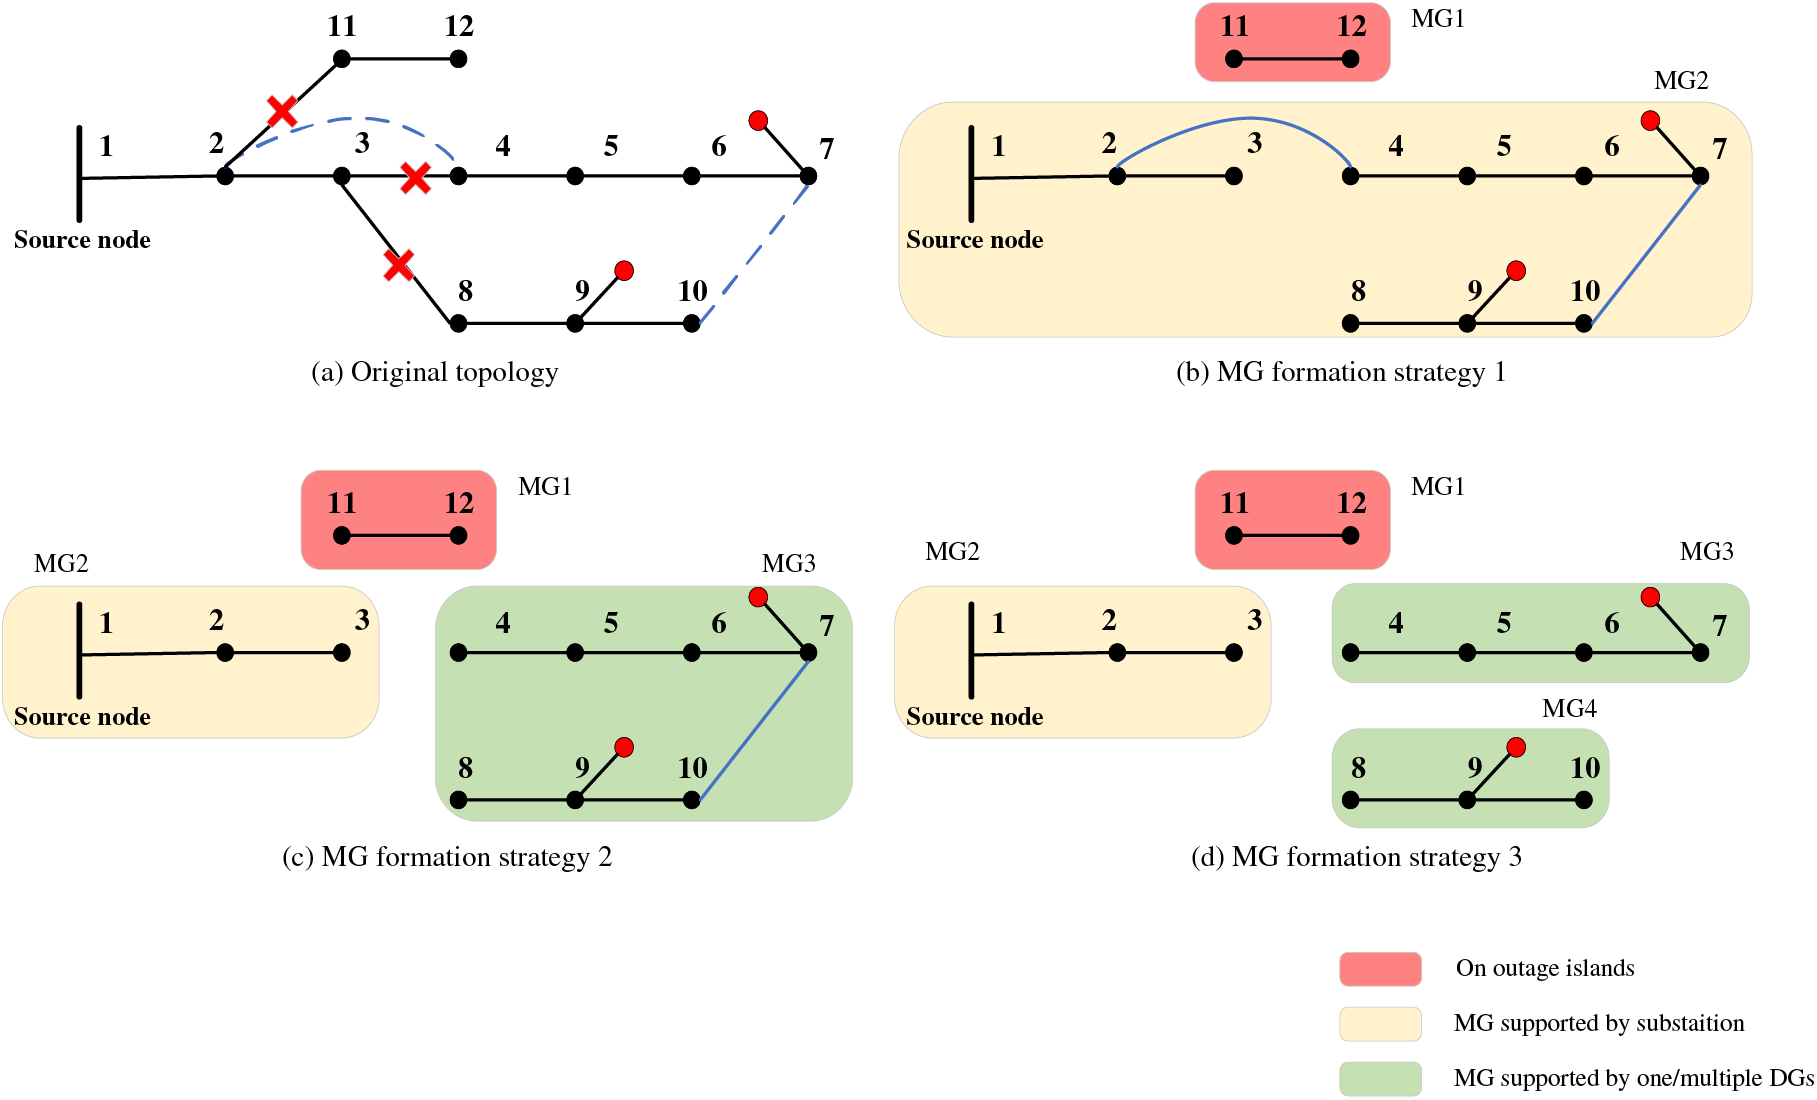
Figure 4: Schematic representation of the proposed DNR (MG formation) strategy
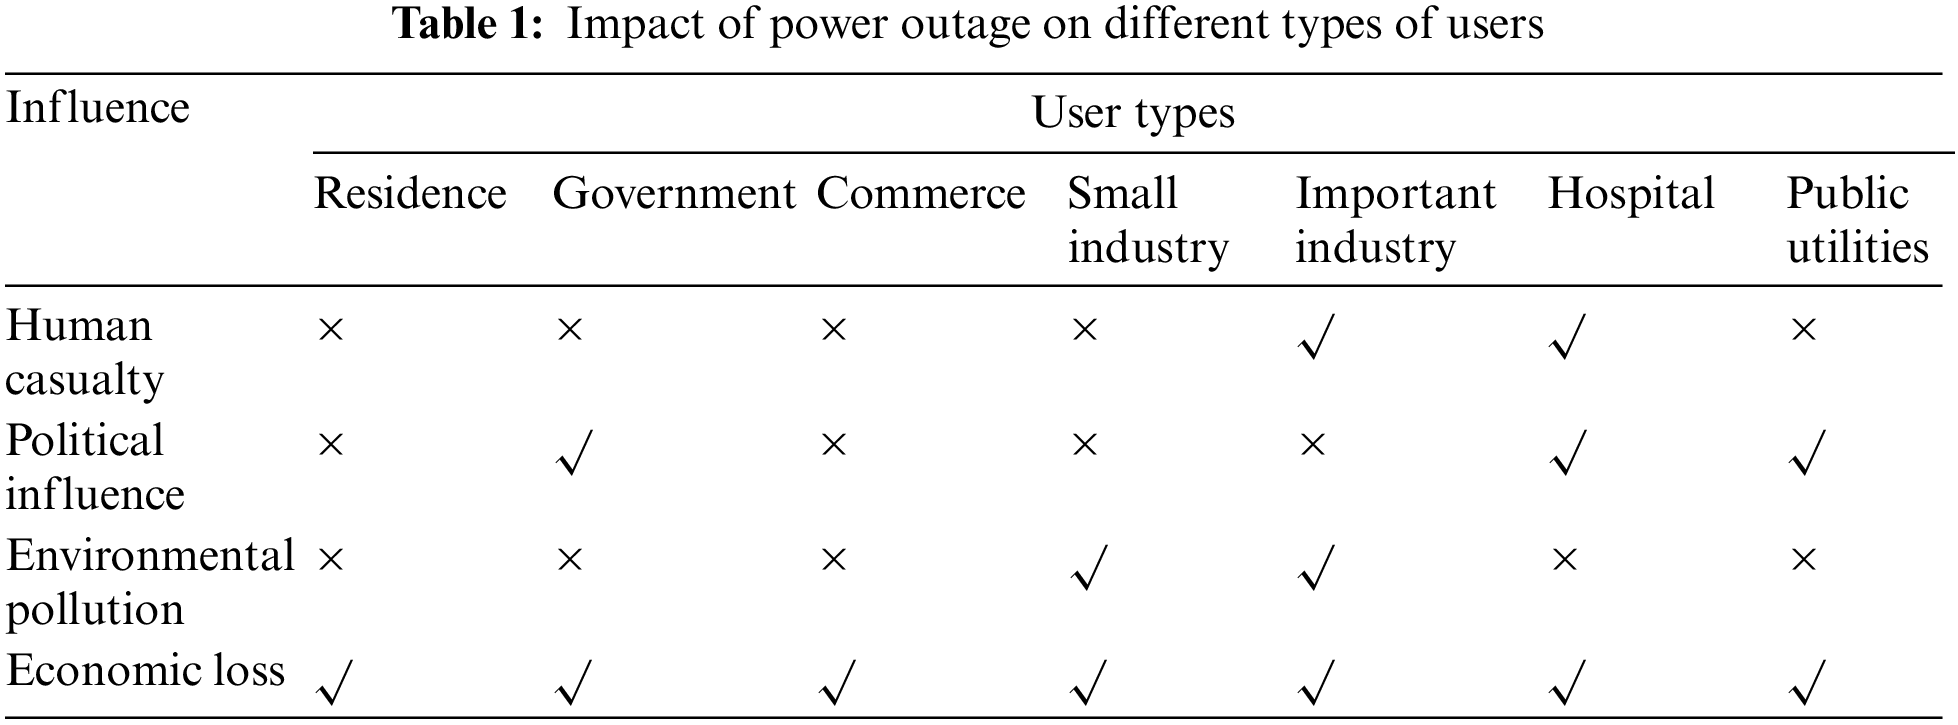
In the EDS, the priority of each load is different, which implies that curtailing the CL with higher priority can incur tremendous economic loss and even human casualties. Therefore, every possible effort should be made to secure a continuous power supply to the CL. In this study, we have identified two kinds of CLs, namely hospitals and important industries, which may incur human casualties if curtailed (Table 1). Other types of loads have also been identified, namely interruptible load (IL) and mixed load (containing a certain proportion of CL and IL).
Conventionally, there exist price-based and incentive-based DRPs [37]. In this study, we employed the latter as the goal was to improve EDS resilience [24], i.e., the EDR program [38]. We assumed that all the ILs have already signed a contract with the DSO, which allows it to curtail their loads during HILP events. Considering the different types and composition of each load, we adopted a stepped compensation mechanism (Fig. 5) [38]. The total load of a consumer is divided into several steps, and each step includes a specific percentage of the total load. Moreover, the compensation cost of the DPR ascends in each step, i.e., the first 10% of the load is much cheaper than the last 10% of the load curtailed by the DPR. For example, in the supermarket, the air conditioning load (D1 in Fig. 5) has a higher priority to participate in the DRP than the refrigerated load (D4 in Fig. 5). The curtailment of refrigeration load will spoil the stored items, which would lead to more economic loss than up on curtailing the air conditioning load.
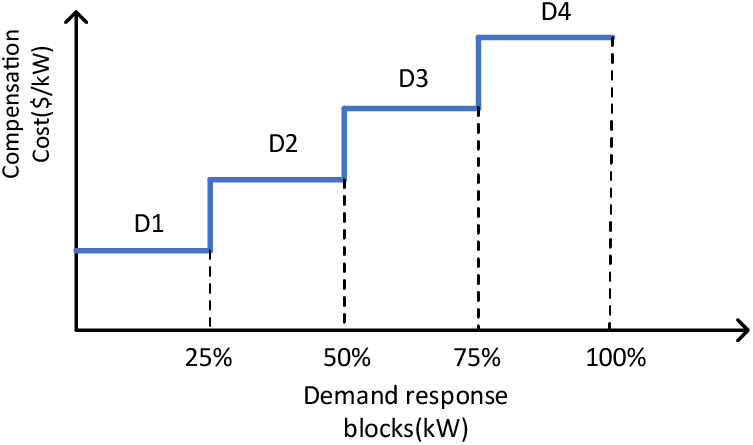
Figure 5: DRP stepped compensation mechanism
The DRP stepped compensation mechanism can be expressed as Eqs. (18)–(20).
where
The final tri-level model was a mixed integer linear programming (MIP) problem that could be solved by commercial solvers, such as Gurobi, Cplex, and so on. The model can be expressed as:
The C&CG algorithm is generally applied to solve robust problems [39]. As mentioned previously, the traditional C&CG method typically decomposes the problem into an upper- and a lower-level problem. However, in this study, the original problem cannot be split directly due to the introduction of additional integer variables into the topological constraints. Therefore, the lower-level problem was also treated as a two-level C&CG problem: the main problem solved the attack strategy with maximum damage when the topology was fixed, while the sub-problem solved the optimal operational strategy when the attack strategy was known. To sum up, the problem is decomposed into a tri-level structure, including the upper-level problem, the lower-level main problem, and the lower-level sub-problem. We applied the NC&CG algorithm [40] to solve the proposed tri-level problem.
To simplify the notation, all the power flow variables
Thus, the whole problem can be reformulated as:
The objective of the upper-level problem was to find the optimal DG planning strategy, using the given attack strategy created by the lower-level problem as the input. By defining the auxiliary variable
where
The objective of the lower-level problem is to find the attack strategy with the maximum damage under the given DG planning strategy of the upper-level problem. To deal with the integer variables of the topology constraints, the main problem finds the optimal attack plan given a set of fixed topologies, and the sub-problem determines the optimal operation strategies given the attack strategy.
a) Main problem
The lower-level main problem can be expressed as:
According to dual theory, the inner min problem can be converted to its dual form (max problem). Thus, the lower-level main problem can be re-expressed as:
where
where
b) Sub-problem
After obtaining the optimal attack strategy, the lower-level sub-problem minimizes the operating cost using DNR and DRP. This process can be expressed as:
After solving the lower-level sub-problem, the newly formed topological structure is returned to the lower-level master problem for another iteration. Once the lower-level problem converges, the optimal attack strategy is returned to the upper-level problem in the next iteration, as shown in Fig. 6.
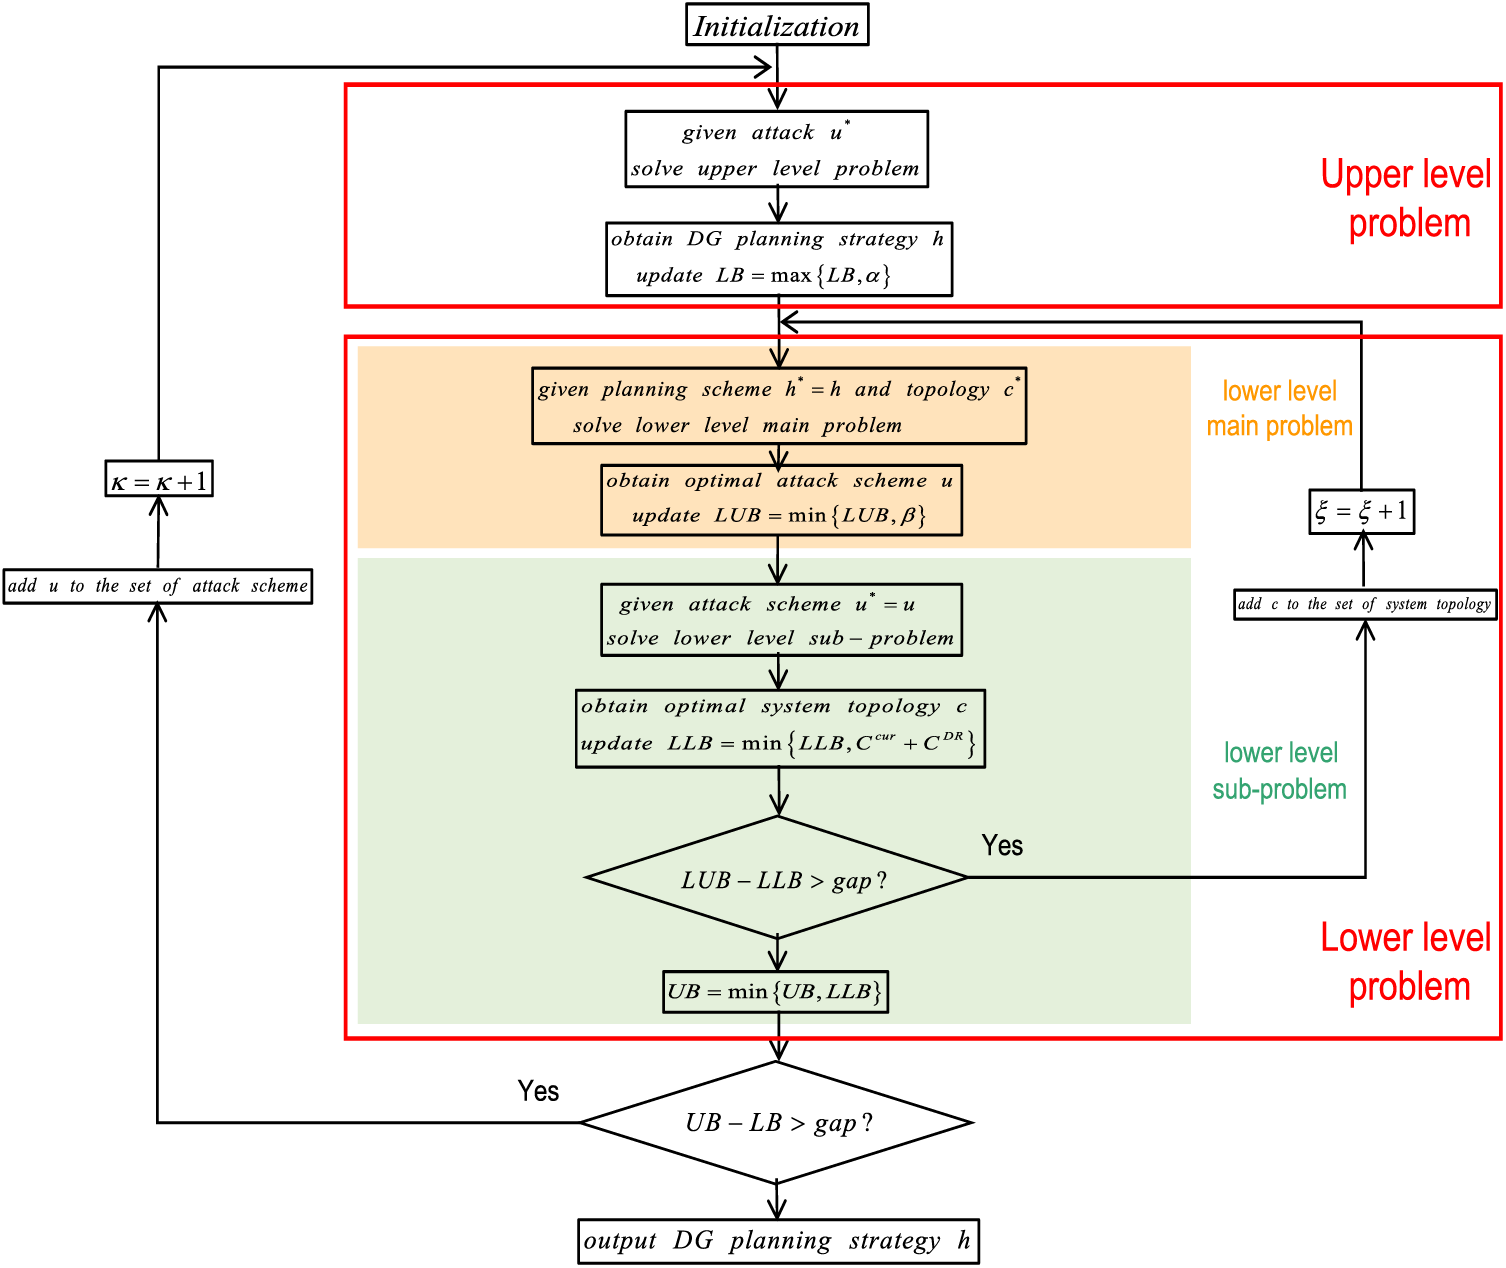
Figure 6: Flowchart of the proposed NC&CG algorithm
The NC&CG initialization process is explained as follows (Fig. 6): we set the (i) lower bound of the upper-level problem as
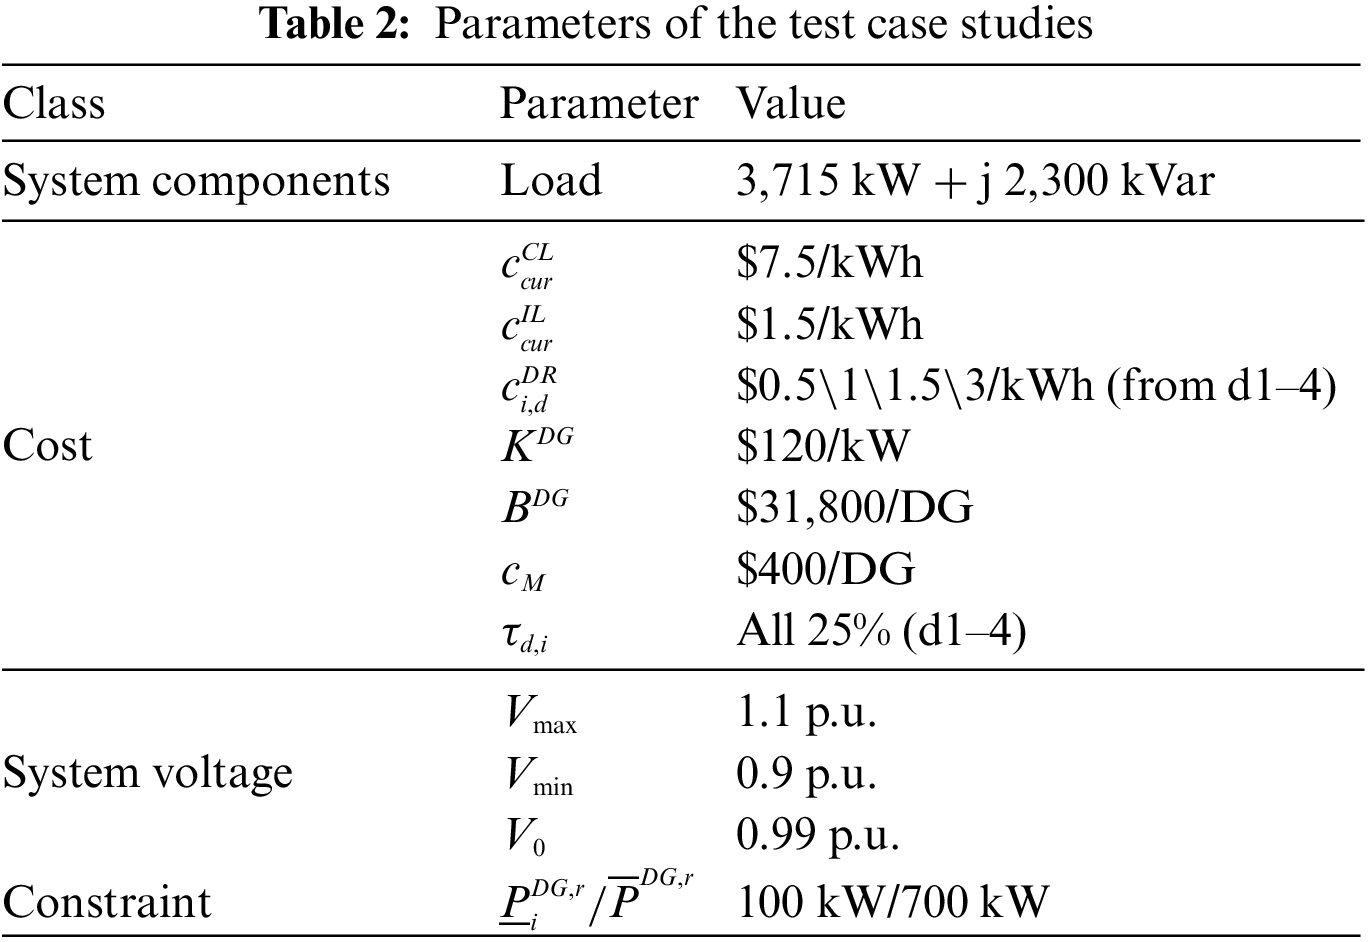
The IEEE 33-bus system was used to test the performance of the proposed method (Fig. 7). This is an EDS with a main transformer, 37 branches (32 normally-closed lines and 5 normally-open tie-lines), and 33 load buses. The power base value was 1.0 MVA and
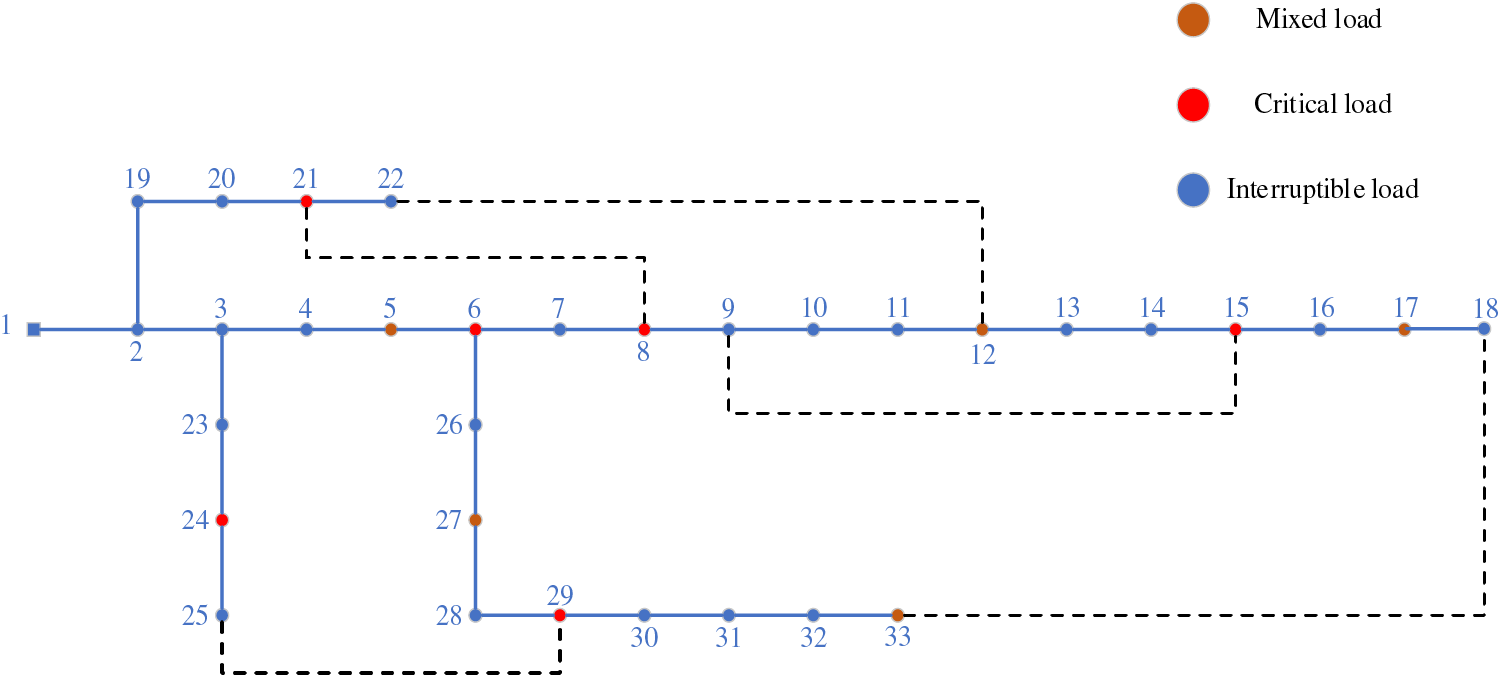
Figure 7: IEEE 33-bus system employed in the case studies
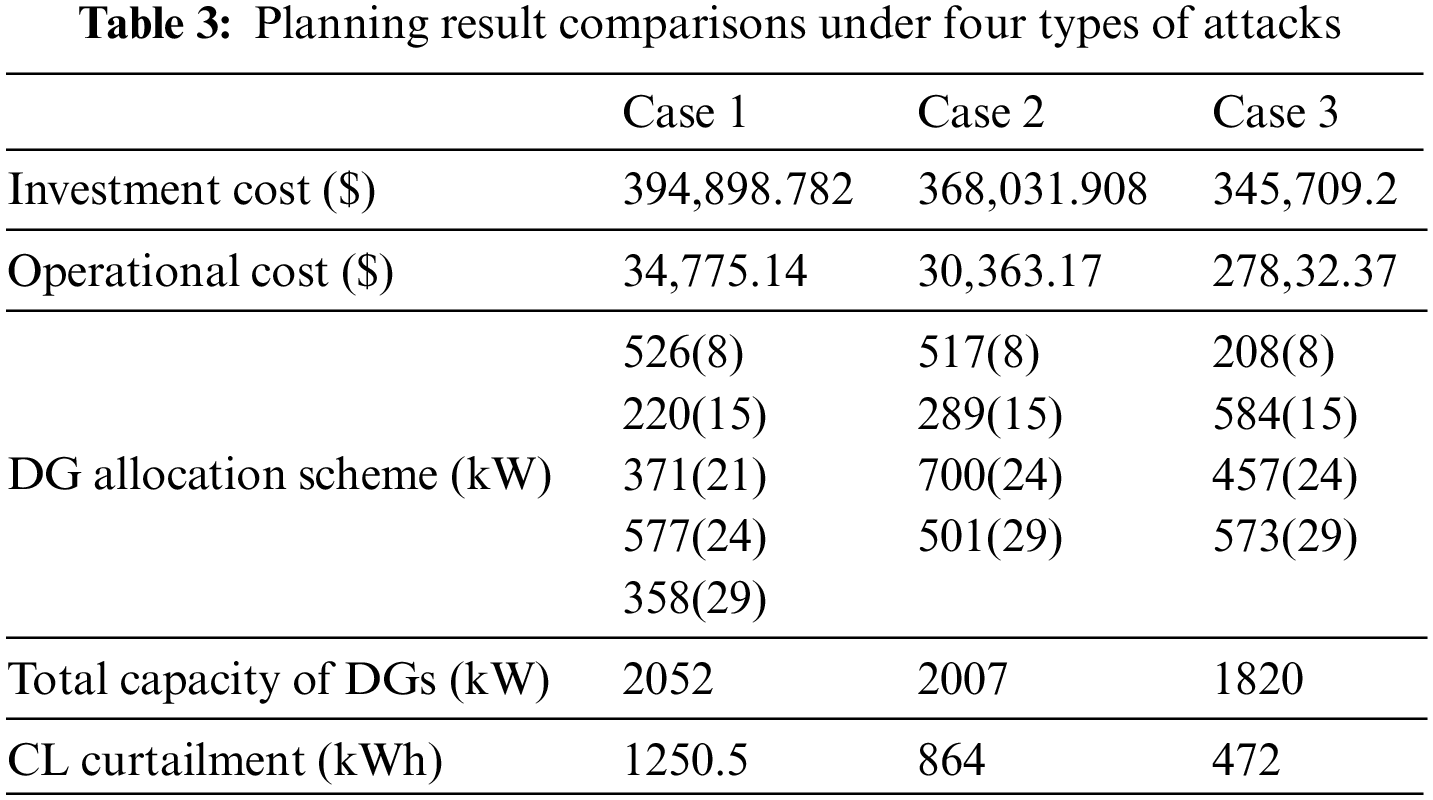
By using our proposed DAD model considering the coordination of DNR and DRP, we obtained the planning results for the IEEE 33-bus EDS (Table 3). To reflect the necessity of operational strategies to improve EDS resilience, we performed a comparative analysis of three cases based on four line faults.
Case 1: without using any operational strategies;
Case 2: only considering DNR;
Case 3: considering a coordination of both DNR and DRP.
Note that we used CL curtailment as the indicator for resilience assessment. After implementing the proposed model (Case 3), the CL curtailment was reduced by 62.26% and 45.37% compared to Case 1 and Case 2, respectively. This indicated that the proposed planning model significantly enhanced the EDS resilience. Moreover, with the introduction of operational resources, the operating and total investment costs of installing DGs can be significantly reduced. Compared with the existing models only considering DNR (Case 2), the advantage of our planning model considering the coordination of DNR and DRP allows for an initial investment decision that is less conservative, which has profound implications for scenarios with a limited investment budget.
4.3 Effect of Operational Strategy as a Defense Mechanism
The following is a detailed analysis of the effects of the two operational resources (DNR and DRP) on the EDS resilience improvement:
1) DNR (MG formation) defense mechanism
We obtained the topology of the IEEE 33-node EDS for all three cases after the optimal DG and attack strategy planning scheme (Table 3). When the number of DG hits the limit (
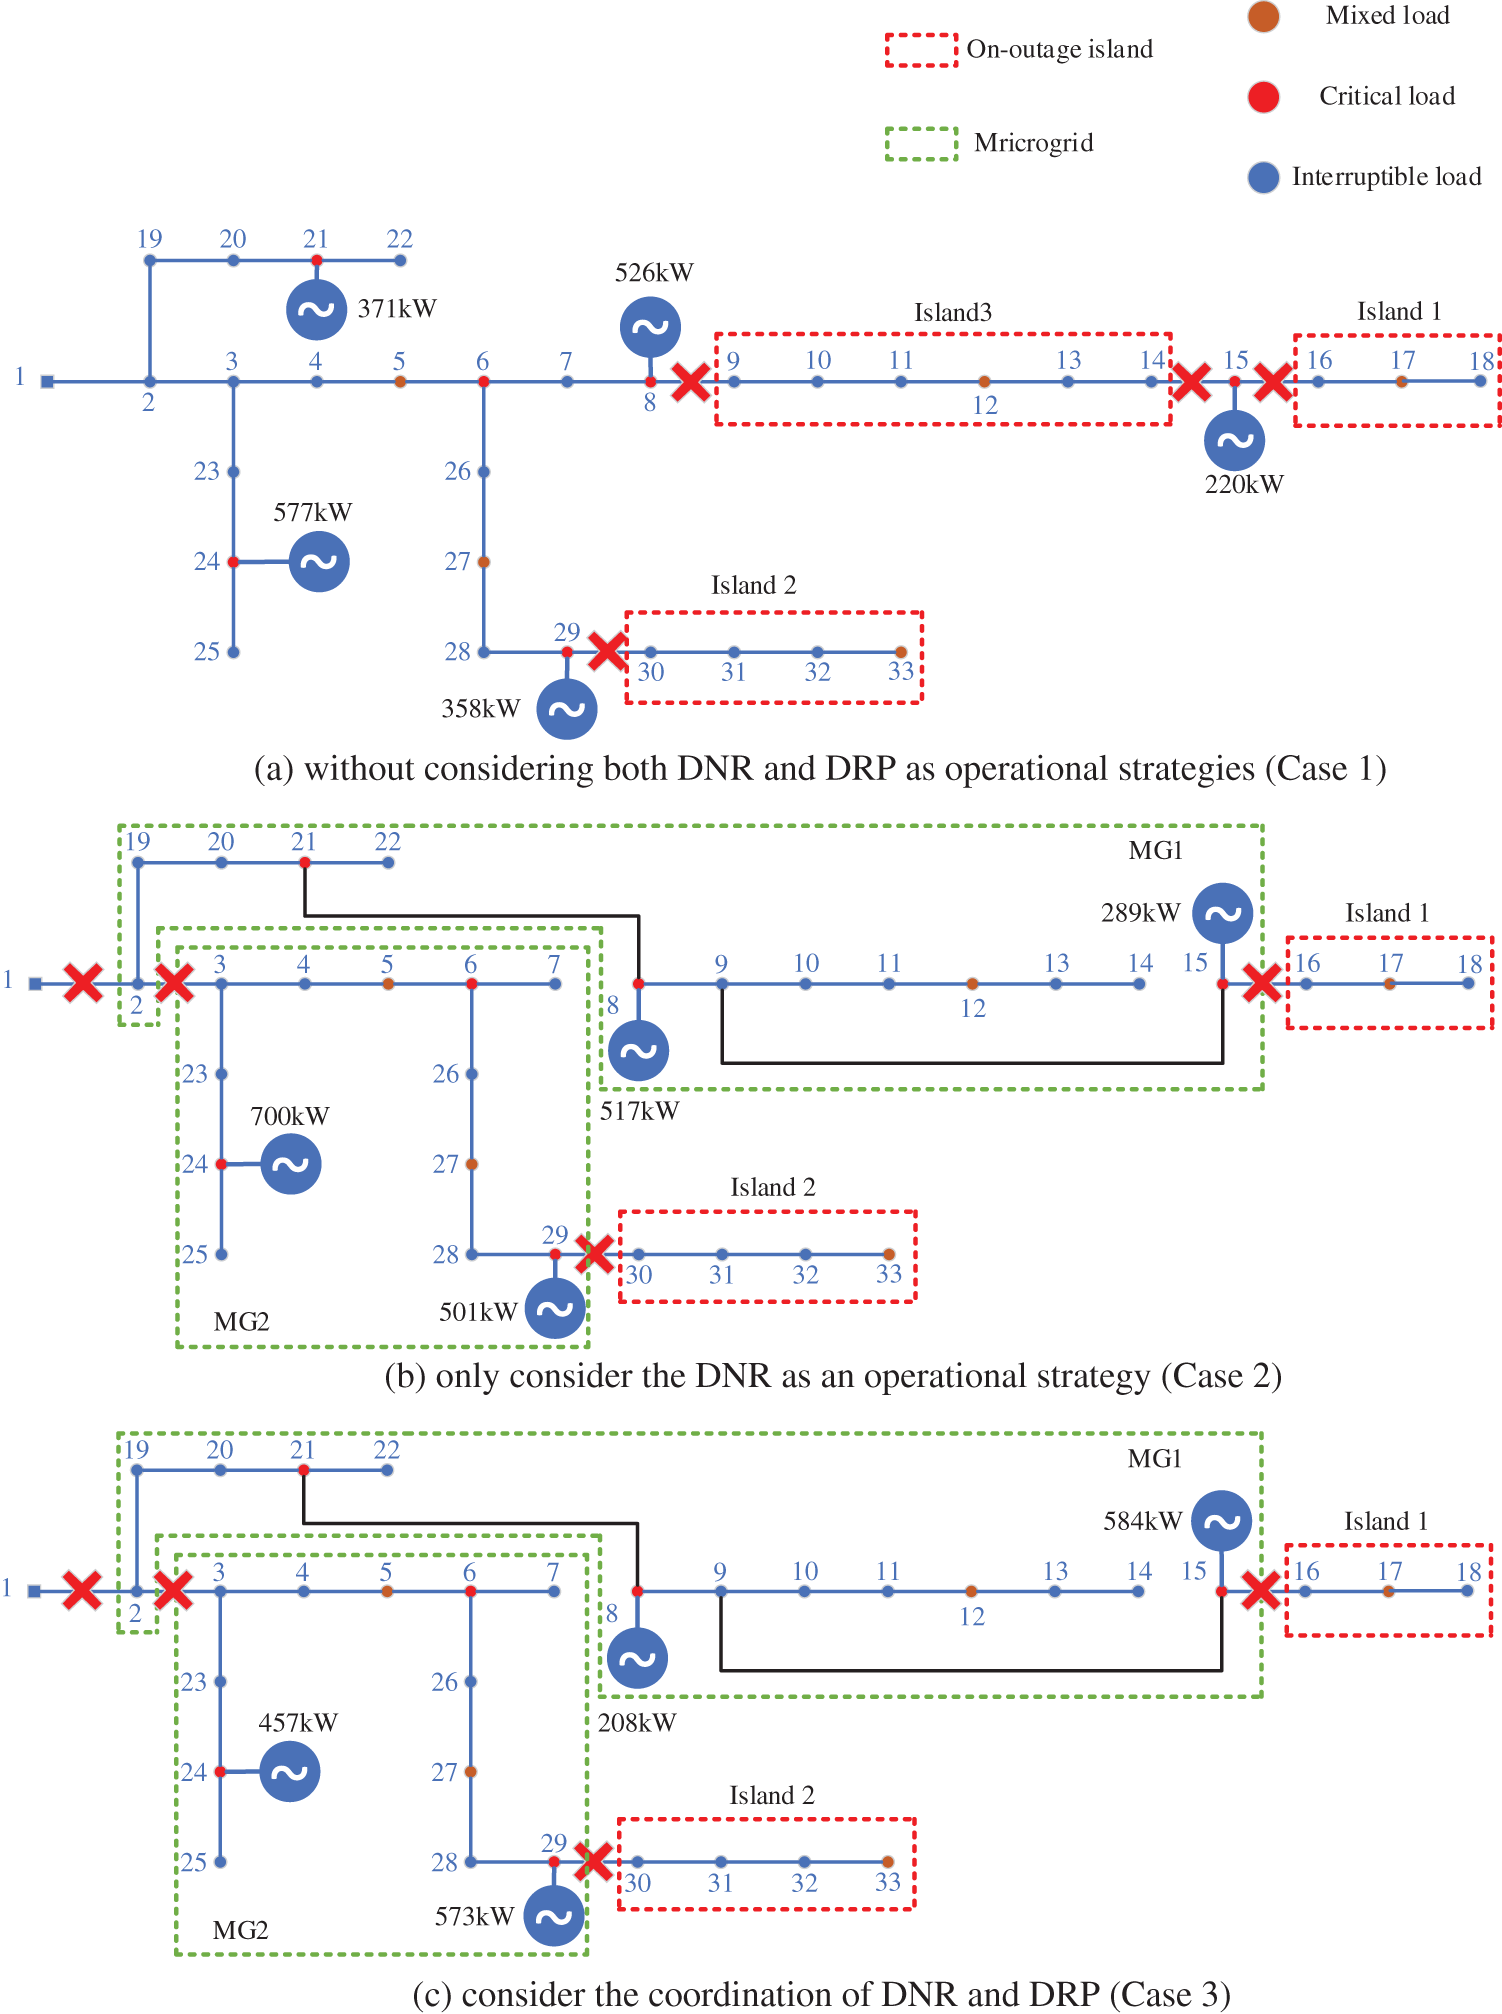
Figure 8: System topology for (a) Case 1, (b) Case 2, and (c) Case 3 after the optimal DG and attack strategy planning scheme. The red dashed line represents the on-outage island and the green dashed line marks the temporary MGs with one or more DGs
However, in all three cases, there always were two identical on-outage islands (Islands 1 and 2 in Figs. 8a–8c). As the IL proportion in these two areas was relatively large, the extra investment brought in by the additional DG was far greater than the loss caused by the load shedding. Therefore, it was not appropriate to deploy additional DGs in this case. Moreover, these two islands were present at the end of the system with no additional tie-lines to provide a backup power supply path. If the attacker cuts two lines, i.e., (15, 16) and (29, 30), the entire area would face a full load shedding. The above two reasons make these two areas fragile to attacks. This phenomenon demonstrated the requirement for the DNR. The ability of the EDS to resist and recover from HILP events can be further enhanced by reasonably adding tie-lines.
2) DNR-DRP defense mechanism
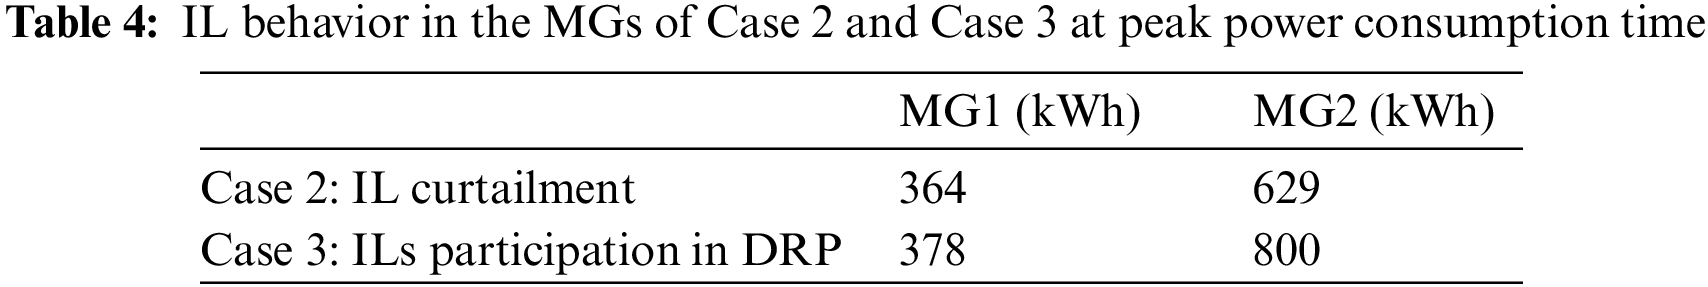
Once the DRP operational resource was added to Case 2, the obtained DG siting strategy of the new case was the same as that of Case 2 (Table 3 and Fig. 8). This phenomenon was expected, as the DRP does not change the initial load distribution and DGs are still prioritized on CLs. The function of the DRP is to adjust user power consumption behavior by offering financial compensation after a fault occurrence. Therefore, the DG siting and attack strategies in both cases were unchanged. The only difference was that in the temporary MGs (MG1 and MG2 in Figs. 8b and 8c) supported by the DGs, the IL users actively participated in the DRP, which greatly reduced the total load demand at peak power consumption time. As shown in Table 4, more ILs actively participated in the DRP in both MGs in Case 3 than those curtailed passively in Case 2. Thus, due to the decrease in power supply pressure, the DG capacity in the MG can be relatively reduced. Furthermore, the cost of cutting the IL power supply by signing a contract in advance would be much lower than that of cutting it without any warning, thereby further reducing the operating cost.
To sum up, the DRP mitigates the power supply-demand imbalance within isolated islands during extreme events. It is known that the EDS operator can curtail part of the loads by offering comparatively lower financial incentives (compared to the cost of abrupt load shedding without prior notification). For curtailing the same amount of load, the compensation cost of DRP is significantly lower compared to that of abrupt load shedding. Consequently, this alleviates the power supply stress in islands, enabling DGs within these isolated areas to concentrate more on the CLs, greatly enhancing EDS resilience. Simultaneously, the inclusion of DRP reduces the need for DGs within isolated islands to maintain large capacities in an attempt to support maximally both CLs and ILs, thereby mitigating the investment pressure. When further considering DRP as an operational strategy in Case 3, compared with Case 2, EDS resilience significantly improved, with CL curtailment decreasing from 872 to 472 kWh. Furthermore, with the decreased demand for the total DG capacity from 2007 to 1820 kW, the pressure on investment costs also reduced from $30,363.172 to $27,832.37 (Table 3).
Fig. 9 shows the convergence of the upper and lower bounds in Case 3. Due to the existence of binary variables in the optimization model and the characteristic of the NC&CG algorithm to increase constraints in the iterative process, it took 7 iterations and 18,311 s to find the optimal solution. However, considering that the model proposed in this paper is a long-term planning solution rather than a short-term scheduling one, the calculation time is within the acceptable range.
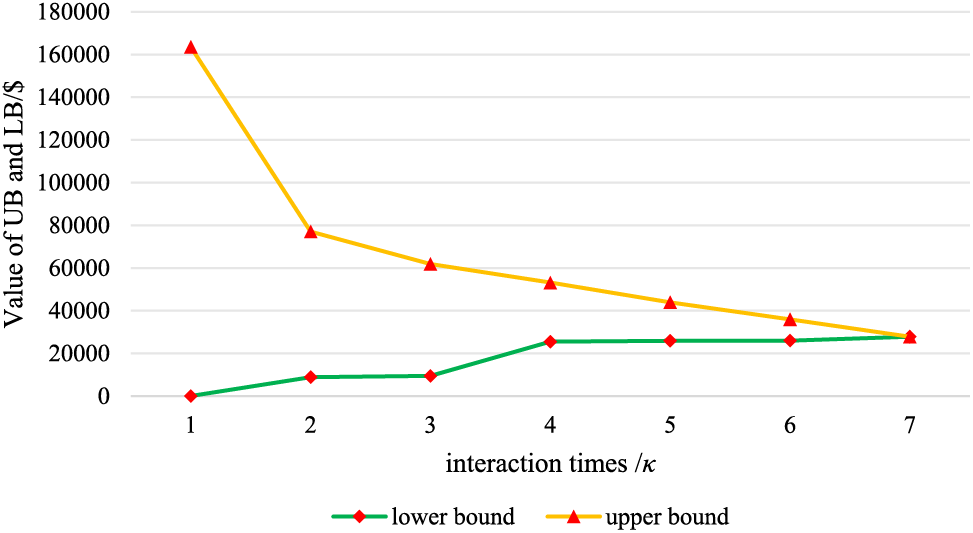
Figure 9: Upper and lower bound convergence for Case 3
This study proposes a DG allocation strategy based on a two-stage tri-level DAD model. In the first stage, we consider both DG sitting and sizing as an investment strategy to improve EDS resilience. In the second stage, DNR and DRP operational strategies are fully utilized to guarantee a continuous power supply to the CLs. To deal with massive binary variables brought in by DNR, an NC&CG algorithm is adopted to solve the proposed model.
The numerical results show that the DG allocation scheme is strongly influenced by DNR and DRP. After the introduction of these strategies, the investment and operating cost of the system are greatly reduced while the power supply to the CLs is largely guaranteed. With the development of a smart distribution system, besides the traditional investment strategies, operational resources play an increasingly critical role in improving EDS resilience.
This study only considers the stochasticity of the attack. Therefore, in future studies, the stochasticity of the load and renewable DG output should be further explored.
Acknowledgement: We sincerely appreciate the guidance provided by Senior Engineer Yingqi Liao throughout the manuscript preparation process.
Funding Statement: This work was supported by the Technology Project of State Grid Jiangsu Electric Power Co., Ltd., China (J2022160, Research on Key Technologies of Distributed Power Dispatching Control for Resilience Improvement of Distribution Networks).
Author Contributions: The authors confirm their contribution to the paper as follows: study conception and design: N. Ma; data collection: T. Tu; analysis and interpretation of results: W. Ji; draft manuscript preparation: N. Ma. All authors reviewed the results and approved the final version of the manuscript.
Availability of Data and Materials: All the parameters used in the case study are listed in Table 2, and the base date of the IEEE 33-bus system can be found in [41].
Conflicts of Interest: The authors declare that they have no conflicts of interest to report regarding the present study.
References
1. Haggi, H., Song, M., Sun, W. (2019). A review of smart grid restoration to enhance cyber-physical system resilience. 2019 IEEE Innovative Smart Grid Technologies, pp. 4008–4013. Chengdu, China. [Google Scholar]
2. Bie, Z., Lin, Y., Li, G. (2017). Battling the extreme: A study on the power system resilience. Proceedings of the IEEE, 105(7), 1253–1266. [Google Scholar]
3. Dehghanian, P., Aslan, S., Dehghanian, P. (2018). Maintaining electric system safety through an enhanced network resilience. IEEE Transactions on Industry Applications, 54(5), 4927–4937. [Google Scholar]
4. IEC (2014). Microgrids for disaster preparedness and recovery. https://www.iec.ch/basecamp/microgrids-disaster-preparedness-and-recovery-electricity-continuity-plans-and-systems (accessed on 25/07/2023). [Google Scholar]
5. United States Government Accountability Office (2021). Electricity grid resilience: Climate change is expected to have far-reaching effects and DOE and FERC should take actions. https://www.gao.gov/products/gao-21-423t (accessed on 07/10/2023). [Google Scholar]
6. Li, Y., Feng, B., Li, G., Qi, J., Zhao, D. et al. (2018). Optimal distributed generation planning in active distribution networks considering integration of energy storage. Applied Energy, 210, 1073–1081. [Google Scholar]
7. Li, Y., Feng, B., Wang, B., Sun, S. (2022). Joint planning of distributed generations and energy storage in active distribution networks: A bi-level programming approach. Energy, 245, 123226. [Google Scholar]
8. Shi, Q., Li, F., Kuruganti, T., Olama, M. M., Dong, J. et al. (2021). Resilience-oriented DG siting and sizing considering stochastic scenario reduction. IEEE Transactions on Power Systems, 36(4), 3715–3727. [Google Scholar]
9. Poudyal, A., Poudel, S., Dubey, A. (2023). Risk-based active distribution system planning for resilience against extreme weather events. IEEE Transactions on Sustainable Energy, 14(2), 1178–1192. [Google Scholar]
10. Khaledi, A., Saifoddin, A. (2023). Three-stage resilience-oriented active distribution systems operation after natural disasters. Energy, 282, 128360. [Google Scholar]
11. Yu, Z., Zou, G., Wu, L., Zhang, J., Li, Z. (2021). Optimal resilience enhancement strategy for power distribution system with line reinforcement and emergency generator placement. 2021 IEEE Sustainable Power and Energy Conference (iSPEC), pp. 1400–1405. Nanjing, China. [Google Scholar]
12. Tan, Y., Das, A., Arabshahi, P., Kirschen, D. (2018). Distribution systems hardening against natural disasters. IEEE Transactions on Power Systems, 33(6), 6849–6860. [Google Scholar]
13. Shen, Y., Gu, C., Ma, Z., Yang, X., Zhao, P. (2021). A two-stage resilience enhancement for distribution systems under hurricane attacks. IEEE Systems Journal, 15(1), 653–661. [Google Scholar]
14. Ma, S., Su, L., Wang, Z., Qiu, F., Guo, G. (2018). Resilience enhancement of distribution grids against extreme weather events. IEEE Transactions on Power Systems, 33(5), 4842–4853. [Google Scholar]
15. Bidram, A., Davoudi, A. (2014). A multi-objective distributed control framework for islanded AC microgrids. IEEE Transactions on Industry Applications, 10(3), 1785–1798. [Google Scholar]
16. Chen, C., Wang, J., Qiu, F., Zhao, D. (2016). Resilient distribution system by microgrids formation after natural disasters. IEEE Transactions on Smart Grid, 7(2), 958–966. [Google Scholar]
17. Lei, S., Wang, J., Chen, C., Hou, Y. (2018). Mobile emergency generator pre-positioning and real-time allocation for resilient response to natural disasters. IEEE Transactions on Smart Grid, 9(3), 2030–2041. [Google Scholar]
18. Farzin, H., Fotuhi, M., Moeini, M. (2016). Enhancing power system resilience through hierarchical outage management in multi microgrids. IEEE Transactions on Smart Grid, 7(6), 2869–2879. [Google Scholar]
19. Ding, T., Lin, Y., Bie, Z., Chen, C. (2017). A resilient microgrid formation strategy for load restoration considering master-slave distributed generators and topology reconfiguration. Applied Energy, 199, 205–216. [Google Scholar]
20. Kopsidas, K., Abogaleela, M. (2019). Utilizing demand response to improve network reliability and ageing resilience. IEEE Transactions on Power Systems, 34(3), 2216–2227. [Google Scholar]
21. Zhou, B., Yang, X., Li, J. (2020). Review on key technologies of multi-integration highly resilient power grid. Zhejiang Electric Power, 39(12), 35–43. [Google Scholar]
22. Gan, H., Li, S., Yang, F., Gao, X., Ma, X. (2021). Resilience promotion strategy of distribution network considering demand response and distributed generation uncertainty. 2021 6th Asia Conference on Power and Electrical Engineering (ACPEE), pp. 1278–1285. Chongqing, China. [Google Scholar]
23. Yi, X., Gu, J., Liu, S. (2022). Optimization of distribution network resilience enhancement considering demand response. Journal of Electric Power Science and Technology, 37(4), 29–37. [Google Scholar]
24. Khalili, T., Bidram, A., Reno, M. J. (2020). Impact study of demand response program on the resilience of dynamic clustered distribution systems. IET Generation, Transmission and Distribution, 14(22), 5230–5238. [Google Scholar]
25. Sasaki, Y., Ueoka, M., Yorino, N., Zoka, Y. (2021). Dynamic economic load dispatch with emergency demand response for microgrid system operation. 2021 22nd International Middle East Power Systems Conference (MEPCON), pp. 497–502. Chongqing, China. [Google Scholar]
26. Osman, S. R., Sedhom, B. E., Kaddah, S. S. (2023). Optimal resilient microgrids formation based on darts game theory approach and emergency demand response program for cyber-physical distribution networks considering natural disasters. Process Safety and Environmental Protection, 173, 893–921. [Google Scholar]
27. Ma, S., Su, L., Wang, Z., Qiu, F. (2019). Resilience-oriented design of distribution systems. IEEE Transactions on Power Systems, 34(4), 2880–2891. [Google Scholar]
28. Alguacil, N., Delgadillo, A., Arroyo, J. M. (2014). A tri-level programming approach for electric grid defense planning. Computers & Operations Research, 41, 282–290. [Google Scholar]
29. Yuan, W., Wang, J. (2016). Robust optimization-based resilient distribution network planning against natural disasters. IEEE Transactions on Smart Grid, 7(6), 2817–2826. [Google Scholar]
30. Wang, X., Shahidehpour, M., Jiang, C., Li, Z. (2019). Resilience enhancement strategies for power distribution network coupled with urban transportation system. IEEE Transactions on Smart Grid, 10(4), 4068–4079. [Google Scholar]
31. Wu, X., Wang, Z., Ding, T., Wang, X., Li, Z. et al. (2019). Microgrid planning considering the resilience against contingencies. IET Generation, Transmission and Distribution, 13(16), 3534–3548. [Google Scholar]
32. Lin, Y., Bie, Z. (2018). Tri-level optimal hardening plan for a resilient distribution system considering reconfiguration and DG islanding. Applied Energy, 210, 1266–1279. [Google Scholar]
33. Yuan, W., Zhao, L., Zeng, B. (2014). Optimal power grid protection through a defender-attacker-defender model. Reliability Engineering and System Safety, 121, 83–89. [Google Scholar]
34. Balakrishnan, R., Ranganathan, K. (2012). A textbook of graph theory. USA: Springer. [Google Scholar]
35. Jabr, R. A., Singh, R. (2012). Minimum loss network reconfiguration using mixed-integer convex programming. IEEE Transactions on Power Systems, 27(2), 1106–1115. [Google Scholar]
36. Arif, A., Wang, Z., Wang, J., Chen, C. (2018). Power distribution system outage management with co-optimization of repairs, reconfiguration, and DG dispatch. IEEE Transactions on Smart Grid, 9(5), 4109–4118. [Google Scholar]
37. FERC (2006). Assessment of demand response and advanced metering. https://www.ferc.gov/ (accessed on 08/07/2023). [Google Scholar]
38. Kahnamouei, A. S., Lotfifard, S. (2022). Enhancing resilience of distribution networks by coordinating microgrids and demand response programs in service restoration. IEEE Systems Journal, 16(2), 3048–3059. [Google Scholar]
39. Zhao, L., Zeng, B. (2012). Robust unit commitment problem with demand response and wind energy. IEEE Power and Energy Society General Meeting, pp. 1–8. San Diego, USA. [Google Scholar]
40. Zhao, L., Zeng, B. (2012). An exact algorithm for two-stage robust optimization with mixed integer recourse problems. https://optimization-online.org/2012/01/3310/ (accessed on 22/08/2023). [Google Scholar]
41. Baran, M. E., Wu, F. F. (1989). Network. Reconfiguration in distribution systems for loss reduction and load balancing. IEEE Transactions on Power Delivery, 4(2), 1401–1407. [Google Scholar]
Cite This Article
 Copyright © 2024 The Author(s). Published by Tech Science Press.
This work is licensed under a Creative Commons Attribution 4.0 International License , which permits unrestricted use, distribution, and reproduction in any medium, provided the original work is properly cited.
 Downloads
 Citation Tools