
 Submit a Paper
 Propose a Special lssue
 Open Access
ARTICLE

Research on the Method of Heat Preservation and Heating for the Drilling System of Polar Offshore Drilling Platform
1 Oil and Gas Research and Development Center, CIMC RAFFLES, Yantai, 264000, China
2 School of Civil Engineering and Transportation, South China University of Technology, Guangzhou, 510641, China
3 Yantai Hangxiao Steel Structure Assembly Construction Co., Ltd., Yantai, 264000, China
* Corresponding Author: Chaohe Chen. Email:
(This article belongs to the Special Issue: Hydraulic Fracturing Theory and Application for Geo-energy Development)
Energy Engineering 2024, 121(5), 1173-1193. https://doi.org/10.32604/ee.2024.046432
Received 30 September 2023; Accepted 29 December 2023; Issue published 30 April 2024
 View Full Text
 Download PDF
Abstract
This study investigates the heat dissipation mechanism of the insulation layer and other plane insulation layers in the polar drilling rig system. Combining the basic theory of heat transfer with the environmental requirements of polar drilling operations and the characteristics of polar drilling processes, we analyze the factors that affect the insulation effect of the drilling rig system. These factors include the thermal conductivity of the insulation material, the thickness of the insulation layer, ambient temperature, and wind speed. We optimize the thermal insulation material of the polar drilling rig system using a steady-state method to measure solid thermal conductivity. By analyzing the distribution of temperature in space after heating, we optimize the distribution and air outlet angle of the heater using Fluent hydrodynamics software. The results demonstrate that under polar conditions, polyisocyanurate with stable thermodynamic properties is selected as the thermal insulation material. The selection of thermal insulation material and thickness significantly affects the thermal insulation effect of the system but has little effect on its heating effect. Moreover, when the air outlet angle of the heater is set to 32.5°, the heating efficiency of the system can be effectively improved. According to heat transfer equations and heat balance theory, we determine that the heating power required for the system to reach 5°C is close to numerical simulation.Keywords
Nomenclature
| K | Total thermal conductivity between flat walls |
| λ1, λ2, λ3 | Thermal conductivity of aluminum plate, thermal insulation material, and steel plate, respectively |
| δ1, δ2, δ3 | Thickness of aluminum plate, heat insulation layer, and steel plate, respectively |
| Φ1 | Heat transfer heat flux through the aluminum plate, insulation layer, and steel plate |
| A1, A2 | Surface area and irradiation area of the aluminum plate |
| tin, tout | Inner wall temperature of aluminum plate and the outer wall temperature of steel plate |
| Φ2 | Heat flux of convective heat transfer |
| h | Convective heat transfer coefficients |
| h1 | Convective heat transfer coefficient between the aluminum plate and the air inside the cabin |
| Numl, Reml, Prm | Nusselt number, Reynolds number, and Prandtl number, respectively |
| Coefficient of volume change | |
| g | Gravitational acceleration |
| l | Characteristic scale |
| v | Coefficient of kinematic viscosity |
| tw | Temperature of the surface |
| Temperature at infinity | |
| k | Thermal conductivity of a fluid at rest |
| ε1 | Object emissivity |
| σ | Boltzmann constant |
| ρ | Static pressure |
| u, v, w | Velocity vectors in x, y, z directions, respectively |
| SH | Heat source |
| τ | Components of the stress tensor. Each component of the stress tensor is itself a second derivative of the velocity components. |
With conventional oil and gas reserves dwindling, over the last four decades, the oil and gas production industry has moved towards increasingly more challenging fields [1]. The Arctic zone has potential as a resource base of hydrocarbon, which is about 13 billion tons of oil and 86 trillion m3 of gas [2]. Their development is both a driver of economic sector progress and a lifeline for the implementation of the energy transition. The value of the region has been widely recognized by global oil and gas producers and scientific research institutions. However, extreme cold weather conditions in the Arctic pose a significant challenge to oil and gas drilling operations [3].
Scholars have conducted extensive research on drilling operations under extraordinary climatic conditions in the Arctic region. Adumene et al. systematically reviewed Arctic harsh environment characterization by exploring the marine meteorological phenomena prevalent in harsh environments and their effects on floating offshore platform performance and supporting systems [3]. Sun et al. analyzed the challenges faced by polar drilling and the development status of polar drilling equipment and put forward exploratory suggestions for the future development of polar drilling equipment [4]. Koo et al. proposed by suggesting wind wall design with ventilation openings and by finding locations and quantities of heaters and blowers considering local temperature and air change rate to satisfy the polar hazardous guide. Those solutions were verified by CFD (Computational Fluid Dynamics) approaches with suitable boundary conditions [5]. Huang et al. studied the effect of temperature, ice debris concentration, and weighting agent on the rheological properties of polar drilling fluid [6]. Leusheva et al. study the effect of arctic offshore oil field temperature conditions on the rheological properties of various types of drilling muds [7]. Liu et al. analyzed the heat transfer mechanism of the derrick insulation wall of the drilling platform in the polar ice region based on the theory of computational fluid dynamics [8].
The polar drilling system works in an ultra-low temperature environment. It needs to allow the staff to work in a relatively comfortable environment and meet the normal operating temperature range of the main components and equipment, which requires insulation and heating design for each region of the drilling rig [9,10]. Therefore, the insulation and heating of the drilling system is one of the key issues in the polar drilling platform. The excellent thermal insulation and heating system is directly related to the safety of operators and the life cycle of the drilling platform. However, there are no reports about the method of heat preservation and heating of the polar drilling system. Consequently, in response to the aforementioned problems, this paper takes into account the thermal conductivity of the insulation material, the thickness of the insulation layer, the ambient temperature, and the wind speed. Based on the distribution of the space temperature after heating, the distribution of the heater and the angle of the air outlet are optimized using Fluent Fluid Dynamics software. It should be pointed out that due to the difference in wind, wave, current, and ambient temperature in the sea region where the operation is located, the insulation forms of the derrick are divided into three types at present: semi-closed, with top outlet, and fully enclosed [11]. According to the development status of the key equipment for polar ocean drilling: the drilling equipment, pipelines, and open-air operation areas exposed to the platform deck are more and more likely to be designed as a fully enclosed thermal insulation cabin with an internal thermal insulation and heating system [12]. It can not only ensure the normal operation of key equipment and the operation safety of staff but also block the impact of cold wind, blizzards, and ice on the drilling rig system [13]. The research object of this paper is the drilling system of the fully enclosed derrick.
The heat transfer process of a polar drilling rig system consists of the following steps: convective heat transfer between air and aluminum plate in the system; flat wall heat conduction between aluminum plate, thermal insulation layer, and steel plate (including intersection and angle). The whole heat transfer diagram is shown in the Fig. 1.

Figure 1: Schematic diagram of heat transfer process
Heat conduction is the transfer of heat from the higher part to the lower part of the solid. Heat transfer in aluminum plate, thermal insulation layer, and steel plate is heat conduction [14–16]. The heat conduction process of the drilling rig system can be regarded as the large flat wall heat conduction. The calculation formula of the heat conduction coefficient between the flat wall of the unit area and the external environment is as follows:
The thermal conductivity between the rig system and the external environment is:
Heat convection is a mode of heat transfer by the mass motion of a fluid such as air. Thermal convection can be divided into forced convection and natural convection [16]. The thermal insulation conditions include natural convection heat transfer in the internal system and forced convection heat transfer inside the system under heating conditions. The heat flux of convective heat transfer:
Under the condition of constant heat flow boundary, the Numl calculation formula of the average Nusselt number for forced convection heat transfer of laminar flow and turbulent flow on the outer wall of the steel plate is as follows:
In the natural convection, Grachhev number Gr is introduced as the characteristic number to judge the natural convection state:
Experimental correlations for natural convection heat transfer:
Convective heat transfer coefficients of vertical and inclined flat wall surfaces:
The process by which an object transmits energy by emitting electromagnetic waves due to heat is called thermal radiation [16]. The outer surface of the system steel plate is affected by the surrounding environment and solar radiation, so radiation is also taken into account in the thermal analysis of the system. The radiant heat of an object under a certain environment is calculated by Boltzmann’s law:
Any amount of external radiation can be considered as the thermal radiation of an object at an ambient temperature. In this paper, different amounts of external radiation are converted into the system’s radiation heat dissipation at various ambient temperatures.
The heat transfer between the system and the surrounding environment includes heat conduction, convection, and radiation [14]. According to the above definitions, we can obtain:
Heat conduction and convection are the main ways of heat preservation and heating in polar drilling rig systems. There is heat convection between the inner wall of the insulation layer and the inner air, and between the outer wall of the corrugated steel plate and the outer air, it is described by the continuity equation and momentum equation. There is heat conduction between aluminum plate, corrugated steel plate, and sandwich insulation material, which is represented by the energy equation [16].
Continuity equation:
Momentum equation:
Energy equation:
Boussinesq model:
2.6 Physical Model and Mesh Generation
Taking a cryogenic drill system as the research object, the physical model is established as shown in Fig. 2. The plane size of the bottom drilling platform is 16.0 m × 16.0 m, the plane size of the racking board is 16.0 m × 16.0 m, and the plane size of derrick top is 6.096 m × 6.096 m. The effective height of the whole system is 56.85 m, and the external flow field is 150 m × 110 m × 100 m. ICEM was used to divide the grid of the system model, and a structured grid division method was adopted to obtain 1.83 million grid cells as shown in Fig. 3.

Figure 2: A physical model of the rig system

Figure 3: ICEM mesh model of rig system
2.7 Physical Parameters of Materials
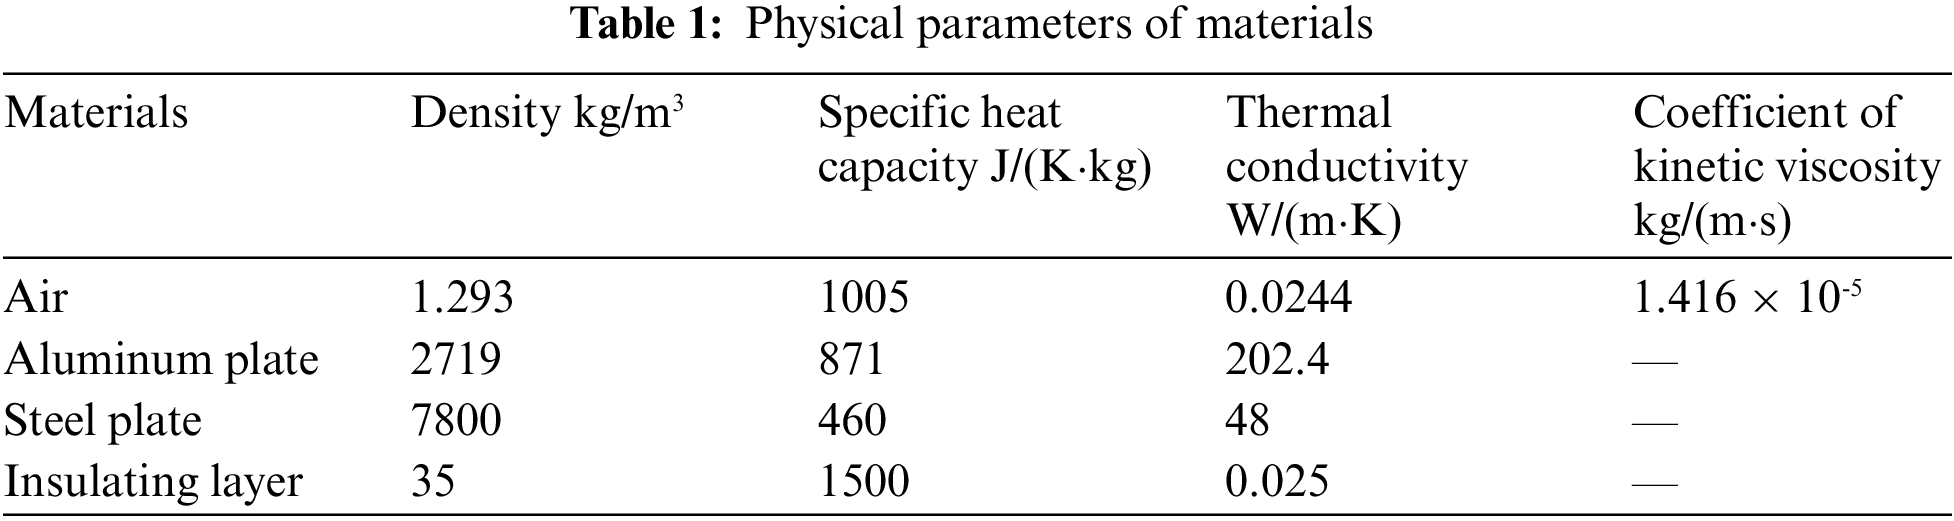
Four materials are included in this model, namely air, aluminum plate, insulation layer, and corrugated steel plate. In the actual working condition, the temperature of the internal flow field changes, and the physical parameters of the air are a function of time, the air parameters are calculated by averaging the temperature range. The steel plate material is nickel steel, and the heat preservation material is polyisocyanurate. The physical parameters of each material are shown in Table 1.
The inflow field inlet adopts the inlet boundary conditions, with the inlet temperature being the ambient temperature and the velocity being the wind speed. The outflow field outlet adopts the pressure outlet boundary condition. The system’s heater inlet adopts the velocity inlet boundary, and the air outlet velocity and temperature are calculated based on the heat source power and air exchange rate. The V gate and moon pond are set as interior boundaries according to the working conditions. Since the inner wall of the aluminum plate (the contact surface between the aluminum plate and the system’s internal air) and the outer wall of the corrugated steel plate (the contact surface between the steel plate and the external air) constitute a double wall surface, they are set as the coupling wall surface. This allows the solver to directly calculate the heat exchange on the wall using the flow field variables of adjacent grids.
3.1 Numerical Model Validation
To verify the reliability of parameter settings and solution solutions in Fluent simulation, the grid independence of the simulation model was first verified. The simulation results were then compared and analyzed with the experimental data from the “North Dragon” semi-submersible drilling platform located in Yantai, China. The grid independence test is a process used to find the optimal grid condition that has the smallest number of grids without generating a difference in the numerical results based on the evaluation of various grid conditions. During the heating and insulation process of the polar drilling platform derrick, heat transfer primarily occurs through two methods: thermal conduction and thermal convection, without considering the influence of thermal radiation. In this case, there is convection heat transfer between the outside air and the steel plate, and between the cabin air and the aluminum plate; there is heat conduction heat transfer between the steel plate, the aluminum plate, and the insulation layer. Therefore, the focus is on analyzing the influence of the internal and external field grids and boundary layer grids on the average temperature in the insulation cabin.
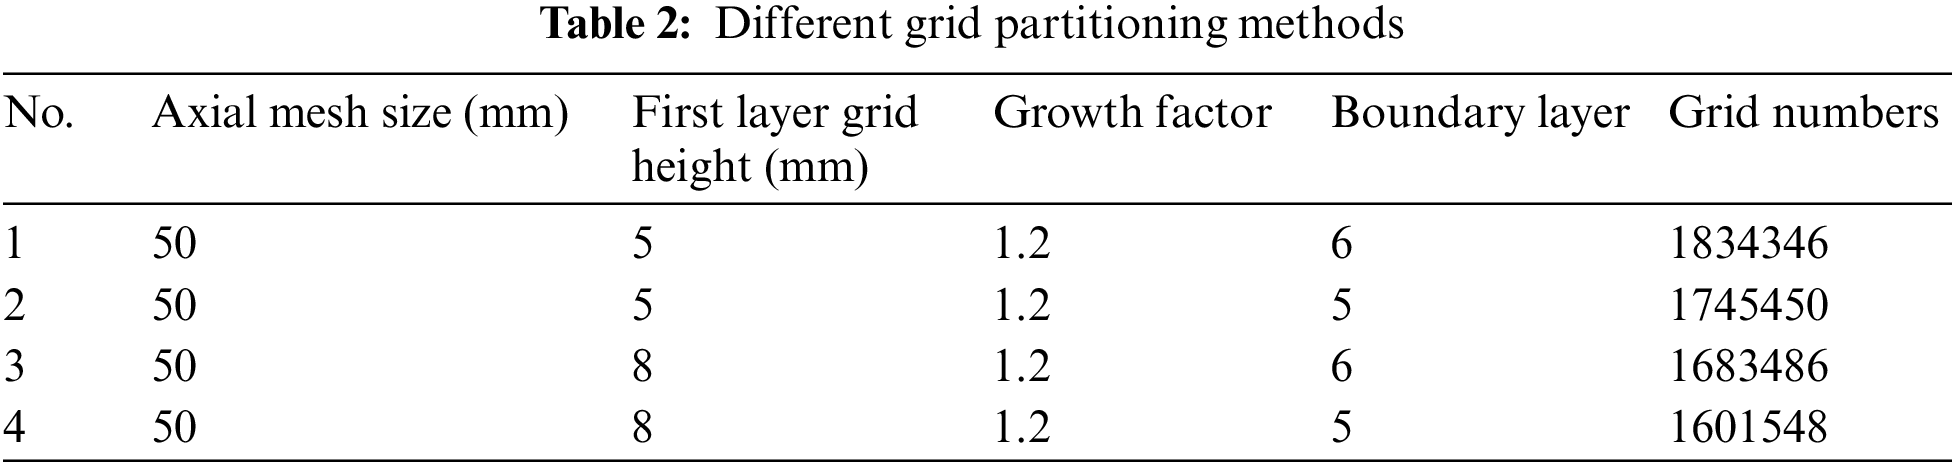
A structured grid of physical models was generated through ICEM CFD 2020 R1. According to the grid size, four schemes with grid numbers of 1834346, 1745450, 1683486, and 1601548 were simulated to observe the change in the average temperature in the insulation cabin with time. Table 2 shows different grid partitioning methods.
The non-uniform temperature field within the insulation cabin of the polar offshore drilling platform was numerically simulated using Fluent software. Data points representing the average temperature inside the cabin were extracted, and a temperature drop curve was plotted under thermal insulation conditions, as shown in Fig. 4. The four schemes have the same simulation strategy but different numbers of grids. It can be seen from the Fig. 4 that the average temperature changes over time in the insulation cabins of the four schemes are almost the same.

Figure 4: Average temperature of the insulation cabin with different grid schemes
To more intuitively analyze the influence of the four meshing schemes on the accuracy of the calculation results, the maximum relative deviations between the average temperature of the remaining three grid numbers and the average temperature of the No.1 grid number were calculated, as shown in Table 3. As can be seen from Table 3, the maximum relative deviation between the maximum number of grids (1834346) and the minimum number of grids (1601548) is only 3.65%. Therefore, to ensure the calculation accuracy and maintain appropriate time cost, the scheme of 1834346 grids was selected for subsequent numerical simulations.

The semi-submersible drilling platform “North Dragon” serves as the research object to verify the correctness and reliability of the simulation strategy. Temperature sensors were placed at the bottom of the derrick and on the second floor of the deck, at distances of 0 and 42.63 m, respectively. These sensors monitored temperature changes in real-time. Two monitoring points, A and B, were also set on the corresponding model, and the temperature changes at these points were calculated using Fluent software. The reliability of the simulation strategy was verified by comparing the relative deviations between the experimental data and the software simulation results.
The semi-submersible drilling platform in the maintenance period is located in Yantai. During the experiment, the local ambient temperature was 264.15 K and the wind speed was approximately 1 m/s. At this time, the wall of the derrick consisted only of a 3 mm corrugated steel plate, and the initial temperature inside the derrick was 278.15 K after heating. The experimental results and simulation results as shown in Fig. 5.

Figure 5: Reliability verification of simulation results
It can be seen from the Fig. 5 that in the early stage of heat dissipation, the temperature changes in a large range. As the heat dissipation process proceeds, the temperature change range gradually decreases and finally stabilizes within a range. The trends of the experimental results and simulation results are within the acceptable range, and the maximum relative deviation is 18.69% (degrees Celsius unit system), which meets the engineering needs. This verifies the feasibility of parameter settings and simulation strategies.
3.2 Analysis of Influencing Factors of Thermal Insulation Effect
3.2.1 Effect of Thermal Conductivity on Thermal Effect
Thermal conductivity is an important factor affecting heat transfer, the lower the thermal conductivity, the higher the thermal resistance, and the better the insulation effect. Five groups of different thermal conductivity were selected: 0.02, 0.04, 0.06, 0.08, 0.1 W/(m·K). The simulated working conditions were as follows: the ambient temperature was −45°C, and the thickness of the corrugated steel plate and insulation layer was 3 and 50 mm, respectively. Except for the thermal conductivity of the insulation material, all other settings remain unchanged, and the heater is not heated to simulate the effect of different thermal conductivities on the insulation effect of the drill floor system. The temperature drop curve is shown in the Fig. 6.
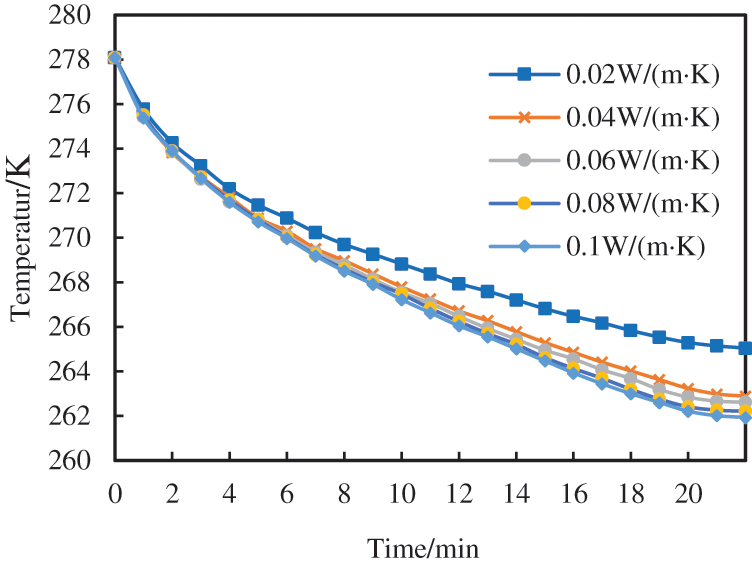
Figure 6: Temperature reduction curve of system with variation of thermal conductivity of thermal insulation material
As can be seen from the Fig. 6, the lower the thermal conductivity of the insulation material is, the slower the average temperature inside the drill floor system of the polar drilling platform will fall, and the more obvious the insulation effect will be. According to the results of the simulation, after a temperature drop of 20 min, the average temperature inside the drill floor system when the thermal conductivity of the insulation material is 0.02 W/(m·K) is 3.06°C, higher than the average temperature when the thermal conductivity is 0.10 W/(m·K). Therefore, it is of great significance to optimize the thermal insulation material with low thermal conductivity to improve the thermal insulation effect of the drilling platform system of the polar drilling platform.
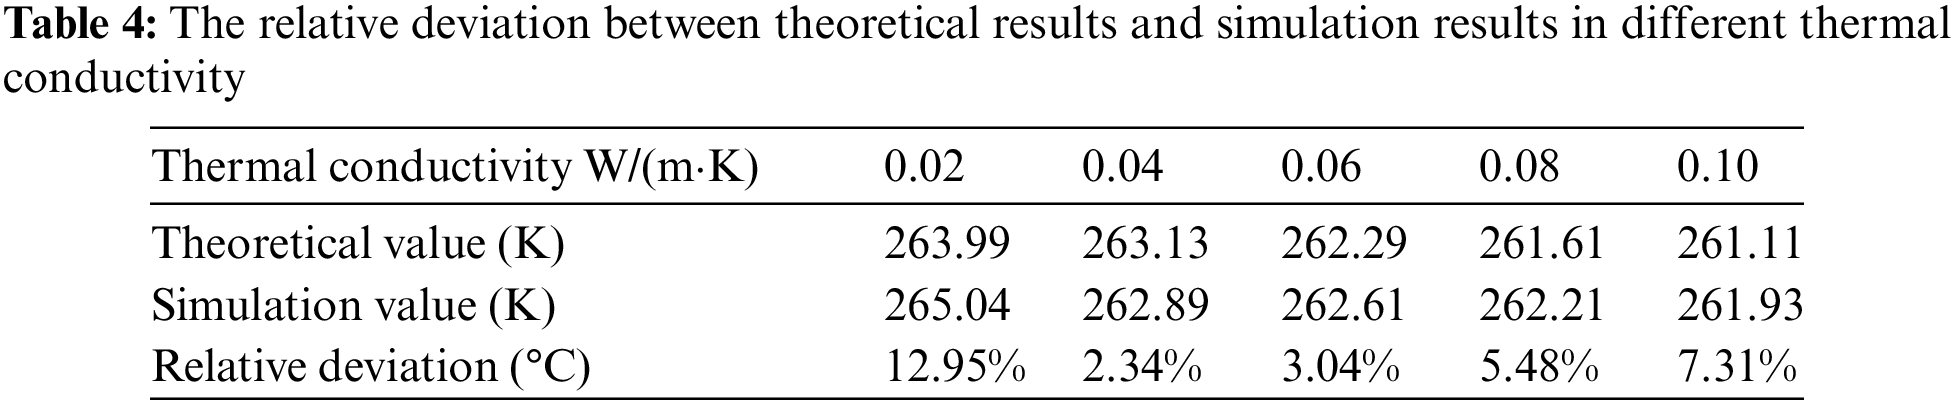
To verify the accuracy of the fitted curve, a comparative study was conducted with the theoretical calculation model established by Koo et al. [5]. This model is based on a simplified heat balance equation and is used to predict the average temperature when the temperature of the insulation cabin of a polar drilling platform reaches a steady state. When the system reaches a steady state, the theoretical calculation results and simulation results are shown in Table 4. As can be seen from Table 4, the maximum relative deviation between the theoretical calculation results and the simulation results is 12.95% (degrees Celsius unit system), which is within the acceptable range of the engineering.
3.2.2 Effect of Insulation Layer Thickness on Insulation Effect
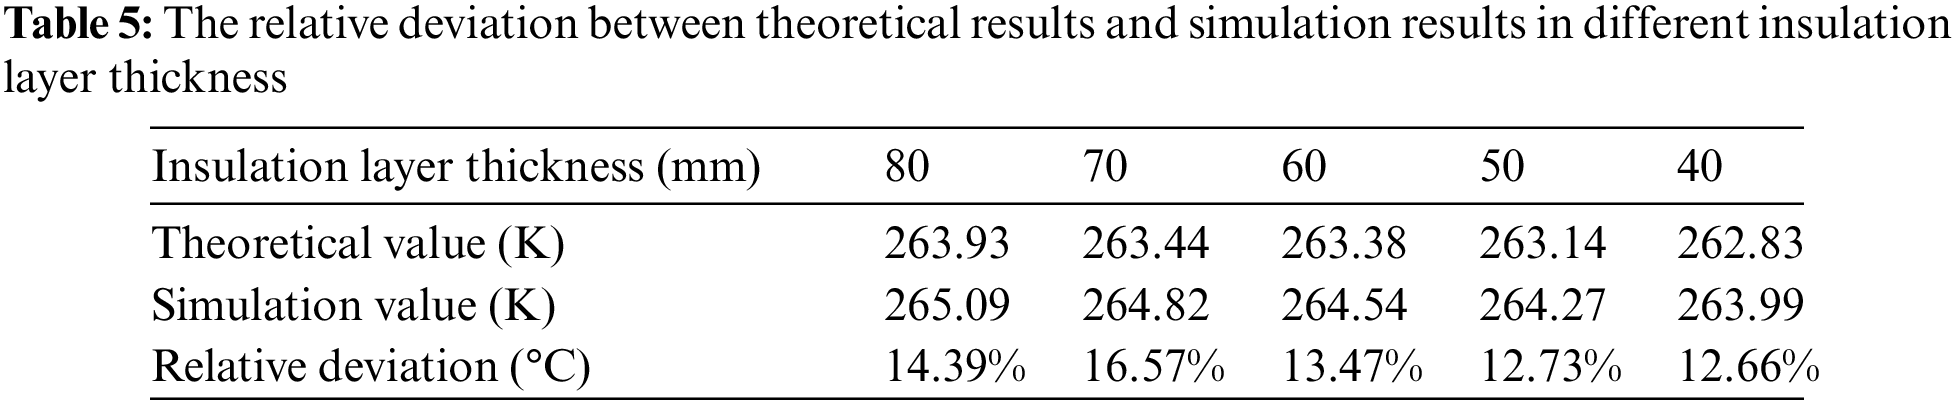
The insulation layer thickness is also an important index that affects the insulation effect of the drilling system of the polar drilling platform. Therefore, five insulation layers of different thicknesses were selected, respectively 40, 50, 60, 70, and 80 mm. The simulated working conditions were as follows: the ambient temperature was −45°C and the thermal conductivity of the insulation material was 0.025 W/(m·K). All settings except for the thickness of the insulation material remain unchanged, and the heater is not heated to simulate the influence of different insulation thicknesses on the heat dissipation law of the drilling system. The temperature drop curve is shown in the Fig. 7.

Figure 7: Temperature reduction curve of system with change of thermal insulation layer thickness
As can be seen from the Fig. 7, with the increase of insulation layer thickness, the average temperature inside the drilling system of the polar drilling platform decreases slowly, but the temperature difference is not particularly significant. According to the results of the simulation, after a temperature drop of 20 min, the average temperature inside the drilling system was 1.12°C higher when the insulation thickness was 80 mm than when the thickness was 40 mm. Therefore, the thickness of the insulation layer has a certain impact on the insulation effect, but the selection of insulation layer thickness should consider the economic benefits, to avoid the waste of resources.
To verify the accuracy of the fitted curve, a comparative study was conducted with the theoretical calculation model established by Koo et al. [5]. When the system reaches a steady state, the theoretical calculation results and simulation results are shown in Table 5. As can be seen from Table 5, the maximum relative deviation between the theoretical calculation results and the simulation results is 16.57% (degrees Celsius unit system), which is within the acceptable range of the engineering.
3.2.3 Effect of Ambient Temperature on Thermal Insulation Effect
The external environment temperature is also an important factor affecting the insulation effect of the drilling system. Five groups of different ambient temperatures (−50°C, −45°C, −40°C, −35°C, and −30°C) were selected to simulate the effect of external environment temperature on the insulation effect of the drilling system. The thermal conductivity of the insulation layer was 0.025 W/(m·K), and the thickness of the insulation layer was 50 mm. Except for the ambient temperature, the other settings are unchanged, and the heating of the solid control system is not applied. The influence of different ambient temperatures on the thermal insulation effect of the system is simulated. The temperature drop curve is shown in the Fig. 8.
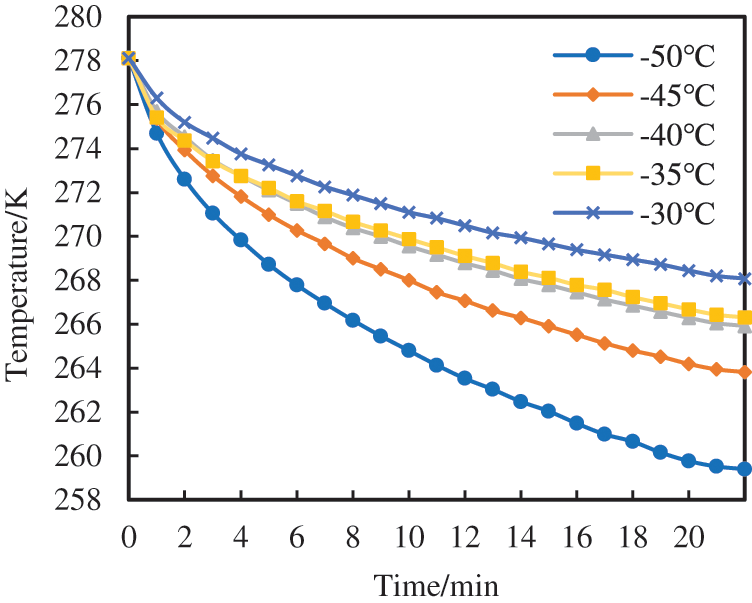
Figure 8: Temperature reduction curve of system with change of external environment temperature
Fig. 8 shows that the external environment temperature has a greater influence on the insulation effect of the drilling system of the polar drilling platform than other factors. The lower the external environment temperature, the faster the average temperature inside the drilling system will decline. After a 20-min temperature drop, the average temperature inside the system was 8.691°C higher than at −50°C when the ambient temperature was −30°C, according to simulation results. Therefore, it is important to consider external environment temperature when designing insulation for drilling systems.
To verify the accuracy of the fitted curve, a comparative study was conducted with the theoretical calculation model established by Koo et al. [5]. When the system reaches a steady state, the theoretical calculation results and simulation results are shown in Table 6. As can be seen from Table 6, the maximum relative deviation between the theoretical calculation results and the simulation results is 17.68% (degrees Celsius unit system), which is within the acceptable range of the engineering.

3.2.4 Effect of Wind Speed on Thermal Insulation Effect
According to the observation data inspected by Chinese Arctic scientists, the weather in the central region of the Arctic in summer is relatively mild, with an average wind velocity of 6 m/s and a maximum wind velocity of 10–15 m/s [17]. Under the condition that the external temperature is −45°C, the insulation layer thickness is 50 mm, and the thermal conductivity of the insulation layer is 0.025 W/(m·K), the temperature distribution and heat transfer process in the drilling system under different conditions are studied by changing the velocity of the external airflow. Fig. 9 shows the wind velocity nephogram of the drilling rig system. Table 7 shows the difference between the total heat transfer rate of the inside and outside surface of the insulation layer under different wind velocities, to analyze and compare the influence of wind velocities on the insulation effect of the system.
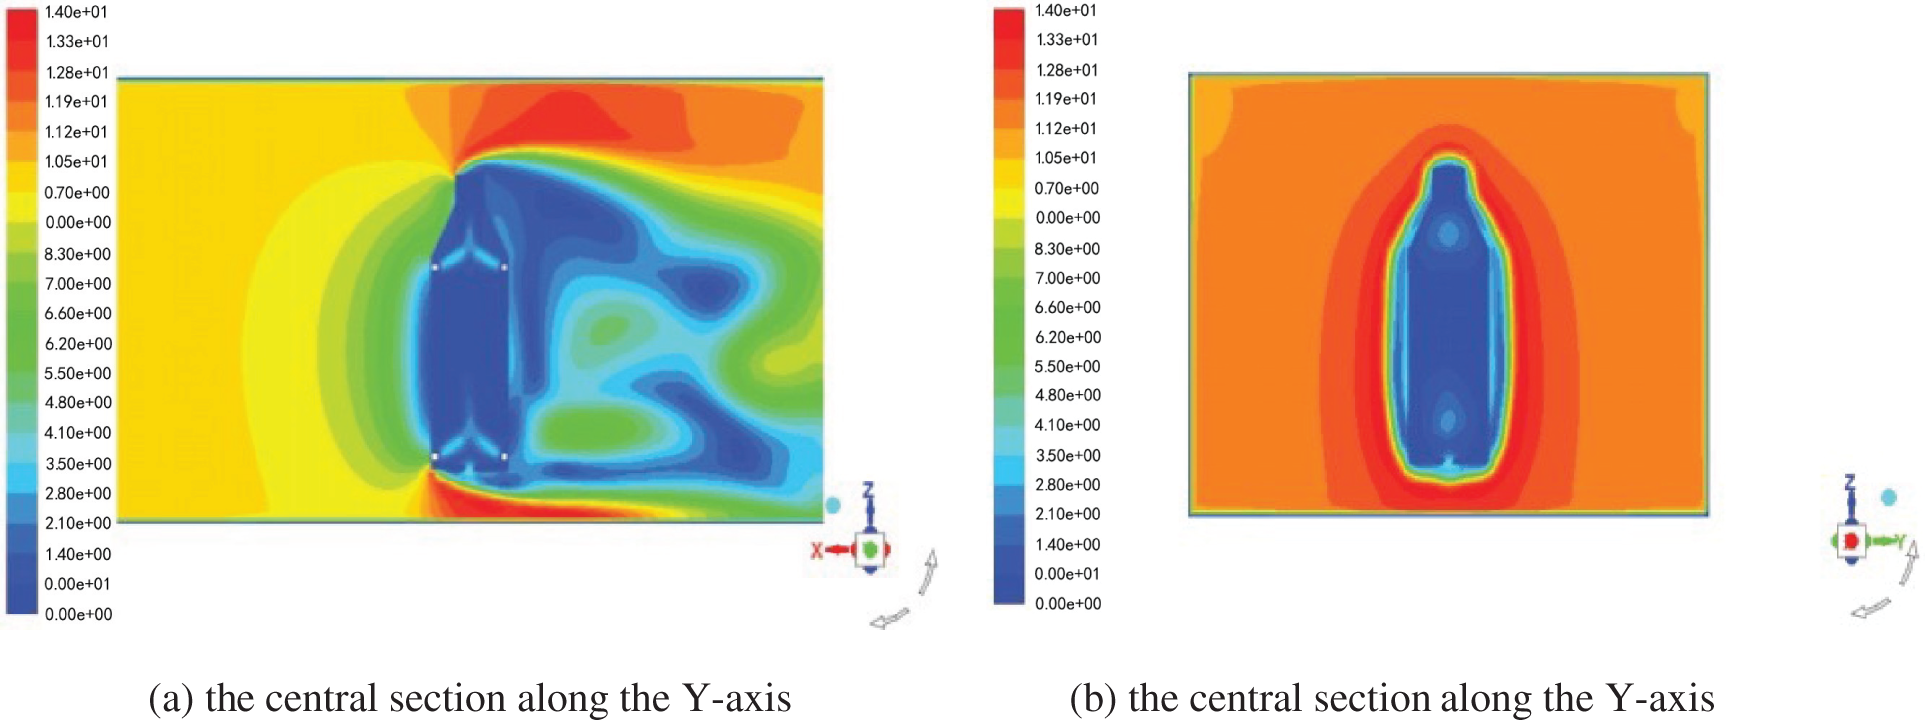
Figure 9: Wind velocity nephogram of the rig system
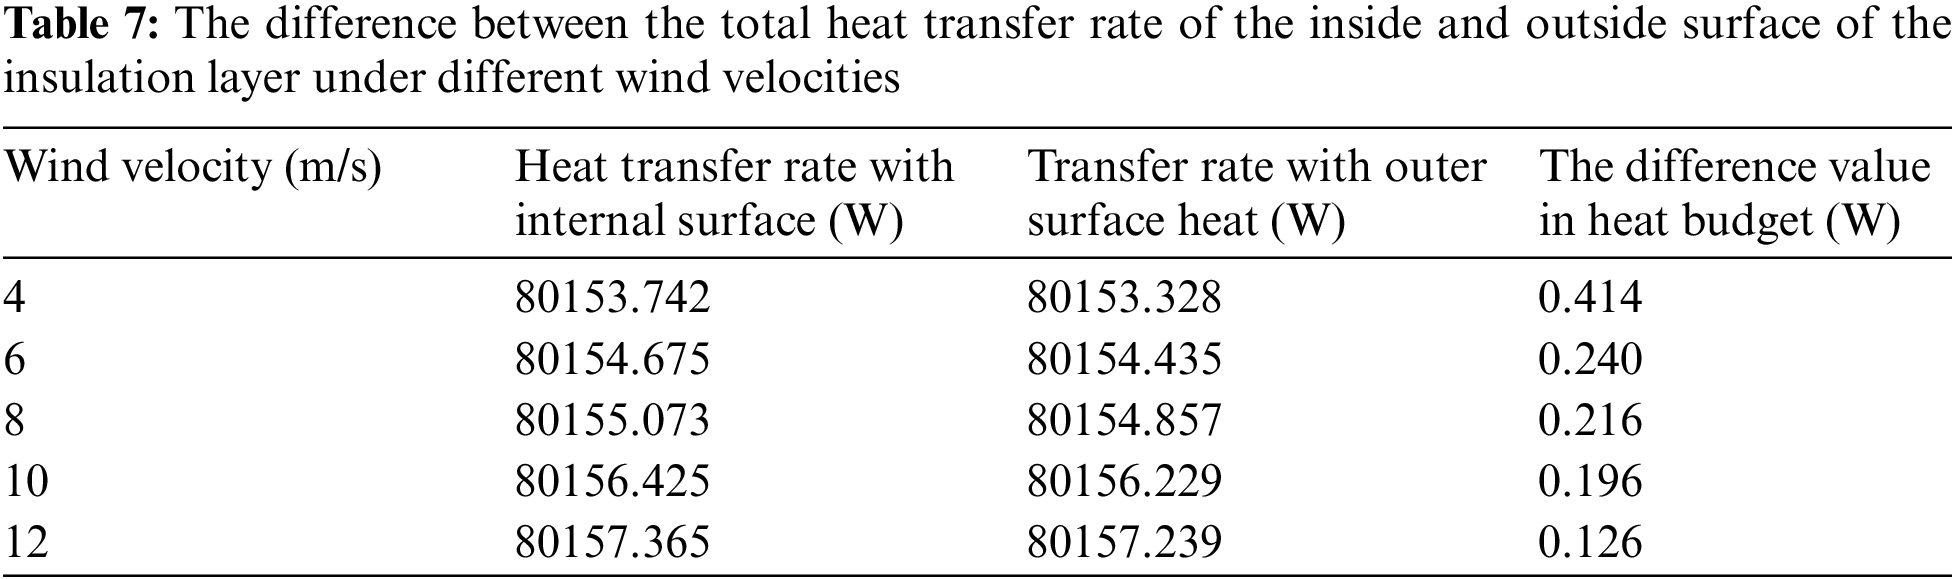
As can be seen from the data in Table 7, with the increase in wind velocity, the total heat transfer rate between the air and the inner and outer surfaces of the system increases. However, the increase is more pronounced for the latter than the former. The difference between the two decreases with the increase in wind velocity, indicating that the heat absorbed by the insulation layer and the inner and outer surfaces decreases as wind velocity increases.
3.3 Heating Method of Drilling Rig System
3.3.1 Selection of Insulation Material and Thickness
At present, the commonly used thermal insulation materials include microporous calcium silicate, ultra-fine glass wool, polyurethane rigid foam, polystyrene rigid foam, polyisocyanurate, and other products [18]. In this paper, the steady-state method is used to measure the thermal conductivity of the above-mentioned solid insulation materials [19].
Take two objects with perpendicular directions of heat conduction and temperatures T1 and T2, respectively. The thickness of the sample P to be tested is h. The experimental principle of the steady-state method for measuring the thermal conductivity of solids states that the heat transfer rate per unit time (ΔQ/ΔT) is proportional to the cross-sectional area S of the object and the temperature difference between two surfaces A and B (T1 − T2):
To see more clearly the change rule of thermal conductivity of different materials with temperature, the thermal conductivity of the above several thermal insulation materials at 100°C–600°C is measured, and the curve of thermal conductivity with temperature is shown in Fig. 10.

Figure 10: The curve of thermal conductivity with temperature
It can be seen from the Fig. 10 that the thermal conductivity of different insulation materials increases with the increase of the experimental temperature, among which the thermal conductivity of polyisocyanurate is the lowest and the sensitivity of temperature is relatively stable. When the experimental temperature is 600°C, the polyisocyanurate with the lowest thermal conductivity is 0.116 W/(m·K) lower than the ultra-fine glass wool with the highest thermal conductivity. In general, primary polyisocyanurate was used as insulation material for polar drilling platforms [20].
As can be seen from the Figs. 11 and 12, the selection of different insulation materials and thicknesses has little effect on the heating effect of the drilling system. When polyisocyanurate with higher thermal conductivity was used, the average temperature inside the system was only 0.411°C higher than that of the ultra-fine glass wool with the lowest thermal conductivity after heating for 30 min. This is because the convective heat transfer between the cabin wall and the air in the drill system, as well as the total heat conduction between the insulation and the wall, is very small compared to the heat required to heat the internal air. However, the effect of the insulation layer on the insulation effect of the system should not be ignored.

Figure 11: Mean temperature curves of system with different thermal insulation materials

Figure 12: Temperature vs. time curves of systems with different insulation layer thicknesses
3.3.2 Analysis of Factors Affecting Heating Effect
The proper number and space distribution of heaters are the important factors that affect the heating effect of the drilling system. On the surface of the drill floor, in addition to the V door, there are three closed housings. Two heaters with the same power are set on the wall surface 2 m above the center of the bottom. When the air outlet angle of the heater is 45°, the temperature nephogram of the central section of the system for 15 and 30 min is shown in Fig. 13.
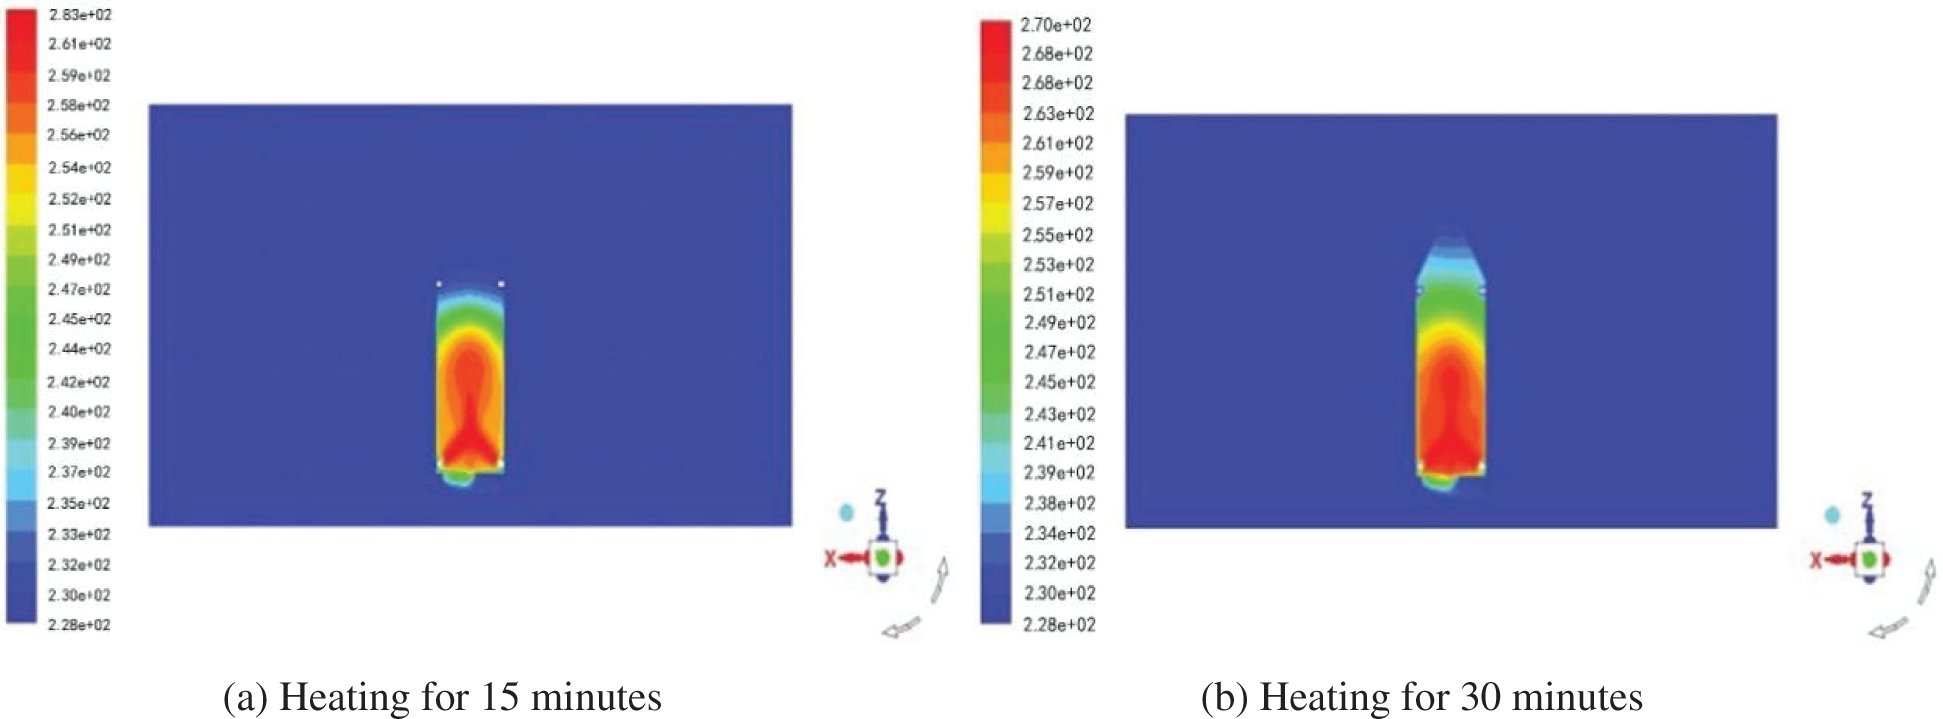
Figure 13: Temperature nephogram of heating 15 and 30 min when two heaters are laid out at the bottom, 45° degree outlet air
As can be seen from the Figs. 13 and 14, when two heaters are set on the surface of the drill floor, the internal temperature of the system is low and uneven after heating for a while. After heating for 60 min, the highest temperature in the middle of the derrick was 271.427 K, while the highest temperature in the billet and the top of the derrick was only 261.207 and 229.435 K, respectively. The heating effect on the billet was poor, and it was difficult to heat the top of the derrick.
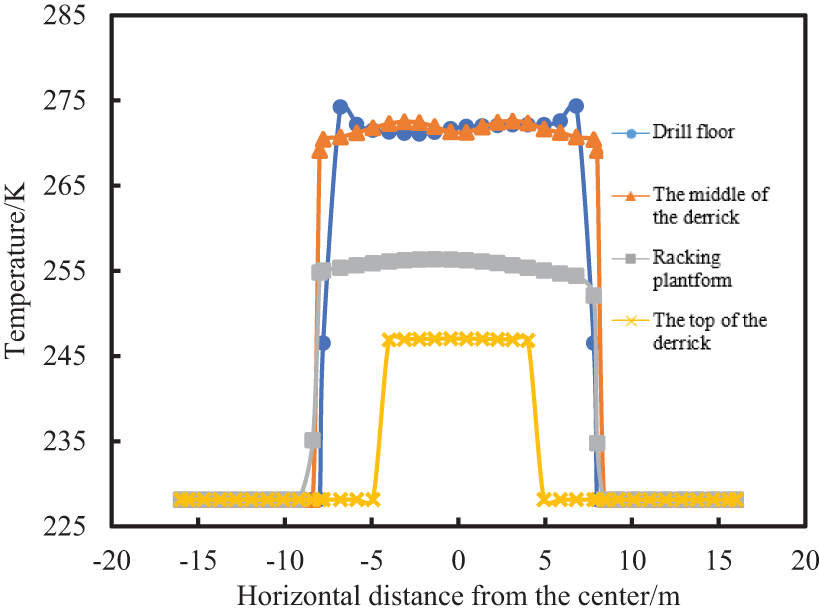
Figure 14: After heating for 1 h, the temperature curves of different positions of the system along the central axis different positions of the system along the central axis
Therefore, two heaters were added on the two sides of the second floor. Through numerical simulation, when the air outlet angle of the heater is 45°, the temperature of the central section of the system is heated for 15 and 30 min, as shown in Fig. 15. Considering the influence of different air outlet angles on heating efficiency, we analyzed and calculated how different air outlet angles affect heating temperature distribution and efficiency in Fig. 16.
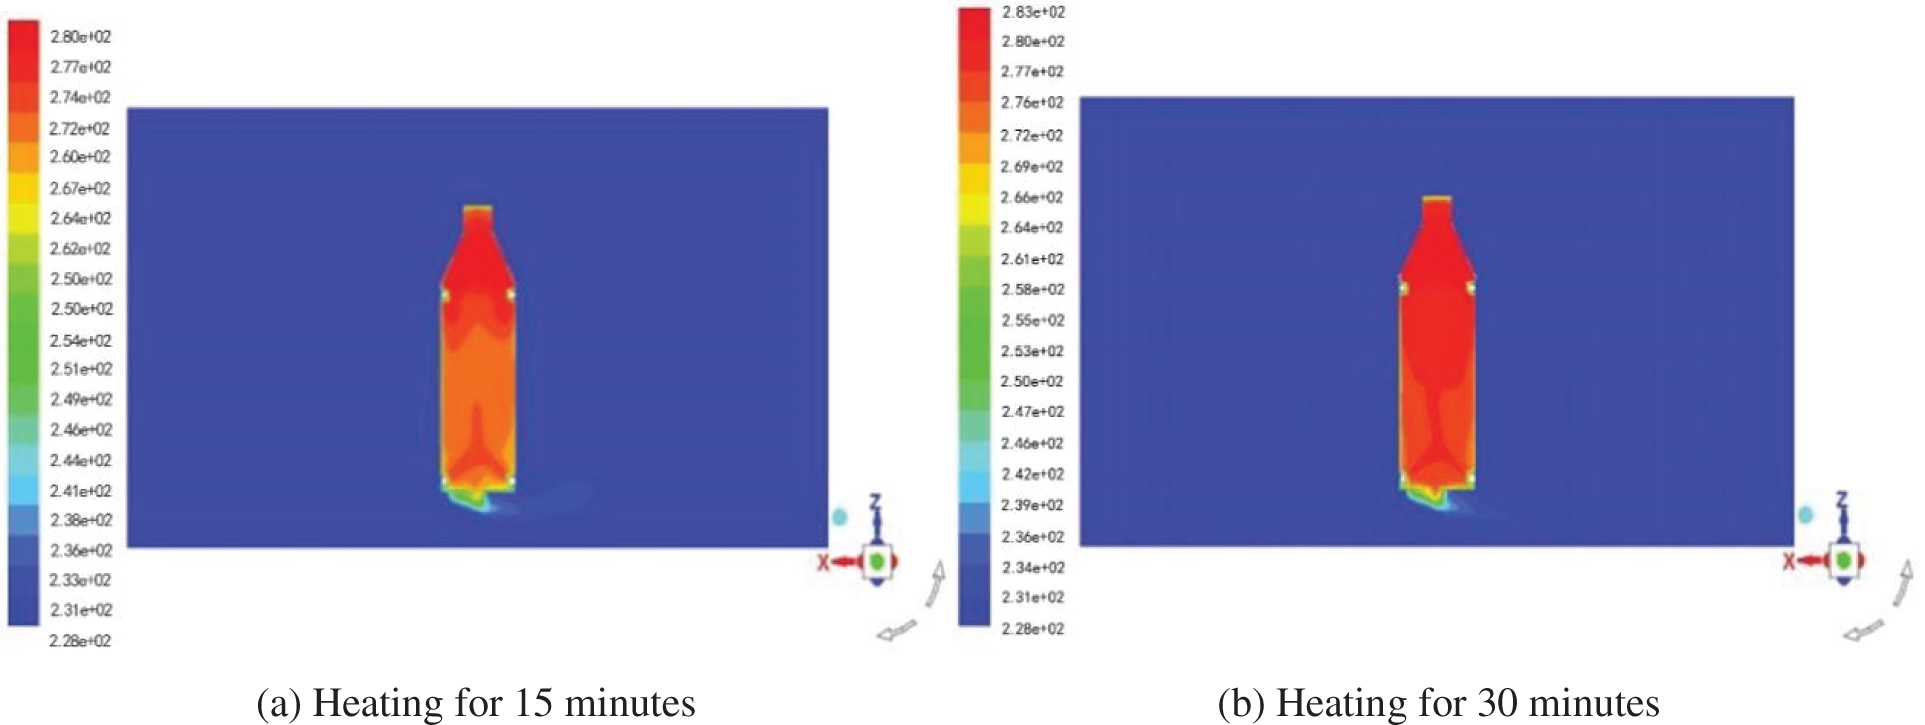
Figure 15: Temperature nephogram of heating 15 and 30 min when two heaters are laid out at the bottom and two heaters are laid out at the second floor, 45° degree outlet air

Figure 16: Curve of temperature change with time in the system at different outlet angles
As can be seen from the Fig. 16, the different air outlet angles of the heaters have a great influence on the heating effect of the system. If the air outlet angle is too small, the heating inside the system will be uneven; if the air outlet angle is too high, the internal temperature will not meet the requirements. When the air outlet angle is set as 75°, the internal temperature of the system is much lower than 278.15 K (5°C) after heating for a while. As shown in Table 8, which presents the internal temperature of the system after 30 min of heating at different heater outlet angles, the optimal air outlet angle is determined to be between 15° and 45°.

The software Fluent was used to simulate and calculate the time required for the system average temperature to reach 278.15 K (5°C) under different heating powers, as shown in Fig. 17, and the obtained power-time curve was shown in Fig. 18. And it can be seen in Fig. 18 when the air outlet angle of the heater is 32.5°, the average temperature inside the insulation cabin reaches 278.15 K at the fastest. After heating for a while, the temperature distribution in the drill floor area, the middle of the derrick, the second floor, and the top of the derrick is relatively uniform, and there is no supercooling or overheating position. Therefore, the exhaust Angle of the heater is finally determined to be 32.5°.
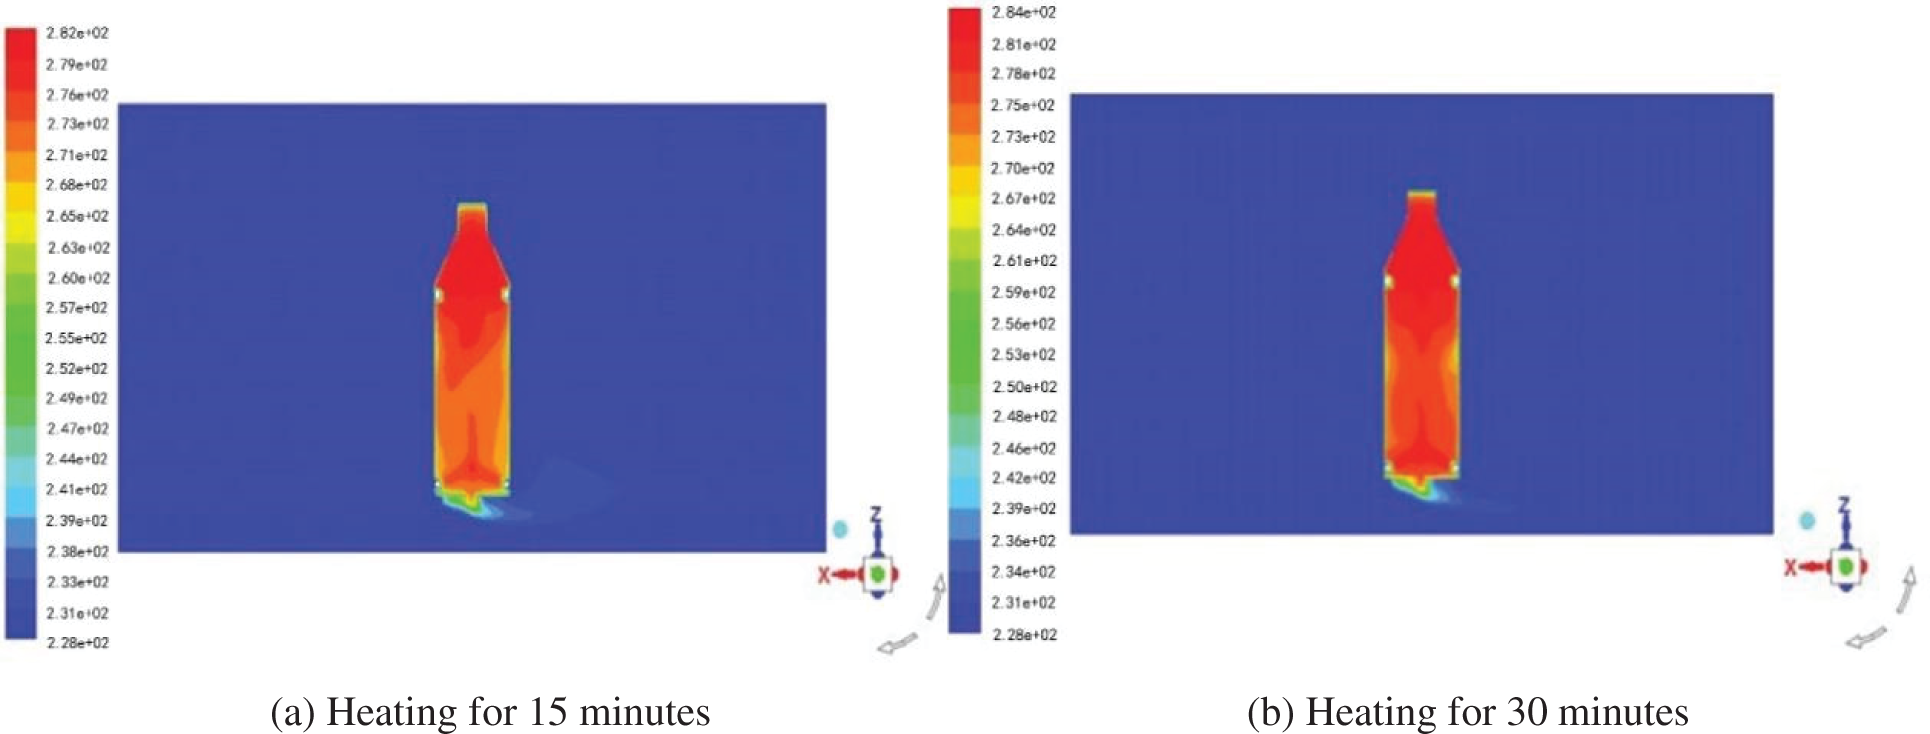
Figure 17: Temperature nephogram of heating 10 and 30 min at 32.5 degrees of heater outlet angle
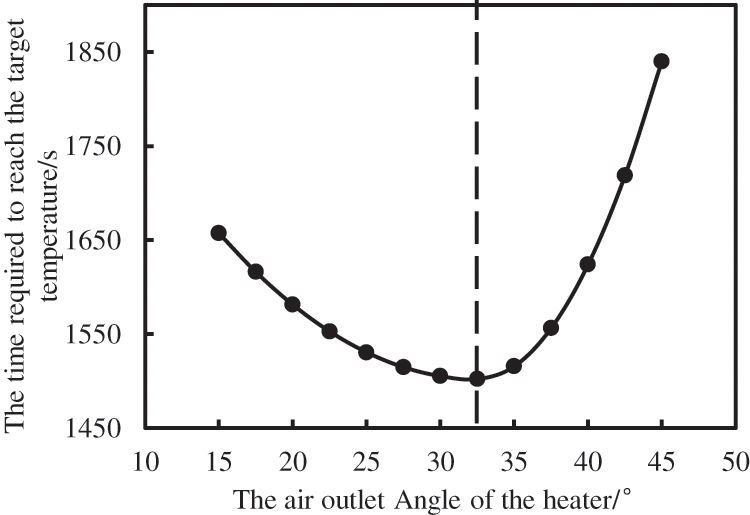
Figure 18: Curves of different air outlet angles of the heater and the time required to reach the target temperature
It can be seen from the Fig. 19 that the heating time required by the system decreases with the increase of the air outlet angle when the air outlet angle of the heater is 15° ≤ θ ≤ 32.5°; and the heating time required by the system increases with the increase of the air outlet angle when θ > 32.5°.
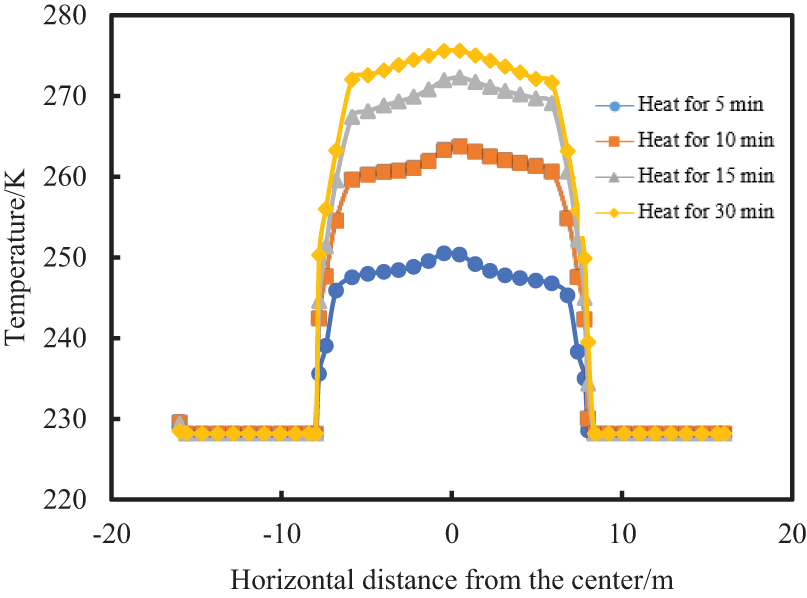
Figure 19: Temperature at the bottom of the drill floor varies along the horizontal center at different heating times
When the air outlet angle of the heater is set to 32.5°, after heating for a while, the temperature distribution along the center section of each position in the insulation room is shown in Figs. 19–21. It can be seen from the above figure that after the cabin is heated for 30 min, the highest average temperature at key positions such as the drill floor, the middle of the derrick and the second floor is 275.548, 277.375, and 282.638 K, respectively, and the temperature at the intersection of the two heater outlets on the drill floor and the second floor is relatively high.
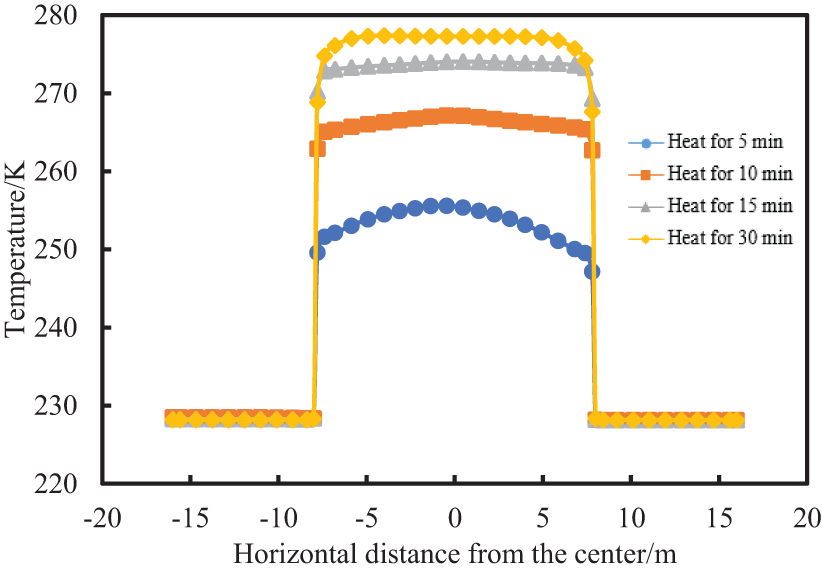
Figure 20: Temperature in the middle of the derrick varies along the horizontal center at different heating times
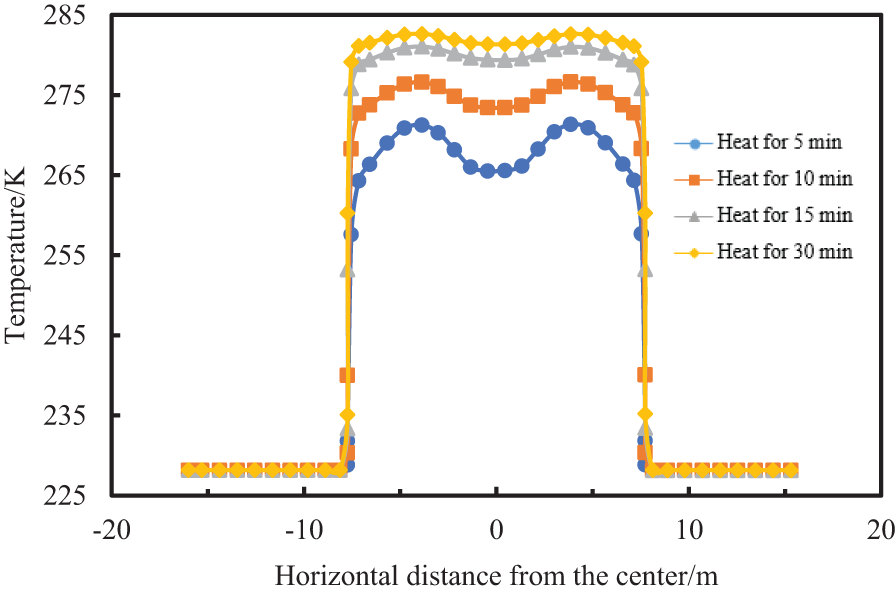
Figure 21: Temperature at the top of the derrick varies along the horizontal center at different heating times
High heating power is the most important energy consumption in the process of insulation and heating of the cabin of the polar ocean drilling platform, and selecting the best heating power can greatly reduce the waste of energy. Table 9 shows the heating power of the drilling rig system calculated according to the heat balance equation under the given parameters. The Fluent software is used to simulate and calculate the time required for the average temperature inside the cabin to reach 278.15 K under different heating powers, and the power-time curves when V doors are closed and opened are shown in Fig. 22.
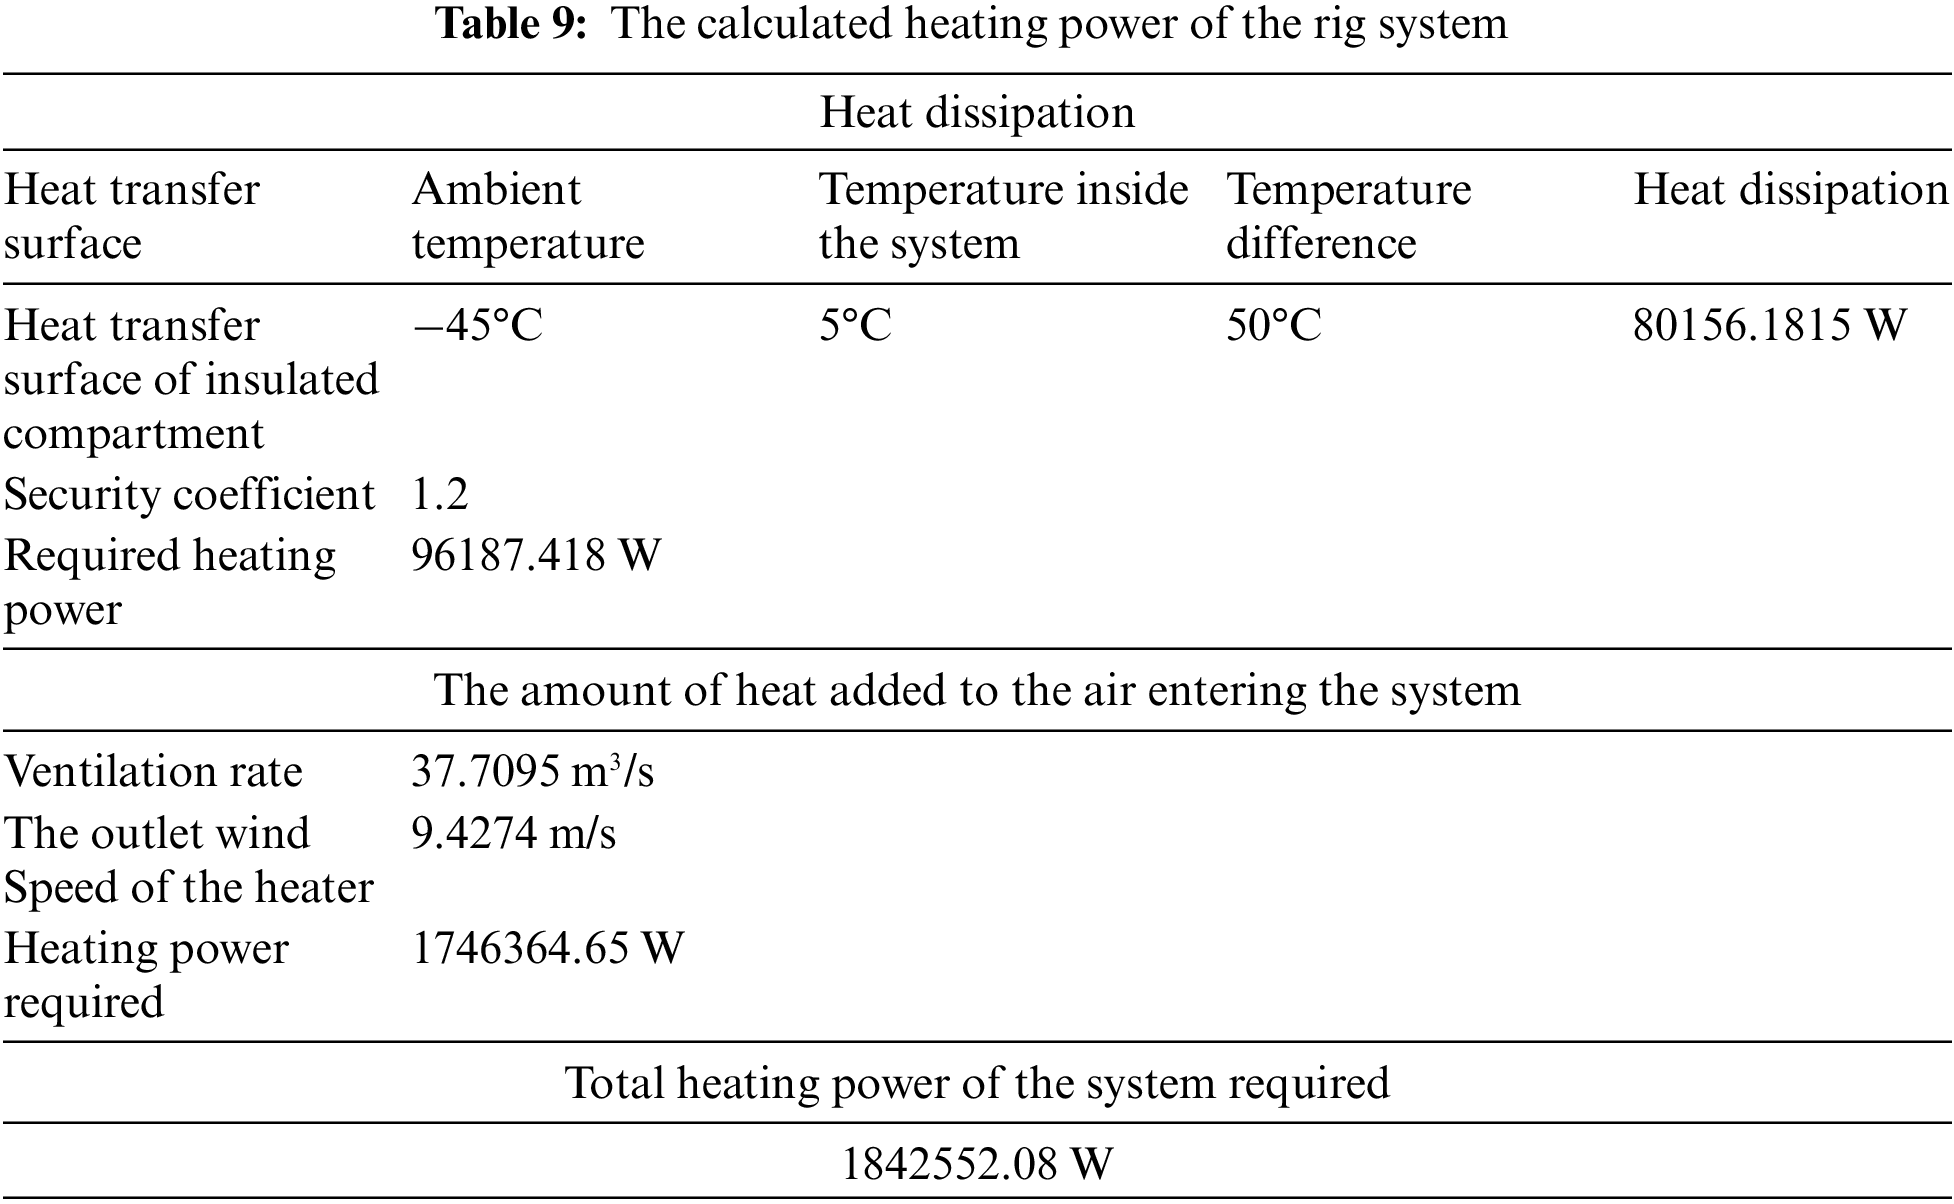

Figure 22: Heating time diagrams of different powers
It can be seen from the Fig. 22 that when the power heat source is 1825 KW, the time required for the rig system to heat up to 5°C is 90 min, which is very close to the heating power of 1842.55 KW calculated by the heat balance equation, so the power can be approximately calculated as the rated heating power of the low-temperature rig system.
By polynomial fitting the data in Fig. 22 the formula between the heating power of the heat source and the time required for heating the average temperature inside the cabin to 5°C is calculated under two working conditions: the V-door is closed and the V-door is open. This formula can estimate the heating time of the cabin when determining the heat source power inside the cabin.
where, t is heat of time, s; q is heating power, W.
This study analyzes the heat dissipation mechanism of the insulation layer and other plane insulation layers in the polar drilling rig system based on the basic theory of heat transfer, combined with the environmental requirements of polar drilling operations and the characteristics of polar drilling processes. The polyisocyanurate with relatively stable thermodynamic performance is selected as the thermal insulation material of the polar drilling rig system by measuring solid thermal conductivity using the steady-state method. Five different thermal insulation materials are simulated as the thermal insulation layer of the polar drilling rig system using Fluent software, and the change rule of the system’s internal temperature under heating is obtained. Finally, it is determined that the thermal insulation material has little effect on the heating effect of the system but has a significant impact on its thermal insulation effect. The heating mode of the polar drilling rig system is optimized based on theoretical calculation and numerical simulation. Through Fluent numerical simulation, the space distribution of the heater is optimized, with two heaters arranged on the drill floor and the second floor of the derrick. When the air outlet angle is set to 32.5°, the heating effect of the system is maximized. The heating power required for the polar drilling rig system to reach 5°C is determined to be 1842.55 KW based on theoretical analysis and numerical simulation under an external environment temperature of −45°C and an external wind speed of 10 m/s.
Acknowledgement: Thanks are due to the editors and reviewers for their valuable opinions, which are of great help to improve the quality of this paper.
Funding Statement: This work was supported by the Key-Area Research and Development Program of Guangdong Province, Research on the Method of Heat Preservation and Heating for the Drilling System of Polar Offshore Drilling Platform (No. 2020B1111010001).
Author Contributions: The authors confirm contribution to the paper as follows: study conception and design: Dong Yingkai, Chen Chaohe; analysis and interpretation of results: Jia Guangyan, Wang Lidai, Bai Jian; draft manuscript preparation: Dong Yingkai. All authors reviewed the results and approved the final version of the manuscript.
Availability of Data and Materials: The authors confirm that the data supporting the findings of this study are available within the article. And the additional data that support the findings of this study are available on request from the corresponding author, upon reasonable request.
Conflicts of Interest: The authors declare that they have no conflicts of interest to report regarding the present study.
References
1. Iannuzzi, M., Barnoush, A., Johnsen, R. (2017). Materials and corrosion trends in offshore and subsea oil and gas production. npj Materials Degradation, 1(1), 2. [Google Scholar]
2. Chan, F. T., Stanislawczyk, K., Sneekes, A. C., Dvoretsky, A., Gollasch, S. et al. (2019). Climate change opens new frontiers for marine species in the Arctic: Current trends and future invasion risks. Global Change Biology, 25(1), 25–38. [Google Scholar] [PubMed]
3. Adumene, S., Ikue-John, H. (2022). Offshore system safety and operational challenges in harsh Arctic operations. Journal of Safety Science and Resilience, 3(2), 153–168. [Google Scholar]
4. Sun, Q., Ji, G. D., Wang, H. G., Wang, L. B., Cui, M. (2012). Status and development trend of Arctic drilling equipment. Petroleum Drilling Techniques, 40(6), 43–46 (In Chinese). [Google Scholar]
5. Koo, M. J., Choi, J. W., Ha, M. K. (2010). Winterization techniques for semi-submersible rig operating in the Arctic Ocean. International Conference on Offshore Mechanics and Arctic Engineering, vol. 49125, pp. 847–854. Shanghai, China. [Google Scholar]
6. Huang, N., Lv, K., Sun, J., Liu, J., Wang, J. et al. (2023). Study on the low-temperature rheology of polar drilling fluid and its regulation method. Gels, 9(2), 168. [Google Scholar] [PubMed]
7. Leusheva, E., Morenov, V. (2022). Effect of temperature conditions in arctic offshore oil fields on the rheological properties of various based drilling muds. Energies, 15(15), 5750. [Google Scholar]
8. Liu, D., Wang, Z., Zheng, K. (2019). Optimization of insulation and heating system of derrick for arctic mobile offshore drilling unit. International Conference on Offshore Mechanics and Arctic Engineering, vol. 58875, V008T07A007. Glasgow, Scotland, UK. [Google Scholar]
9. Shi, G., Feng, J., Kang, M., Zhang, Z., Liu, Y. (2021). Polar offshore engineering equipment: Development status and key technologies. Strategic Study of Chinese Academy of Engineering, 23(3), 144–152 (In Chinese). [Google Scholar]
10. Wang, X., Wang, Z., Deng, X., Sun, B., Zhao, Y. et al. (2017). Coupled thermal model of wellbore and permafrost in Arctic regions. Applied Thermal Engineering, 123, 1291–1299. [Google Scholar]
11. Ma, Y., Yang, J., Feng, P., Zhang, C. (2020). The challenges and key technology of drilling safety in the area of the Arctic. Proceedings of the International Field Exploration and Development Conference 2018, pp. 522–532. Singapore, Springer. [Google Scholar]
12. Miao, B., Zhang, J., Pang, S. Q., Wu, A. P., Nie, J. L. (2016). Design of zj50/3150db low temperature train type drilling rig. Mechanical Research & Application, 29(3), 114–116 (In Chinese). [Google Scholar]
13. Liu, Z. P., Li, Z. L., Xu, Y. M., Tian, Z., Li, J. J. et al. (2014). Design of preservation and heating system of low temperature drill rig. Oil Field Equipment, 8(11), 28–31 (In Chinese). [Google Scholar]
14. Hu, Z., Huang, T., Zhang, L., Yang, M. (2015). Numerical simulation of coupled heat transfer for LNG pipeline. CIESC Journal, 66, 206–212. [Google Scholar]
15. Li, P., Guan, P., Zheng, J., Dou, B., Tian, H. et al. (2020). Field test and numerical simulation on heat transfer performance of coaxial borehole heat exchanger. Energies, 13(20), 5471. [Google Scholar]
16. Tao, W. Q. (2001). Numerical heat transfer. China: Xi’an Jiao Tong University Publishing Company. [Google Scholar]
17. Liu, Y., Kong, Z., Jiang, Q., Dong, X. (2023). The potential strategy of promoting China’s participation in arctic energy development. Renewable and Sustainable Energy Reviews, 183, 113438. [Google Scholar]
18. Zhang, H., Shang, C., Tang, G. (2022). Measurement and identification of temperature-dependent thermal conductivity for thermal insulation materials under large temperature difference. International Journal of Thermal Sciences, 171, 107261. [Google Scholar]
19. Kaynakli, O. (2014). Economic thermal insulation thickness for pipes and ducts: A review study. Renewable and Sustainable Energy Reviews, 30, 184–194. [Google Scholar]
20. Hauge, M. (2012). Arctic offshore materials and platform winterization. ISOPE International Ocean and Polar Engineering Conference, ISOPE-I. Greece, Rhodes, ISOPE. [Google Scholar]
Cite This Article
 Copyright © 2024 The Author(s). Published by Tech Science Press.
This work is licensed under a Creative Commons Attribution 4.0 International License , which permits unrestricted use, distribution, and reproduction in any medium, provided the original work is properly cited.
 Downloads
 Citation Tools