
 Submit a Paper
 Propose a Special lssue
 Open Access
ARTICLE

Random Forest and Order Parameters: A Combined Framework for Scenario Recognition for Power Systems with Renewable Penetration
1 Electric Power Research Institute, State Grid Jiangsu Electric Power Co., Ltd., Nanjing, 211103, China
2 School of Electrical and Information Engineering, Changsha University of Science and Technology, Changsha, 410004, China
* Corresponding Authors: Xiaoxing Lu. Email: ,
Energy Engineering 2025, 122(8), 3117-3132. https://doi.org/10.32604/ee.2025.065631
Received 18 March 2025; Accepted 05 June 2025; Issue published 24 July 2025
 View Full Text
 Download PDF
Abstract
With the popularization of microgrid construction and the connection of renewable energy sources to the power system, the problem of source and load uncertainty faced by the coordinated operation of multi-microgrid is becoming increasingly prominent, and the accuracy of typical scenario predictions is low. In order to improve the accuracy of scenario prediction under source and load uncertainty, this paper proposes a typical scenario identification model based on random forests and order parameters. Firstly, a method for ordinal parameter identification and quantification is provided for the coordinated operating mode of multi-microgrids, taking into account source-load uncertainty. Secondly, the dynamic change characteristics of the order parameters of the daily load curve, wind and solar curve, and load curve of typical scenarios are statistically analyzed to identify the key order parameters that have the most significant impact on the uncertainty of the load. Then, the order parameters and seasonal distribution are used as features to train a random forest classification model to achieve efficient scenario prediction. Finally, the simulation of actual data from a provincial distribution network shows that the proposed method can accurately classify typical scenarios with an accuracy rate of 92.7%. Additionally, sensitivity analysis is conducted to assess how changes in uncertainty levels affect the importance of each order parameter, allowing for adaptive uncertainty mitigation strategies.Keywords
With the acceleration of energy transition, microgrids, as a kind of small-scale power system integrating distributed energy resources, energy storage systems and local loads, have been widely applied and developed worldwide. Microgrids can effectively integrate renewable energy sources such as solar and wind, realize local consumption and efficient utilization of energy, and provide a feasible solution to alleviate the energy crisis and environmental pressure [1]. However, the large-scale access of microgrids also brings new challenges to the power system. The access to a large number of new energy sources in microgrids brings a clean and renewable energy supply. Meanwhile, it introduces the source-load uncertainty problem [2]. This source-load uncertainty problem threatens the stability of the power system and challenges the system’s operation and management [3]. Therefore, accurately obtaining typical scenarios of grid operation becomes a fundamental technology for operating and managing new energy power systems with high penetration rates.
Scenario identification [4] has become one of the essential techniques to address the grid operation under source-load uncertainty. Scenario identification refers to identifying operation scenarios that contain dynamic changes in the source and load by analyzing the key time-series features [5] and joint probabilities [6] of source and load historical data and then adjusting the system management strategy based on these scenarios. Existing scenario identification methods mainly include the boundary method [7], the clustering method [8], the threshold method [9], and the model predictive control method [10]. To further improve the accuracy and efficiency of scenario identification, researchers have refined the daily business requirements. In [11], a discretization technique is used to assign the set of scenarios to different intervals. Then the scenarios with characteristics similar to those of extreme scenarios are aggregated by a clustering method. In [12], identical load characteristics and distributed generation outputs are grouped by clustering algorithms, and representative scenarios are selected from them, which helps to identify load characteristics under different levels of distributed generation integration and provides a more accurate basis for power system planning and operation.
In addition, an increasing number of deep learning methods [13] have also been applied to the research of scenario identification. In [14], an unsupervised deep learning approach based on generative adversarial networks was proposed to generate scenario forecasts for renewable energy and load in power systems, capturing spatial and temporal correlations effectively. In [15], a deep learning-based forecasting model was developed to evaluate renewable energy scenarios, demonstrating improved accuracy in predicting electricity demand and generation fluctuations, thereby aiding in sustainable energy policy planning.
With the increase in the proportion of new energy access, the above scenario identification methods still have limitations in dealing with complex scenarios, and their adaptability to nonlinear dynamic response is weak, which can easily lead to prediction errors. Therefore, how to improve the accuracy of scenario identification in the intense uncertainty of the operating environment has become the focus and difficulty of current research.
In recent years, several advanced methods have been proposed to enhance scenario identification under source-load uncertainty in microgrids. In [16], an attention-based deep learning framework was developed to capture temporal dependencies and anomalies in microgrid performance data, improving the robustness of time-series forecasting. In [17], scenario-based uncertainty modeling was applied to multi-objective energy management, highlighting the significance of incorporating forecast errors in both load and renewable generation. A complementary study in [18] introduced a scenario reduction method using Latin Hypercube sampling and hierarchical clustering, addressing the balance between scenario representativeness and computational burden. In addition, machine learning techniques have been employed in related tasks: for instance, Ref. [19] proposed a fault identification framework using K-means clustering and FP-growth, while Ref. [20] leveraged deep reinforcement learning to handle dispatch optimization in isolated microgrids with renewable volatility. In [21], clustering-based scenario extraction was applied to working condition recognition in a real-world microgrid, providing insights into system behavior segmentation.
1.2 Research Gaps and Contributions
Recent methods indicate that research is increasingly shifting toward data-driven and learning-driven approaches. These include deep learning, reinforcement learning, and clustering-based methods that have shown promising results in scenario identification under uncertainty. However, these methods still face several limitations. Specifically, they often lack interpretability, overlook the inherent coupling among variables, and impose significant computational burdens when applied in real-time operational environments.
To overcome these gaps, it is essential to explore new paradigms that can balance model accuracy, interpretability, and computational efficiency. In this context, introducing order parameters offers a novel and theoretically grounded perspective on scenario recognition. Order parameters originate from Synergetics theory [22], which describes the emergence of macroscopic patterns from the cooperative behavior of interacting subsystems. These parameters reflect the essential characteristics of system-wide dynamics and can be used to capture the structural evolution of complex systems under changing conditions.
This paper provides a framework for typical scenario identification based on order parameters in light of the uncertainty associated with source load. The framework characterizes the outcomes of order parameters in contexts of substantial source load uncertainty, identifies the key order parameter that most profoundly influences source load characteristics, and proposes appropriate uncertainty mitigation strategies for various key order parameter to reduce the detrimental effects of source load uncertainty. Sensitivity analyses of the order parameters are conducted to quantify the impact of projected changes in uncertainty on these parameters. The overall framework of the typical scenario identification approach is depicted in Fig. 1, and the contributions of the conducted research in this paper can be summarized as follows:
(1) A novel scenario identification framework is proposed based on Synergetics-derived order parameters, which enables the identification of key factors influencing system behavior under source-load uncertainties. This approach combines machine learning with system dynamics, improving both scenario recognition model interpretability.
(2) A typical scenario recognition model is constructed using the random forest algorithm, where order parameters and seasonal features serve as interpretable features for identifying typical scenarios. The model demonstrates superior performance in both classification accuracy and computational efficiency compared to traditional approaches.
(3) Sensitivity analysis to assess the response of key order parameters to uncertainty variations. This analysis observes the changes of order parameters with different decreases in the ideal values of the indicators, judges their importance and trends, and provides the basis for strategies to cope with uncertainties.

Figure 1: Typical scenarios recognition framework diagram based on key order parameters and random forest
The outline of this paper is as follows: Section 2 establishes a model for identifying order parameters. Section 3 describes how to train the identification model using the random forest algorithm. Section 4 discusses the case study and results. Finally, Section 5 gives the conclusions.
2 Typical Scenario-Based Model for Identifying Key Order Parameters with Source-Load Uncertainty
2.1 The Principle of Order Parameter
According to synergetics, a nonlinear system with a complex structure is an evolutionary self-organizing system with common properties: the ordered structure of the system is formed through self-arrangement and self-organization of individual subsystems, and a few order parameters usually dominate the emergence of a structure or the generation of a new structure.
In modern power systems, the problem of source-load fluctuations is becoming increasingly prominent. The output of new energy generation shows intense uncertainty, with maximum daily fluctuations often exceeding 200%, while the load-side demand also fluctuates significantly due to a variety of factors. These unstable factors are intertwined with each other, making the power system constitute a considerable number of operational scenarios, which theoretically even tend to be infinite. According to the theory of synergetics, despite the large number of variables in the power system and the seemingly chaotic operational scenarios, only a few order parameters play a decisive role near the critical point of qualitative change in the structure. In the operating scenarios of the power system, these key order parameters are the main factors affecting the uncertainty. For example, the real-time power change rate of new energy generation, the peak-to-valley difference of loads, etc., may become key order parameters. They not only originate from the synergies among the power system’s generation, transmission, distribution, and consumption segments but also govern the behavior of the subsystems in turn.
Order parameters can effectively portray the differences between different operating scenarios. When the system is in a relatively stable state, multiple order parameters cooperate and jointly determine the macrostructure of the system to ensure the regular operation of the power system. However, as the source-load fluctuations intensify, the system gradually approaches the critical point, and the competition among the order parameters becomes more and more intense. Eventually, when the control parameters reach a new threshold, the system will be dominated by a single-order parameter.
2.2 Determination of Order Parameters
When new energy sources are connected to the grid, the uncertainty of the source load can lead to an explosion of the set of operating scenarios. Assuming that there are n scenarios when multiple microgrids operate collaboratively, there are j types of sample data, each of which has k possible discrete states at each time point, and the scheduling time window is one year (8760 h). The time interval of the data is one hour, then the total number of scenarios as shown in Eq. (1).
The explosive growth of the total number of scenarios leads to computational difficulties. In order to reduce the problem of the explosion of the set of running scenarios, this paper adopts the IGDT-spectral clustering method to analyze the historical data. By extracting the system’s regulating ability under different source load fluctuations, it obtains representative typical scenarios of source load, aiming to cope with varying demands of scheduling. From these scenarios, 14 types of typical scenarios are selected (as shown in Fig. 2), and each scenario represents a different source load uncertainty pattern. The dynamic change characteristics of the daily load profile, wind power profile and load profile of the typical scenarios are analyzed to identify the order parameters.
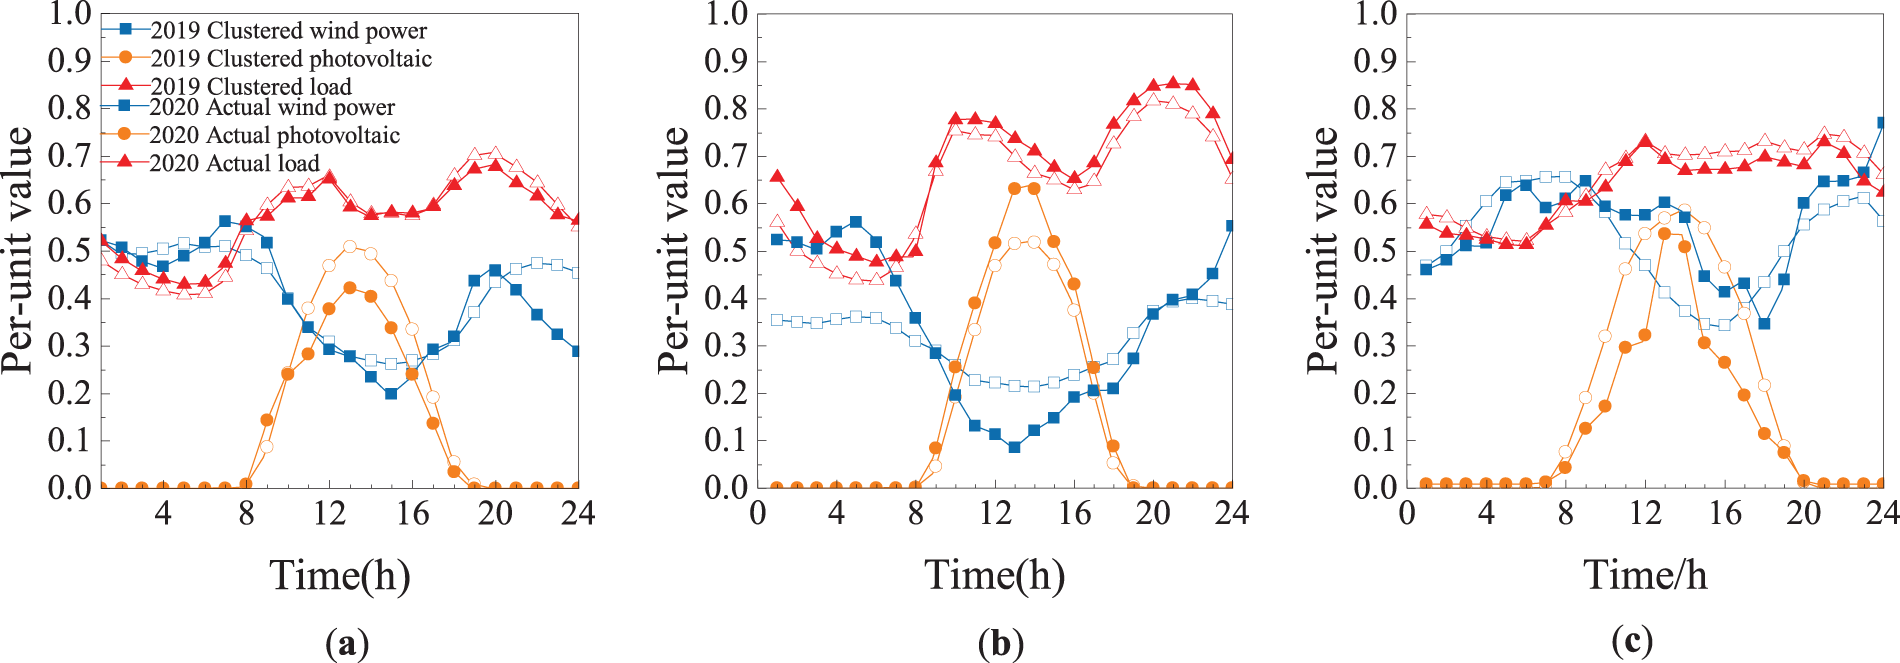
Figure 2: Some typical source-load scenarios: wind, PV, and load fluctuation profiles. (a) Scenario 1 (b) Scenario 5 (c) Scenario 9
For any typical scenario i, the degree of uncertainty can be expressed by the state parameter
Among these, wind power, photovoltaics and load fluctuations are all characterized by the corresponding standard deviation, as shown in Eq. (2).
where
where
where
In the state variable
where
In the goal planning optimization model, the basic idea is that each scenario expects to have the shortest distance from the ideal uncertainty level goal. Based on this, the most important parameters in each scenario that have the most significant impact on uncertainty can be determined from the perspective of what is most beneficial to each scenario, i.e., the order parameters. Therefore, an order parameter identification model that is based on the idea of the goal planning model and has the most significant impact on uncertainty can be obtained, as shown in Eq. (7).
In the above model, the key factor that has the most significant impact on the degree of uncertainty is identified mainly in the order parameter
By solving the above model,
3 Source-Load Scenario Identification Model Based on Random Forest Algorithm
Upon acquiring typical scenarios throughout the dispatch planning process, future scenarios can be anticipated and categorized into established typical scenario classifications, facilitating the preemptive formulation of relevant dispatch operation plans. A paradigm for identifying source-load scenarios based on the random forest algorithm [23] is proposed. This model employs a machine learning algorithm to discern the intricate relationships within source-load data characteristics accurately and to identify and categorize anticipated scenarios based on order parameters, thereby enabling the formulation of response strategies in uncertain situations.
3.1 Data Set Partitioning and Preprocessing
A training set is used to train the model by inputting 70% of the large-scale original scenario, and the remaining 30% is used as a test set to detect the accuracy of the model. Let the total number of samples in the original data set be N. The training set and test set are shown in Eqs. (10) and (11).
where
The SMOTE method oversamples the training set to correct the class imbalance. For the minority class samples in the training set, new samples are synthesized by linear interpolation to balance the number of samples in each class. Let
where
Then, the bootstrap sampling method is used to randomly and repeatedly select n samples from the training data set to form a subset of data for training and constructing n decision trees. This process is repeated m times to generate m subsets of data, each with the same sample size.
3.2 Random Forest Model Training
Based on the order parameter recognition model in Section 3.2, the order parameters and seasonal distributions obtained from each training scenario are used as the training set to identify features, as shown in Eq. (13).
where
When constructing a random forest model, the key hyperparameters include the number of decision trees, the maximum depth of each tree, the minimum number of samples per node, and the number of randomly selected features at each split. In order to improve the prediction accuracy of the model and prevent overfitting, the optimal hyper-parameters are selected using Cross-Validation and Grid Search methods.
K-fold cross-validation is used to evaluate the performance of different combinations of hyperparameters. In each fold, the training dataset is divided into K−1 subsets, one of which is used to train the model and the remaining one is used to validate the model. Cross-validation can help reduce the model’s dependence on a single training set and improve the model’s stability.
A grid search method is employed to explore hyperparameters and identify the optimal combination. Grid search assesses the impact of each hyperparameter set through cross-validation by systematically testing all conceivable combinations of hyperparameters. The grid search assesses the model’s efficacy on the training set for each hyperparameter combination, and its cross-validation score is computed. The final model configuration is determined by selecting the combination of hyperparameters that yields the greatest score.
For classification tasks, the random forest votes by integrating the prediction results of multiple decision trees and comprehensively determines the classification result of the decision tree to obtain the source load scenario identification model, as shown in Eq. (14).
where y is the correct classification result,
Finally, the accuracy of the model is evaluated using a test set. 1() is the indicator function, which takes the value 1 when the predicted value equals the actual value and 0 otherwise. The accuracy is evaluated using the accuracy rate as shown in Eq. (15).
3.3 Random Forest Algorithm Flow
Fig. 3 illustrates the workflow of a conventional scenario recognition model predicated on order parameters. The precise steps are outlined as follows:
(1) Initially, 70% of the extensive original scenarios are allocated as the training set for model training, while the remaining 30% serves as the test set. SMOTE is employed to augment the training set data.
(2) Utilizing the Bootstrap approach, numerous training sample subsets are randomly drawn from the training set, and decision tree modeling is conducted on each subset independently.
(3) Cross-validation and grid search are employed to tune hyperparameters and enhance the model. Cross-validation evaluates each decision tree, while grid search identifies the optimal hyperparameters. Various decision trees are constructed following iterative evaluation, and the test outcomes of these multiple decision trees are amalgamated to derive the final scenario recognition model by voting.
(4) Finally, the recognition model’s accuracy is evaluated using the test set.

Figure 3: Random forest-based scenario recognition workflow
4.1 Identification Results of Key Order Parameters
This chapter takes 14 typical source load scenarios obtained from a provincial state grid as the research object and studies. It analyzes the key factors that affect the degree of uncertainty the most in each typical scenario. The order parameters that affect the degree the most will be identified below. The identification of order parameters was implemented via Python 3.10, leveraging numerical computation libraries (NumPy v1.24.3 and SciPy v1.10.1) to solve the goal planning optimization model and calculate normalized indicators. The specific calculation results of the order parameter identification are shown in Table 1.
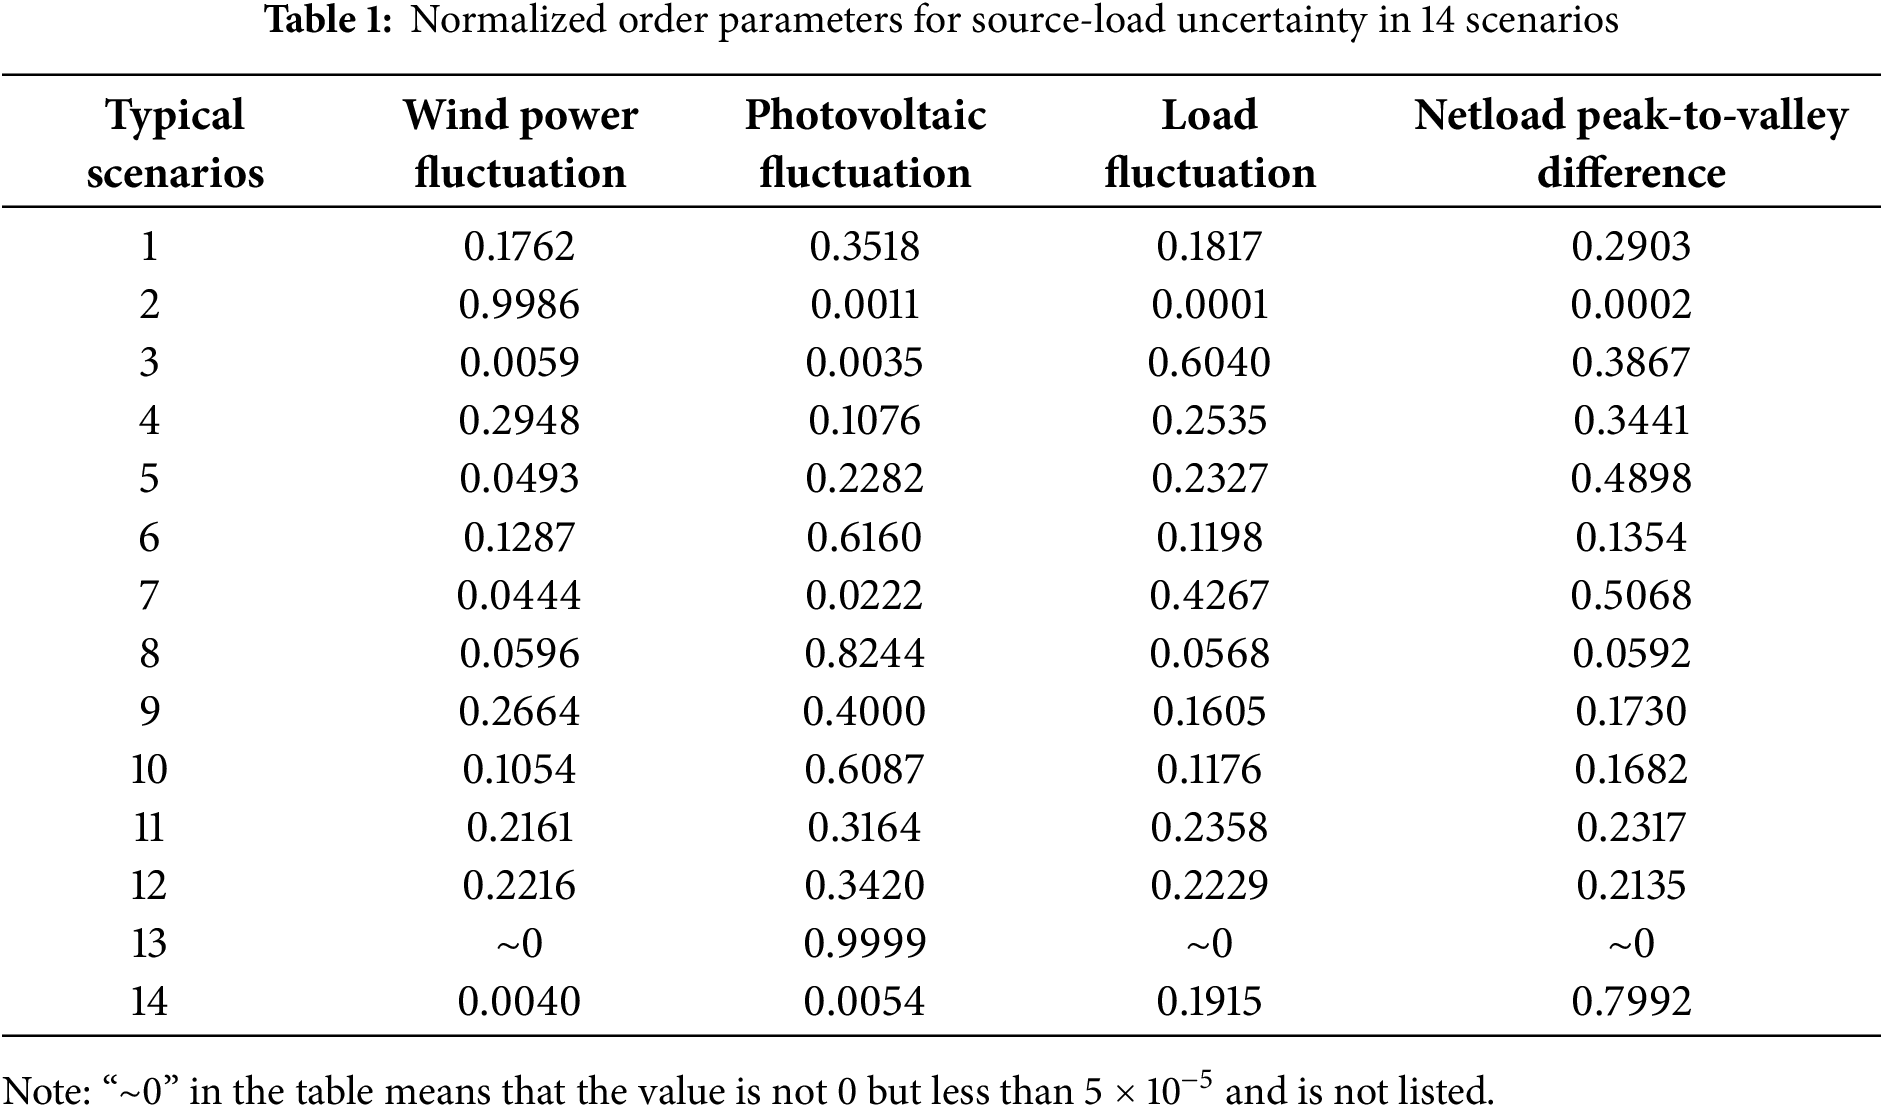
Table 1 shows that the magnitudes of the four order parameters in different scenarios are different, indicating that the impact of the same influencing factors on the degree of uncertainty varies in different source load scenarios. The key order parameters with the most significant impact on uncertainty after ranking and the key order parameters for each scenario are shown in Table 2.
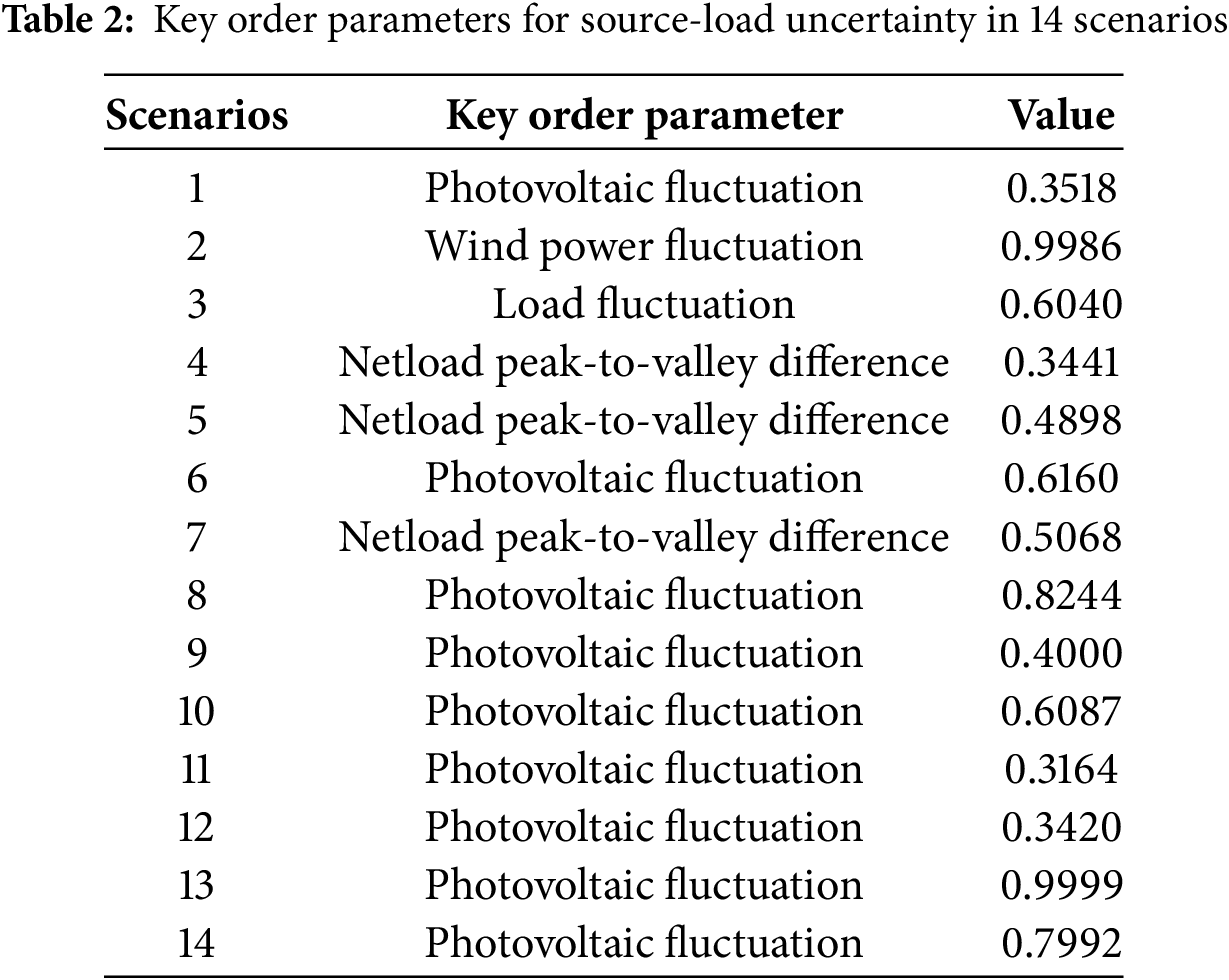
Table 2 illustrates that, despite the uniformity of key order parameter are the same, substantial discrepancies exist in their numerical values. The key order parameter in scenarios 1, 6, 8, 9, 10, 11, 12, and 13 are oscillations in photovoltaic output. Nonetheless, the results vary, suggesting that the uncertainty of photovoltaic variations has varying degrees of influence across different scenarios. The remaining three categories of order parameters also influence the numerical value. Specifically, the data in Table 1 indicates that the PV fluctuation order parameter for scenario 8 is 0.8244, whereas the other three order parameters are approximately 0.05. This signifies that in this context, the extent of PV variation is significant, and its influence on uncertainty dramatically surpasses that of other variables. It is essential to develop response plans for photovoltaic variations to mitigate uncertainty. In scenario 11, the PV fluctuation order parameter is 0.3164, while the other three order parameters exceed 0.2. This indicates that although PV fluctuations have the most significant impact, the uncertainty introduced by the other three order parameters should not be overlooked. The precise values of various order parameters in each scenario contribute to establishing a theoretical foundation for developing uncertainty response techniques and enhancing the adaptability and flexibility of improvement approaches.
For the key order parameters in each scenario, related management advice can be given to deal with uncertainty. Among them, the PV fluctuation order parameters in scenarios 1, 6, 8, 9, 10, 11, 12, and 13 are significantly high, at 0.3518, 0.616, 0.8244, 0.4, 0.6087, 0.3164, 0.3420 and 0.9999, indicating that the fluctuation of photovoltaic power generation is relatively considerable in these situations. It is feasible to optimize the layout of photovoltaic power generation to improve the system’s usage rate. At the same time, a high-precision photovoltaic prediction system can be installed, paired with energy storage equipment and intelligent scheduling algorithms, to smooth out fluctuations in photovoltaic power output and assure a stable power supply for the system.
The greatest order parameter value in scenario 2 is wind power fluctuation, which is 0.9986, suggesting considerable wind power instability. On the one hand, the wind farm’s capacity can be raised, and a highly efficient wind power prediction algorithm can be introduced to monitor wind power fluctuations in real time and adjust wind power operation in combination with the prediction model. On the other hand, energy storage technology can be deployed, or additional standby power generation equipment can be added to cope with the issues given by wind power fluctuations.
The load in scenario 3 swings substantially, with an order parameter of 0.604. Enhancing load-side management, adopting an intelligent dispatching system, and forecasting load fluctuations to achieve rapid adjustment and optimization of load fluctuations may decrease uncertainty and increase system stability.
The peak-to-valley differences of the net loads in scenarios 4, 5, 7, and 14 are relatively substantial, with order parameter sizes of 0.3441, 0.4898, 0.5068, and 0.7992, respectively. This suggests that the loads in these scenarios are more erratic, and the anti-peak characteristics of the new energy output are strong. Therefore, energy storage equipment, such as pumped storage power stations or battery energy storage systems, can smooth the net load curve and lessen the peak-to-valley disparity. Introducing energy storage equipment can efficiently cope with uncertainties, flexibly regulate energy storage and release, and improve the system’s adaptability.
The above recommendations aim to improve the system’s flexibility and stability so that it can better adapt to fluctuations in photovoltaic and wind power and the uncertainty of load demand. This will ensure a balance between energy supply and demand and thus ensure the reliable operation of the energy system.
4.2 Source-Load Scenario Identification Results
The identification model may identify future prediction scenarios and determine the typical scenario to which each forecast belongs. This facilitates the preemptive formulation of relevant dispatching and operational strategies. The random forest classification model was developed using Python’s scikit-learn library (v1.3.0). The original scenario data utilized in the training set were derived entirely from the region’s historical data from 2019. The 366 source-load scenarios from 2020 were initially input into the order parameter identification model outlined in Section 2.2 to assess the model’s effectiveness in recognizing and categorizing prediction scenarios. The order parameter value was computed, and the order parameter and seasonal distribution served as identification features in the source-load scenario identification model utilizing the random forest algorithm to derive the final identification result, as illustrated in Fig. 4.

Figure 4: Results of the identification of typical scenarios with seasonal distribution in 2020
The seasonal distributions of typical scenarios are: spring scenarios 6, 11, 13, summer scenarios 8, 9, 10, fall scenarios 1, 2, 12, and winter scenarios 3, 4, 5, 7, and 14. As can be seen in Fig. 4, the recognition results of the model correspond well to the seasonal distributions of typical scenarios.
In addition, to comprehensively validate the proposed framework, we compared the Random Forest and Order Parameter model with five widely-used classification methods: Decision Tree, AdaBoost, Gradient Boosting, Support Vector Machine (SVM), Neural Network. All models were tested on the 2020 dataset (366 scenarios) using identical features (order parameters and seasonal distributions). Hyperparameters were optimized via grid search, and performance metrics were averaged over 10-fold cross-validation. Table 3 summarizes the performance metrics across models.
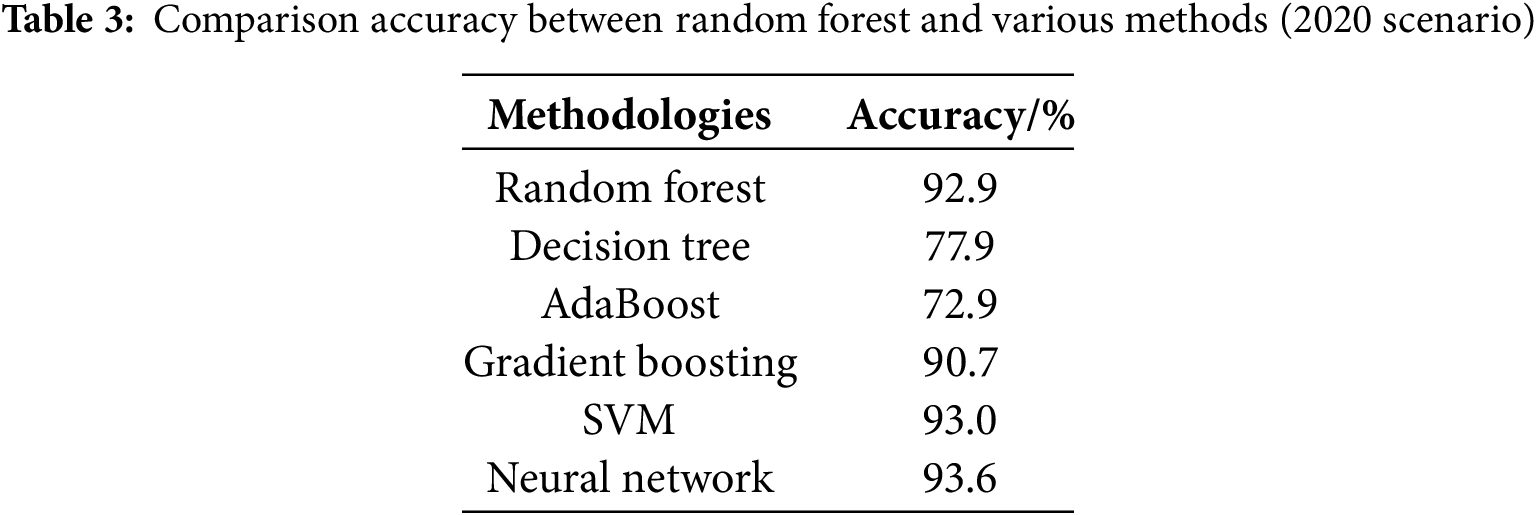
As shown in the model comparison results in Table 3, Random Forest (92.9%) demonstrates a significant advantage over traditional decision trees (77.9%) in scene recognition tasks, with an accuracy improvement of approximately 15%. This improvement is mainly due to the fact that random forest reduces the risk of overfitting by integrating multiple decision trees and enhances the generalization ability of the model through Bootstrap sampling and feature randomness. However, support vector machines (SVM, 93.0%) and neural networks (93.6%) have slightly higher accuracy rates than random forest, due to their more efficient modeling capabilities for nonlinear feature interactions. Nevertheless, random forests still have clear advantages in computational efficiency and interpretability: their analysis based on feature importance can directly reflect the impact of sequence parameters on classification results, while “black box” models like neural networks struggle to provide such physical interpretability.
4.3 Sensitivity Analysis of Order Parameter
A sensitivity analysis of the order parameters is conducted to assess the influence of anticipated changes in uncertainty on these parameters and to reduce the adverse impact of source-load uncertainty on scheduling. The objective is to establish that when a specific optimal value of the index is diminished, indicating a reduction in a certain level of uncertainty, targeted countermeasures can be developed by adjusting the weights of various order parameters. This approach provides a theoretical foundation for uncertainty management and enhances the system’s reliability and stability. The ideal value of each indicator is systematically decreased in 5% increments from 10% to 60%, and the sensitivity of the order parameters for each scenario is visually analyzed, as depicted in Fig. 5. Only the results of select scenarios are presented, as the analytical process remains consistent across cases.

Figure 5: Visualization of the sensitivity of order parameters to ideal value reduction for selected scenarios. (a) Scenario 1 (b) Scenario 5 (c) Scenario 9
Fig. 5 illustrates that in various typical scenarios, as the anticipated uncertainty diminishes, the significance of each order parameter varies distinctly, exhibiting divergent trends and magnitudes of change: some order parameters escalate as the ideal value declines, while others diminish; some alterations are pronounced and sensitive, whereas others exhibit minimal change or remain relatively stable. Furthermore, as the anticipated uncertainty diminishes to a specific degree, new critical order factors will emerge.
In Fig. 5a, when the ideal index value diminishes, the order parameter values of photovoltaic and wind power fluctuations rise, but the net load peak-valley difference and load fluctuations decline. Consequently, when the anticipated degree of uncertainty reduction increases the influence of photovoltaic and wind power oscillations on uncertainty becomes increasingly pronounced, necessitating heightened attention to these factors. Specific measures must be implemented to mitigate uncertainty. Nevertheless, the principal order parameters remain unchanged, and the influence of PV variations on uncertainty continues to be the most substantial. The slope of the order parameter curve for PV fluctuations and netload peak-valley difference is substantial, signifying its sensitivity to variations in anticipated uncertainty. This indicates that in Scenario 1, although photovoltaic fluctuations should be prioritized in uncertainty management, the impact of wind power generation and load fluctuations on uncertainty changes is relatively small and may not require immediate attention.
In Fig. 5b, as the anticipated degree of uncertainty diminishes, the influence of photovoltaic and wind power fluctuations on uncertainty becomes increasingly evident. Conversely, the net load peak-to-valley disparity and load variations exert an opposing influence. Simultaneously, it is evident that a 60% reduction in the ideal value results in a transition of the key order parameter from netload peak difference to wind power fluctuation, indicating that a 60% decrease in the desired level of uncertainty renders the influence of wind power fluctuation greater than that of net load peak difference. Currently, it is essential to focus on the new key order parameters, as targeted enhancement strategies will be more effective in mitigating uncertainty and augmenting system reliability. Nonetheless, it is important to be mindful that the value of the order parameter for the net load peak and valley difference remains large. The slope of the order parameter curves for net load peak and valley differences, as well as wind power fluctuations, is substantial, indicating strong sensitivity. The variations in solar output and load are minimal and lack sufficient sensitivity. Therefore, in Scenario 4, as the dominance of wind power fluctuations increases, system adjustments should prioritize managing wind power fluctuations while still considering the significant role of net load peak-to-valley differences.
In Fig. 5c, as the uncertainty of expectations diminishes, the values of the order parameters for photovoltaic and wind power fluctuations rise. In contrast, the net load peak-to-valley difference and load fluctuations decline. The net load peak-to-valley difference is a key order characteristic, and while its impact is diminishing, it remains the most significant influencing factor. The magnitude of photovoltaic fluctuations change is substantial, and the sensitivity is elevated. The order parameter of wind power fluctuation is modest throughout, approximately 0.05, showing that in this context, the influence of wind power output variability on uncertainty is negligible. Both load variation and wind power variation are non-sensitive order factors. Therefore, in Scenario 5, while the net load peak-to-valley difference continues to be the most influential factor affecting uncertainty, its diminishing influence suggests that photovoltaic fluctuations should be considered in managing uncertainty. Wind power fluctuations and load variations, being non-sensitive order factors, have a relatively minor role in this scenario and can be deprioritized in uncertainty mitigation strategies.
In summary, in different scenarios, the degree of importance and change of each order parameter can be judged according to the change of the expected uncertainty reduction of the order parameter, which helps to propose flexible uncertainty response strategies and improve system reliability.
5 Conclusion and Future Prospects
This paper establishes a key order parameter identification model for identifying key order parameters related to source load uncertainty based on typical scenarios. The objective is to identify the principal elements influencing uncertainty across diverse source load scenarios and recommend appropriate management strategies. Concurrently, a model for identifying source load scenarios via the random forest technique is created to categorize future prediction scenarios into predetermined typical scenario classifications.
Simulations utilizing the actual system and data of a provincial power grid have resulted in the following conclusions:
(1) The proposed framework integrates order parameters from Synergetics theory, combining physical insights with machine learning for improved scenario recognition. Unlike purely data-driven methods, this approach enhances both accuracy and interpretability by identifying key factors, such as photovoltaic and wind power fluctuations, influencing system uncertainty.
(2) The source-load scenario identification model utilizing the random forest method aligns effectively with the seasonal distribution of typical scenarios. The model has an identification accuracy of 92.9%, surpassing the decision tree method’s accuracy of 77.9% by 15%. Its detection capability surpasses conventional methods, facilitating the management of source-load uncertainty scenarios and the proactive formulation of strategies.
(3) The impact of the expected percentage reduction in uncertainty on the importance of each type of order parameter is quantified through sensitivity analysis of the order parameters. Simulation shows that in different typical scenarios, as the expected degree of uncertainty reduction varies, the importance of each order parameter also changes. Changes in order parameters can help propose flexible uncertainty response strategies.
While the proposed framework demonstrates high accuracy and interpretability, several practical challenges must be addressed for real-world implementation. First, the computational complexity of training the random forest model on large-scale datasets may require optimized algorithms or distributed computing resources, especially for real-time scenario recognition in power systems with high sampling frequencies. Second, the quality and granularity of historical data directly impact model performance; incomplete or noisy data may degrade classification accuracy. Lastly, dynamic adaptation to emerging uncertainty patterns (e.g., extreme weather events) requires continuous model retraining, which could introduce latency in decision-making. Addressing these challenges will enhance the framework’s applicability in operational environments.
When selecting state indicators for identifying key sequence parameters of source load uncertainty based on typical scenarios, this paper independently selected four types of evaluation indicators closely related to source load uncertainty but did not further evaluate the indicators, which is somewhat subjective and insufficient in number. Therefore, the indicator selection method can be optimized by adding an indicator evaluation process to ensure the rationality and adequacy of the indicators selected.
Acknowledgement: The authors would like to thank the Electric Power Scientific Research Institute of China Jiangsu Electric Power Co.
Funding Statement: This work was supported by Science and Technology Project Managed by the State Grid Jiangsu Electric Power Co., Ltd. (No. J2024163).
Author Contributions: The authors confirm contribution to the paper as follows: Xiaolong Xiao and Jian Liu contributed to conceptualization and methodology, project administration and funding acquisition; Xiaoxing Lu and Ziran Guo contributed to formal analysis, review and editing and supervision; Shenglong Wu and Ye Cai contributed to software and validation, original draft preparation, visualization. All authors reviewed the results and approved the final version of the manuscript.
Availability of Data and Materials: Data supporting this study is included within the article.
Ethics Approval: Not applicable.
Conflicts of Interest: The authors declare no conflicts of interest to report regarding the present study.
References
1. Ajaz W, Bernell D. Microgrids and the transition toward decentralized energy systems in the United States: a multi-level perspective. Energy Policy. 2021;149(31):112094. doi:10.1016/j.enpol.2020.112094. [Google Scholar] [CrossRef]
2. Jia K, Liu C, Li S, Jiang D. Modeling and optimization of a hybrid renewable energy system integrated with gas turbine and energy storage. Energy Convers Manag. 2023;279:116763. doi:10.1016/j.enconman.2023.116763. [Google Scholar] [CrossRef]
3. Ma Y, Dong X, Yang P, Liu Z, Wang Y, Lu T. Robust optimization model of flexible distribution network considering source-load uncertainty. Electr Power Syst Res. 2023;223(2):109698. doi:10.1016/j.epsr.2023.109698. [Google Scholar] [CrossRef]
4. Cheng X, Zhang Z, Bao Y, Zheng H. Identification of high-risk scenarios for cascading failures in new energy power grids based on deep embedding clustering algorithms. Energy Eng. 2023;120(11):2517. doi:10.32604/ee.2023.042633. [Google Scholar] [CrossRef]
5. Fang F, Yu S, Xin X. Data-driven-based stochastic robust optimization for a virtual power plant with multiple uncertainties. IEEE Trans Power Syst. 2021;37(1):456–66. doi:10.1109/TPWRS.2021.3091879. [Google Scholar] [CrossRef]
6. Varathan G. A review of uncertainty management approaches for active distribution system planning. Renew Sustain Energy Rev. 2024;205(4):114808. doi:10.1016/j.rser.2024.114808. [Google Scholar] [CrossRef]
7. Zhang Y, An X, Wang C. Data-driven two-stage stochastic optimization model for short-term hydro-thermal-wind coordination scheduling based on the dynamic extreme scenario set. Sustain Energy Grids Netw. 2021;27(14):100489. doi:10.1016/j.segan.2021.100489. [Google Scholar] [CrossRef]
8. Scott IJ, Carvalho PMS, Botterud A, Silva CA. Clustering representative days for power systems generation expansion planning: capturing the effects of variable renewables and energy storage. Appl Energy. 2019;253:113603. doi:10.1016/j.apenergy.2019.113603. [Google Scholar] [CrossRef]
9. Xie Z, Li B, He J, Shao M, Zhou B, Wu T, et al. Error analysis and improved method of time-domain distance protection for wind power transmission lines. Int J Electr Power Energy Syst. 2024;160(4):110081. doi:10.1016/j.ijepes.2024.110081. [Google Scholar] [CrossRef]
10. Li B, Roche R. Optimal scheduling of multiple multi-energy supply microgrids considering future prediction impacts based on model predictive control. Energy. 2020;197(1):117180. doi:10.1016/j.energy.2020.117180. [Google Scholar] [CrossRef]
11. Du N, Tang F, Liao Q, Wang C, Gao X, Xie J, et al. Hosting capacity assessment in distribution networks considering wind–photovoltaic–load temporal characteristics. Front Energy Res. 2021;9:767610. doi:10.3389/fenrg.2021.767610. [Google Scholar] [CrossRef]
12. Chang P, Wu L, Pei T. Generalized load modeling approach considering multiple distributed generation integration. Electr Power Syst Res. 2024;237(2):111009. doi:10.1016/j.epsr.2024.111009. [Google Scholar] [CrossRef]
13. Liao W, Bak-Jensen B, Pillai JR, Wang Y, Wang Y. A review of graph neural networks and their applications in power systems. J Mod Power Syst Clean Energy. 2022;10(2):345–60. doi:10.35833/MPCE.2021.000058. [Google Scholar] [CrossRef]
14. Chen Y, Wang X, Zhang B. An unsupervised deep learning approach for scenario forecasts. In: Proceedings of the 2018 Power Systems Computation Conference (PSCC); 2018 Jun 11–15; Dublin, Ireland. doi:10.23919/PSCC.2018.8442500. [Google Scholar] [CrossRef]
15. Nam KJ, Hwangbo S, Yoo CK. A deep learning-based forecasting model for renewable energy scenarios to guide sustainable energy policy: a case study of Korea. Renew Sustain Energy Rev. 2020;122:109725. doi:10.1016/j.rser.2020.109725. [Google Scholar] [CrossRef]
16. Maddineni VK, Koganti NB, Damacharla P. Enhancing microgrid performance prediction with attention-based deep learning models. In: Proceedings of the 2024 11th International Conference on Information Technology, Computer, and Electrical Engineering (ICITACEE); 2024 Aug 29–30; Semarang, Indonesia. doi:10.1109/ICITACEE.62763.2024.10762767. [Google Scholar] [CrossRef]
17. Kreishan MZ, Zobaa AF. Scenario-based uncertainty modeling for power management in islanded microgrid using the mixed-integer distributed ant colony optimization. Energies. 2023;16:4257. doi:10.3390/en.16104257. [Google Scholar] [CrossRef]
18. Gao S, Wang Y, Zhou Y, Yu H. An improved scheduling approach for multi-energy microgrids considering scenario insufficiency and computational complexity. Processes. 2025;13:576. doi:10.3390/pr.13020576. [Google Scholar] [CrossRef]
19. Liu Y, Zhang S, Li L, Wang S, Lu T, Yu H, et al. A machine learning-based fault identification method for microgrids with distributed generations. J Phys Conf Ser. 2022;2360(1):012019. doi:10.1088/1742-6596/2360/1/012019. [Google Scholar] [CrossRef]
20. Qi J, Lei L, Zheng K, Yang SX, Shen X. Optimal scheduling in IoT-driven smart isolated microgrids based on deep reinforcement learning. IEEE Internet Things J. 2023;10(18):16284–99. doi:10.1109/JIOT.2023.3267625. [Google Scholar] [CrossRef]
21. Jasiński M, Martirano L, Najafi A, Homaee O, Leonowicz Z, Kermani M. Microgrid working conditions identification based on cluster analysis—a case study from lambda microgrid. IEEE Access. 2022;10(5):70971–9. doi:10.1109/ACCESS.2022.3186092. [Google Scholar] [CrossRef]
22. Haken H. Synergetics: an introduction. Berlin/Heidelberg, Germany: Springer; 1983. 390 p. [Google Scholar]
23. Deng S, Dong X, Tao L, Wang J, He Y, Yue D. Multi-type load forecasting model based on random forest and density clustering with the influence of noise and load patterns. Energy. 2024;307(12):132635. doi:10.1016/j.energy.2024.132635. [Google Scholar] [CrossRef]
Cite This Article
 Copyright © 2025 The Author(s). Published by Tech Science Press.
This work is licensed under a Creative Commons Attribution 4.0 International License , which permits unrestricted use, distribution, and reproduction in any medium, provided the original work is properly cited.
 Downloads
 Citation Tools