
 Submit a Paper
 Propose a Special lssue
 Open Access
ARTICLE

Comprehensive Index Evaluation of the Cooling System with the Level Loop Thermosyphon System in Different Computing Hub Nodes in China
College of Civil Engineering, Hunan University of Technology, Zhuzhou, 412007, China
* Corresponding Author: Li Ling. Email:
(This article belongs to the Special Issue: Advanced Analytics on Energy Systems)
Energy Engineering 2025, 122(8), 3309-3328. https://doi.org/10.32604/ee.2025.065824
Received 22 March 2025; Accepted 23 May 2025; Issue published 24 July 2025
 View Full Text
 Download PDF
Abstract
Rack-level loop thermosyphons have been widely adopted as a solution to data centers’ growing energy demands. While numerous studies have highlighted the heat transfer performance and energy-saving benefits of this system, its economic feasibility, water usage effectiveness (WUE), and carbon usage effectiveness (CUE) remain underexplored. This study introduces a comprehensive evaluation index designed to assess the applicability of the rack-level loop thermosyphon system across various computing hub nodes. The air wet bulb temperature Ta,w was identified as the most significant factor influencing the variability in the combination of PUE, CUE, and WUE values. The results indicate that the rack-level loop thermosyphon system achieves the highest score in Lanzhou (94.485) and the lowest in Beijing (89.261) based on the comprehensive evaluation index. The overall ranking of cities according to the comprehensive evaluation score is as follows: Gansu hub (Lanzhou) > Inner Mongolia hub (Hohhot) > Ningxia hub (Yinchuan) > Yangtze River Delta hub (Shanghai) > Chengdu Chongqing hub (Chongqing) > Guangdong-Hong Kong-Macao Greater Bay Area hub (Guangzhou) > Guizhou hub (Guiyang) > Beijing-Tianjin-Hebei hub (Beijing). Furthermore, Hohhot, Lanzhou, and Yinchuan consistently rank among the top three cities for comprehensive scores across all load rates, while Guiyang (at a 25% load rate), Guangzhou (at a 50% load rate), and Beijing (at 75% and 100% load rates) exhibited the lowest comprehensive scores.Keywords
Driven by national strategic initiatives such as New Infrastructure, Big Data, and Artificial Intelligence, China’s data center industry has experienced rapid expansion. It is projected that the market size of this sector will reach 595.2 billion yuan by 2025. However, this expansion is accompanied by significant energy demands. According to the China Academy of Information and Communications Technology, data centers in China consumed approximately 216.6 billion kWh of electricity in 2021, accounting for 2.6% of the country’s total electricity consumption. This figure is expected to rise to 380 billion kWh by 2030, representing 4.1% of national electricity usage. Cooling systems account for between 30% and 50% of the overall energy consumption in data centers [1]. In response to these challenges, the rack-level loop thermosyphon system has emerged as a promising energy-efficient cooling solution. Characterized by its simple structure, high thermal conductivity, low power consumption, and enhanced safety, this technology has attracted considerable attention for its effectiveness in providing energy-efficient cooling solutions in data center environments [2].
1.2 Research on the Rack-Level Loop Thermosyphon System
Current research on rack-level loop thermosyphon systems primarily focuses on their heat transfer mechanisms and practical applications. Zou et al. [3] determined the optimal refrigerant filling ratio for water-cooled loop thermosyphon systems under fan failure conditions, identifying an optimal range between 55.8% and 74.4%. Zhan et al. [4] conducted both experimental and simulation studies on the thermal performance of rack-level loop thermosyphon systems, revealing notable variations in evaporator performance of rack-level loop thermosyphon systems, revealing notable variations in evaporator performance. Specifically, a maximum difference of 0.15 was observed in refrigerant vapor quality between vertical tube outlets, while a maximum difference of 9.5°C was observed at the evaporator outlet. Zhang et al. [5] established a distributed parameter heat transfer model of a loop thermosyphon system to evaluate the effects of liquid filling ratio, air volume across the evaporation section, temperature difference, and connecting pipe length on the thermal performance. These findings collectively demonstrate the excellent thermal performance of loop thermosyphon systems, which has accelerated their adoption in data center cooling applications. In terms of the application of rack level loop thermosyphon system, Zheng et al. [6] retrofitted data centers with a water-cooled heat pipe backboard system, achieving an 18% reduction in total energy consumption compared to conventional computer room air handlers (CRAHs) during summer. Ding et al. [7] experimentally evaluated the Power Usage Effectiveness (PUE) of data centers employing backplane heat pipe cooling systems, reporting PUE values of 1.5 in summer, 1.38 during the transitional season, and 1.28 in winter. In addition, Wemhoff and Ortega [8] developed a performance and economic model for rack-level loop thermosyphon systems, concluding that although initial investment is higher, economic benefits are realized after 5.45 years. Similarly, Zou et al. [9] analyzed the investment payback period of using rack level loop thermosyphon system in data centers, with a dynamic payback period of 4.19–4.69 years.
1.3 Research on Evaluation Indicators for Cooling Systems in Data Centers
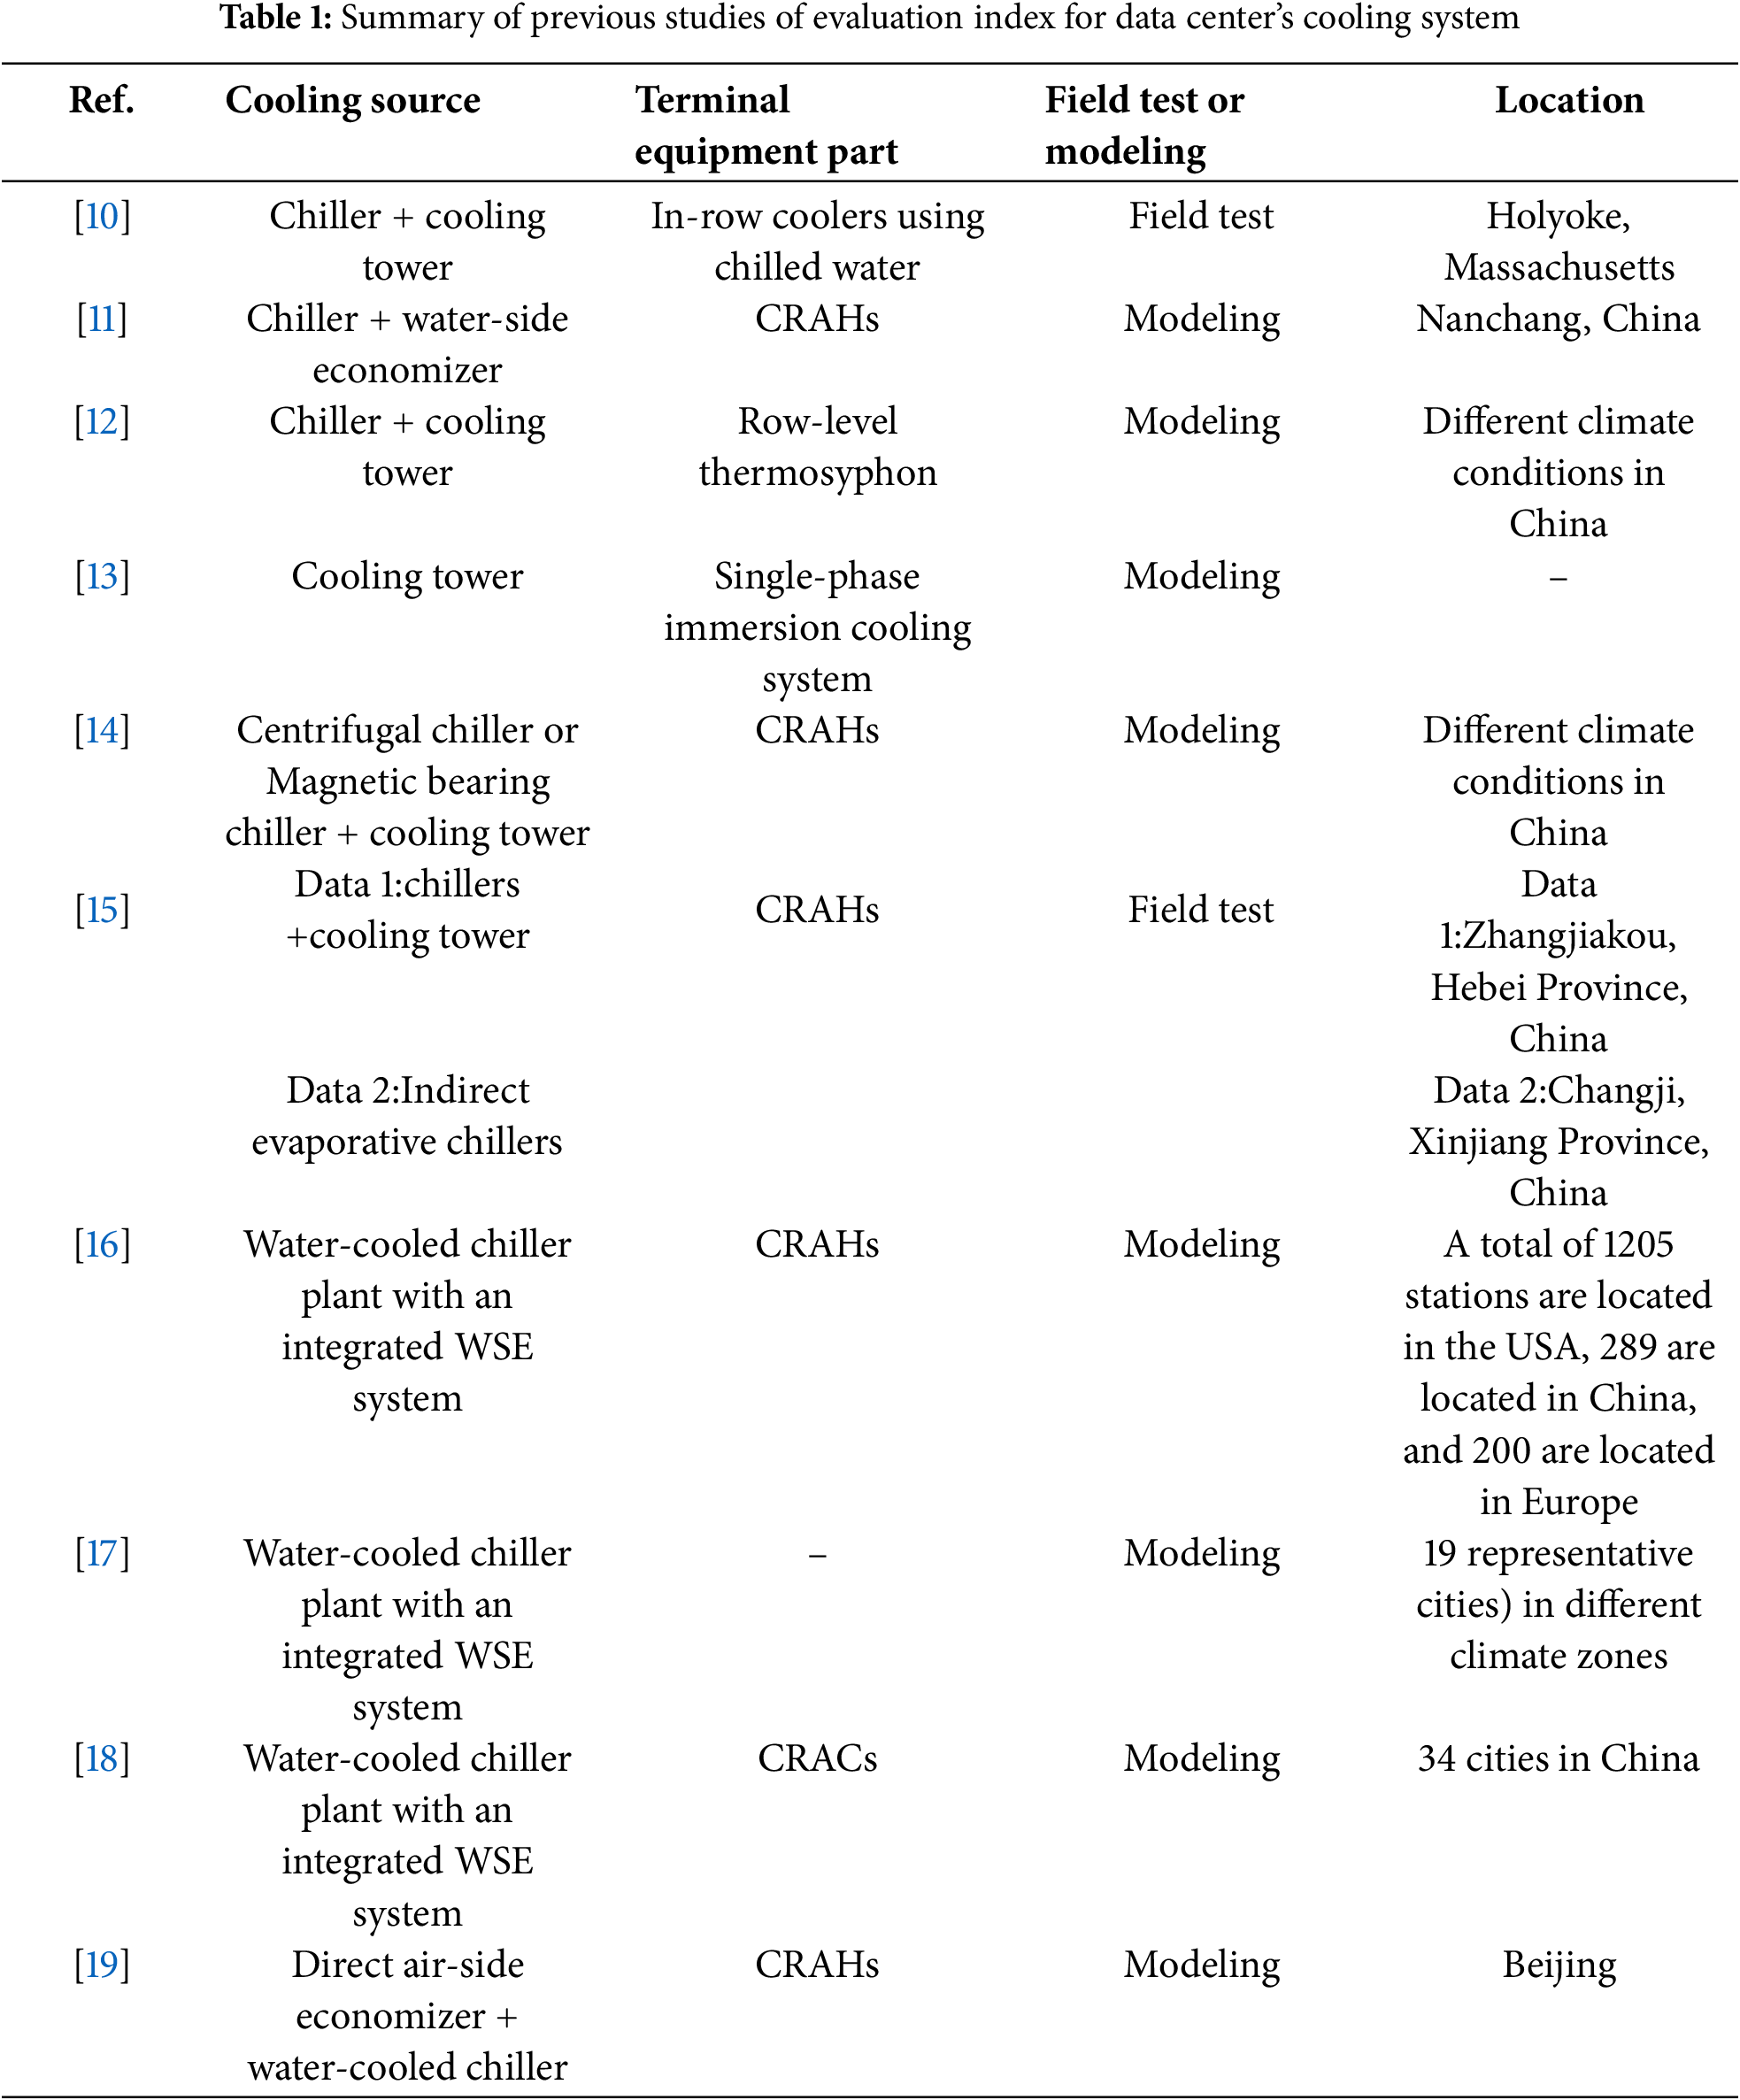
Numerous previous studies on the adaptability of the rack-level loop thermosyphon system have predominantly focused on performance metrics such as PUE, energy-saving rate, or economic performance. In contrast, relatively few studies have used Water Usage Effectiveness (WUE) and Carbon Usage Effectiveness (CUE) values as indicators to assess the applicability of cooling systems in data centers. A summary of these different evaluation metrics is presented in Table 1. All of these studies provide valuable insights into the evaluation of cooling systems based on specific indicators, but none provides a comprehensive framework for evaluating the overall applicability of cooling systems in data centers.
1.4 Gaps in Research and Main Innovations
Existing research primarily focuses on energy consumption, PUE values, or economic indicators to evaluate cooling systems for data centers, while neglecting WUE and CUE values as metrics for evaluating the applicability of these systems. Furthermore, these studies have predominantly assessed the applicability of cooling systems under ideal IT load conditions, typically at 100% load. Nevertheless, it has been reported that most data centers operate at a load rate between 20% and 50% during the initial years (1~4 years), eventually stabilizing at approximately 60% of design capacity for the remainder of their lifespan (8~15 years) [20].
This variation in load rates can result in differing adaptability outcomes for cooling systems, particularly in data centers situated in diverse geographic regions. This study employs a case study of a data center to demonstrate the energy-saving effects of retrofitting an existing conventional computer room air conditioning (CRACs) system with the rack-level loop thermosyphon system. Additionally, a comprehensive evaluation index is proposed to assess the applicability of cooling systems using the rack-level loop thermosyphon system across various computing hub nodes.
2 Description of the Data Center and Retrofit Scheme
The data center occupies an area of 1945 m2 and houses 580 cabinets (each with a power density of 6 kW/rack), along with supporting infrastructure such as uninterruptible power supplies (UPSs) and power distribution units (PDUs). The data center’s total cooling demand under full load is estimated to be around 4000 kW. In the original design, this cooling requirement was met by 36 conventional CRACs, collectively providing a cooling capacity of 4000 kW. However, due to the superior thermal performance, energy efficiency, structural simplicity, and enhanced safety offered by rack-level loop thermosyphon systems, the cooling infrastructure was retrofitted, replacing the conventional CRACs with this advanced solution, as shown in Fig. 1.
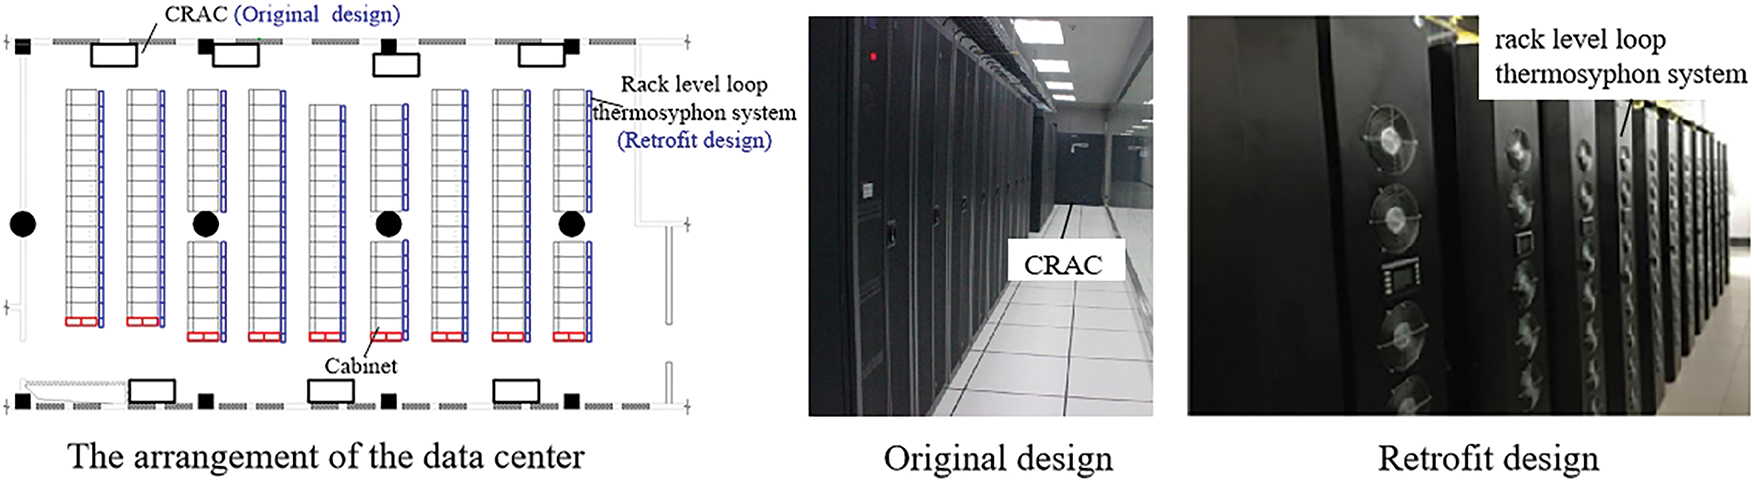
Figure 1: The arrangement of the data center in the original and retrofit design
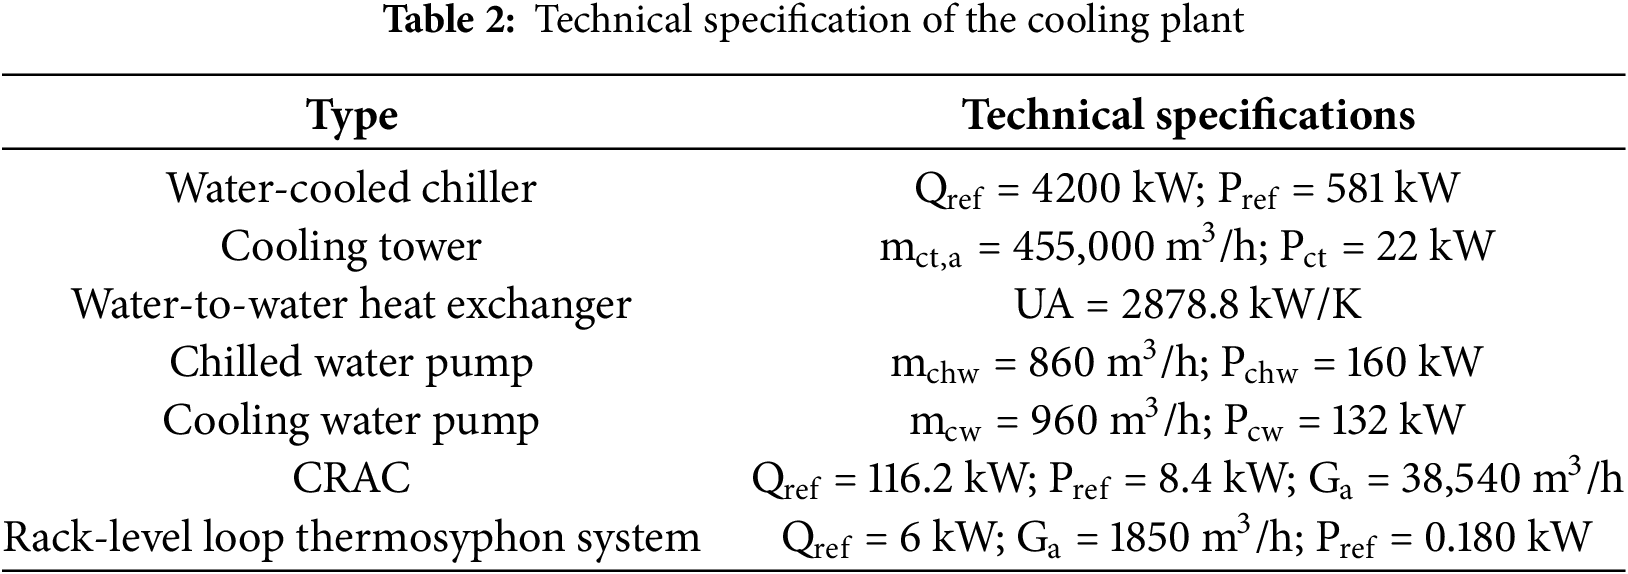
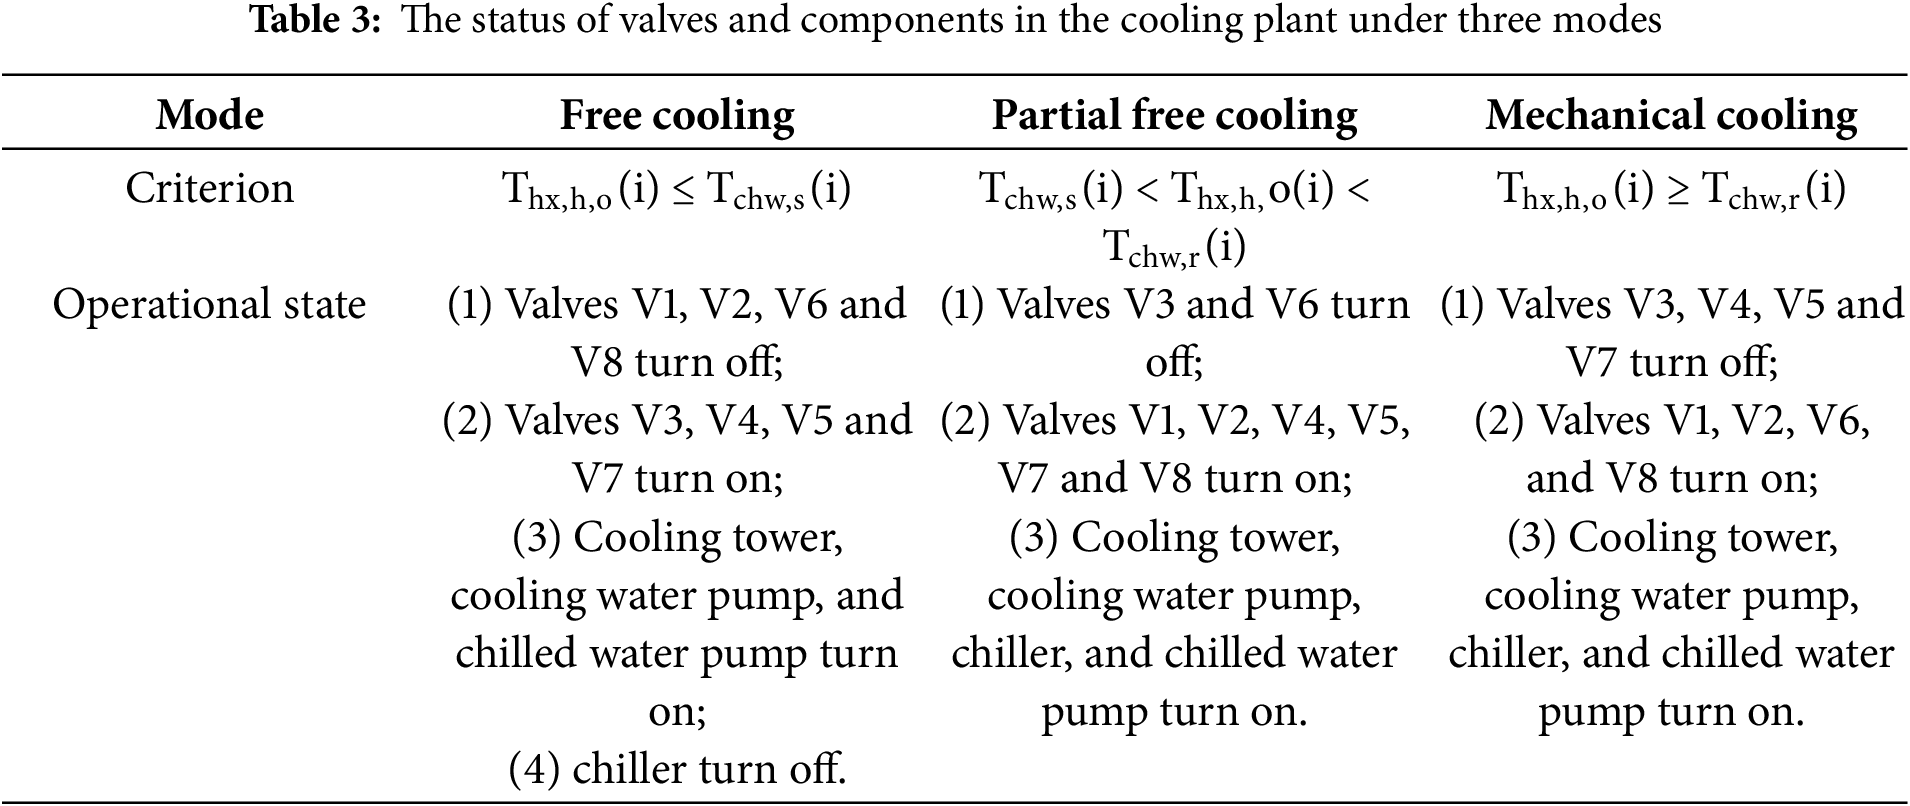
Fig. 2 illustrates the schematic diagram of the cooling system based on the rack-level loop thermosyphon system, which comprises a chiller, cooling tower, heat exchanger, cooling water pump, chiller, chilled water pump, and rack-level loop thermosyphon units. The specifications of the associated equipment are detailed in Table 2. This cooling system operates in three modes to optimize energy efficiency:
(1) Free cooling mode (mode 1): the outdoor low-temperature air serves as the primary cooling source, transferring heat via the cooling tower and heat exchanger without chiller operation;
(2) Partial free cooling mode (Mode 2): both the chiller and the outdoor air source jointly cool the return chilled water from the rack-level thermosyphon system.
(3) Mechanical cooling mode (Mode 3): the chiller alone provides cooling for the circulating water supplied to the thermosyphon system.
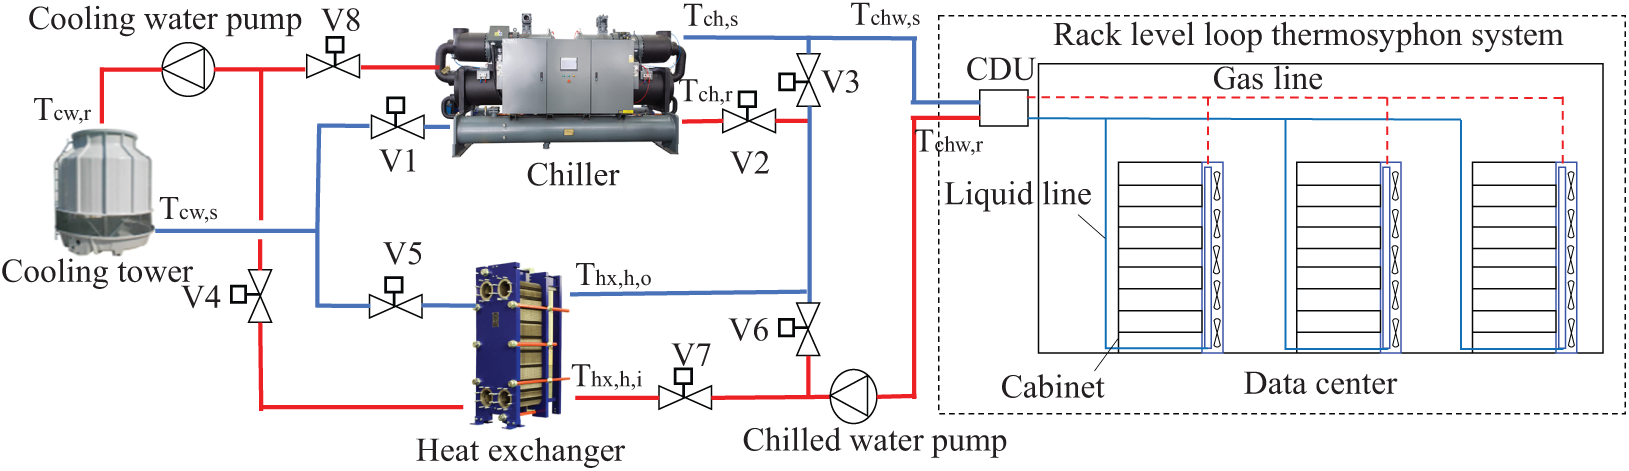
Figure 2: Schematic diagram of the cooling system based on the rack-level loop thermosyphon system
The operational states of valves and components for each mode are summarized in Table 3. To maximize energy efficiency, the system dynamically switches between modes based on real-time heat exchanger outlet temperature and chilled water supply temperature setpoints. This control strategy ensures optimal utilization of free cooling resources, significantly enhancing energy efficiency [21]. Moreover, the controller regulates the fan speed of the rack-level thermosyphon system in real time to ensure that the indoor return air temperature stays within the recommended range defined by ASHRAE guidelines. It also regulates the mass flow rates of both the chilled water pump and cooling water pump to sustain the set-point temperatures for chilled water supply and cooling water temperature differential. Simultaneously, the controller adjusts the cooling tower fan speed to maintain the supply cooling water temperature at the specified set point.
3.1 Calculation of Cooling Load for a Data Center
Taking into account the physical features of the data center and the dynamic cooling behavior of IT equipment [21], as illustrated in Fig. 3, a certain amount of heat loss is inevitable during the transmission and storage of electricity from the power grid to the UPS systems. Electricity is then delivered to the servers via PDUs, during which additional heat losses are generated. During the operation of the server, a large amount of heat is also generated. The cooling load of the data center is also generated by factors such as the building envelope, lighting, personnel, and infiltration. The total cooling load is composed of several contributing factors, ranked in descending order of magnitude as follows: IT equipment, which represents the dominant source > the building envelope > lighting systems> occupants and air infiltration (which typically account for less than 2% of the total load). Given their minimal contribution, heat gains from personnel and air infiltration can be reasonably excluded from cooling load calculations in practical engineering applications.
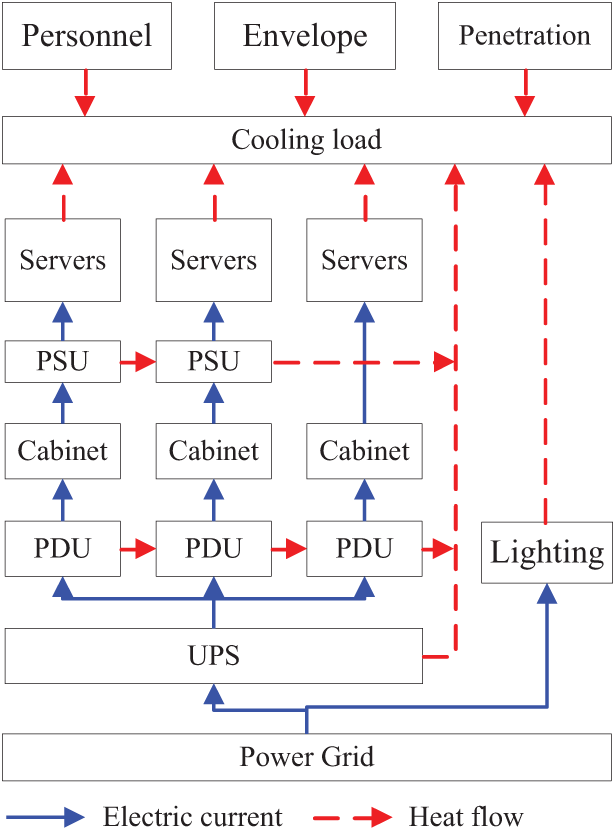
Figure 3: Schematic diagram of cooling load composition in the data center
The cooling load of the data center can be calculated using the formula as follows:
where Q is the cooling load, i is the hour, K is the thermal conductivity, A is the area, to is the outdoor air temperature, tin is the indoor air temperature, and qlinghing is heat flux from lighting.
In a typical data center, IT equipment primarily includes servers, PDUs, and UPSs, etc. Servers are the main source of heat among these components, with the amount of heat they emit largely influenced by their usage levels and the supply air temperature set point [22]. Accordingly, the heat loss from servers can be calculated by,
where P is the power or heat loss, userver is the servers’ utilization, αi is the heat generation increase factor, and Ts is the supply air temperature.
The heat generated by PDUs and UPSs can also be calculated using the information provided in Reference [21].
3.2 Modeling of the Cooling System
In this study, a schematic diagram of the Trnsys simulation platform [23] based on the rack-level loop thermosyphon system is presented in Fig. 4. The simulation model primarily comprises the following components: a chiller (Type 666), a cooling tower (Type 162a), a circulating pump (Type 110), a plate heat exchanger (Type 15a), a CRAC unit integrating a heat exchanger (Type 5e) and a fan (Type 662), and a rack-level loop thermosyphon system. For weather data, the typical meteorological year dataset provided by TRNSYS was utilized. Model validation was conducted through comparative error analysis between simulation outputs and manufacturer-certified experimental data for three critical subsystems: cooling tower performance, chiller operation, and CRACs. As shown in Fig. 5, the average and maximum errors for the cooling tower were 2.42% and 5.13%, respectively; for the chiller, 3.5% and 8.36%; and for the CRAC unit, 1.96% and 3.81%. All critical system components exhibited relative errors within the 10% acceptability threshold (Fig. 5), confirming sufficient simulation fidelity for predictive analysis.
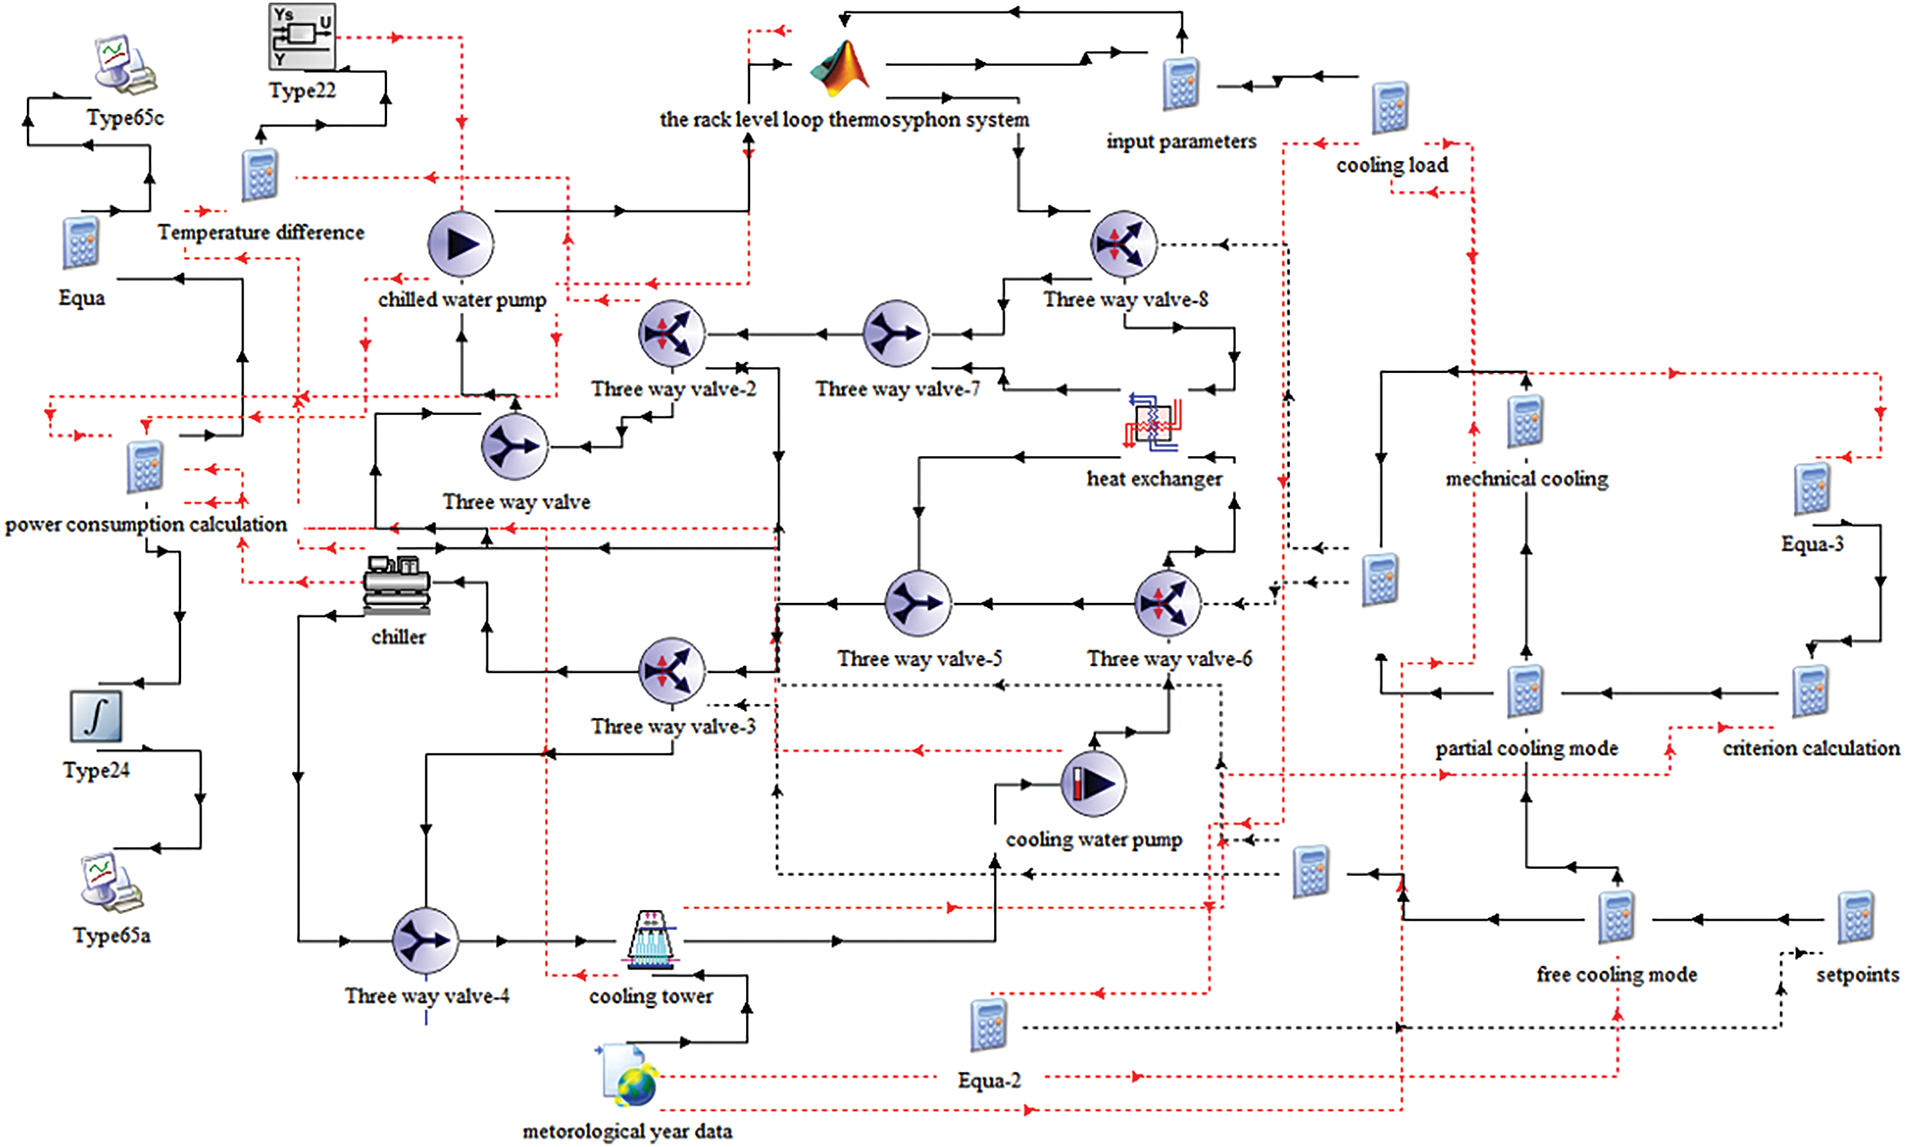
Figure 4: Schematic diagram of the Trnsys simulation platform based on the rack-level loop thermosyphon system
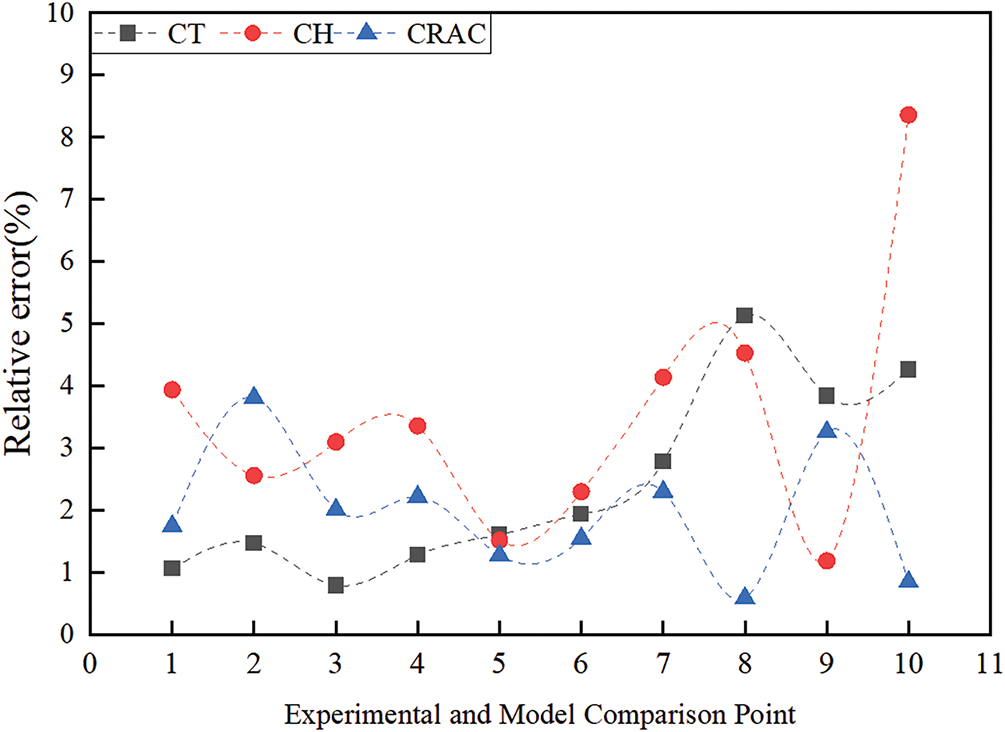
Figure 5: Relative error between simulated data and experimental data at different measurement points
The rack level loop thermosyphon system was mathematically modeled using Matlab (Type 155). The effectiveness-number of transfer units (ε-NTU) approach was utilized to evaluate the heat transfer performance of the rack-level loop thermosyphon system. Under optimal operating conditions, the refrigerant temperatures at the evaporator and cooling distribution unit (CDU) sections exhibit negligible differences between inlet and outlet positions [3]. Since the refrigerant in both the evaporator and CDU sections undergoes phase change heat transfer, the value of (mc)max approaches infinity. Consequently, the cooling capacity can be calculated as:
where me,a is the air mass flow rate of evaporator section, mc,w is the water mass flow rate of CDU section, te,ai is the inlet air temperature of evaporator section, tc,wi is the inlet water temperature of CDU section, εe and εCDU are the effectiveness of evaporator and CDU, respectively.
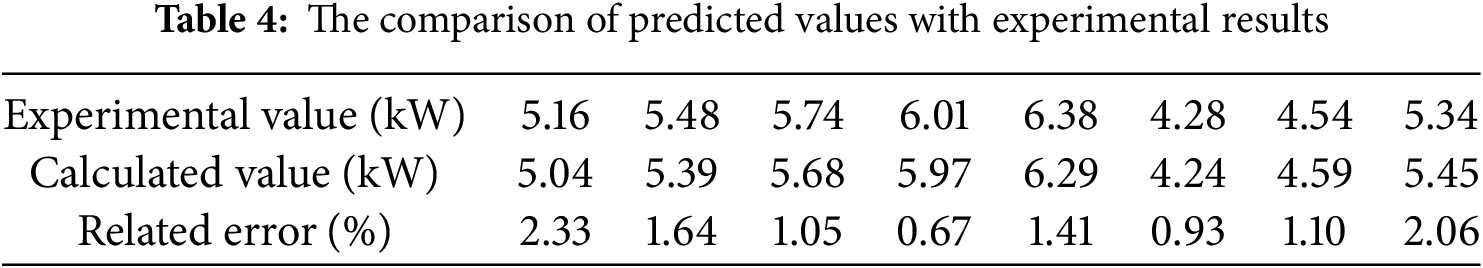
This model was validated using experimental data from reference [3], with a comparison of the predicted and experimental values shown in Table 4. The predicted values closely match the experimental results, with deviations falling within a ±5% margin, which is considered acceptable for engineering applications. The discrepancies observed can primarily be attributed to two factors: (1) the MSHPS was presumed to operate continuously under optimal conditions; (2) thermal property variations of the working fluid were neglected in the thermodynamic analysis.
To comprehensively assess the performance of cooling systems across multiple dimensions, such as energy efficiency, economic viability, and environmental sustainability,it is essential to consider a set of integrated evaluation metrics. These include: (1) energy consumption reduction: directly reflects the energy-saving effectiveness of the cooling system; (2) PUE: measures the overall energy efficiency of the data center by comparing the total energy usage to the energy used by the IT equipment alone; (3) dynamic investment payback period: evaluates the economic feasibility by determining the time required to recoup the initial investment through energy savings; (4) WUE: assesses the efficiency of water usage in the cooling process, calculated as the total water consumption divided by the energy consumed by IT equipment; (5) CUE: evaluates the environmental impact by measuring the amount of carbon dioxide emissions per unit of energy consumed by the IT equipment. Incorporating these metrics provides a holistic framework for evaluating and optimizing cooling systems, ensuring they meet the goals of energy conservation, water conservation, and cost savings.
(1) Energy consumption reduction
The total energy consumption of the cooling system comprises several key components: the chiller, cooling tower, water pump, and terminal air conditioning (which is referred to as the CRACs or the rack level loop thermosyphon system). The energy consumption reduction serves as a comparative metric to evaluate operational efficiency improvements by quantifying the difference in energy usage between pre-retrofit and post-retrofit configurations across diverse climatic regions. This relationship is formally expressed as:
where
(2) PUE
The PUE value is a metric employed in data center management to assess the energy efficiency of a data center’s infrastructure. A PUE value closer to 1 indicates that a larger proportion of the energy consumed by the data center is utilized directly by the IT equipment, rather than being expended on supporting infrastructure such as cooling systems, lighting, and power distribution. The PUE calculation is defined as:
where Ptotal is the total of energy consumption, Pcooling, Pservers, Plighting, PPDU, PUPS, and Pothers, are the power consumption of cooling system, servers, lighting, PDU, UPS and others, respectively.
(3) Dynamic investment payback period
This study employs the dynamic investment payback period metric to evaluate the economic viability of retrofitting an existing CRAC system with a rack-level loop thermosyphon system. The dynamic investment payback period quantifies the time required to recover initial capital expenditures through operational savings, incorporating the time value of money and projected cash flows over the system lifecycle. In the context of retrofitting existing CRAC systems with the rack-level loop thermosyphon system, the initial investment includes the costs for the system’s equipment and associated piping. Annual cash inflows are derived from the savings in water and electricity expenses following the retrofit, with these expenses calculated based on local utility rates. The cash flow in the first year represents the initial investment, while subsequent years assume a zero-cost outcome for simplicity. The dynamic investment payback period can be calculated by,
where CI is the Cash income, CO is the Cash outcome, i0 is the Interest rates.
(4) WUE
The WUE value is a critical metric employed to assess the efficiency of water consumption in data center cooling systems. A lower WUE value signifies higher efficiency, indicating that less water is utilized per unit of IT energy consumption. The WUE value can be defined as:
where We is the water resource consumption of the cooling system,
(5) CUE
The CUE value is a metric employed to assess the carbon emissions associated with the energy consumption of a data center’s operations, particularly its IT equipment and supporting infrastructure. Lower CUE values indicate superior decarbonization efficiency, with values approaching 0 reflecting minimal CO2-equivalent emissions per unit of IT energy demand. The CUE value can be expressed as:
where Ce is the carbon Dioxide Emissions of the cooling system,
3.3.2 Comprehensive Evaluation Index
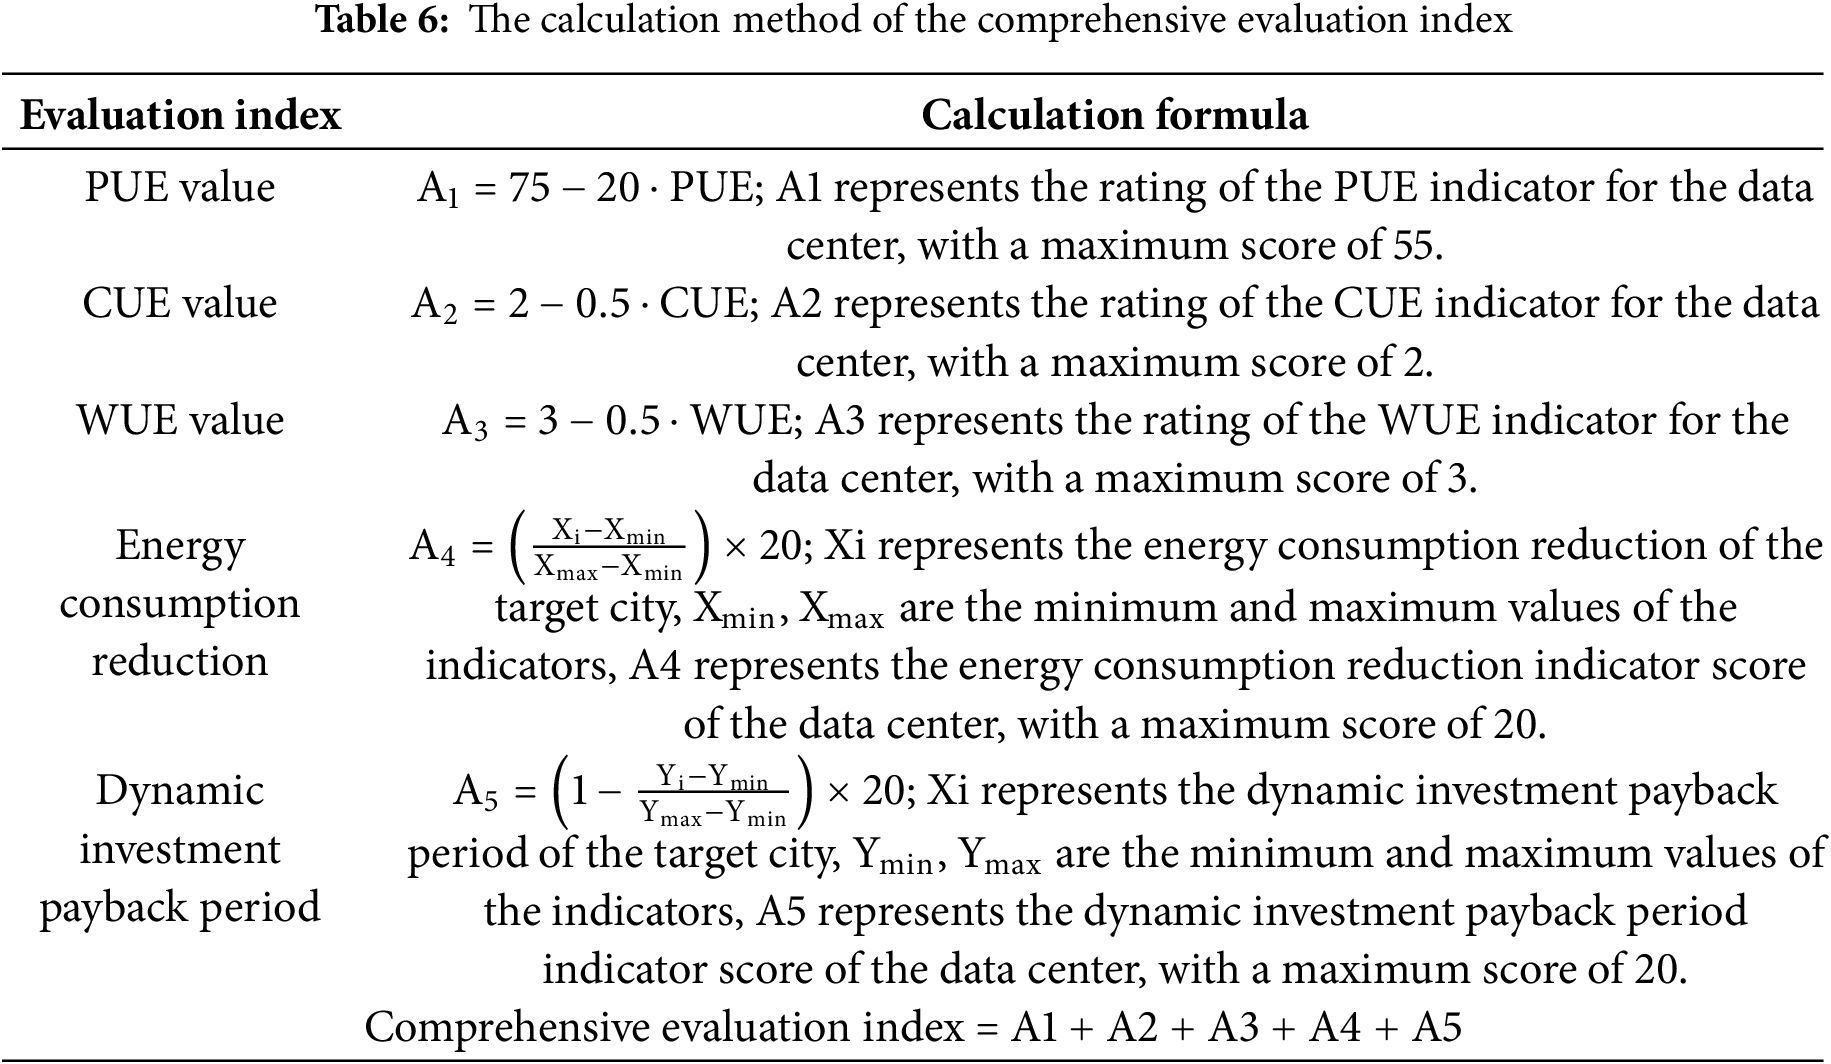
A comprehensive evaluation index has been proposed to assess the applicability of the rack-level loop thermosyphon system in data centers across various computing hub nodes. This composite indicator aggregates the scores of five key performance metrics: energy consumption reduction, dynamic investment payback period, PUE value, WUE value, and CUE value. The scoring methodology is detailed in Table 6. Specifically, the scoring indicators for system energy consumption reduction (A4) and dynamic investment payback period (A5) are each assigned a maximum score of 20 points. For the PUE, WUE, and CUE indicators, evaluation criteria are derived from established standards for green data centers [24] for data centers that use the rack level loop thermosyphon system.
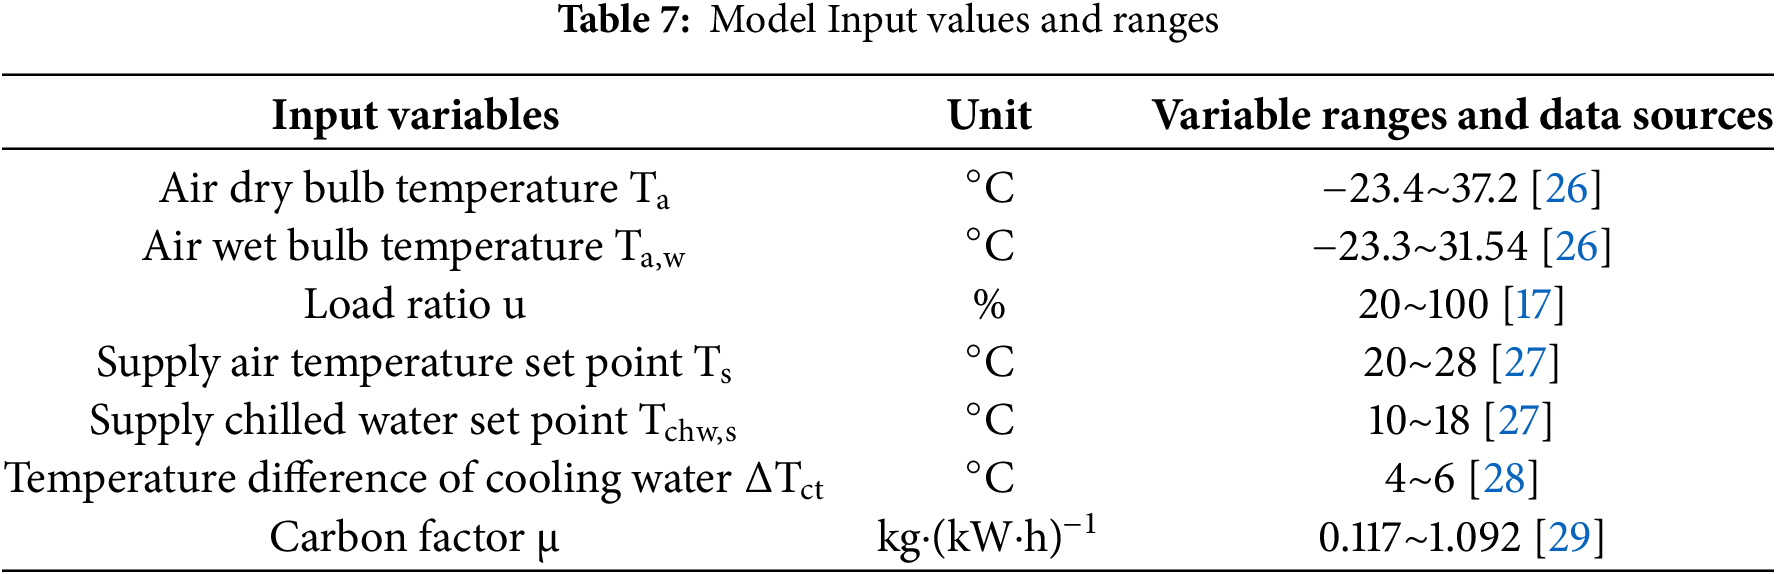
A global sensitivity analysis was conducted to quantify the influence of input parameter variations on the joint performance metrics (PUE, CUE, WUE) of cooling systems, identifying critical uncertainty drivers through Sobol’s method [25]. The primary parameters investigated include: air dry bulb temperature, air wet bulb temperature, load ratio, supply air temperature set point, supply chilled water set point, temperature difference of cooling water and carbon factor. The value ranges for these parameters are provided in Table 7.
4.1 Sensitivity Results Analysis
Fig. 6 illustrates the sensitivity analysis results, highlighting the parameters with Sobol’s total-order sensitivity indices exceeding 0.01. Among these factors, the air wet-bulb temperature (Ta,w) was identified as the most significant contributor to the variance in the predicted combined values of PUE, CUE, and WUE. This is primarily because Ta,w serves as a key indicator for determining the operating conditions of the cooling system. It directly influences the extent to which the system can utilize natural cooling sources, either fully or partially, thereby affecting the energy consumption of the various components within the cooling system. As a result, Ta,w has a substantial impact on the final values of PUE, CUE, and WUE. This finding highlights that the effectiveness of the rack-level loop thermosyphon system is highly dependent on regional climatic conditions, with lower wet-bulb temperature regions being more suitable for its application. The load ratio (u) also emerged as a critical factor, suggesting that the system’s performance varies under different load conditions in data centers. Furthermore, the carbon factor (
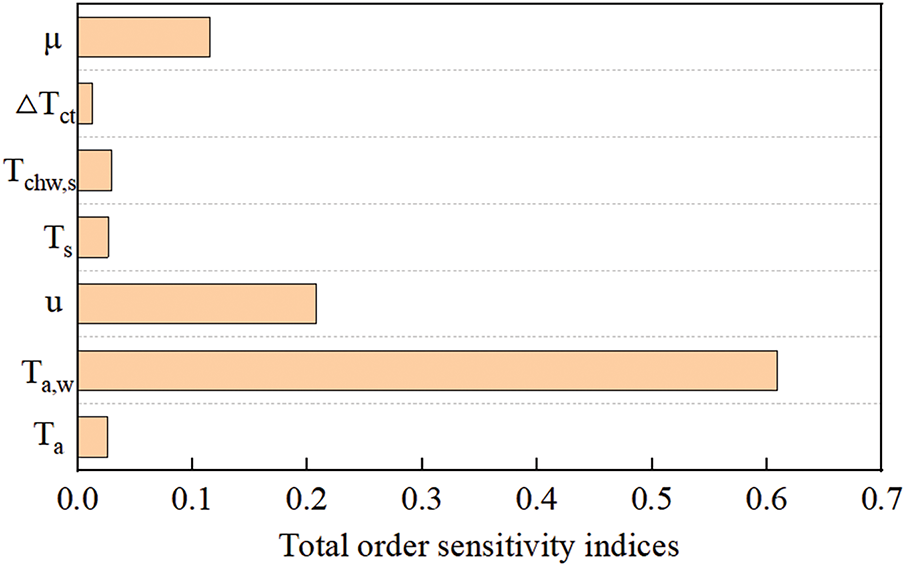
Figure 6: Sobol’s total order sensitivity indices for predicting the PUE, CUE, and WUE values
4.2 Energy Consumption Analysis Compared to Traditional CRACs (Original Design)
Fig. 7 compares the annual energy consumption of the rack-level loop thermosyphon system (retrofit design) with that of traditional CRAC units (original design). The retrofit design achieves a reduction in cooling system energy consumption ranging from 18.07% to 31.06%, corresponding to annual energy savings between 868,500 and 999,000 kW
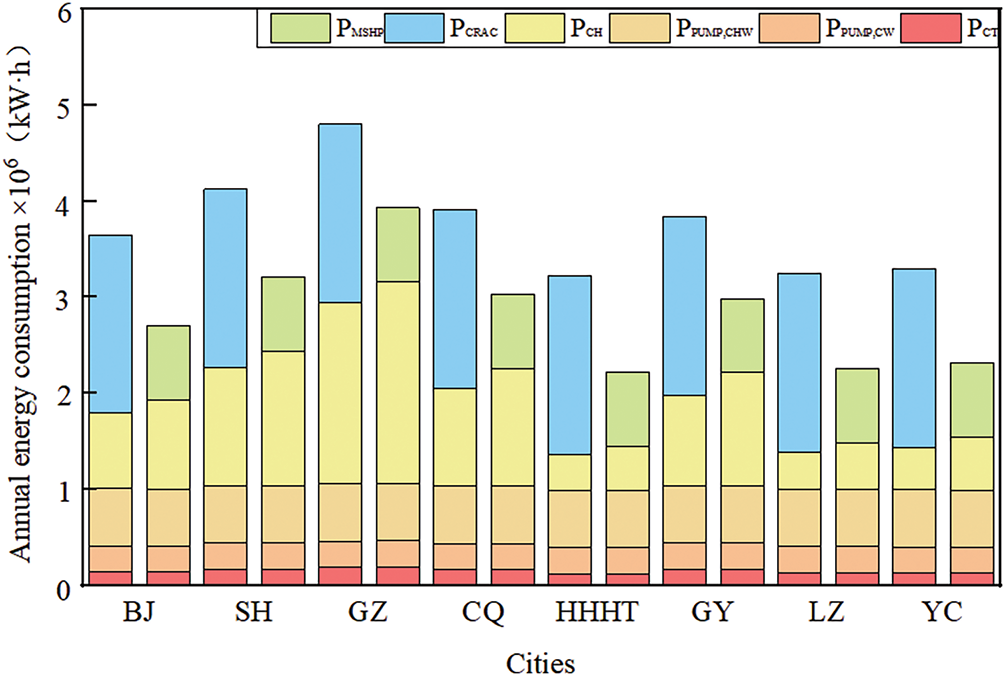
Figure 7: Annual energy consumption of the data center cooling system using traditional CRACs (original design) or the rack-level loop thermosyphon system (retrofit design)
Fig. 8 presents the monthly energy consumption of data center cooling systems utilizing the rack-level loop thermosyphon system across representative cities in various computing hub nodes. The Inner Mongolia hub (Hohhot), Gansu hub (Lanzhou), and Ningxia hub (Yinchuan) demonstrate the lowest and most consistent energy consumption levels, with a maximum variation of only 4.3%. Notably, the disparity in energy consumption is primarily observed in the summer months, particularly July and August. For example, in July, the energy consumption in the Ningxia hub (Yinchuan) is 17.6% higher than in the Gansu hub (Lanzhou), attributable to a 13.4% longer duration of mechanical cooling mode operation. Excluding the Guangdong Hong Kong Macao Greater Bay Area hub (Guangzhou), the monthly energy consumption patterns of the remaining hub nodes are generally aligned, characterized by lower consumption in winter and higher consumption in summer. In contrast, the Guangzhou city exhibits significantly higher monthly energy consumption throughout the year. This is primarily due to Guangzhou’s elevated average wet-bulb temperature, which limits the cooling system’s ability to fully utilize natural cooling sources to only 3.48% of the year, with partial utilization occurring for 48.9%. From the perspective of energy efficiency, the energy-saving potential of the rack-level loop thermosyphon system across the various computing hubs can be ranked as follows: Inner Mongolia hub (Hohhot) > Gansu hub (Lanzhou) > Ningxia hub (Yinchuan) > Beijing-Tianjin-Hebei hub (Beijing) > Guizhou hub (Guiyang) > Chengdu-Chongqing hub (Chongqing) > Yangtze River Delta hub (Shanghai) > Guangdong Hong Kong Macao Greater Bay Area hub (Guangzhou).
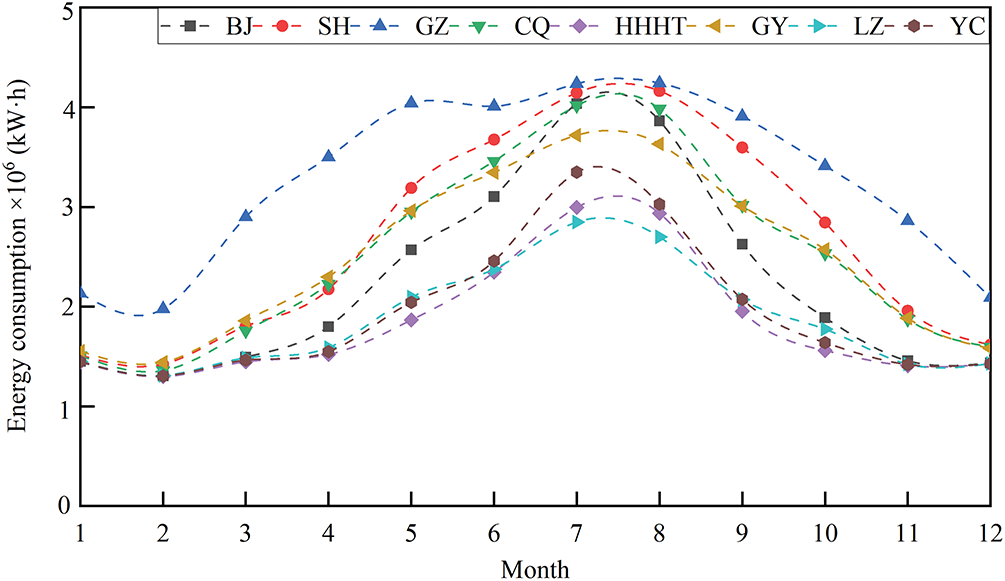
Figure 8: Monthly energy consumption of data center cooling system using the rack level loop thermosyphon system (Retrofit design) in Computing hub node
4.3 Comprehensive Indicator Analysis
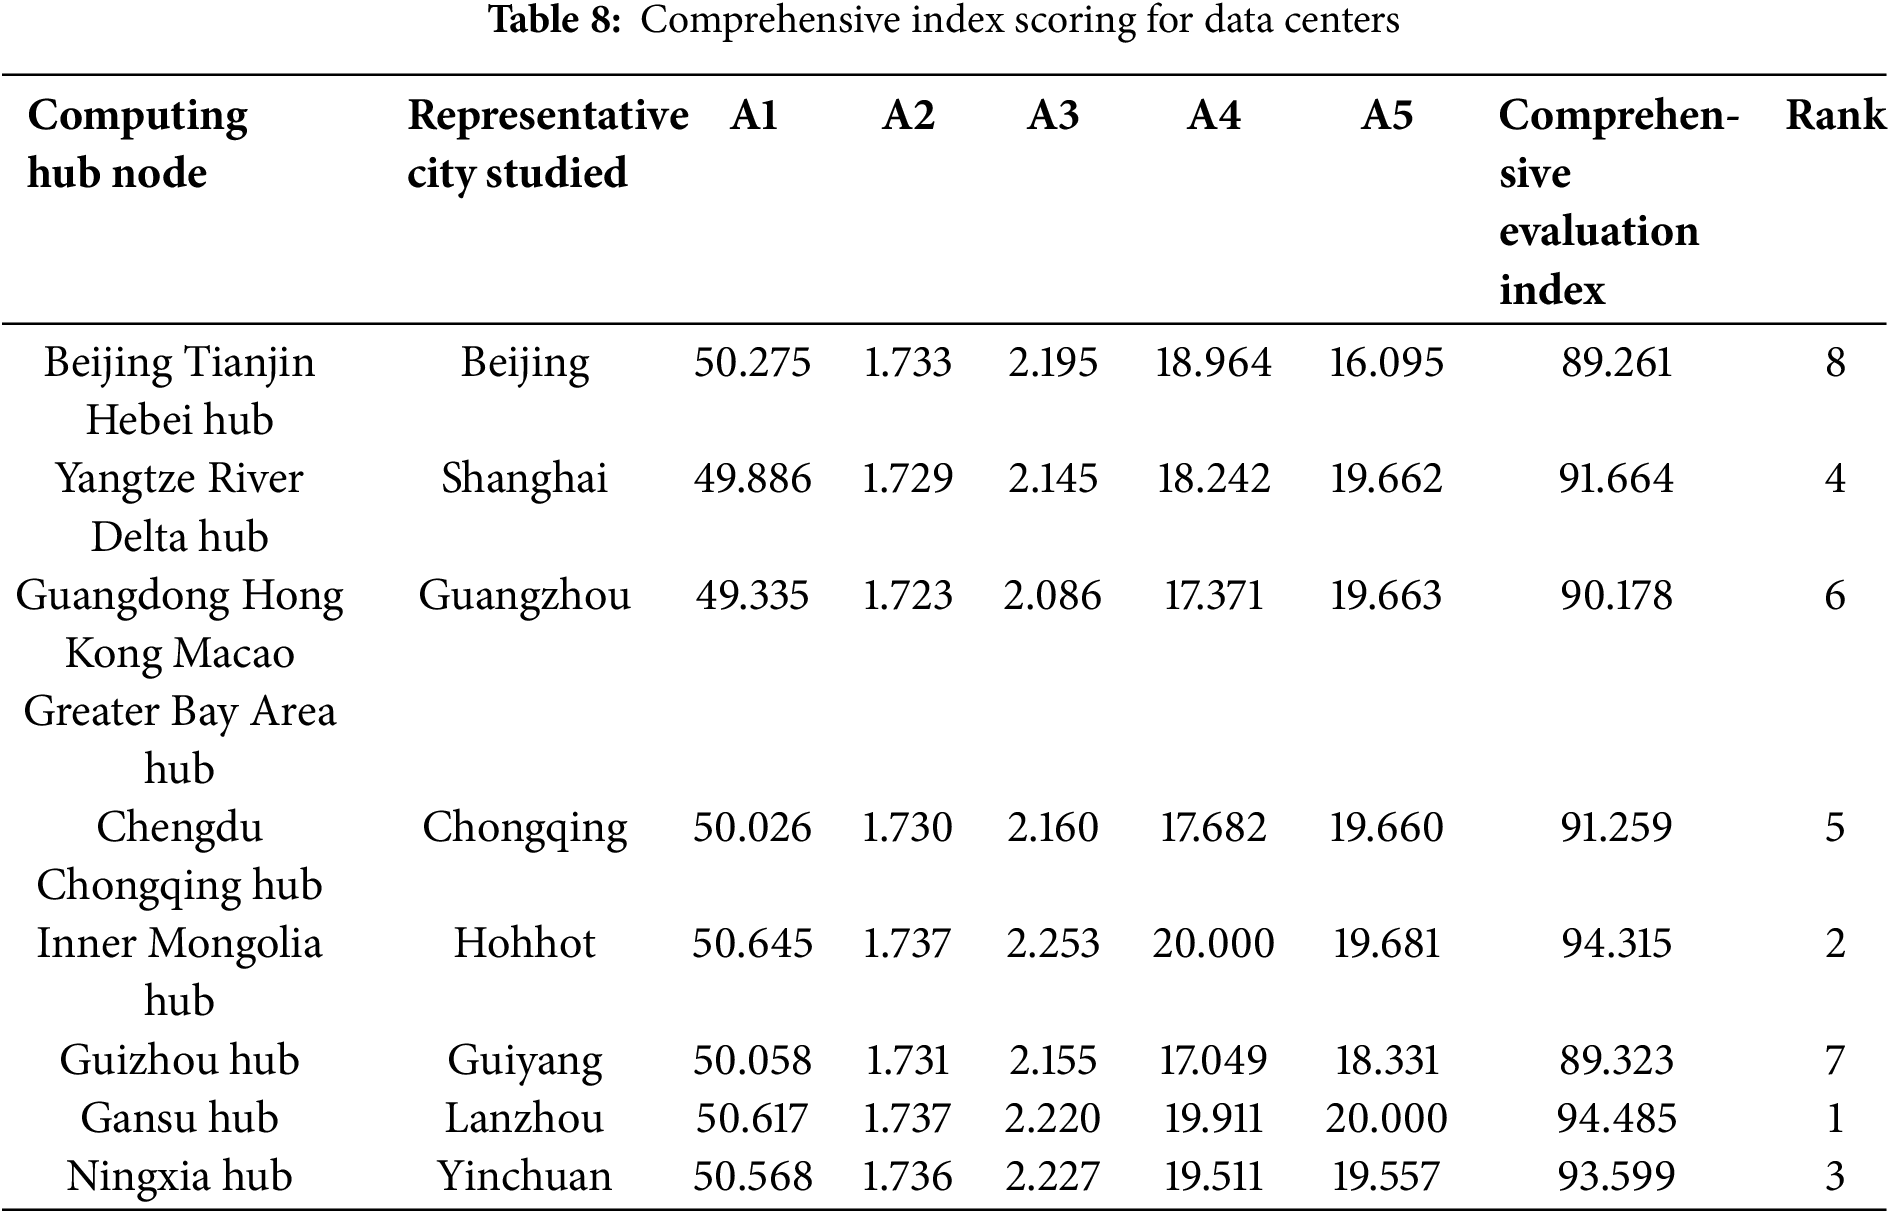
From an energy consumption perspective, retrofitting the existing cooling system with the rack-level loop thermosyphon system in data centers can significantly reduce energy usage. However, the retrofit plan must also account for its broader implications, including economic factors, water resource utilization, and carbon emissions. Table 8 provides a comprehensive evaluation of the rack-level loop thermosyphon system’s application across representative cities in different computing hub nodes. Based on this evaluation, the ranking of data centers in various hubs is as follows: Gansu hub (Lanzhou) > Inner Mongolia hub (Hohhot) > Ningxia hub (Yinchuan) > Yangtze River Delta hub (Shanghai) > Chengdu-Chongqing hub (Chongqing) > Guangdong-Hong Kong-Macao Greater Bay Area hub (Guangzhou) > Guizhou hub (Guiyang) > Beijing Tianjin Hebei hub (Beijing). In the case of Guangzhou, while the scores for evaluation indicators A1, A2, and A3 are among the lowest, its performance on indicator A4 has improved. Additionally, Guangzhou’s dynamic investment payback period of 4.42 years results in a relatively higher score for indicator A5. Consequently, Guangzhou’s overall comprehensive evaluation score is not the lowest. On the other hand, Beijing’s dynamic payback period of 5.2 years for the retrofit is largely due to relatively high water and electricity costs compared to other cities, combined with its less significant reduction in energy consumption. Therefore, from a comprehensive perspective, the benefits of retrofitting traditional CRACs with the rack-level loop thermosyphon system are more pronounced in some cities than in others. Nonetheless, retrofitting is still recommended. In cities such as Hohhot, Lanzhou, and Yinchuan, where factors like PUE, CUE, WUE, energy consumption reduction, and dynamic investment payback period are favorable, the comprehensive score for the retrofit is relatively high. This is primarily due to the sufficient time available for utilizing natural cooling sources in these cities, as well as the relatively low costs of water and electricity.
4.4 Comprehensive Indicator Scores under Different Load Rates
As data center server deployment is driven by user demand, most data centers operate at partial load during the initial stages of construction. A research report reveals that the average utilization rate of data centers is merely 50.61%, with large data centers operating at an even lower average rate of 29.01% [30]. Additionally, as highlighted in the sensitivity analysis in Section 4.1, the load rate factor is a key variable influencing the combined values of PUE, CUE, and WUE. Therefore, it is crucial to assess the applicability of the rack-level loop thermosyphon system under varying load rates. Fig. 9 presents the comprehensive indicator scores for data centers utilizing the rack-level loop thermosyphon system across different load rates. At the same load rate, the system achieves the highest comprehensive scores in Lanzhou and Hohhot, primarily due to the lower average wet-bulb temperatures in these cities (below 5.5°C on average). Changes in the required cooling capacity of a data center have minimal impact on the variation in the cooling system’s ability to utilize natural cold sources. However, due to the relatively lower reduction in energy consumption when replacing traditional CRACs with the rack-level loop thermosyphon system, the dynamic investment payback period is extended, resulting in lower comprehensive scores for the system’s implementation in Beijing and Guiyang. Additionally, when the data center load decreases from 50% to 25%, Guangzhou’s comprehensive score increases. This improvement is primarily due to the significant reduction in the required cooling capacity at a 25% load rate, which reduces the time the cooling system operates in mechanical cooling mode from 1990 to 1128 h. This reduction leads to a more substantial decrease in energy consumption, thereby enhancing Guangzhou’s comprehensive score. Fig. 9 illustrates that, regardless of the load rate, Hohhot, Lanzhou, and Yinchuan consistently rank among the top three in terms of comprehensive scores. Conversely,Guiyang (at a 25% load rate), Guangzhou (at a 50% load rate), and Beijing (at 75% and 100% load rates) exhibited the lowest comprehensive scores. At the same load rate, Beijing’s cooling system has a lower dynamic investment payback period score compared to the average, while Guangzhou’s cooling system exhibits lower PUE and energy consumption reduction scores. Guiyang’s cooling system, on the other hand, has lower energy consumption reduction and dynamic investment payback period scores, leading to the lowest overall comprehensive score among these cities.
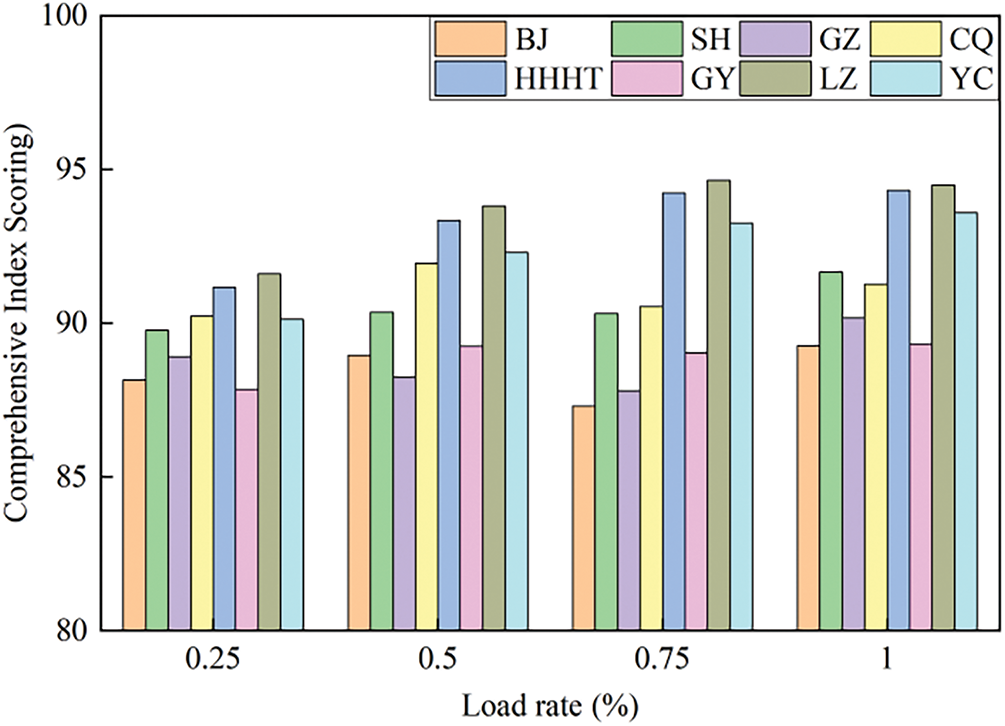
Figure 9: Comprehensive indicator scores of the data center using the rack-level loop thermosyphon system under different load rates
This pioneering study presents the development of a comprehensive evaluation index to assess the applicability of cooling systems based on the rack-level loop thermosyphon system. The key contributions of this study are outlined as follows: (a) the proposal of a comprehensive evaluation index for evaluating the suitability of cooling systems; (b) the identification and analysis of key factors influencing the combined performance metrics of PUE, CUE, and WUE in data center cooling systems; and (c) a thorough analysis and comparison of energy consumption and comprehensive evaluation indicators across various national computing hub nodes. The main findings of this study are outlined as follows:
(1) The air wet-bulb temperature (Ta,w) was found to be the dominant factor affecting the variation in the combined metrics of PUE, CUE, and WUE.
(2) From an energy consumption perspective, the energy-saving potential of the rack-level loop thermosyphon system across different computing hub nodes is ranked as follows: Inner Mongolia hub (Hohhot) > Gansu hub (Lanzhou) > Ningxia hub (Yinchuan) > Beijing-Tianjin-Hebei hub (Beijing) > Guizhou hub (Guiyang) > Chengdu-Chongqing hub (Chongqing) > Yangtze River Delta hub (Shanghai) > Guangdong-Hong Kong-Macao Greater Bay Area hub (Guangzhou).
(3) Based on the comprehensive evaluation index, the rack-level loop thermosyphon system achieves the highest score in Lanzhou (94.485) and the lowest in Beijing (89.261). The overall ranking of cities according to the comprehensive evaluation score is as follows: Gansu hub (Lanzhou) > Inner Mongolia hub (Hohhot) > Ningxia hub (Yinchuan) > Yangtze River Delta hub (Shanghai) > Chengdu Chongqing hub (Chongqing) > Guangdong Hong Kong Macao Greater Bay Area hub (Guangzhou) > Guizhou hub (Guiyang) > Beijing-Tianjin-Hebei hub (Beijing).
(4) Across all load rates, Hohhot, Lanzhou, and Yinchuan consistently rank among the top three cities in terms of comprehensive evaluation scores. In comparison, the lowest comprehensive scores were observed in Guiyang at a 25% load rate, Guangzhou at a 50% load rate, and Beijing at both 75% and 100% load rates.
These results provide significant insights into the application of a comprehensive evaluation index for determining the suitability of rack-level loop thermosyphon cooling systems across a range of computing hub nodes. The findings offer a valuable foundation for guiding the design and deployment of next-generation, energy-efficient cooling solutions in data center environments.
Acknowledgement: The authors have no additional acknowledgements to declare.
Funding Statement: The present study was supported by the Natural Science Foundation of Hunan Province, China (Grant Nos. 2023JJ50178 and 2023JJ50194) and the Excellent Youth Project of Hunan Provincial Department of Education (Grant No. 23B0542).
Author Contributions: Study conception and design: Li Ling; data collection: Danhao Song, Qianlong Hu, Zihao Xiang, Zeyu Zhang; analysis and interpretation of results: Li Ling, Danhao Song, Qianlong Hu; draft manuscript preparation: Li Ling, Danhao Song, Qianlong Hu. All authors reviewed the results and approved the final version of the manuscript.
Availability of Data and Materials: Data will be made available on request.
Ethics Approval: Not applicable.
Conflicts of Interest: The authors declare no conflicts of interest to report regarding the present study.
Nomenclature
| List of Abbreviations | |
| CUE | Carbon Usage Effectiveness |
| CRACs | Computer room air conditioners |
| CRAHs | Conventional computer room air handlers |
| PDU | Power Distribution Unit |
| PUE | Power Usage Effectiveness |
| UPS | Uninterruptible Power Supply |
| WUE | Water Usage Effectiveness |
| List of Symbols | |
| A | Area, m2 |
| α | Heat generation increase factor |
| C | Carbon Dioxide Emissions, kg |
| CI | Cash income, RMB |
| CO | Cash outcome, RMB |
| G | Volumetric flow rate, m3/h |
| i0 | Interest rates, % |
| K | Thermal conductivity, W/(m2·K) |
| m | Mass flow rate, m3/h |
| P | Power or heat loss, kW |
| Pt | Dynamic payback period |
| Q | Cooling load, kW |
| t | Temperature, °C |
| U | Heat Transfer Coefficient, W/(m2·K) |
| u | Utilization, % |
| Carbon emission factors, kg·(kW·h)−1 | |
| W | Water resource consumption, L |
| △Tct | Temperature difference of cooling water, °C |
| List of Subscripts | |
| a | air |
| aft | after renovation |
| bef | before renovation |
| c | condenser |
| cc | compensation chamber |
| chw | chiller water |
| ct | cooling tower |
| cw | cooling water |
| e | evaporator |
| envelope | envelope |
| full | full load |
| hs | heating source |
| hx,c | cold side of the heat exchanger |
| hx,h | hot side of the heat exchanger |
| IT | Information Technology |
| i | inlet |
| in | indoor |
| lighting | Lighting |
| l | Liquid line |
| loop | loop |
| o | outlet |
| r | return |
| ref | reference |
| s | supply |
| server | server |
| sys | system |
| v | Vapor line |
| w | capillary wick |
References
1. Güğül GN, Gökçül F, Eicker U. Sustainability analysis of zero energy consumption data centers with free cooling, waste heat reuse and renewable energy systems: a feasibility study. Energy. 2023;262(3/4):125495. doi:10.1016/j.energy.2022.125495. [Google Scholar] [CrossRef]
2. Gong Y, Zhou F, Ma G, Liu S. Advancements on mechanically driven two-phase cooling loop systems for data center free cooling. Int J Refrig. 2022;138(11):184–96. doi:10.1016/j.ijrefrig.2022.03.007. [Google Scholar] [CrossRef]
3. Zou S, Zhang Q, Ling L, Wang J, Yue C. Experimental investigation on the thermal performance of a water-cooled loop thermosyphon system under fan failure conditions. Int J Refrig. 2020;124:85–95. doi:10.1016/j.ijrefrig.2020.12.011. [Google Scholar] [CrossRef]
4. Zhan B, Shao S, Zhang H, Tian C. Simulation on vertical microchannel evaporator for rack-backdoor cooling of data center. Appl Therm Eng. 2020;164(1):1–10. (In Chinese). doi:10.1016/j.applthermaleng.2019.114550. [Google Scholar] [CrossRef]
5. Zhang H, Shao S, Jin T, Tian C. Numerical investigation of a CO2 loop thermosyphon in an integrated air conditioning system for free cooling of data centers. Appl Therm Eng. 2017;126:1134–40. doi:10.1016/j.ijrefrig.2015.08.014. [Google Scholar] [CrossRef]
6. Zheng Y, Li Z, Liu X, Tong Z, Tu R. Retrofit of air-conditioning system in data center using separate heat pipe system. Lect Notes Electr Eng. 2014;262(7):685–94. doi:10.1007/978-3-642-39581-9_67. [Google Scholar] [CrossRef]
7. Ding T, He Z, Hao T, Li Z. Application of separated heat pipe system in data center cooling. Appl Therm Eng. 2016;109:207–16. doi:10.1016/j.applthermaleng.2016.08.025. [Google Scholar] [CrossRef]
8. Wemhoff AP, Ortega A. An exergy-based analysis of the effects of rear door heat exchange systems on data center. In: Proceedings of the 14th IEEE ITHERM Conference; 2014 May 27–30; Orlando, FL, USA. doi:10.1109/ITHERM.2014.6892407. [Google Scholar] [CrossRef]
9. Zou S, Zhang Q, Yue C. Comparative study on different energy-saving plans using water-side economizer to retrofit the computer room air conditioning system. J Build Eng. 2023;69(12):106278. doi:10.1016/j.jobe.2023.106278. [Google Scholar] [CrossRef]
10. Sharma P, Pegus PII, Irwin D, Shenoy P, Goodhue J, Culbert J. Design and operational analysis of a green data center. IEEE Internet Comput. 2017;21(4):16–24. doi:10.1109/MIC.2017.2911421. [Google Scholar] [CrossRef]
11. Zou S, Liu J, Dai Y. Performance of a multi-cooling sources cooling system with photovoltaics and waste heat recovery in data center. Energ Convers Manage. 2025;324:119319. doi:10.1016/j.enconman.2024.119319. [Google Scholar] [CrossRef]
12. Zou S, Pan Y. Performance of a hybrid thermosyphon cooling system using airside economizers for data center free cooling under different climate conditions. Appl Therm Eng. 2024;98:111235. doi:10.1016/j.jobe.2024.111235. [Google Scholar] [CrossRef]
13. Wang C, Yu H, Xian L, Liu G, Chen L, Tao W. Study on the operation strategy of the water cooling system in the single-phase immersion cooling data center considering cooling tower performance. Energ Builds. 2024;324(12):114890. doi:10.1016/j.enbuild.2024.114890. [Google Scholar] [CrossRef]
14. Dai Y, Liu J, Zou S. Energy-saving and economic analysis of the data center cooling system using magnetic bearing chillers under different climate conditions. Case Stud in Therm Eng. 2024;61:104915. doi:10.1016/j.csite.2024.104915. [Google Scholar] [CrossRef]
15. Jing Y, Xie L, Li F, Zhan Z, Wang Z, Yang F, et al. Field test of cooling systems in two air-cooled data centers: various regions, air distributions and evaporative cooling technologies. Appl Therm Eng. 2024;248(1):123189. doi:10.1016/j.applthermaleng.2024.123189. [Google Scholar] [CrossRef]
16. Fan C, Zou B, Liao Y, Zhou X. Evaluation of energy performance and ecological benefit of free-cooling system for data centers in worldwide climates. Sustain Cities Soc. 2024;108(3):105509. doi:10.1016/j.scs.2024.105509. [Google Scholar] [CrossRef]
17. Zhang Y, Li H, Wang S. Life-cycle optimal design and energy benefits of centralized cooling systems for data centers concerning progressive loading. Renew Energ. 2024;230(10):120847. doi:10.1016/j.renene.2024.120847. [Google Scholar] [CrossRef]
18. Jin Y, Bai X, Xu X, Mi R, Li Z. Climate zones for the application of water-side economizer in a data center cooling system. Appl Therm Eng. 2024;250:123450. doi:10.1016/j.applthermaleng.2024.123450. [Google Scholar] [CrossRef]
19. Zhou Y, Li S, Li Q, Wei F, Yang D, Liu J, et al. Energy savings in direct air-side free cooling data centers: a cross-system modeling and optimization framework. Energ Builds. 2024;308(6481):114003. doi:10.1016/j.enbuild.2024.114003. [Google Scholar] [CrossRef]
20. Rasmussen N. Avoiding costs from oversizing data center and network room infrastructure. Whitepaper. 2011;37:1–9. [cited 2025 May 22]. Available from: https://www.mercurymagazines.com/pdf/APC4.pdf. [Google Scholar]
21. Jin C, Bai X, Yang C, Mao W, Xu X. A review of power consumption models of servers in data centers. Appl Energ. 2020;265:114806. doi:10.1016/j.apenergy.2020.114806. [Google Scholar] [CrossRef]
22. ASHRAE technical committee (TC). Thermal guidelines for data processing environments—expanded data center classes and usage guidance. Peachtree Corners, GA, USA: American Society of Heating, Refrigerating and Air-Conditioning Engineers; 2011 [cited 2025 May 22]. Available from: https://airatwork.com/wp-content/uploads/ASHRAETC99.pdf. [Google Scholar]
23. TRNSYS 18: a transient system simulation Program. Madison, WI, USA: Solar Energy Laboratory, University of Wisconsin; 2017 [cited 2025 May 22]. Available from: https://sel.me.wisc.edu/trnsys. [Google Scholar]
24. T/ASC 05-2019. Evaluation standard for green data center. Beijing, China: China Architecture & Building Press; 2019 [cited 2025 May 22]. (In Chinese). Available from: https://www.doc88.com/p-11761573545769.html. [Google Scholar]
25. Sobol IM. Global sensitivity indices for nonlinear mathematical models and their Monte Carlo estimates. Math Comput Simulat. 2001;55(1–3):271–80. doi:10.1016/S0378-4754(00)00270-6. [Google Scholar] [CrossRef]
26. U.S. department of energy, office of energy efficiency and renewable energy. Weather Data [J/OL]. [cited 2025 May 22]. Available from: https://energyplus.net/weather. [Google Scholar]
27. Ling L, Zhang Q, Yu Y, Ma X, Liao S. Energy saving analysis of the cooling plant using lake water source base on the optimized control strategy with set points change. Appl Therm Eng. 2018;130:1440–9. doi:10.1016/j.applthermaleng.2017.10.152. [Google Scholar] [CrossRef]
28. ASHRAE Technical Committee (TC). Liquid cooling guidelines for datacom equipment centers—ASHRAE Datacom Series. Atlanta, GA, USA: American Society of Heating, Refrigerating, and Air-Conditioning Engineers; 2014. [Google Scholar]
29. Ministry of Ecology and Environment. Research on carbon dioxide emission factors of China’s regional power grid. 2023 [cited 2025 May 22]. (In Chinese). Available from: https://baijiahao.baidu.com/s?id=1781261961985264939&wfr=spider&for=pc. [Google Scholar]
30. China Refrigeration Society Data Center Co-oling Working Group. Annual development research report on cooling technology in China Data Centers. Beijing, China: China Construction Industry Press; 2020 [cited 2025 May 22]. (In Chinese). Available from: https://www.car.org.cn/index.php?s=/articles_1546.html. [Google Scholar]
Cite This Article
 Copyright © 2025 The Author(s). Published by Tech Science Press.
This work is licensed under a Creative Commons Attribution 4.0 International License , which permits unrestricted use, distribution, and reproduction in any medium, provided the original work is properly cited.
 Downloads
 Citation Tools