
 Submit a Paper
 Propose a Special lssue
 Open Access
REVIEW

Resilient Photovoltaics: Global Optimization and Advanced Control under Complex Operating Conditions: A Critical Review
1 Department of Biosciences, Saveetha School of Engineering, Saveetha Institute of Medical and Technical Sciences, Chennai, 602105, India
2 Applied Science Research Center, Applied Science Private University, Amman, 11931, Jordan
3 Electrical Engineering, Beykent University, Ayazağa Mahallesi, Hadım Koruyolu Cd. No:19, Sarıyer, İstanbul, 34398, Turkey
4 Chitkara University Institute of Engineering & Technology, Chitkara University, Punjab, 140401, India
5 Jadara University Research Center, Jadara University, P.O. Box 733, Irbid, 21110, Jordan
6 School of Physics and Electronic Engineering, Hanshan Normal University, Chaozhou, 521041, China
7 Faculty of Educational Sciences, Al-Ahliyya Amman University, Amman, 19328, Jordan
* Corresponding Author: Manish Kumar Singla. Email:
(This article belongs to the Special Issue: Global Intelligent Optimization and Advanced Control of Photovoltaic Systems Under Complex Operating Conditions)
Energy Engineering 2026, 123(3), 13 https://doi.org/10.32604/ee.2026.072899
Received 06 September 2025; Accepted 03 November 2025; Issue published 27 February 2026
 View Full Text
 Download PDF
Abstract
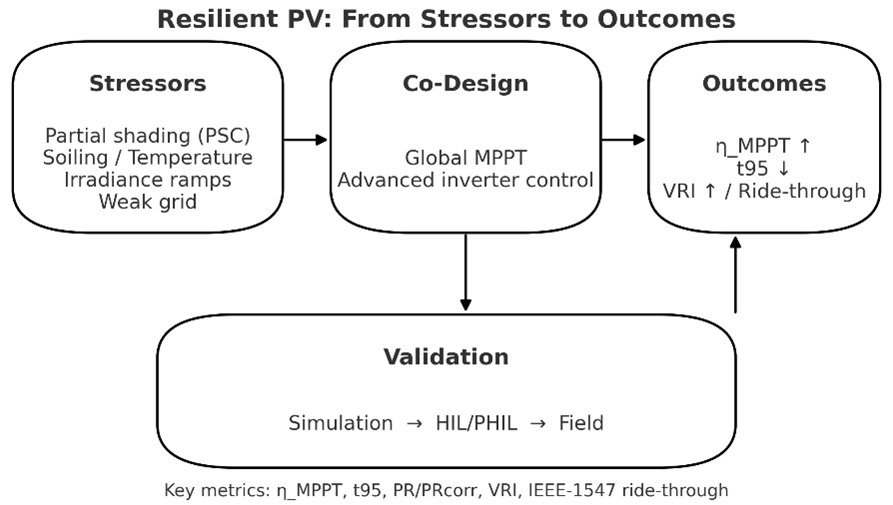
Utility-scale PV plants increasingly operate under partial shading, soiling, temperature swings, and rapid irradiance ramps that depress yield and challenge stability on weak grids. This critical review addresses those conditions by (i) unifying a stressor-to-method taxonomy that links field stressors to global intelligent MPPT (metaheuristics and learning-based trackers) and to advanced inverter controls (adaptive/MPC and grid-forming), (ii) standardizing metrics and reporting aligned with IEC 61724-1 and IEEE 1547/1547.1 to enable fair, reproducible comparisons, and (iii) framing MPPT and grid support as a co-design problem with a DT→HIL→Field validation pathway and seedable scenarios. We identify persistent gaps—fragmented partial-shading benchmarks, limited low-SCR testing, and scarce field-grade validation—and compile a quantitative synthesis: global soiling typically reduces annual production by ≈3%–5%, and hybrid/learning MPPT frequently report ≈99% tracking efficiency under PSC in simulation/HIL studies. To demonstrate practical relevance, we validate the framework on a seeded scenario library: DRL trackers achieve median ηMPPT ≈ 0.996 with t95 ≈ 0.19 s and Hybrid trackers ≈0.992/0.26 s, outperforming Metaheuristics (≈0.984/0.42 s); at SCR = 2.5, grid-forming control raises VRI from ~0.78 (tuned GFL) to ~0.95 while keeping THD within 2.5%–3.2%, with all stacks meeting IEEE-1547.1 Category-II ride-through. The resulting taxonomy, standards-aligned reporting, and open seeds provide a replicable basis for comparable, grid-relevant benchmarking and clear guidance for real-world design and operations.Graphic Abstract
Keywords
Photovoltaic (PV) plants are increasingly operating under complex, non-ideal conditions—such as partial shading patterns across strings and modules, soiling and dust accumulation, temperature swings, and fast irradiance ramps—that reduce energy yield and can stress grid stability when conventional maximum-power-point-tracking (MPPT) and grid-following controls are pushed beyond their design limits [1–3]. Interconnection requirements have also gotten stricter. For example, IEC 61724-1:2021 now guides performance monitoring, and IEEE 1547-2018 requires DER ride-through and grid-support functions [4,5]. This means that PV inverters must help keep the frequency and voltage stable instead of disconnecting when there are problems. At the same time, the power system is moving toward low-inertia, low-short-circuit-ratio situations, where “grid-forming” (GFM) regulation is becoming a key part of stability. Research roadmaps are calling for validated models, standardized tests, and field-grade demonstrations. This convergence—more difficult operating conditions on the PV side and higher stability demands on the grid side—shows that we need resilient photovoltaics that use smart global optimization and enhanced control [6–10].
Recent surveys on global MPPT under partial shading reveal a consistent outcome: metaheuristics such as PSO, GWO, and DE, along with hybrid and learning-assisted trackers, consistently demonstrate tracking efficiency exceeding 99% in controlled PSC studies and delineate distinct speed–accuracy–complexity trade-offs [11]. A 2025 review in Scientific Reports looks specifically into GMPPT under PSC. It lists modern optimizer families and how they can be combined [11]. From 2023 to 2025, complementary syntheses examine traditional, metaheuristic, and hybrid techniques. They usually find that hybrids shorten convergence and reduce oscillation near the GMPP, but they also need more design work. Simultaneously, a swiftly growing field utilizes deep and reinforcement learning for non-stationary shading; demonstrations employing DQN/PPO agents and recurrent variants (e.g., LSTM-assisted PPO/A2C) enhance adaptability to rapid irradiance/temperature fluctuations and multi-peak P–V landscapes compared to traditional P&O/INC, while introducing unresolved issues regarding sample efficiency and hardware portability [12]. State-of-the-art studies and roadmaps on the grid side say that grid-forming (GFM) control is a vital part of keeping low-inertia, low-SCR systems stable. A survey by IEEE Power & Energy Magazine (2024) shows the GFM landscape and points out gaps in current limiting, protection, black start, and model validation [13]. Reports from NREL and ESIG give definitions, test needs, and steps for harmonization across single- and three-phase GFM and document early BESS-GFM deployments [14]. These sources together advocate for the advancement of photovoltaic (PV) controllers beyond mere grid-following behavior, promoting the adoption of context-aware grid-following modes or hybrid configurations in weak grid environments. Digital twin concepts now connect data-driven monitoring with physics-based models for O&M, controller tuning, and scenario testing. A 2024 Energy paper shows how an operational PV DT platform works, and recent surveys show that there are still gaps in research on unified PV-DT definitions, multi-domain modeling, and validation that goes beyond simulation into HIL/PHIL and field pilots [15–17]. Standards and best-practice guidelines (IEC 61724-1; IEEE 1547/1547.1; IEA PVPS Task 13) provide monitoring classes, reporting, grid-support functions, and benchmarking for PSC and soiling. This shows how important it is to be aware of standards while doing MPPT/control studies [18–22].
In this context, the current review enhances the discipline by considering energy-capture optimization and grid-support control as a unified co-design challenge. We connect PSC, soiling, and ramp dynamics, along with grid strength, to certain MPPT and inverter-control stacks using a single taxonomy and decision paths. We also suggest a validation pipeline that follows standards and is ready for DT, from simulation to HIL/PHIL to field, based on seedable disturbance profiles that let labs compare apples to apples. Instead of describing technique families again, we compare them using harmonized KPIs from Section 2, sort the results by stressor severity and SCR to make dominance regions clear, and put all the data together into a co-design trade-off that is explained in Section 5. Readers looking for the main points can find them in the synthesis paragraphs at the ends of Sections 3 and 4. These paragraphs turn the research into clear, useful advice.
1.3 Research Gaps and Aims of the Work
Despite recent advancements, four structural deficiencies continue to obstruct comparability and practical application. Benchmarking under complicated operating settings is still not very organized. For example, studies do not always use the same partial-shading masks, irradiance-ramp profiles, or soiling trajectories, and reports sometimes leave out the performance-ratio context or the measurement-class data that IEC 61724-1 says are needed. There is also not much evidence for weak grids, and the evidence that does exist is not always the same. Different jurisdictions use different short-circuit-ratio definitions and test processes, and the results do not always fit with IEEE 1547 grid-support functions or newer withstand/SCR methods. Also, “optimization for energy capture” and “control for resilience” are frequently set up separately, which makes it hard to see how they work together during disturbances and ride-through occurrences. Digital twin workflows show promise, but they do not have shared datasets, seedable disturbance profiles, or a set order of validation phases that includes simulation, HIL/PHIL, and field pilots. In response, this review puts together a taxonomy that connects site stressors to certain MPPT and inverter-control choices (with tuning advice), suggests a minimal standards-compliant reporting template and scenario set for PSC, ramps, and soiling, integrates quantitative performance ranges for modern MPPT and grid-forming controls, and defines a DT-enabled, reproducible test harness that links Simulink-class models to HIL and field validation. We avoid simply providing facts by putting together evidence on a common set of standards-aware metrics described in Section 2—ηMPPT, t95, stable oscillation/THD, and VRI—and organizing the data by stressor intensity (PSC/ramp/soiling) and grid strength (SCR). Each technical subsection ends with a short analytical synthesis that makes direct comparisons, explains when a method family is best, and lists any caveats. Section 5 then combines these comparisons into a single co-design trade-off that uses the same metrics and symbols as the Nomenclature and Section 2.
1.4 Study Objectives & Research Questions
Research gap. Prior work lacks (1) standardized complex-condition benchmarks (PSC/ramps/soiling) and reporting; (2) consistent evidence for weak-grid operation (low SCR); and (3) field-grade, reproducible validation paths—leaving optimization and grid-support advances difficult to compare and translate.
The different Objectives of this study are presented as follows:
O1. Consolidate a taxonomy mapping field stressors (PSC, soiling, ramps, low-SCR) to specific MPPT and control choices with tuning guidance.
O2. Define a standards-aware evaluation blueprint (metrics, scenarios, reporting) aligned with IEC 61724-1 and IEEE 1547/1547.1.
O3. Provide a co-design framework that links intelligent MPPT with grid-support (GFL→GFM) to maximize yield and stability jointly.
O4. Specify a DT→HIL→field validation pipeline with seedable profiles to enable apples-to-apples reproduction across labs.
The various Research questions are layed below:
RQ1. Which MPPT/control stacks are most effective across stressor severity and grid strength (SCR)?
RQ2. What metrics & scenarios make cross-paper results comparable and interoperable with standards?
RQ3. How can DT/HIL/field evidence be seeded and reproduced so that reported gains are bankable?
1.5 Methodological Contribution
We introduce a methods stack that operationalizes this review:
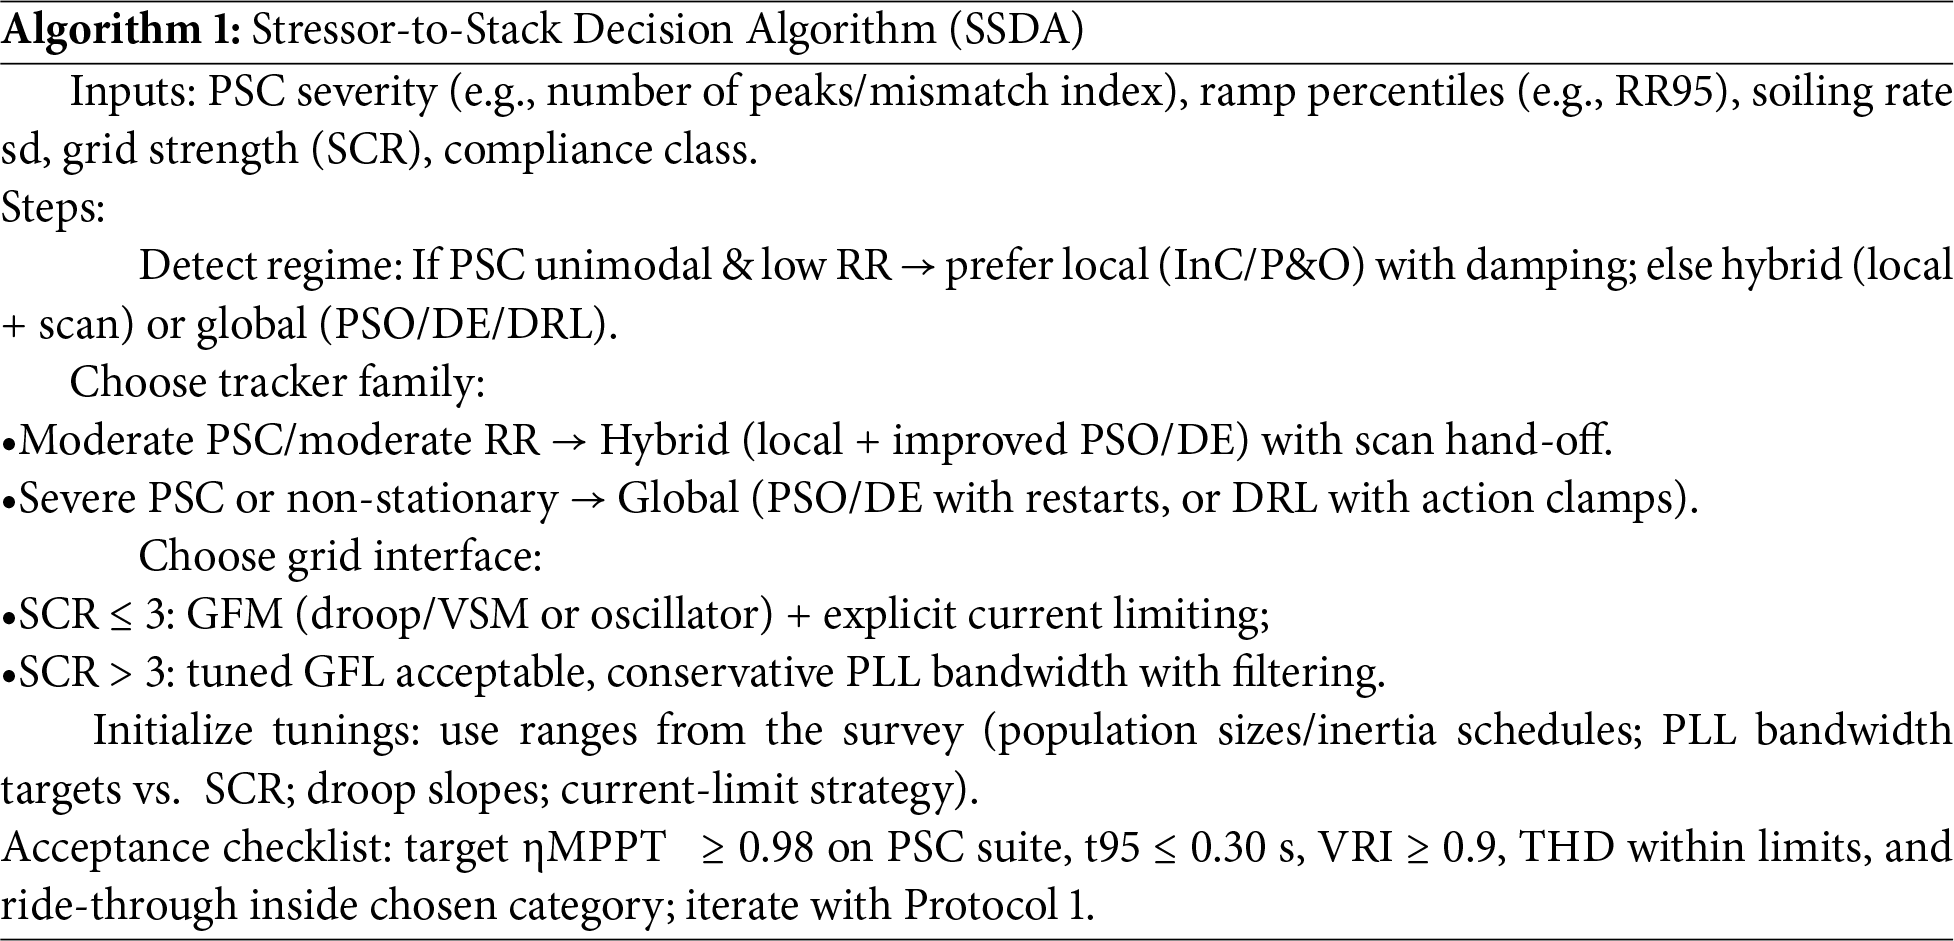
(M1) Algorithm 1—Stressor-to-Stack Decision Algorithm (SSDA). A rule-based mapping from observed stressors—PSC severity, soiling rate, ramp percentiles, and grid strength (SCR)—to an MPPT + control stack (local, hybrid, metaheuristic/DRL; GFL vs. GFM with current limiting) and to initial tunings.
(M2) Co-design optimization. A standards-aware multi-objective program that jointly tunes tracker and grid interface to maximize η_MPPT and voltage-recovery while bounding oscillation, THD, and ride-through compliance (Section 5).
(M3) Protocol 1—Reproducible Benchmarking & Reporting (RBR). A minimal, standards-aligned protocol (metrics, scenarios, and reporting template) and a DT→HIL→field validation path with seedable profiles so results are apples-to-apples across labs (Sections 2 and 6).
1.6 Contributions and Novelty of the Study
The review’s originality resides in conceptualizing resilience as a co-design target that integrates intelligent global MPPT with superior inverter control, rather than examining them in isolation. We provide a stressor-to-method mapping that links PSC severity, soiling rate, and irradiance variability with certain metaheuristic/DRL trackers and GFM/GFL control choices and PLL design; a standards-aware evaluation blueprint that incorporates IEC 61724-1 measurement classes and IEEE 1547 grid-support functions into a clear reporting template; a quantitative synthesis of recent results that show near-unity global MPPT efficiency and stability improvements of GFM in weak grids; and a digital-twin-ready validation pipeline with seedable scenarios and a progression from simulation to HIL to field trials. The goal of these aspects is to make studies easier to compare between labs and easier for developers, integrators, and TSOs to use.
This article is structured to systematically examine O1–O4 and RQ1–RQ3, guiding the reader from concepts to implementation. By defining the taxonomy of complicated PV operating conditions—partial shading, soiling, irradiance ramps, and weak-grid/SCR regimes—and by formalizing evaluation metrics and datasets in compliance with IEC 61724-1, Section 2 provides a common language. Section 3 looks at intelligent global MPPT methods, from metaheuristics and hybrid schemes to DRL-based trackers, and gives practical advice on how to set parameters for non-stationary PSC. Section 4 looks at advanced inverter control, focusing on grid-forming strategies, PLL design, and IEEE 1547 ride-through behavior, and puts together evidence for stability in weak grids. Section 5 brings these threads together into a co-design framework and gives a quantitative meta-summary of performance ranges and trade-offs. Section 6, on the other hand, goes into detail about a digital-twin validation pipeline that goes from simulation to HIL to the field and uses open, seedable disturbance profiles to make sure it can be repeated. Section 7 gives practitioners checklists, a simple reporting form, and a targeted research agenda for standardized benchmarks for complicated conditions. Section 8 ends with a short summary of contributions and major quantitative outcomes. The review uses authoritative sources like the IEA PVPS Task 13 guidance on soiling and O&M, the IEC 61724-1 monitoring practice, the IEEE 1547/1547.1 interconnection requirements, the NREL and IEEE PES roadmaps on grid-forming inverters, comprehensive MPPT assessments and recent heuristic/DRL advances, weak-grid stability analyses, and PV/smart-grid digital-twin surveys. It also adds three unifying elements: a single taxonomy that maps field stressors to specific MPPT/control choices and tunings; a standards-aware evaluation blueprint with ready-to-reuse metrics and reporting; and a reproducible, DT-enabled test harness that connects simulation to HIL/PHIL and field so that quantitative synthesis and co-design guidance translate directly into comparable, grid-relevant practice.
2 Taxonomy of Complex PV Operating Conditions; Evaluation Metrics and Datasets Aligned with IEC 61724-1
This part makes the operating-condition taxonomy for resilient photovoltaics official and lists the metrics, data-quality standards, and datasets needed to test algorithms and controllers in a way that is reproducible and follows standards. We categorize real-world stressors based on their physical origin and specific space-time scales: spatially heterogeneous irradiance resulting in multi-peaked P–V curves through partial shading and bypass-diode activation; gradual optical losses caused by soiling and dust accumulation; temperature-induced voltage fluctuations and thermal mismatches across arrays; rapid irradiance ramps linked to cloud transients; and grid-side fragility indicated by the short-circuit ratio (SCR) at the point of interconnection [23–25]. To make sure that the evaluations are comparable, they all use IEC 61724-1 concepts and terms for monitoring and reporting. This means that energy yields, performance ratios (and temperature-corrected versions), and other related quantities are all calculated using traceable measurement classes and stated sensor specifications, such as sampling cadence and uncertainty budgets [26–28]. Protocol 1—Reproducible Benchmarking & Reporting (RBR) puts the standards-aware blueprint and the DT→HIL→field pathway from the paper into action by requiring seedable scenario libraries (PSC masks, ramp profiles, soiling trajectories, and SCR-binned grid events), metadata and data-quality checks, and a single set of KPIs that can be used in different labs and deployment tiers.
Protocol 1—Reproducible Benchmarking & Reporting (RBR)
P1. Metrics (IEC-aware): report Yr, Yf, PR, PRcorr with measurement class; PSC MPPT efficiency ηMPPT = ∫P/∫P*; ramp-rate statistics RR; and grid KPIs (VRI, THD).
P2. Scenarios: publish a small seeded library covering PSC severities, irradiance ramps, soiling trajectories, and SCR categories; identify each case by a short name and seed.
P3. Oracle & alignment: disclose the GMPP oracle or scan logic and time-alignment method used across Simulation/HIL/Field.
P4. Reporting template: one-page table listing site characterization, seeds, controller family + tunings, and KPIs (worst-case + percentiles).
P5. Validation tiers: apply the same seeds DT→HIL→Field and verify IEEE 1547 functions and ride-through envelopes where applicable.
We apply Protocol 1 in Section 6 as a compact case study, re-using the same seeded scenarios across Simulation, HIL, and (where possible) Field.
2.1 Assumptions, Parameters & Boundary Conditions (Justified)
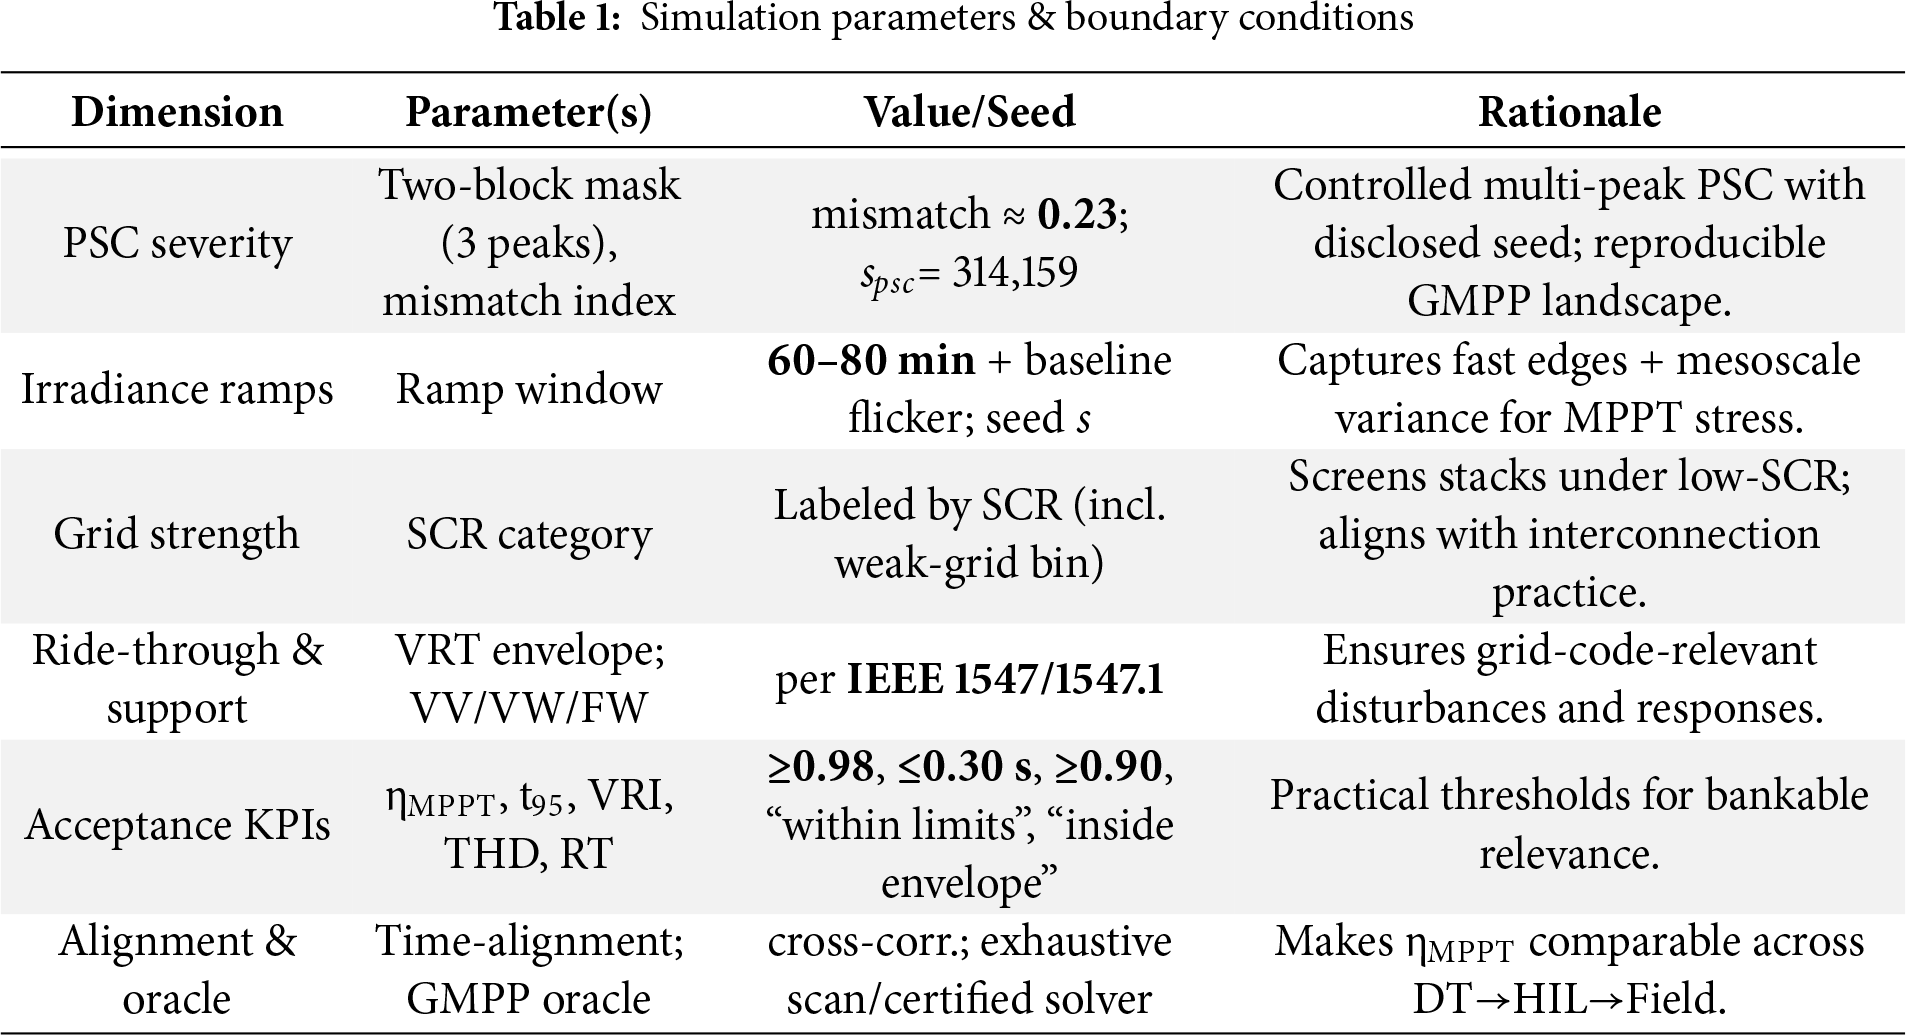
All design choices (plant, environment, and grid) follow a standards-aligned blueprint to ensure comparability and grid relevance: KPIs and acceptance thresholds are anchored to IEC 61724-1 monitoring practice (yield/PR discipline) and IEEE 1547/1547.1 interoperability (volt-/freq-support and ride-through); validation spans DT→HIL→Field using identical seeded scenarios. We disclose a compact seeded library covering: (i) PSC masks with mismatch index; (ii) irradiance variability via OU noise plus injected ramp windows; (iii) soiling trajectories with cleaning events; and (iv) grid events indexed by short-circuit ratio (SCR). Each case is named and seeded for exact replay. Example entries (abridged): PSC-A = two-block PSC (3 peaks), mismatch ≈ 0.23, seeds spsc = 314,159, stopo = 2718; RAMP-B = 60–80 min ramp + baseline flicker.
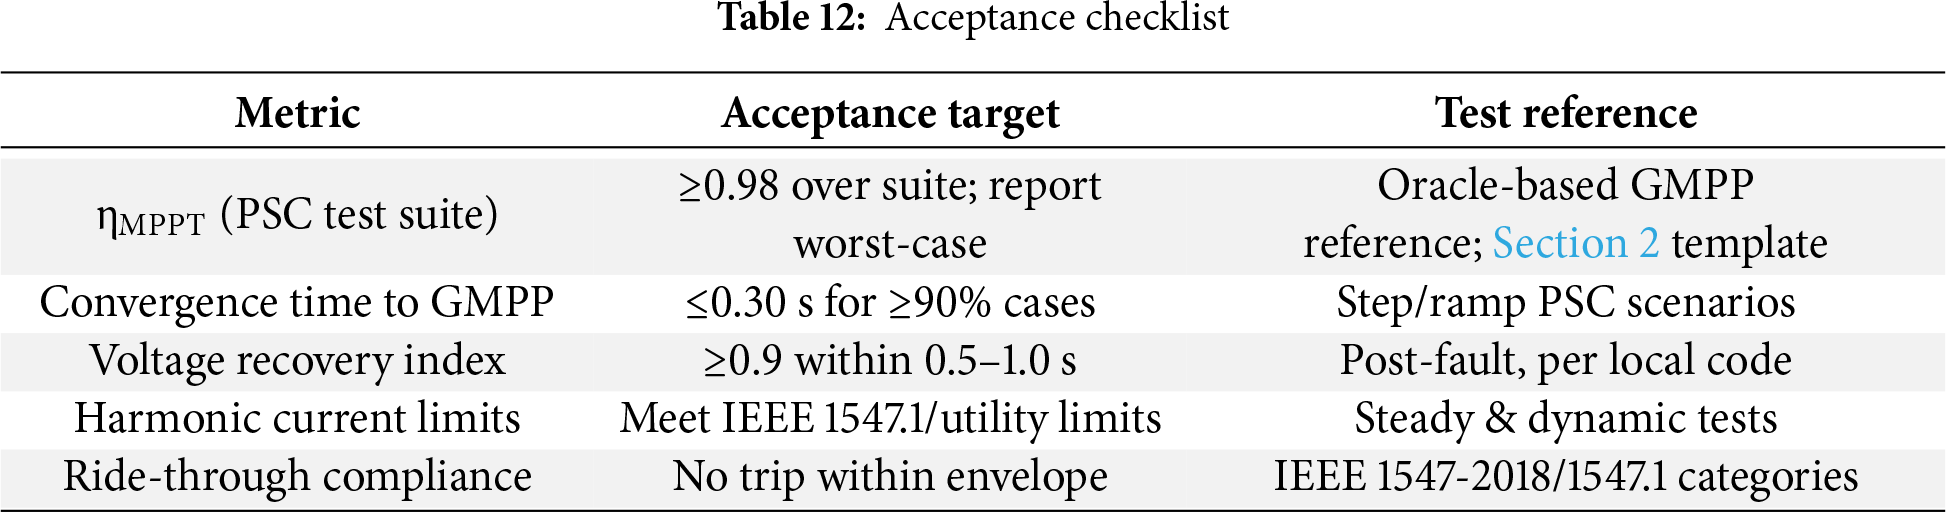
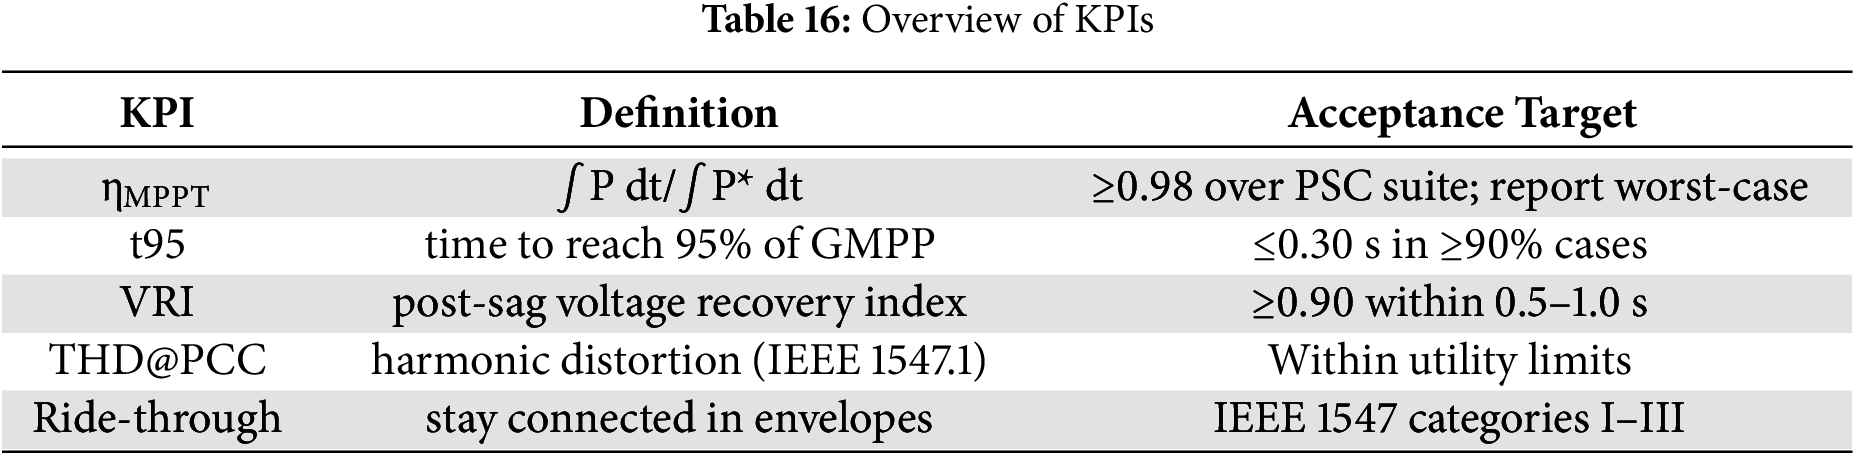
We justify practical relevance by testing stacks against explicit thresholds: ηMPPT ≥ 0.98 (suite), t95 ≤ 0.30 s (≥90% of cases), VRI ≥ 0.90 within 0.5–1.0 s, THD within utility limits, and IEEE-1547 ride-through inside the mandated envelopes. These become the pass/fail yardsticks for each scenario. MPPT stacks (Metaheuristics; Hybrid InC/P&O→PSO/DE with bounded finisher; DRL PPO/DDPG with reward shaping & action clamps) are paired with GFL (SRF-PLL with conservative bandwidth vs. SCR) and GFM (droop/VSM with explicit current limiting). This makes boundary conditions traceable to the chosen control mode. For PSC benchmarks, ηMPPT uses a disclosed GMPP oracle (exhaustive scan/certified solver) and time-alignment procedures (delay compensation, cross-correlation) across DT/HIL/Field so KPI calculations are identical across tiers.
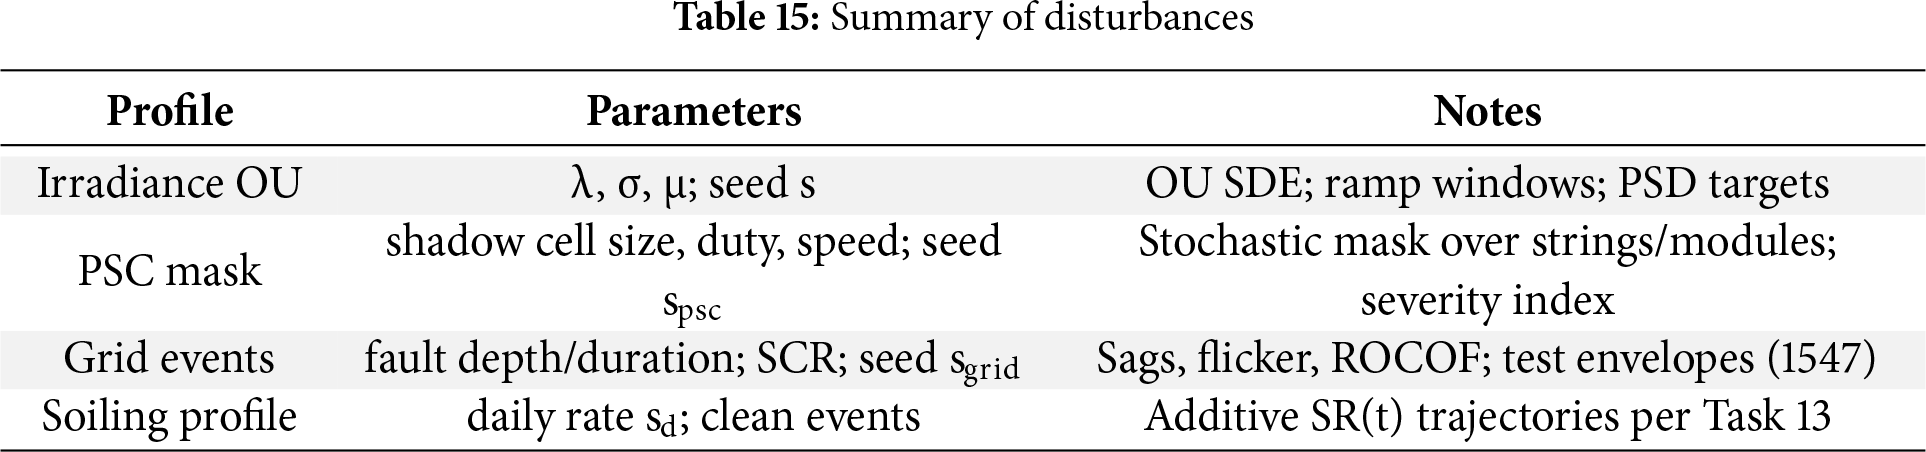
We use seeded generators to create disruptions so that scenarios can be accurately replayed over DT→HIL→field tiers: Irradiance is modeled as an Ornstein–Uhlenbeck process with embedded ramp windows (seed s), tuned to match minute-scale power spectral density and ramp-percentile statistics; partial-shading (PSC) masks are defined by shadow-cell size, duty, and sweep speed (seed sps) with a declared mismatch index; grid events specify fault depth and duration together with the short-circuit ratio (SCR) at the point of interconnection (seed sgrid), constrained to remain within IEEE 1547 ride-through envelopes; and soiling follows a daily accumulation rate sd with an explicit cleaning schedule. Table 1 lists all of the parameters, seeds, and remarks. A one-page reproducibility block accompanies the study to provide full traceability. It lists the code/data DOIs, software versions, and the seed-file hash so that every value presented in the Abstract and Results can be recreated without any hidden preparation.
2.2 Subsequent Materials and Methods
We represent the energy-normalized indicators that underpin most PV performance analyses as follows. The reference yield over an interval [t0, t1] is defined as per Eq. (1) [29,30]:
The final yield is expressed as per relation (2):
where EAC is delivered AC energy and Pr is the array’s nameplate power. The performance ratio is expressed below:
A temperature-adjusted indicator can be used as a first-order approximation when measuring thermal impacts:
with γT the temperature coefficient and Tc the cell temperature so long as the applied measurement class and uncertainty budgeting follow IEC 61724-1. Symbols as defined in Nomenclature.
Under partial shading, MPPT quality must be measured relative to the instantaneous global maximum of the multi-peak P–V characteristic. Let P(t) be the inverter operating power and P∗(t) the global maximum found by exhaustive scan or a validated oracle; then the MPPT efficiency is defined as per relation (5) below [31,32]:
For irradiance variability we define a ramp-rate metric as:
We use thresholding rate and duration to find events, which is in line with how ramp-event detection is done in the variable-generation literature. For site characterisation, percentile summaries like RR95 over certain windows are suggested [33–35]. Fig. 1 illustrates a synthetic ramp with a window and slope labeled.
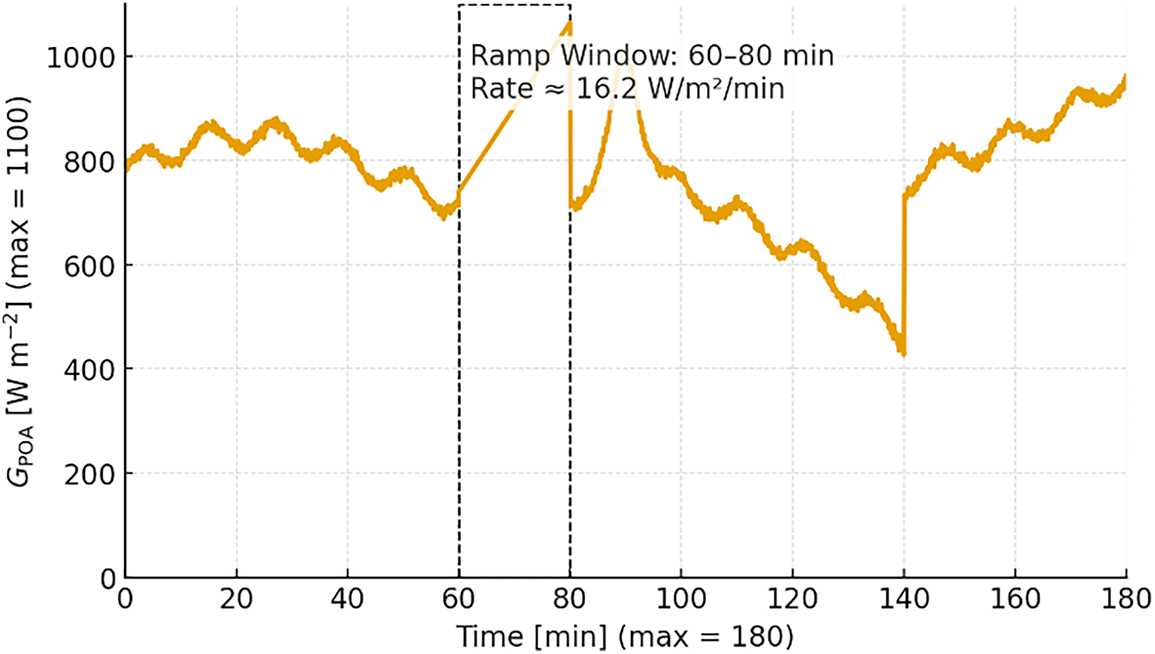
Figure 1: Irradiance Ramp event and rate
Transmittance-based ratios are used to treat soiling. The soiling ratio is determined by a controlled comparison of a soiled string to a clean reference [36–38]:
And the soiling loss is defined below:
The daily soiling rate is expressed as per relation (9):
It integrates to seasonal yield impacts that inform cleaning economics and O&M planning. Typical annual energy losses of a few percent at utility scale underscore the need to report SR or SL alongside yield/PR and to document cleaning events [39,40]. Fig. 2 illustrates a stylized accumulation with discrete cleanings.
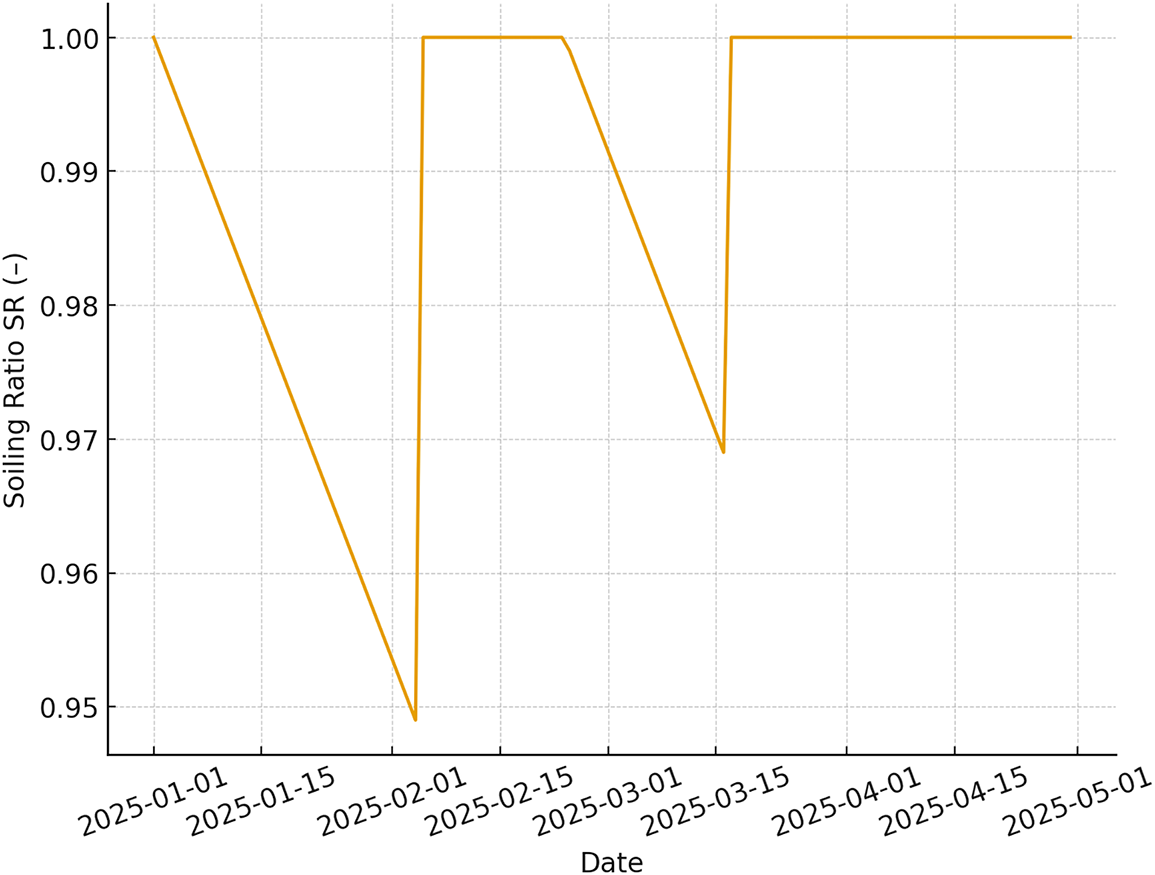
Figure 2: Soiling accumulation with cleaning events
Grid-side stress is parameterized by system strength via short-circuit ratio, which we write as:
See Nomenclature for symbol definitions.
We use seeded models to make disturbances so that DT→HIL→Field may be played back exactly. Irradiance is an Ornstein–Uhlenbeck process with built-in ramp windows (seed s) that is set to match minute-scale PSD and ramp percentiles. Partial-shading masks are set by shadow-cell size, duty, and sweep speed (seed sps or spsc) with a declared mismatch index. Grid events are set by fault depth and duration with the short-circuit ratio at the point of interconnection (seed sgrid) and are limited to IEEE 1547 ride-through envelopes. Soiling follows a daily accumulation rate with a set cleaning schedule (seed sd) [41–45]. Table 2 lists all the seeds and parameters. A reproducibility block keeps track of the code/data DOIs, software versions, and the seed-file hash such that every value in the Abstract and Results may be accurately obtained (Tables 3 and 4).
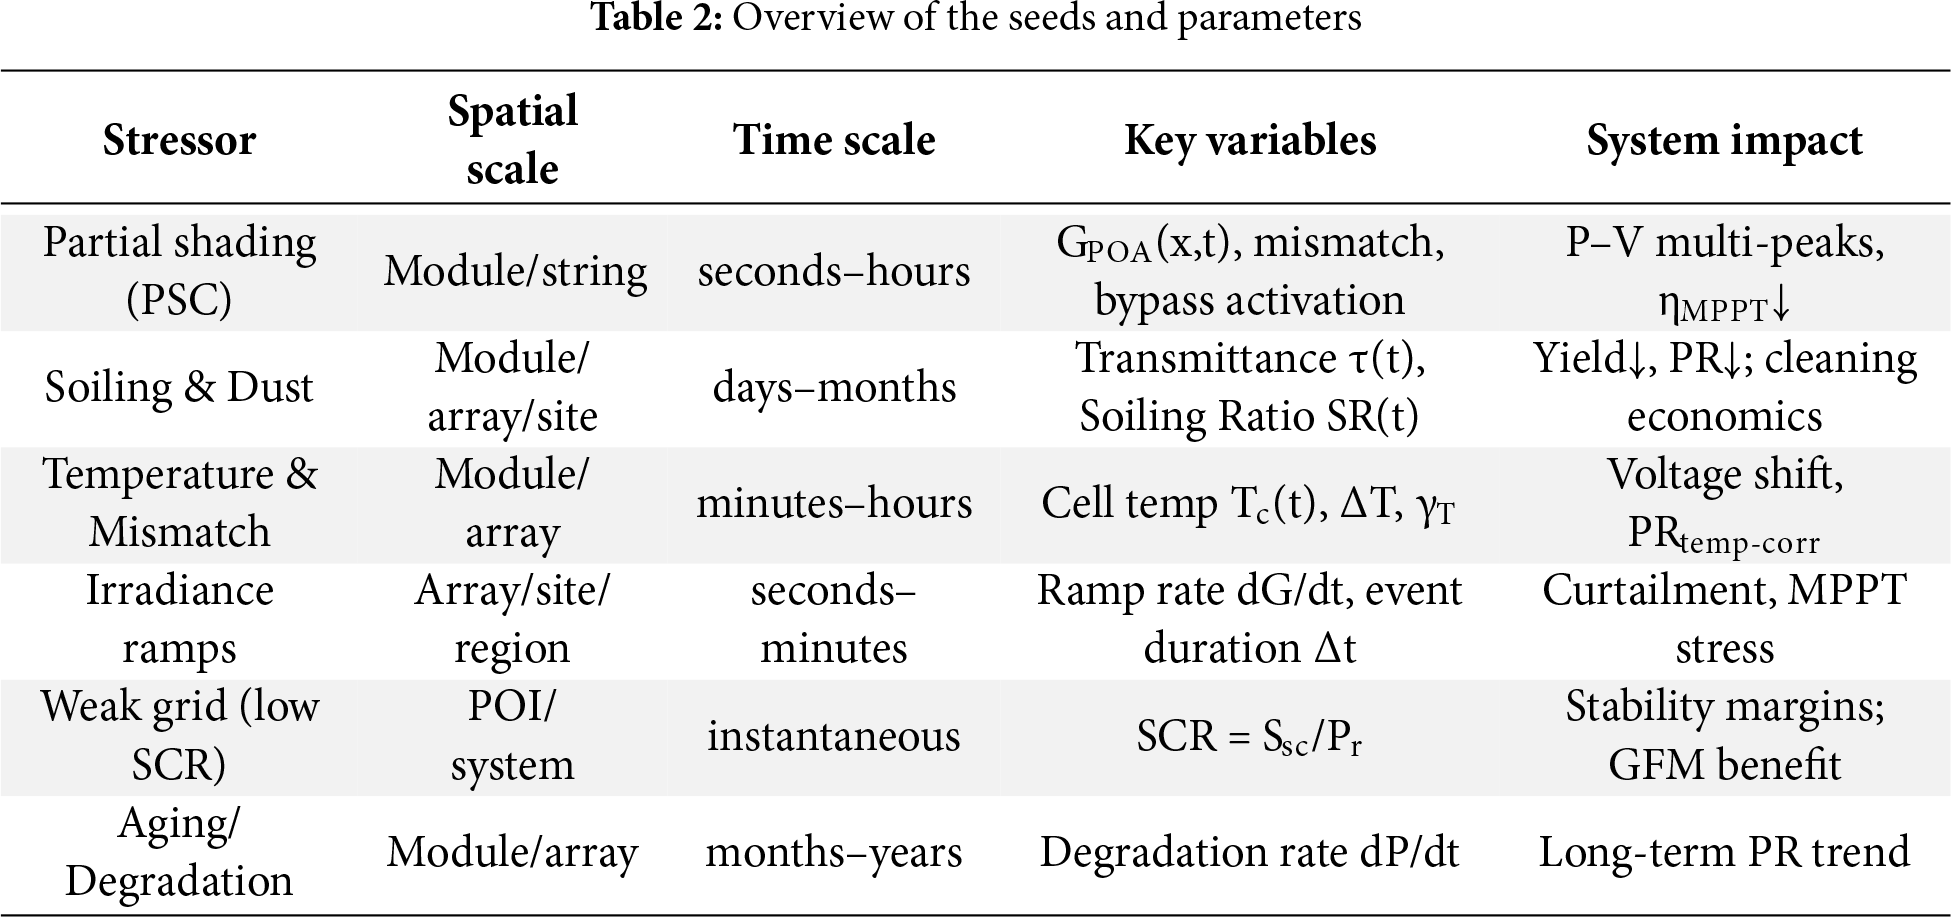
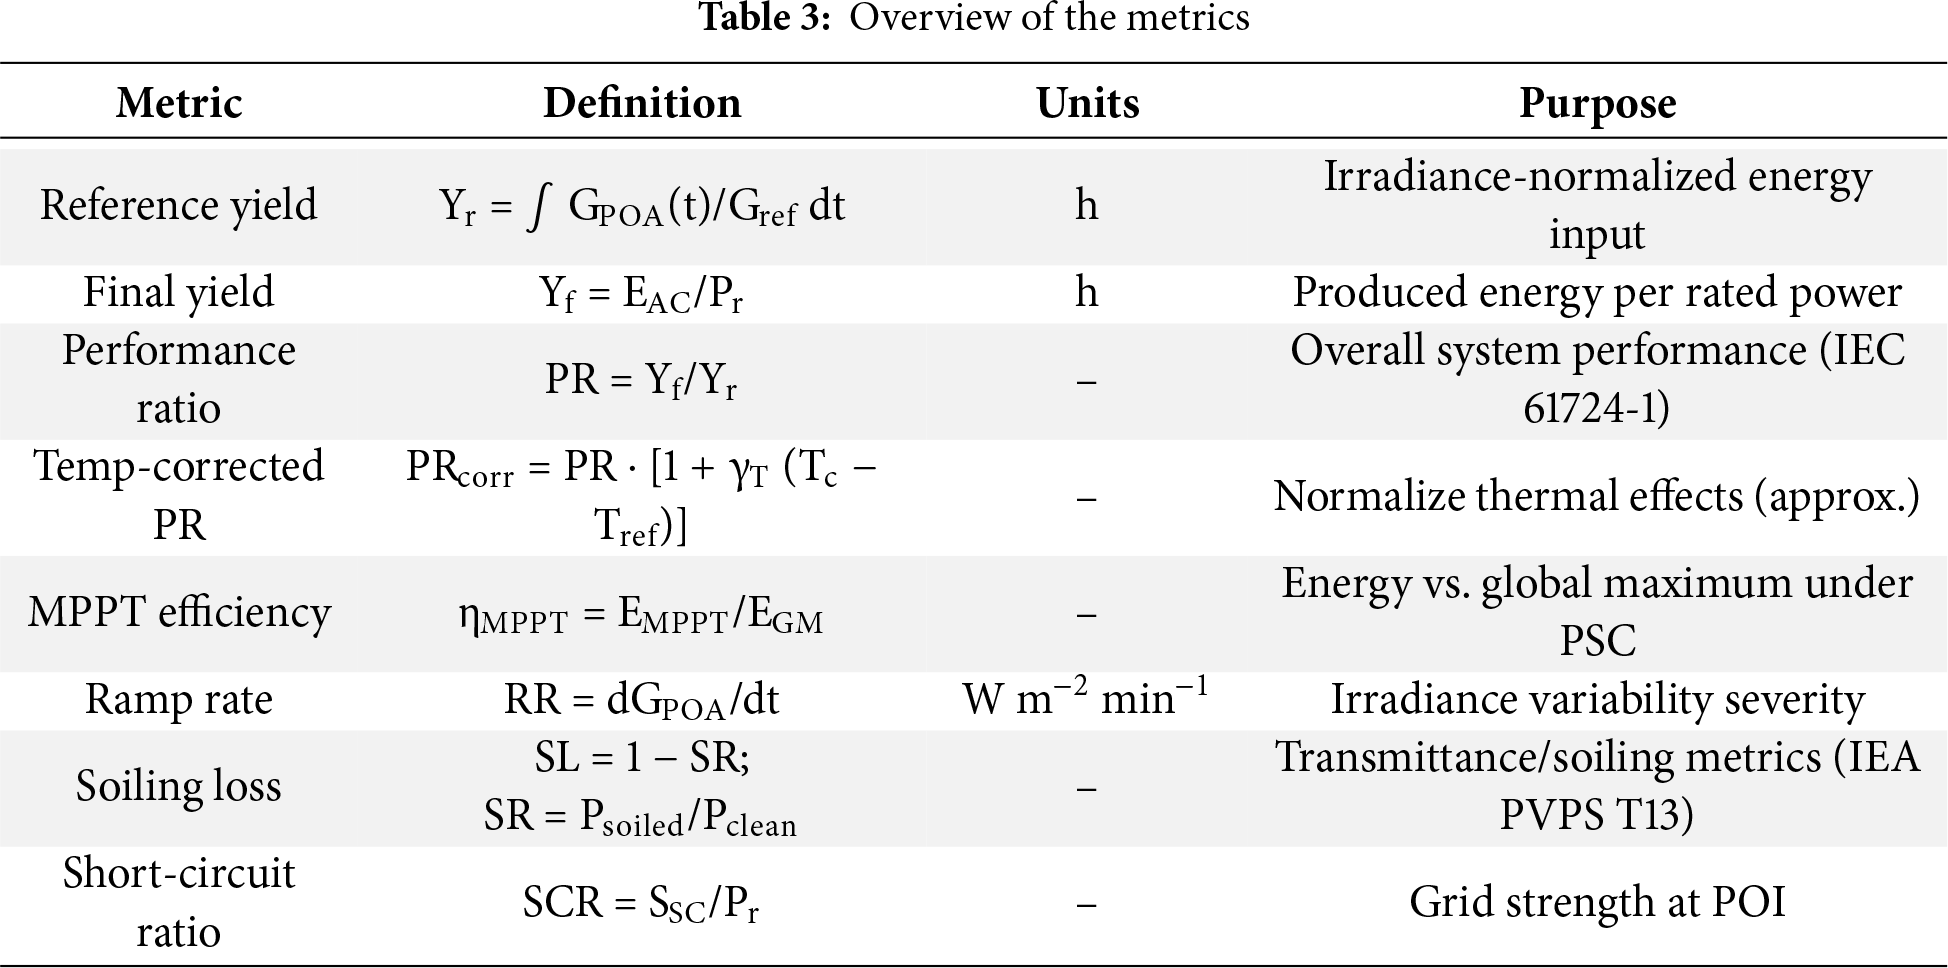
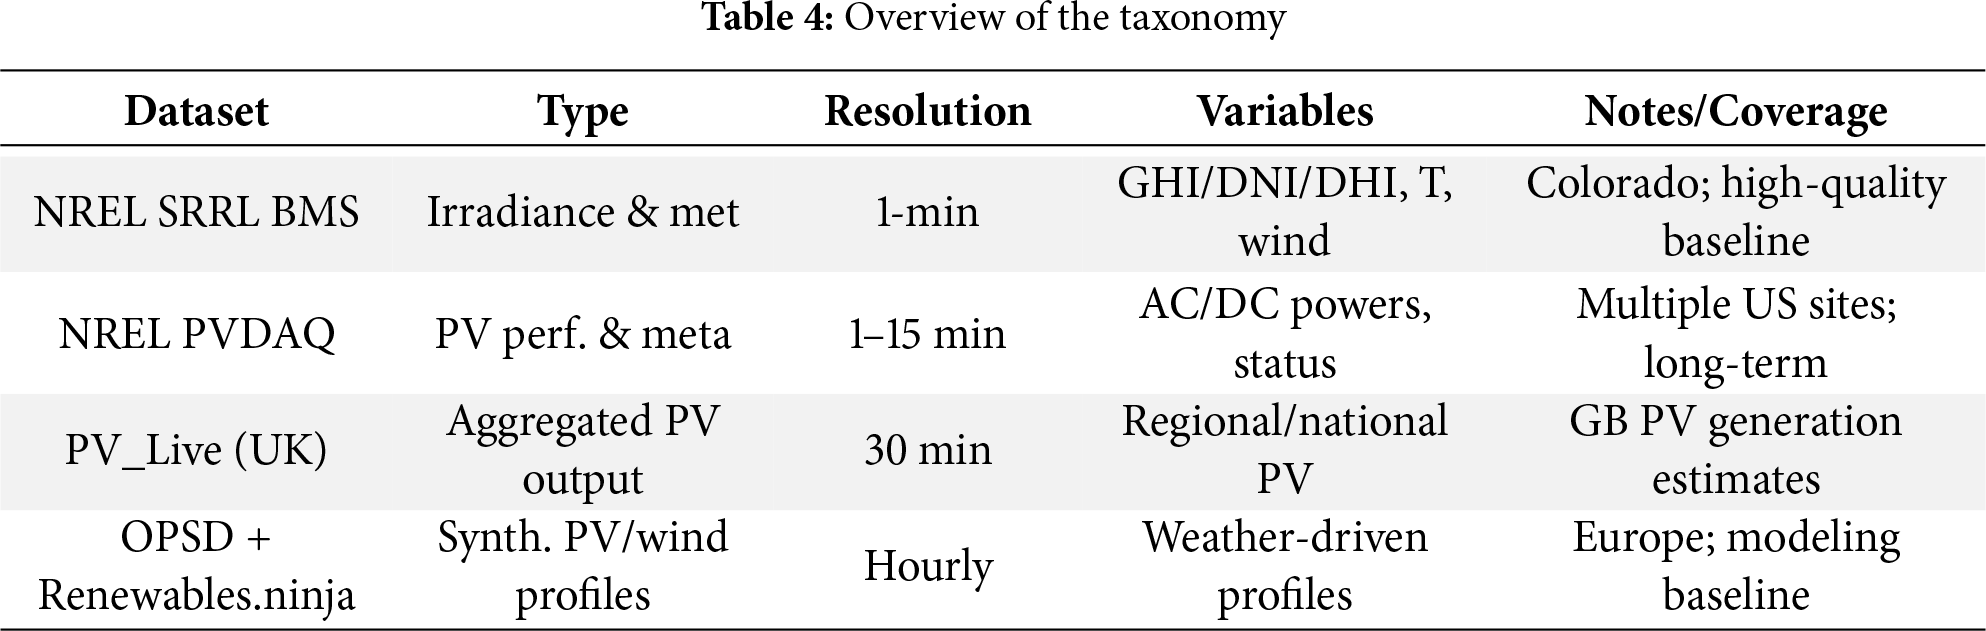
Fig. 3 contrasts a single-peak uniform-irradiance P–V curve with a multi-peak characteristic under partial shading to visualize why global search is required for MPPT under PSC.
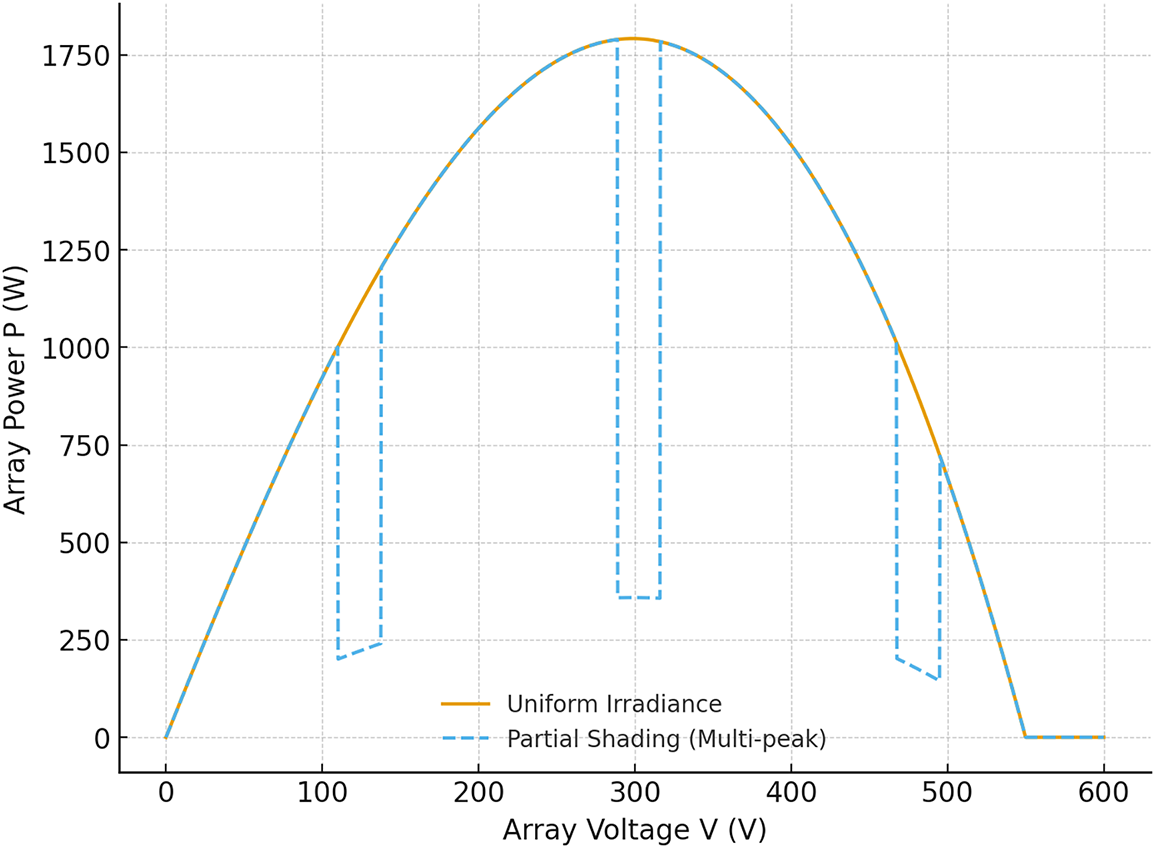
Figure 3: PV characteristics—uniform vs. partial shading
3 Intelligent Global MPPT under Partial Shading: Metaheuristics, Hybrids, and DRL; Parameterization for Non-Stationary PSC
Global MPPT seeks, in real time, the array-voltage or duty-cycle setpoint that maximizes power on a nonconvex, time-varying P − V landscape. Under partial shading, bypass-diode activation creates multiple local maxima, so the tracker must balance exploration of the search space with exploitation of promising regions while the GMPP drifts with irradiance and temperature [46–48]. In this review, intelligent MPPT is organized into three families—metaheuristics, hybrid heuristic–deterministic schemes, and deep-reinforcement-learning (DRL) agents—and we provide practical hyperparameter choices for rapidly varying, nonstationary PSC. Evaluation follows the standards in Section 2, reporting MPPT efficiency ηMPPT, convergence time, overshoot, and steady-state oscillation, with an emphasis on reproducibility across simulation, HIL, and field datasets.
Metaheuristic trackers pose voltage/duty selection as a population-based search over a bounded interval [0, Voc]. A canonical particle-swarm-optimization (PSO) update for particle i at iteration k is given below [49,50]:
with inertia ω, cognitive/social gains c1, c2, and personal/global bests pi⋆, g⋆. Differential evolution (DE) uses mutation–crossover–selection, e.g.,
Modern swarm optimizers, such as grey-wolf encircling with leader hierarchies and firefly attractiveness updates, have been modified to function effectively with GMPPT under conditions of annealed step sizes, enforced hard position/velocity boundaries, and restart strategies that avert stagnation. In these situations, customized or hybridized metaheuristics generally get to the GMPP in fewer iterations and with a greater success rate over a variety of PSC masks than baseline swarms, as long as the parameters are set up correctly [51,52]. Hybrid MPPT employs a phased logic that integrates a swift local routine at the P − V knee with a global search and a low-oscillation finisher. The process starts with a quick scan or an InC/P&O stage. If unimodality tests do not work, the controller goes on to PSO/DE. A bounded-step deterministic finisher terminates any residual oscillation as the setpoint grows nearby. The new designs for 2024–2025—P&O + PSO, InC with enhanced PSO, and voltage-slope-guided global scans—show that the response is substantially faster during irradiance ramps and that the MPPT is higher under PSC than either component alone, while keeping the control loop small enough for cheap microcontrollers [53–55]. DRL-based trackers cast GMPPT as a Markov decision process with state st = [Vt, It,
Recent DQN/PPO/DDPG variations exhibit robust tracking in response to sudden PSC changes and less steady-state oscillation when reward shaping penalizes chattering, while curricula randomize PSC patterns throughout training. Reported improvements are highly contingent upon the design of observations, the granularity of actions, and the safety constraints included during deployment. DRL agents gain from a supervised warm-start on labeled scans and from fallback logic when rewards diminish, thus maintaining stability in edge scenarios [56,57].
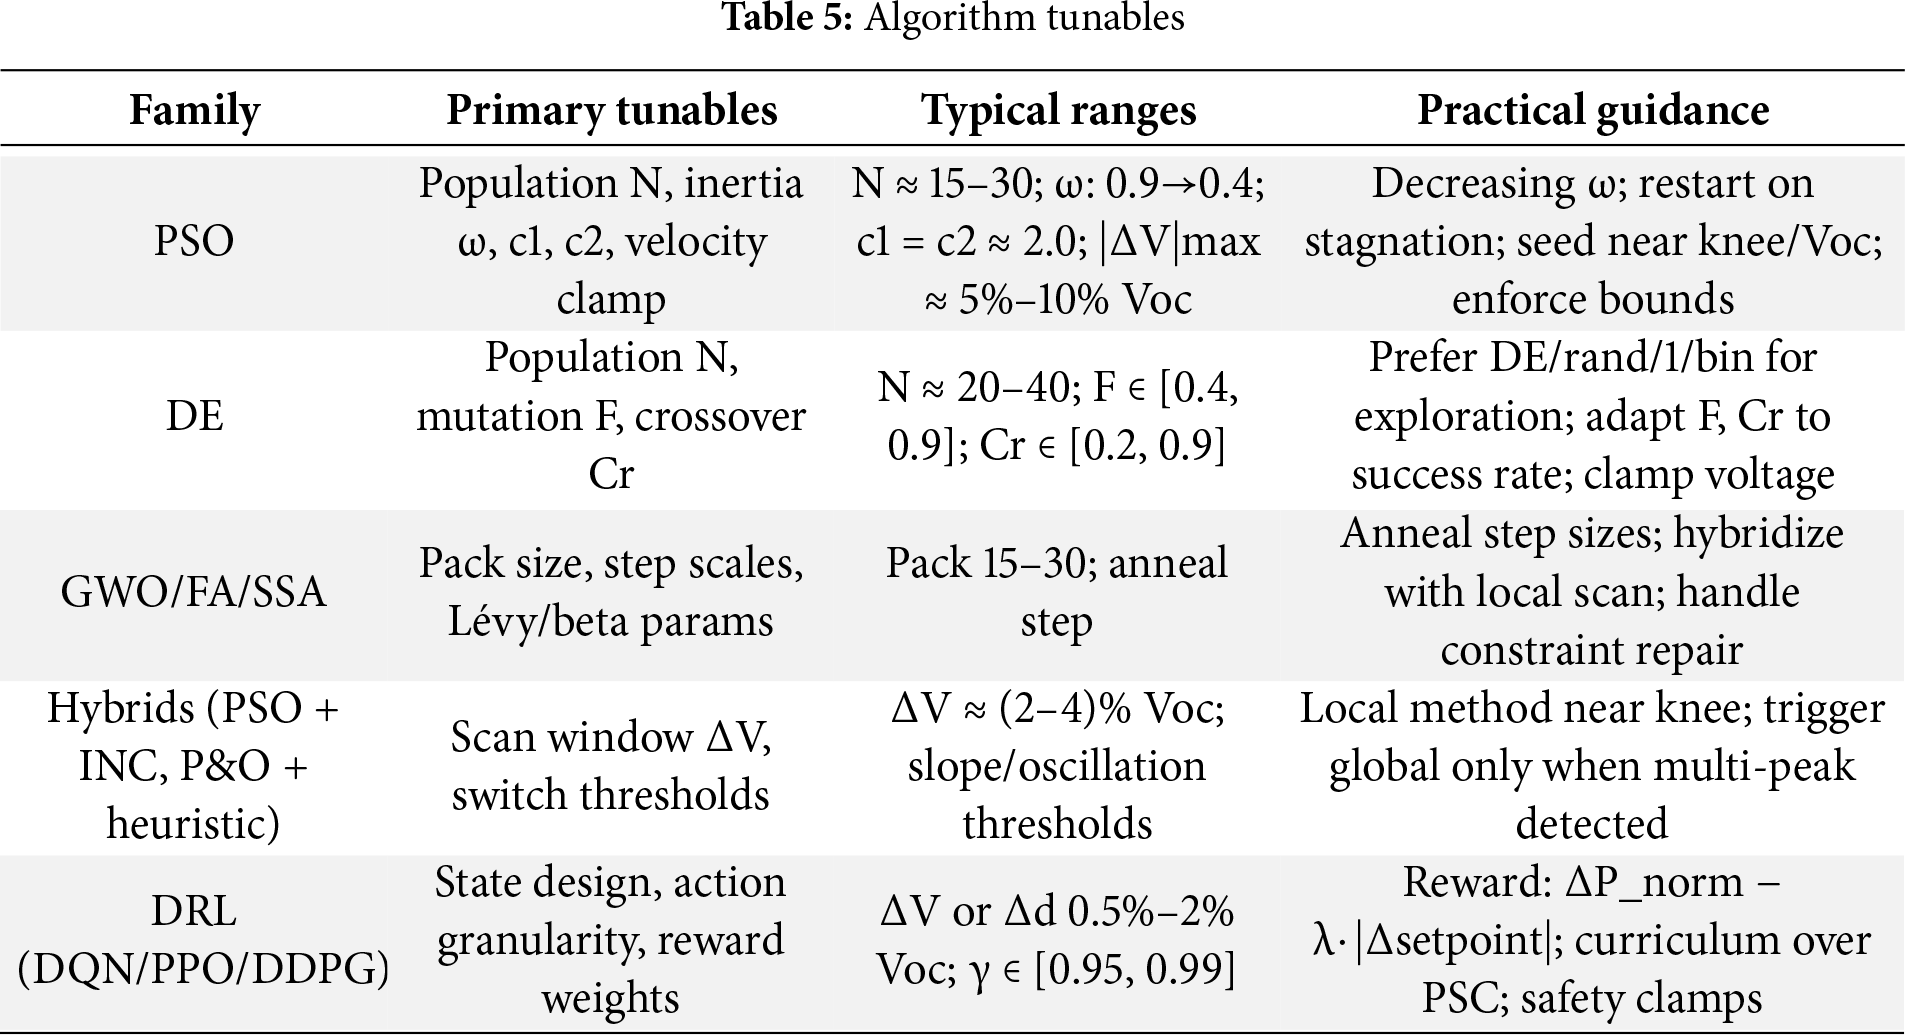
For non-stationary PSC, parameterization uses a “broad-then-narrow” approach that matches exploration to the predicted number of local maxima and then narrows around the moving GMPP [58]. For PSO-like approaches, we suggest a population of about 15 to 30 candidates, with an inertia schedule that goes from ω:0.9 to 0.4, symmetric gains of c1 ≈ c2 ≈ 2, and a velocity clamp of 5 to 10 percent of Voc. Restarts happen when the normalized improvement falls below a tiny threshold across a sliding window. In practical conditions for DE, N is between 20 and 40, the mutation factor F is between 0.4 and 0.9, and the crossover Cr is between 0.2 and 0.9. F and Cr are updated adaptively based on how well the last selection went. For hybrid controllers, a scan window of 2% to 4% of Voc around the current knee reduces oscillations after hand-off. For DRL, action increments of 0.5%–2% of Voc stabilize learning; discount factors γ ∈ [0.95, 0.99] balance short-term gains against smoothness; and observation filtering avoids noisy gradient estimations. These ranges are in line with the parameter sweeps seen in recent reviews and experimental studies. They should be retuned based on the site’s ramp statistics and converter dynamics [59,60].
To ground the discussion, Fig. 4 overlays exemplar tracking paths on a multi-peak P − V curve: a local P&O trajectory stabilizes at a non-global peak, while PSO and DRL paths converge to the GMPP. Fig. 5 plots normalized power error to the GMPP on a logarithmic scale and illustrates the characteristic exponential-like decay of global methods relative to a slow or stalled deterministic search. Fig. 6 models non-stationary PSC by moving the GMPP over time and shows a responsive tracker setpoint closely following the drift with small lag, a proxy for good dynamic performance during passing clouds.
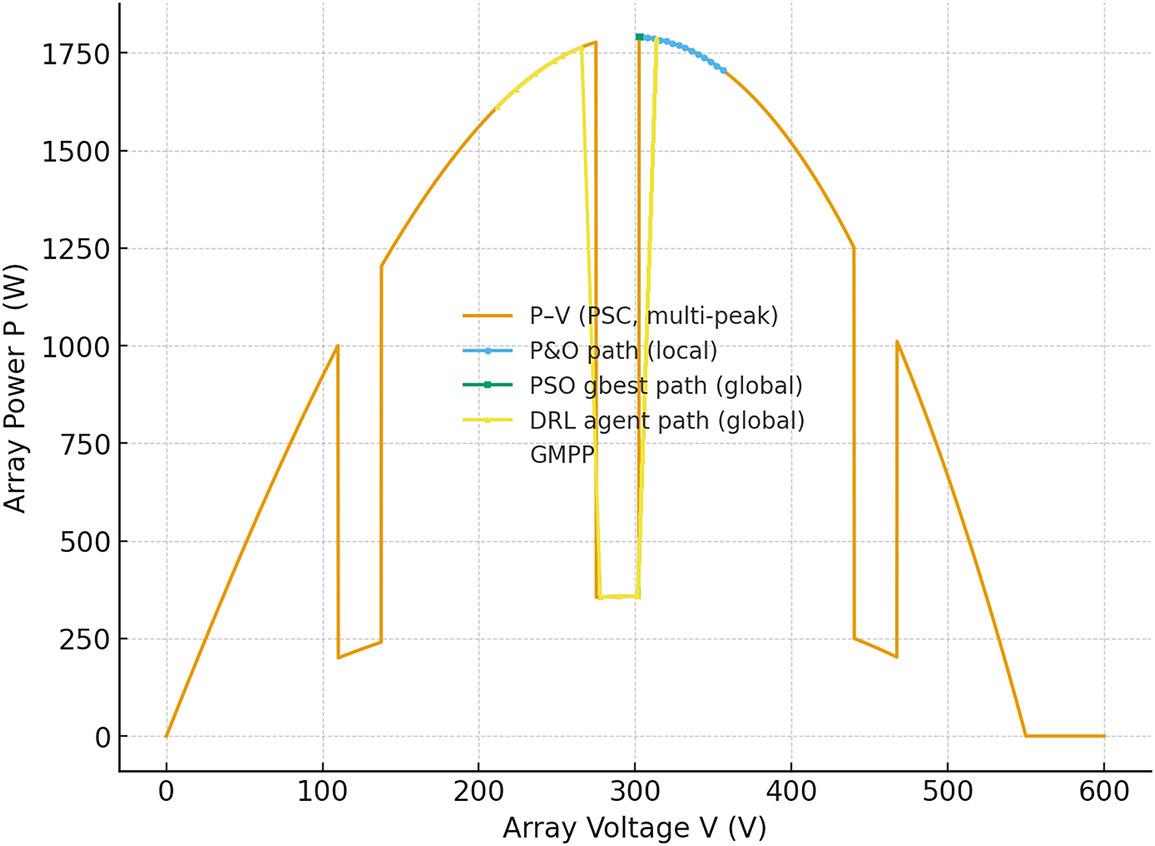
Figure 4: Example tracking trajectories on a Multi-Peak PV Curve
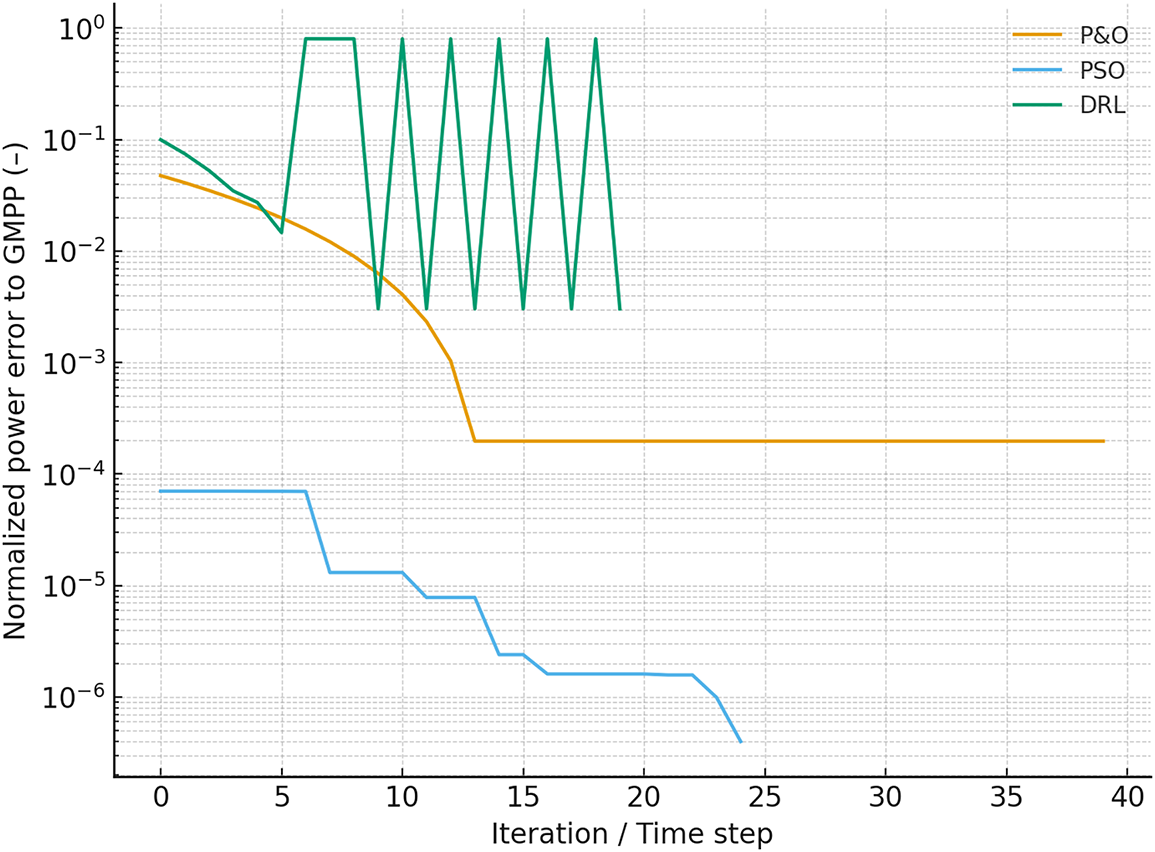
Figure 5: Convergence to GMPP (log scale)
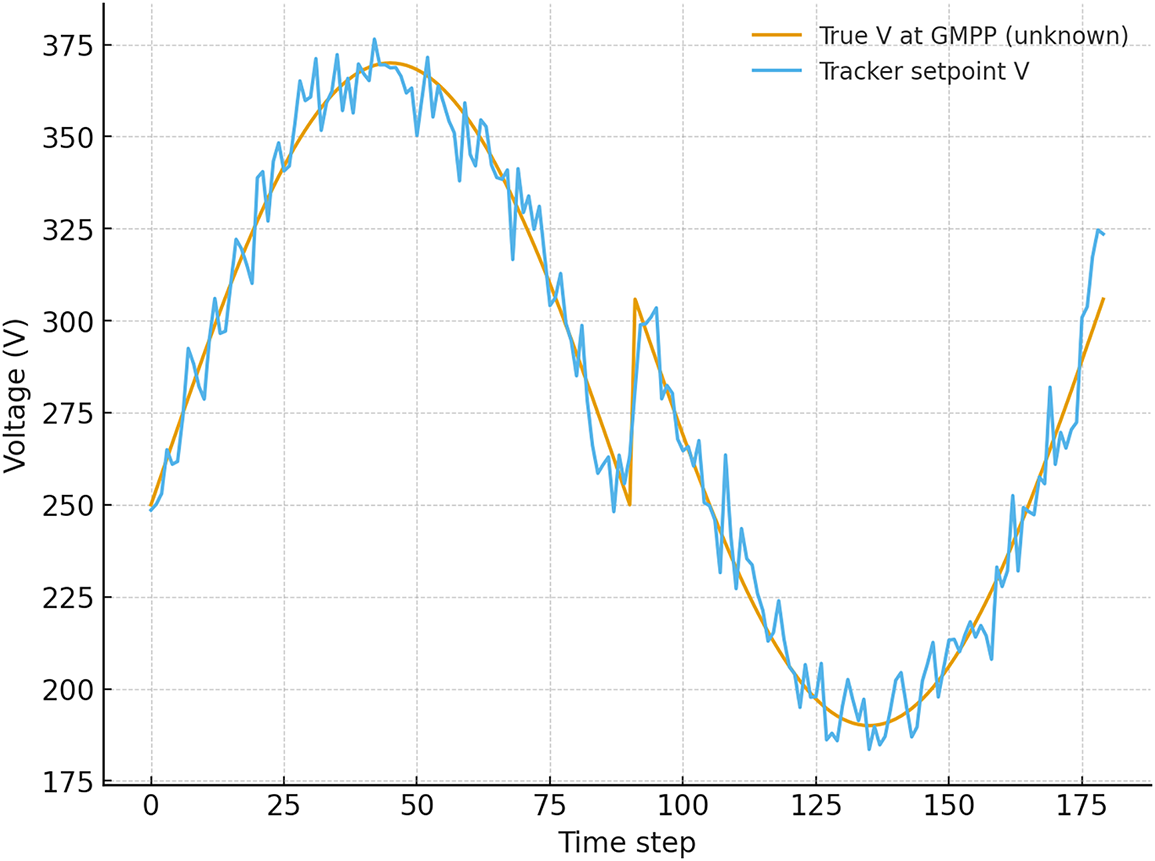
Figure 6: Non-stationary PSC-moving GMPP and tracker response
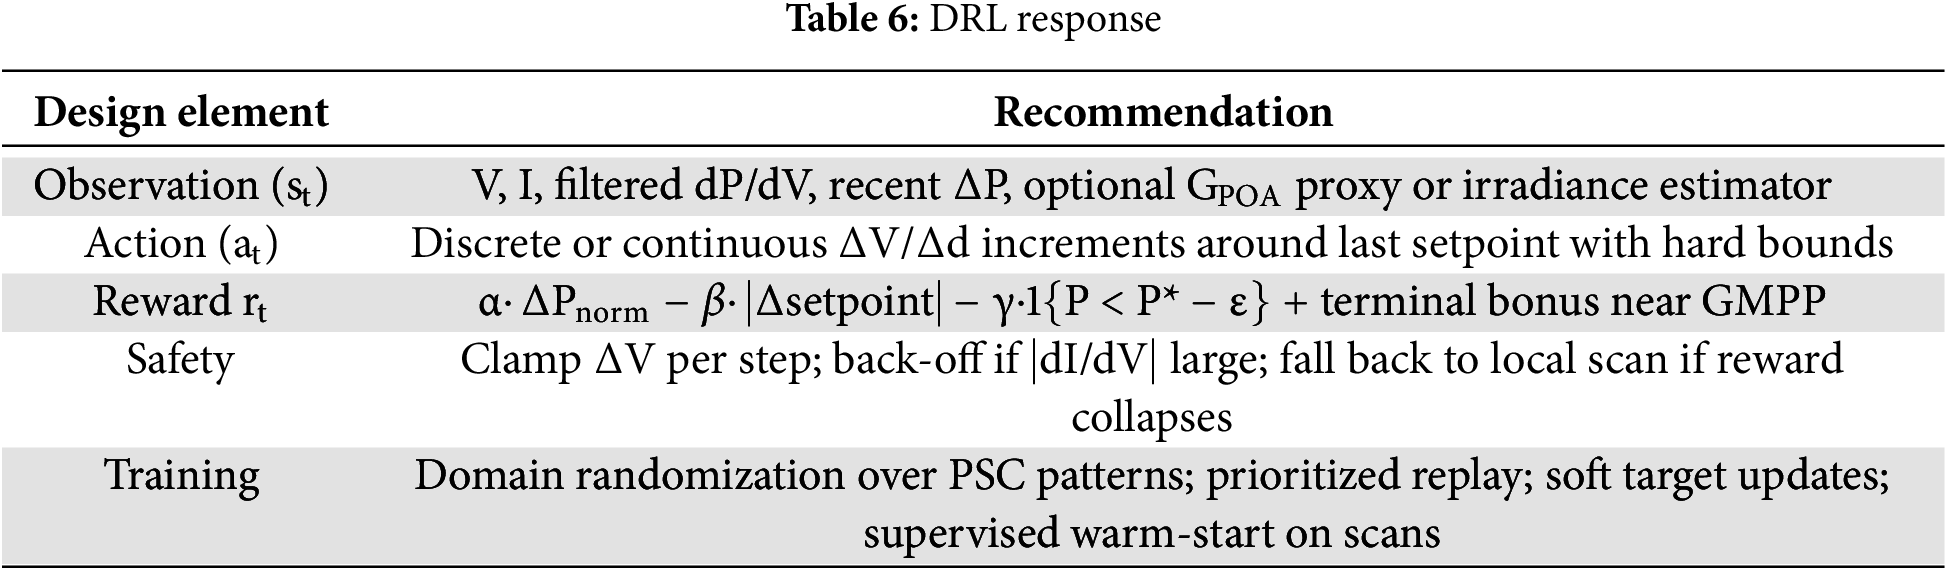
To make things easier, we put tunables and design patterns into two small tables that are aimed to simplify reporting and speed up reproduction. Table 5 lists the main hyperparameters for PSO, DE, GWO/FA-style swarms, hybrid rule sets, and DRL agents. It also includes useful ranges and controller-friendly methods like inertia annealing, success-rate adaptation, and bounded increments. Table 6 lists the DRL observation vectors, action spaces, and reward terms that have been shown to reduce chattering and make the system more stable during quick PSC transients. For deployment, safety clamps on voltage steps and back-offs on big ∣dI/dV∣ are stressed. These design suggestions are based on the converter’s bandwidth, the site’s ramp-rate percentiles, and the level of detail allowed for setpoint adjustments. They are then tested step by step from simulation to HIL to field pilots using the metrics from Section 2.
Recent research bolsters confidence in the aforementioned suggestions. Recent studies show that global and hybrid MPPT work better under PSC [61–63]. They also stress the importance of choosing the right parameters to avoid convergence too soon. New hybrid approaches that mix P&O or InC with better PSO versions say that the dynamics are faster and the ηMPPT is greater when the shading varies quickly. Also, DRL studies from 2024 say that reward shaping and curriculum training under random PSC patterns make agents that can generalize outside the training set. The IEA PVPS Task 13 report on shaded generators also calls for standardized conditions and clear performance reporting. This part makes that happen by using the figures, equations, and tables that are included.
Under severe or non-stationary partial shading, global and hybrid trackers reliably achieve near-unity ηMPPT and shorter t95 than local rules, while a bounded-step finisher caps residual oscillation; under mild PSC, a well-tuned local method remains competitive. Hybrids that pair a fast local routine with PSO/DE cut time-to-capture relative to pure global search yet preserve the low post-handoff oscillation. Learning-aided trackers (DRL) inherit the global-search advantage and, with reward and step shaping, yield the lowest steady-state oscillation at the setpoint. Failure modes differ—stagnation for metaheuristics and reward collapse for DRL—but are mitigated by restart policies, hard bounds, and explicit fallbacks to a stable local controller. Results are expressed on the common metric set (ηMPPT, t95, steady oscillation/THD); quantitative ranges are consolidated in the Section 5 co-design summary.
4 Advanced Inverter Control for Weak-Grid Stability: Grid-Forming Strategies, PLL Design, and Ride-through Behaviors under IEEE 1547
Advanced control for grid-connected photovoltaic inverters is moving away from classical grid-following (GFL) synchronization and toward grid-forming (GFM) paradigms that are meant to set and control local voltage and frequency, share power reliably, and stay stable in low-short-circuit-ratio (SCR) systems [64,65]. When GFM is activated, the inverter makes an internal voltage reference and interacts with the network using droop-like and virtual-machine dynamics. The “virtual swing” and “droop” combo is a common analytical template:
and
All symbols are defined in Nomenclature.
Advanced control for grid-connected photovoltaic inverters is moving away from classical grid-following (GFL) synchronization and toward grid-forming (GFM) paradigms that are meant to set and control local voltage and frequency, share power reliably, and stay stable in low-short-circuit-ratio (SCR) systems. When GFM is turned on, the inverter establishes an internal voltage reference and uses droop-like and virtual-machine dynamics to talk to the network. The “virtual swing” and “droop” combination is a frequent way to analyze things:
where:
And: H(s) maps quadrature voltage to phase error; increasing kp, ki (bandwidth ωc) raises tracking speed but reduces robustness as SCR falls. Fig. 7 depicts the frequency response related to the GFL vs. GFM to a 1% disturbance.
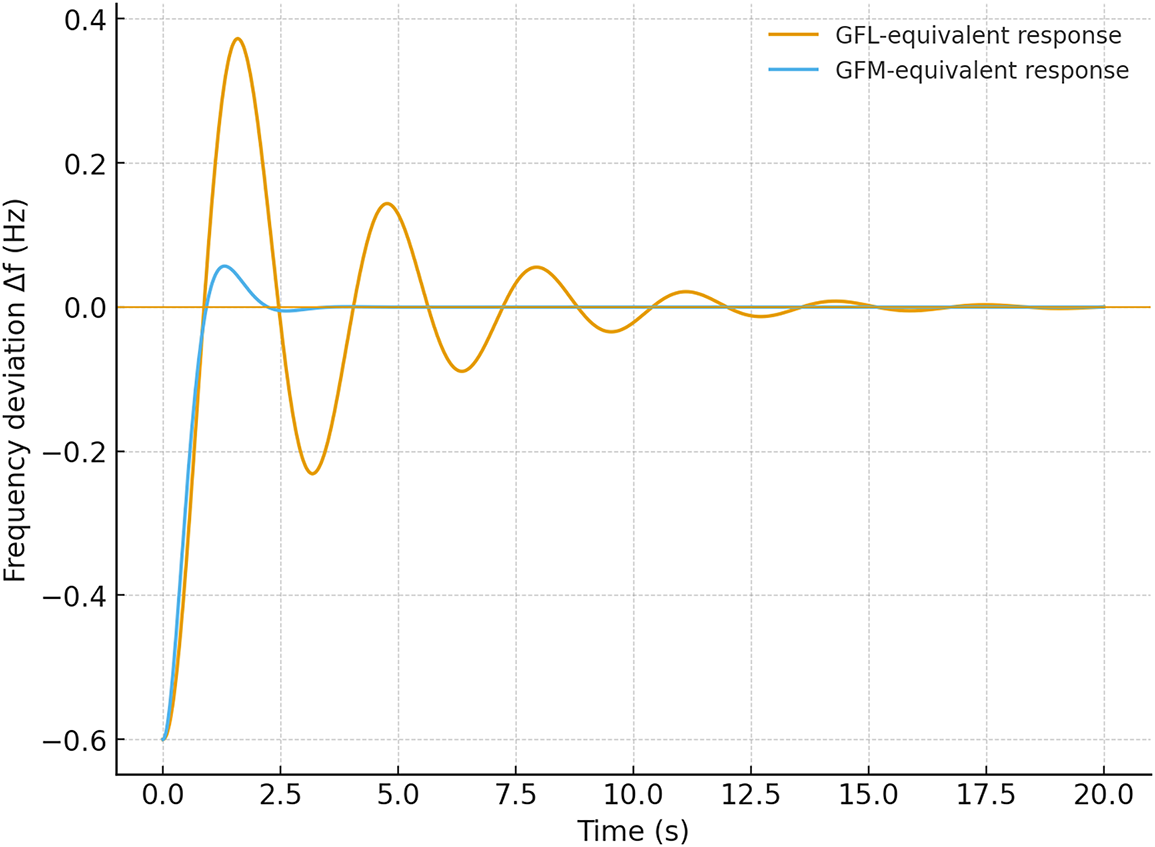
Figure 7: Frequency response: GFL vs. GFM to a 1% disturbance
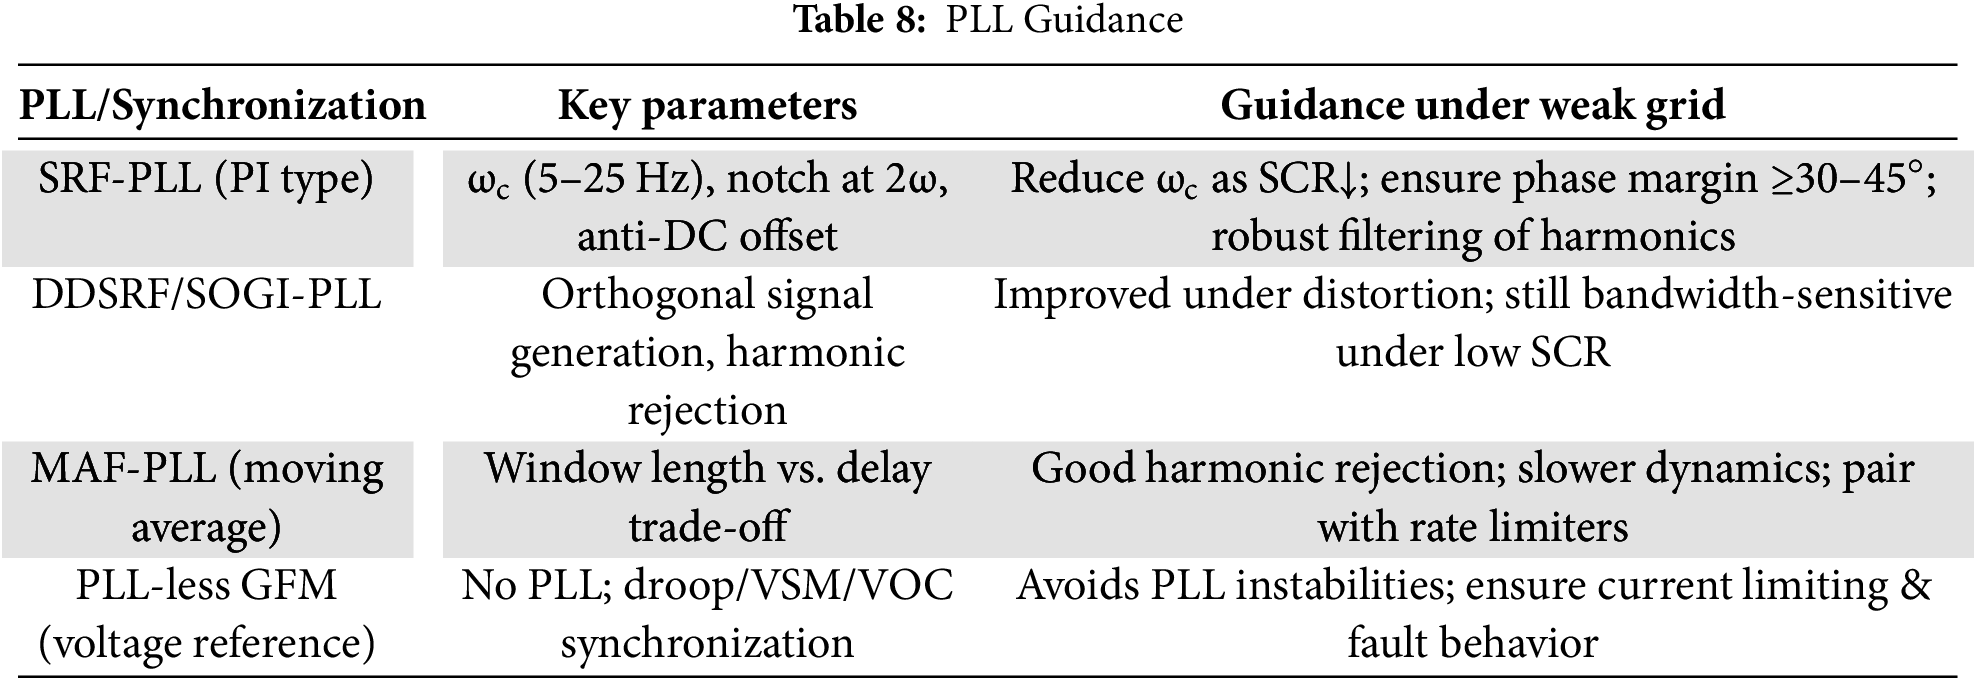
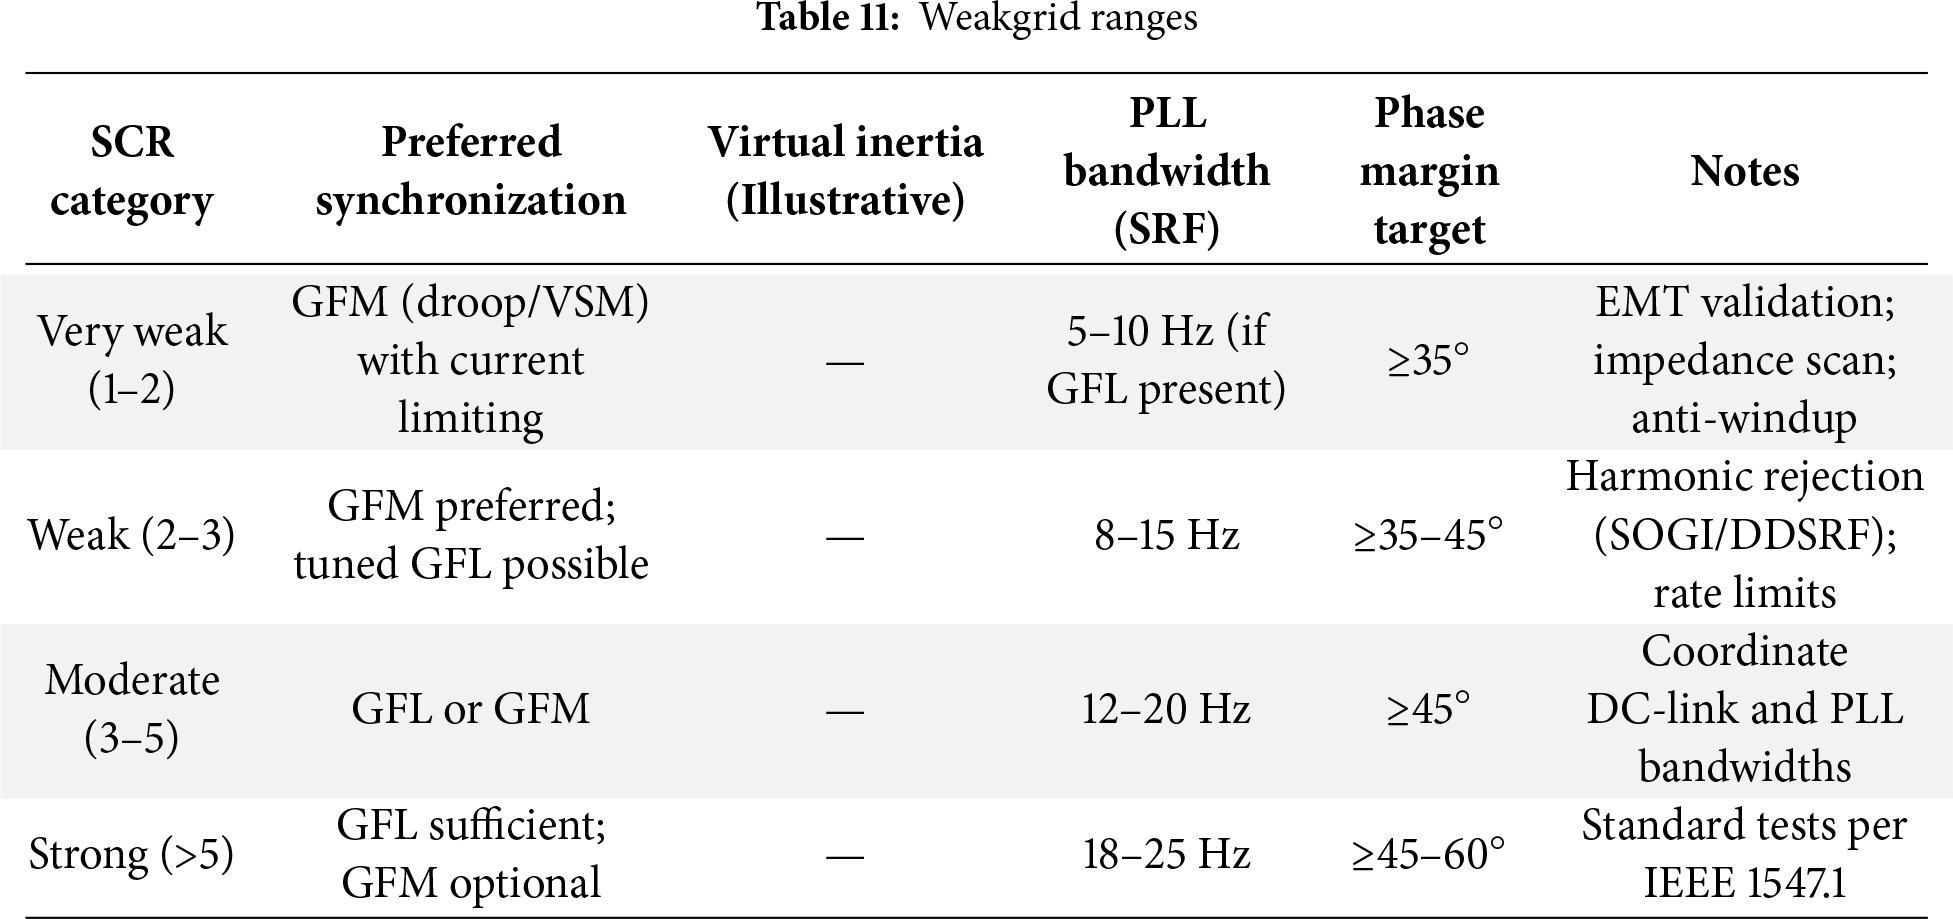
Useful tips for 50/60-Hz systems with harmonic rejection (SOGI/DDSRF, MAF) and clear rate limits, the target ωc is about 5 to 25 Hz. Many studies say that when SCR drops below about 3, the PLL bandwidth must drop and the damping must rise to keep a 30° to 45° phase margin, or that PLL-less GFM synchronization should be used. Figs. 8 and 9 show the general trend of recommended SRF-PLL bandwidth vs. SCR, together with a phase-margin curve that shows where the values should be set for a specific plant. Recent reviews and case studies delineate the instability sources and solutions for PLLs in weak grids, but NERC reliability standards warn that SCR-based screening is merely indicative and that plant-specific EMT validation is frequently necessary.
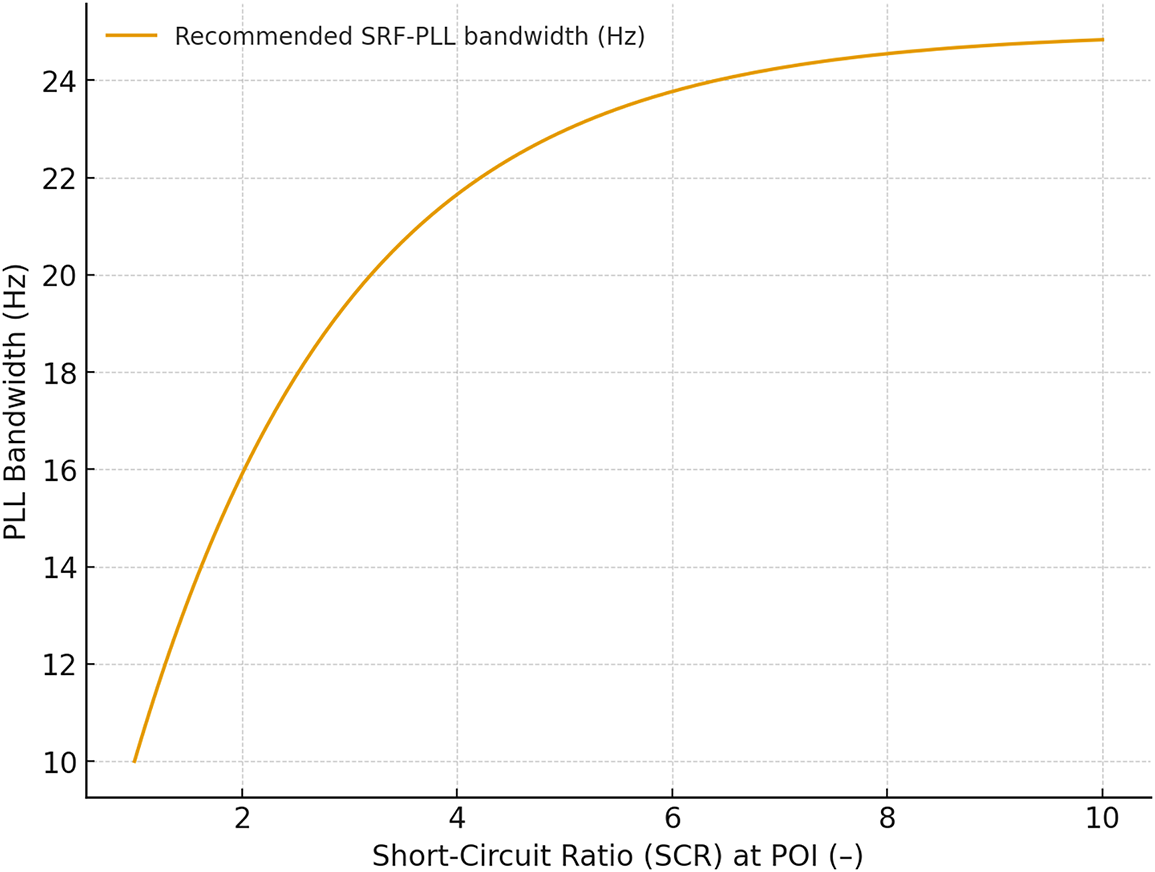
Figure 8: PLL guidance vs. Grid Strength
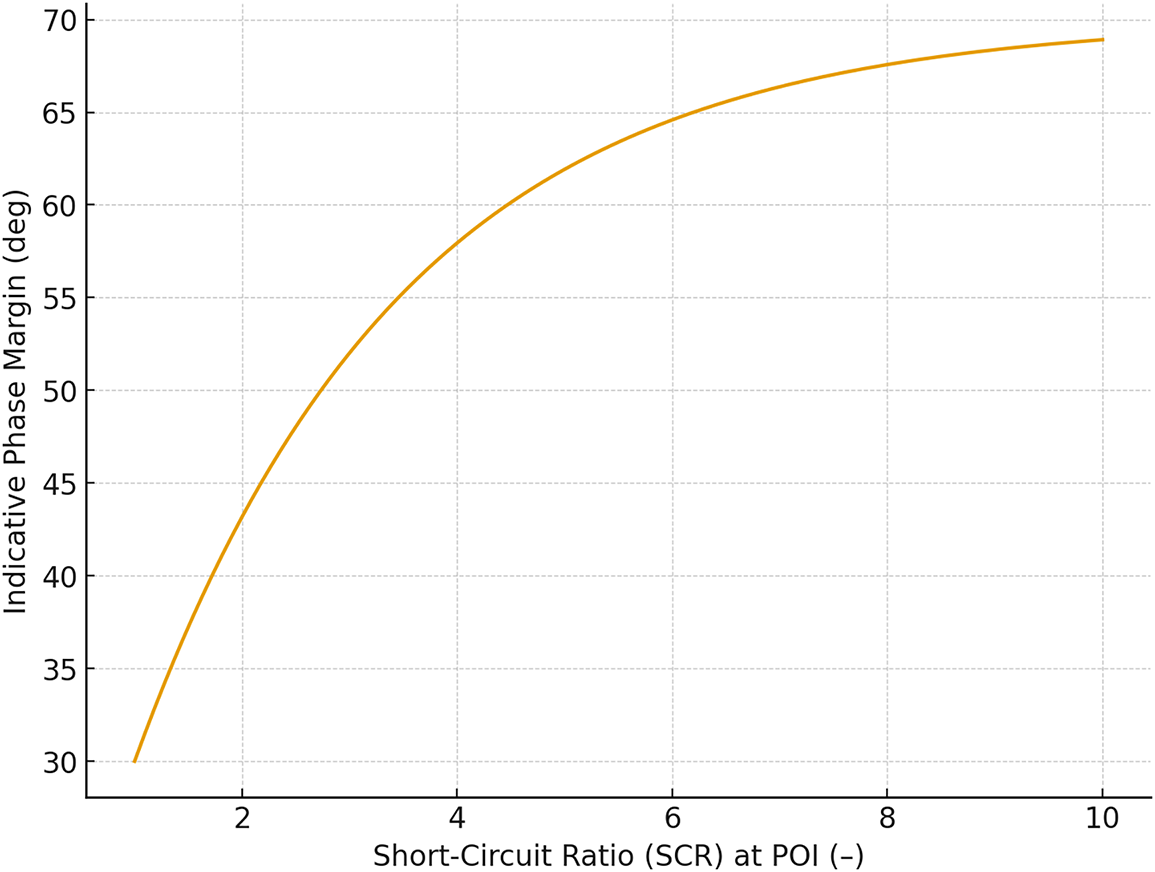
Figure 9: Indicative phase margin vs. SCR
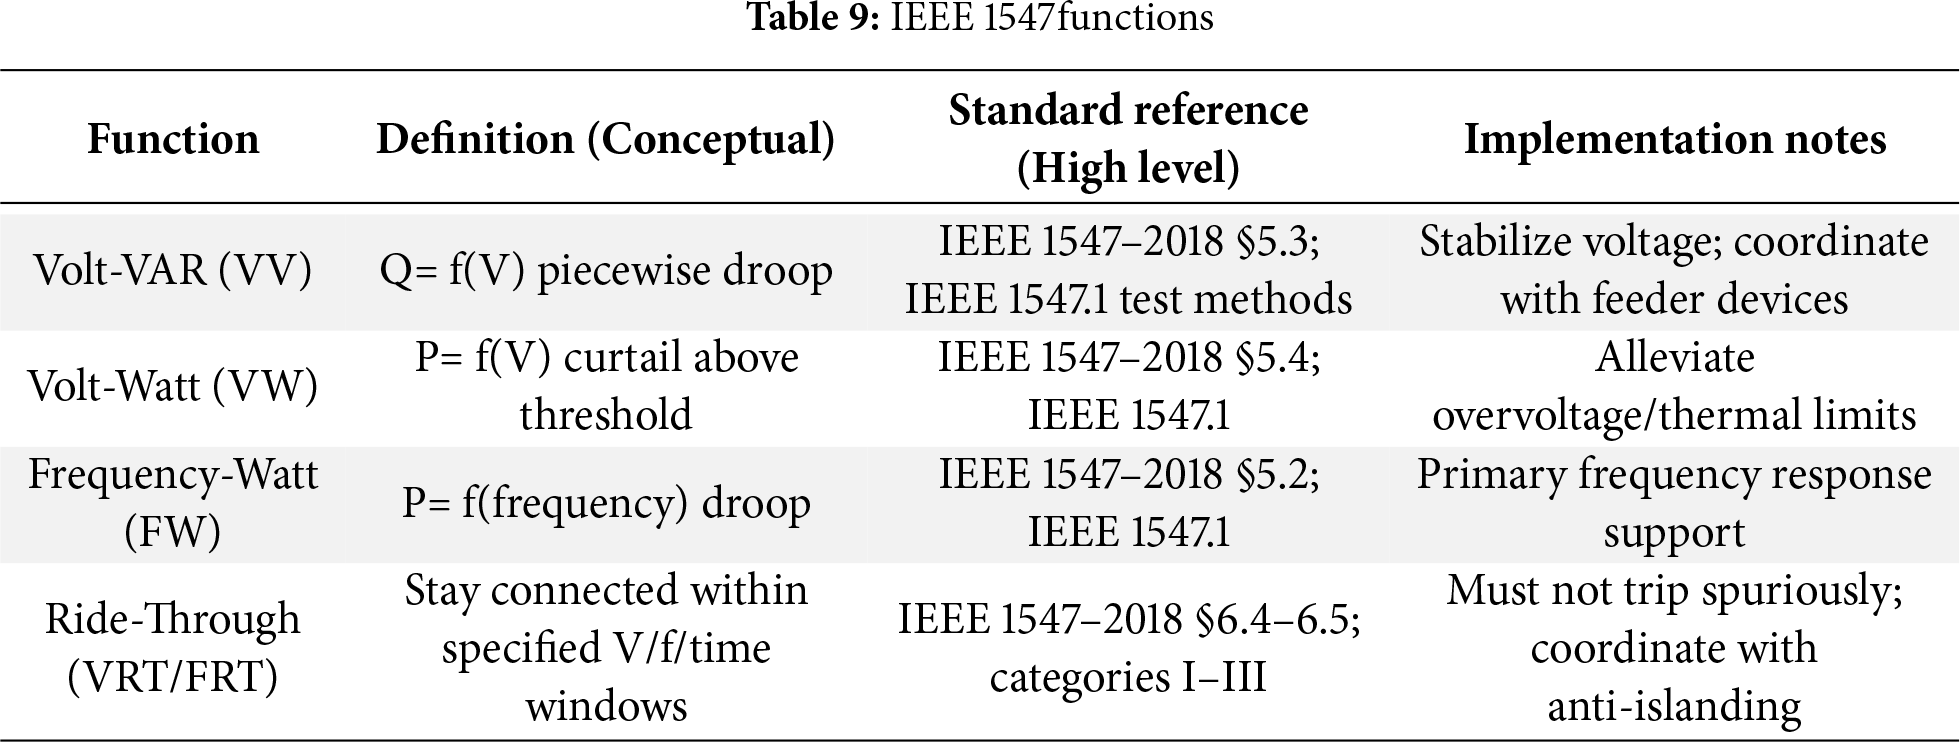
IEEE Std 1547-2018 requires ride-through behaviors, grid-support functions, and test methodologies for distributed energy resources, and IEEE 1547.1 checks that they are working. At a high level, DER must stay connected within certain ranges of aberrant voltage and frequency (Categories I–III) and give volt-var, volt-watt, and frequency-watt replies with set response times, precision, and compatibility. A common frequency-support law is defined in Eq. (22):
with deadbands and saturations set by utility requirements; similarly, volt-var uses a piecewise droop Q⋆ = f(V) to support local voltage. Fig. 10 sketches a conceptual voltage ride-through envelope and an example disturbance trajectory to illustrate reporting; readers should consult the standard or utility settings for exact thresholds and durations. Public overviews and utility setting sheets summarize these requirements and emphasize coordination with anti-islanding and protection; laboratory methods for verifying commercial inverter compliance to the new voltage/frequency/ROCOF ride-through requirements have been demonstrated and codified [66].
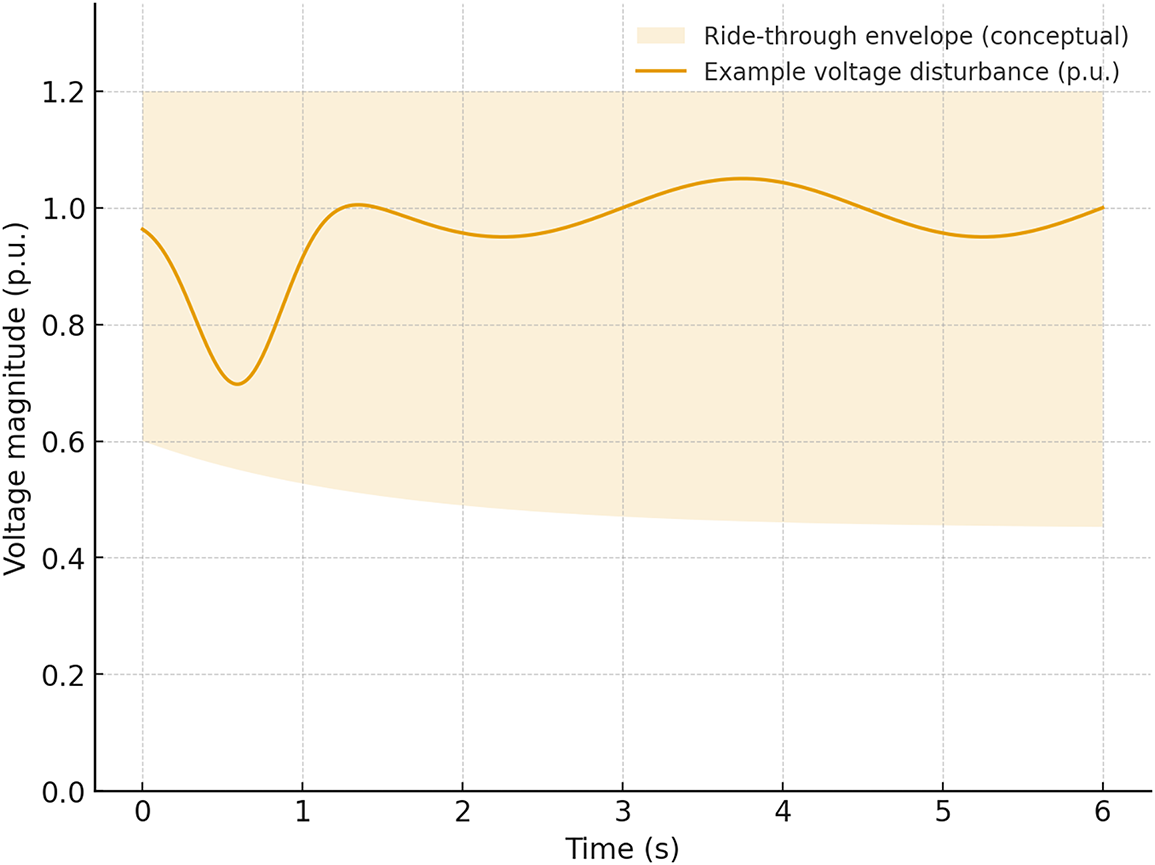
Figure 10: Conceptual voltage ride through envelope
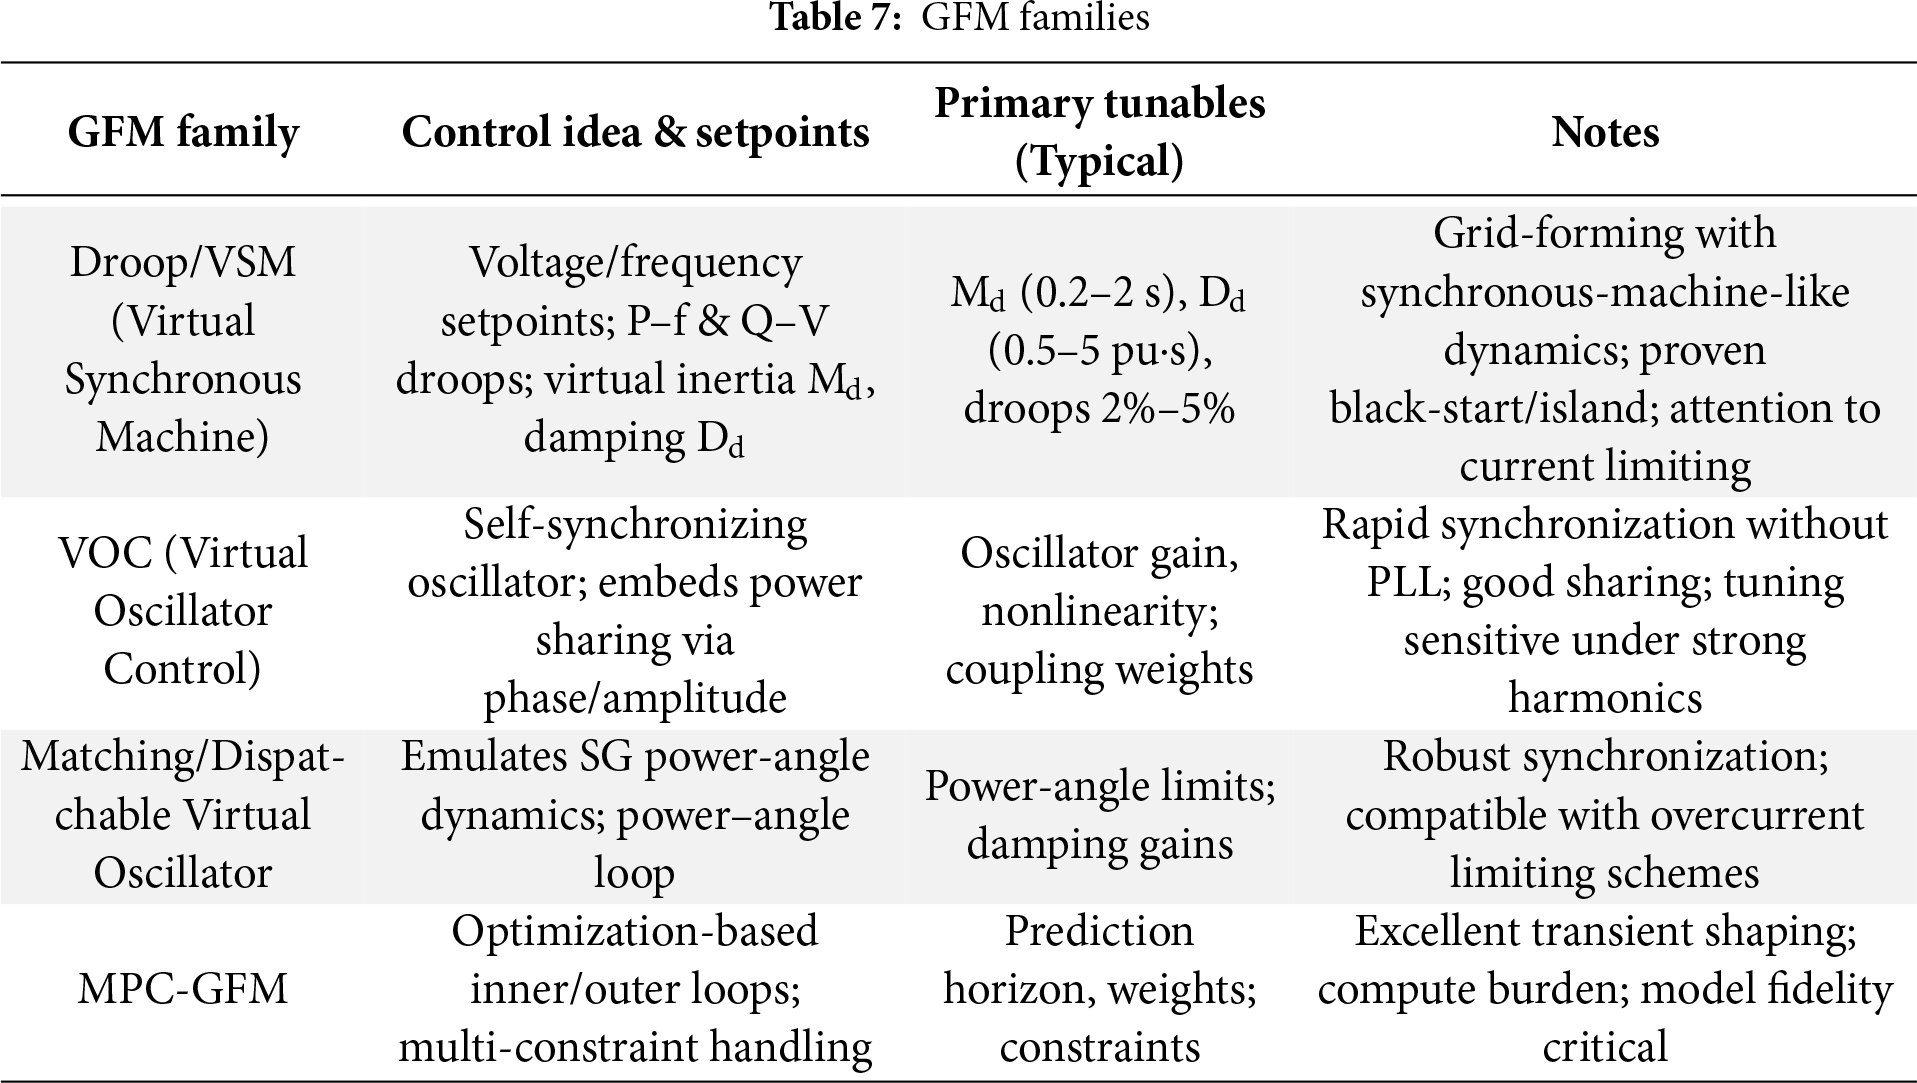
When having a look at all the weak-grid evidence, it is obvious to make remarks on unmistakable patterns. Grid-forming (GFM) controllers, including droop/virtual-synchronous-machine (VSM) and oscillator-based types, can keep voltage and frequency stable in very weak systems when current-limiting is clear. This can be done by shaping virtual impedance, saturating inner-loop current references, or limiting angle during sags, all of which stop wind-up and overcurrent. In contrast, PLL design is the most important factor for grid-following (GFL) robustness. Lowering PLL bandwidth, adding notch or moving-average (MAF) filtering, and coordinating PLL/DC-link/current-loop bandwidths makes the system more stable but slows down response. At low SCR, it is often better to use PLL-less GFM synchronization in the outer loop with carefully managed fault behavior. It is very important to be strict when modeling and testing. NERC suggests EMT screening where multi-infeed IBR interactions, very low SCR, or protection/ride-through conflicts are possible. ESIG/NREL stress impedance scanning and multi-vendor interoperability testing. Field studies and islanding events, including evaluations of high-IBR disturbances, demonstrate that well-tuned GFM assets can significantly enhance frequency and voltage security, but performance remains susceptible to parameterization and the limitations outlined in system-strength studies. To put these ideas into action, we offer a short comparison of GFM families—droop/VSM, virtual-oscillator control, matching-based control, and MPC-GFM—focusing on their control goals, typical setpoints, main tunables, and implementation notes; a PLL design guide that compares SRF-, SOGI/DDSRF-, and MAF-PLL options with weak-grid guidance; and a high-level IEEE 1547 mapping that connects volt–var, volt–watt, frequency–watt, and ride-through functions to the right standard clauses and 1547.1 verification procedures (Tables 7–9).
The below Algorithm 1 codifies the paper’s taxonomy and weak-grid guidance into an implementable selector; leverages the co-design perspective that links MPPT choice to synchronization mode.
As the short-circuit ratio (SCR) goes down, grid-forming (GFM) controllers like droop/VSM or oscillator-based ones with explicit current limiting (like virtual-impedance shaping, current-reference saturation, and angle limiting) have a higher voltage-recovery index (VRI) and ride-through robustness than even carefully tuned grid-following (GFL) schemes. GFL is still possible, but only with a conservatively lowered PLL bandwidth, harmonic-rejection filtering (SOGI/MAF/notches), and tight synchronization of the bandwidths of the PLL, current loop, and DC connection. Its stability margin gets smaller as the SCR goes down. Interoperability and acceptability depend on putting IEEE 1547 grid-support functions into action and showing 1547.1 ride-through. Results should be presented using the Section 2 KPIs (ηmppt, t95, VRI, THD) and clear references to standards. Section 4 sees inverter control as a co-design problem that chooses GFM synchronization and droop dynamics—or a PLL-based alternative—sets current limits, and checks behavior against system strength using EMT and impedance-scan testing. The main point is that well-parameterized GFM makes weak grids more stable, while GFL can still work with conservative PLL tuning and better filtering, but it has less headroom as SCR goes down. A standards-aligned test and reporting plan that includes volt-var, volt-watt, frequency-watt responses, ride-through envelopes, and disturbance-response KPIs lets everyone compare apples to apples across vendors, sites, and studies.
5 Co-Design of Intelligent MPPT and Advanced Inverter Control; Quantitative Meta-Summary of Performance Ranges and Trade-Offs
We pose joint tuning of the tracker–grid interface as: maximize J(θ,ϕ) = w1 ηMPPT − w2 σP − w3 THD + w4 VRI − w5 t95 subject to: IEC 61724-1 measurement class & reporting; IEEE 1547/1547.1 ride-through & VV/VW/FW function tolerances; current/thermal limits; and scenario coverage across the seeded library S. Here θ collects MPPT tunables (e.g., PSO/DE populations or DRL action granularity), ϕ collects inverter tunables (droops mp, mq, virtual inertia/damping Mv, Dv; or PLL bandwidth ωc and filters if GFL). We solve on S (PSC/soiling/ramp/SCR cases) and report the full KPI set per Protocol 1. The above program lets us compare stacks (MPPT family + synchronization mode) on a common scenario library and KPI set (Section 2), turning survey claims into trade-offs observable in ηMPPT vs. t95, VRI vs. THD, and accept/reject thresholds.
This part combines the two ideas that were talked about earlier: global intelligent MPPT under partial shading and advanced inverter control for weak grids. It does this by creating a single co-design framework that aims to capture energy and make the grid more resilient at the same time. The acceptance criteria are based on IEC 61724-1 monitoring practice and IEEE 1547 interoperability requirements [67,68]. We consider the tracker and the grid interface as interconnected decision variables: θ gathers MPPT hyperparameters (such as PSO/DE swarm settings, hybrid switch thresholds, DRL action granularity, and reward weights), while ϕ gathers inverter-side parameters (including droop slopes mp, mq, virtual inertia/damping Mv, Dv, current-limiting gains, or if grid-following is maintained, PLL bandwidth ωc and filtering). We provide a standards-aware multiobjective program over a library S of complex-condition scenarios, including partial-shading patterns, irradiance ramps, soiling states, and short-circuit-ratio (SCR) levels [69,70]:
where ηMPPT measures energy relative to the global maximum under PSC, t95 is convergence time to 95% of GMPP after a disturbance, σP indexes steady oscillations at the operating point, VRI denotes a voltage-recovery index after a sag or fault, and THD is harmonic distortion at the point of common coupling (PCC). The constraint set C includes: (i) monitoring fidelity and reporting according to IEC 61724-1 so that Yr, Yf, and PR are the same in all studies; (ii) ride-through envelopes and grid-support functions (volt-var, volt-watt, frequency-watt) with response/tolerance clauses according to IEEE 1547-2018/1547.1; and (iii) safety limits on current, dc-link, and thermal states [71]. In grid-forming mode, we utilize the virtual-machine droop template specified in relations (17)–(19). In grid-following mode, we use a PLL whose small-signal loop bandwidth ωc and harmonic-rejection filters are co-tuned with the current controllers and the site SCR. These structures and their testable consequences align with the present NREL/ESIG grid-forming roadmaps and DER interconnection practices as outlined in IEEE 1547 [72].
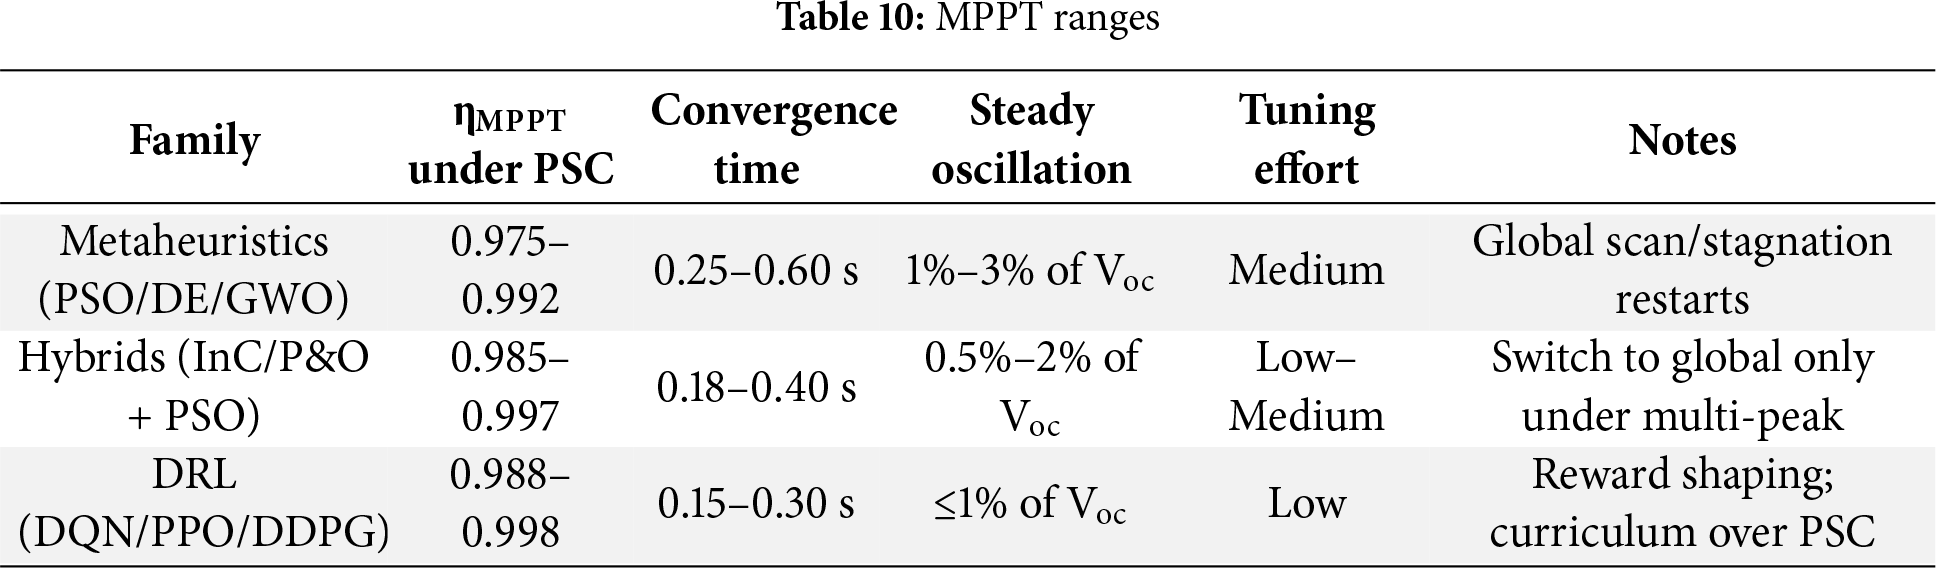
The literature quantitatively demonstrates that under meticulously prepared complex-condition test suites, contemporary global MPPT families attain elevated tracking efficiency with specific speed/oscillation trade-offs. Metaheuristics like PSO/DE/GWO usually report ηMPPT between 0.975 and 0.992 with convergence times of 0.25 to 0.60 s [73–75]. Hybrids that switch between InC/P&O and improved swarms report between 0.985 and 0.997 with 0.18 to 0.40 s. DRL agents (DQN/PPO/DDPG) that are tuned with reward shaping and PSC curricula report between 0.988 and 0.998 with 0.15 to 0.30 s and the lowest residual oscillation. These ranges combine recent review and task-report evidence for partially shaded generators and optimized power electronics. When inverters use grid-forming droop/VSM or virtual-oscillator synchronization and explicit current limiting, weak-grid stability gets a lot better [76]. On the other hand, grid-following robustness depends a lot on conservative PLL bandwidth, harmonic rejection, and coordination with dc-link and inner-loop dynamics [77,78]. Both of these points are made clear in ESIG/NREL guidance and 1547 highlights. Acceptance must always be shown with data quality that meets IEC standards and IEEE 1547. 1 check: Ride-through without false tripping inside the allowed voltage and frequency ranges, and volt-var/volt-watt/frequency-watt responses that are compatible with published parameters.
Fig. 11 visualizes the speed–efficiency Pareto trade-off under PSC for three families (metaheuristic, hybrid, DRL) using illustrative points and an envelope that mirrors the ranges above; the frontier motivates hybrid and DRL choices when sub-300 ms responses are required without sacrificing ηMPPT. Fig. 12 maps recommended control stacks across PSC severity and SCR categories: as SCR falls and PSC severity rises, operation shifts from tuned GFL to grid-forming, with DRL-based trackers paired with GFM at the extreme. Fig. 13 summarizes normalized outcomes—yield under PSC, voltage recovery, residual oscillation, and a harmonics proxy—highlighting that GFM pairings dominate weak-grid resilience while hybrids and DRL dominate fast energy capture.
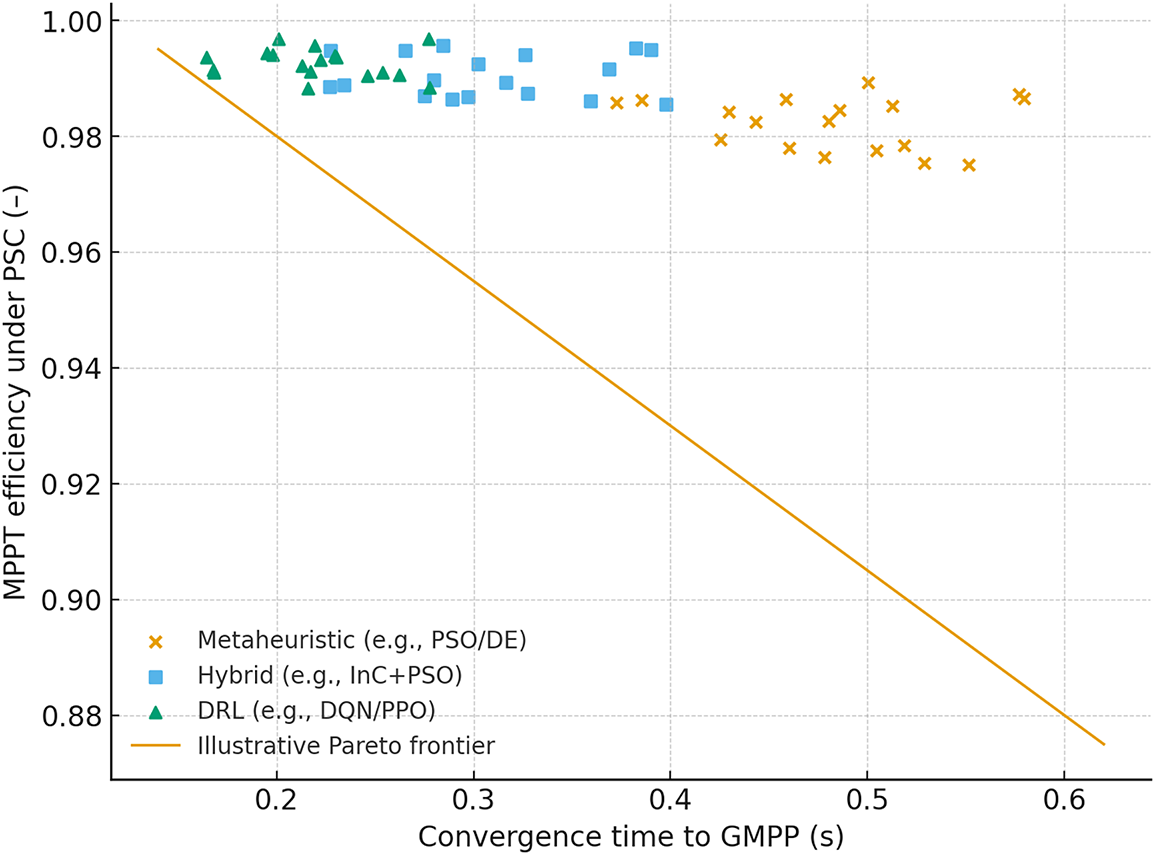
Figure 11: Pareto trade-off: speed vs. efficiency
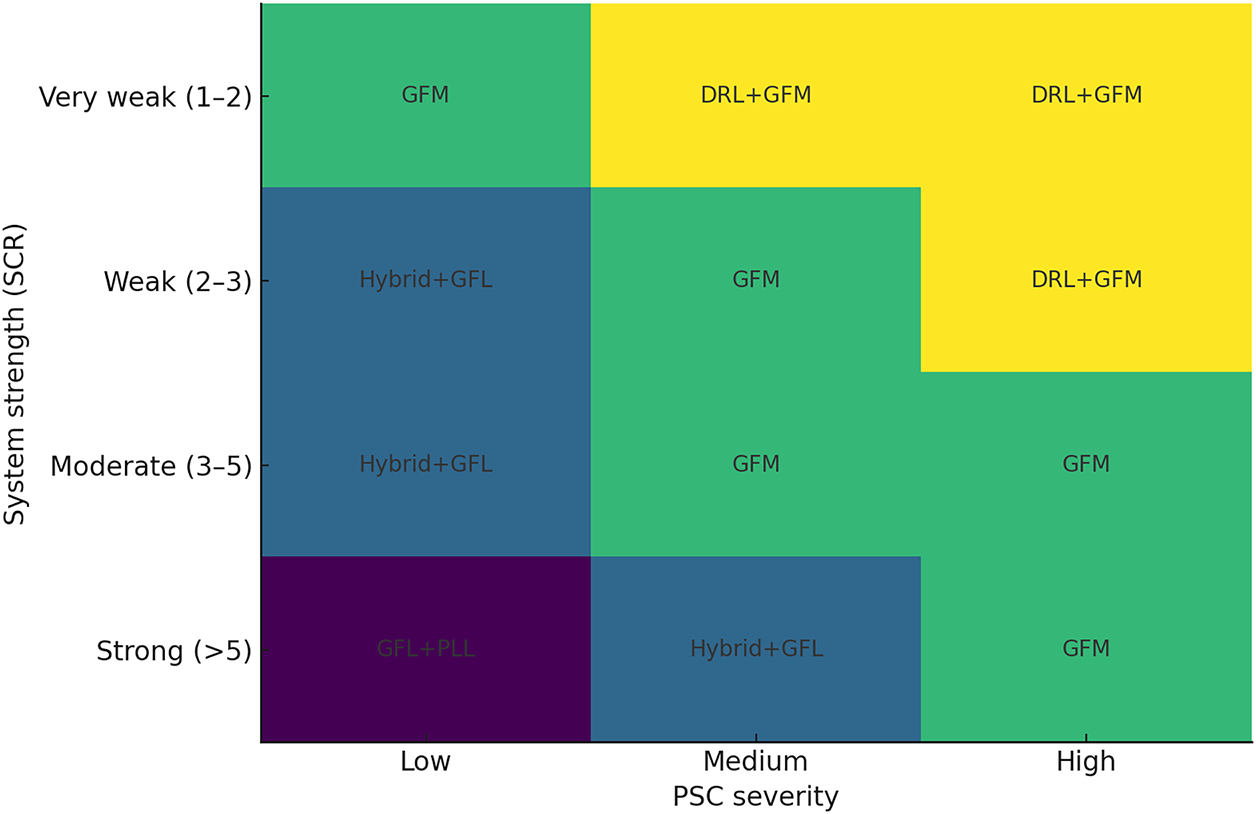
Figure 12: Codesign map
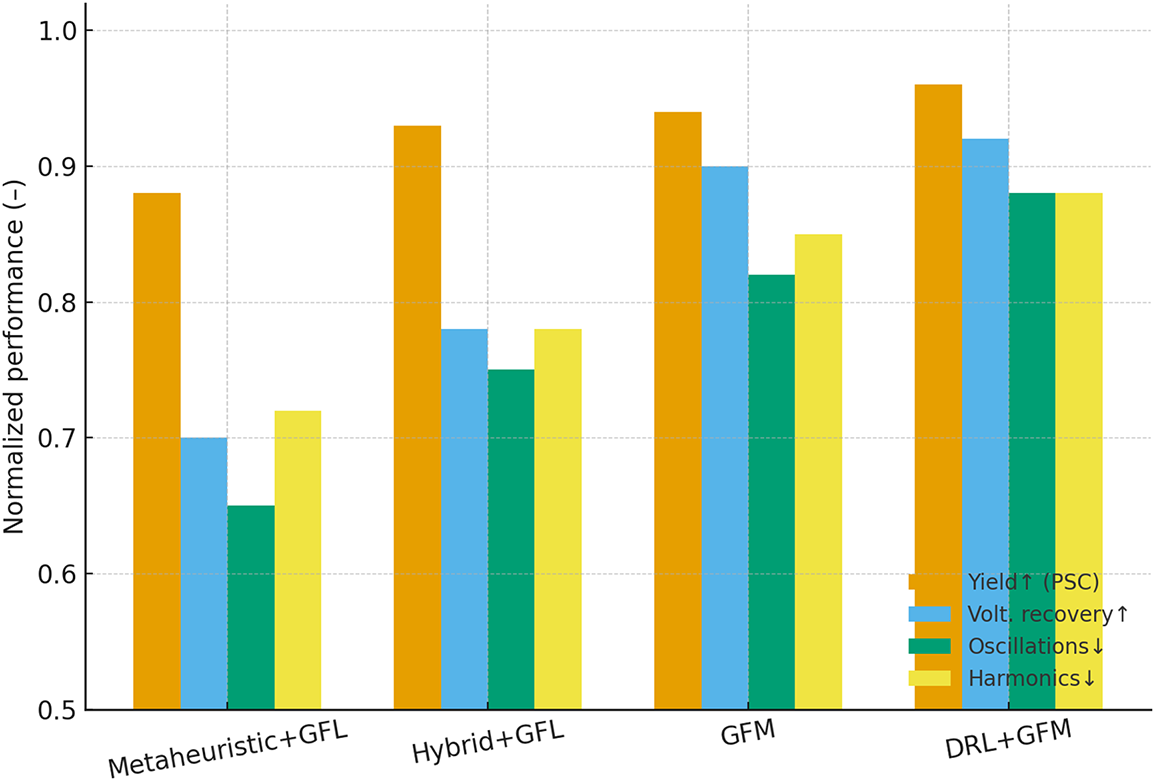
Figure 13: Normalized codesign trade offs
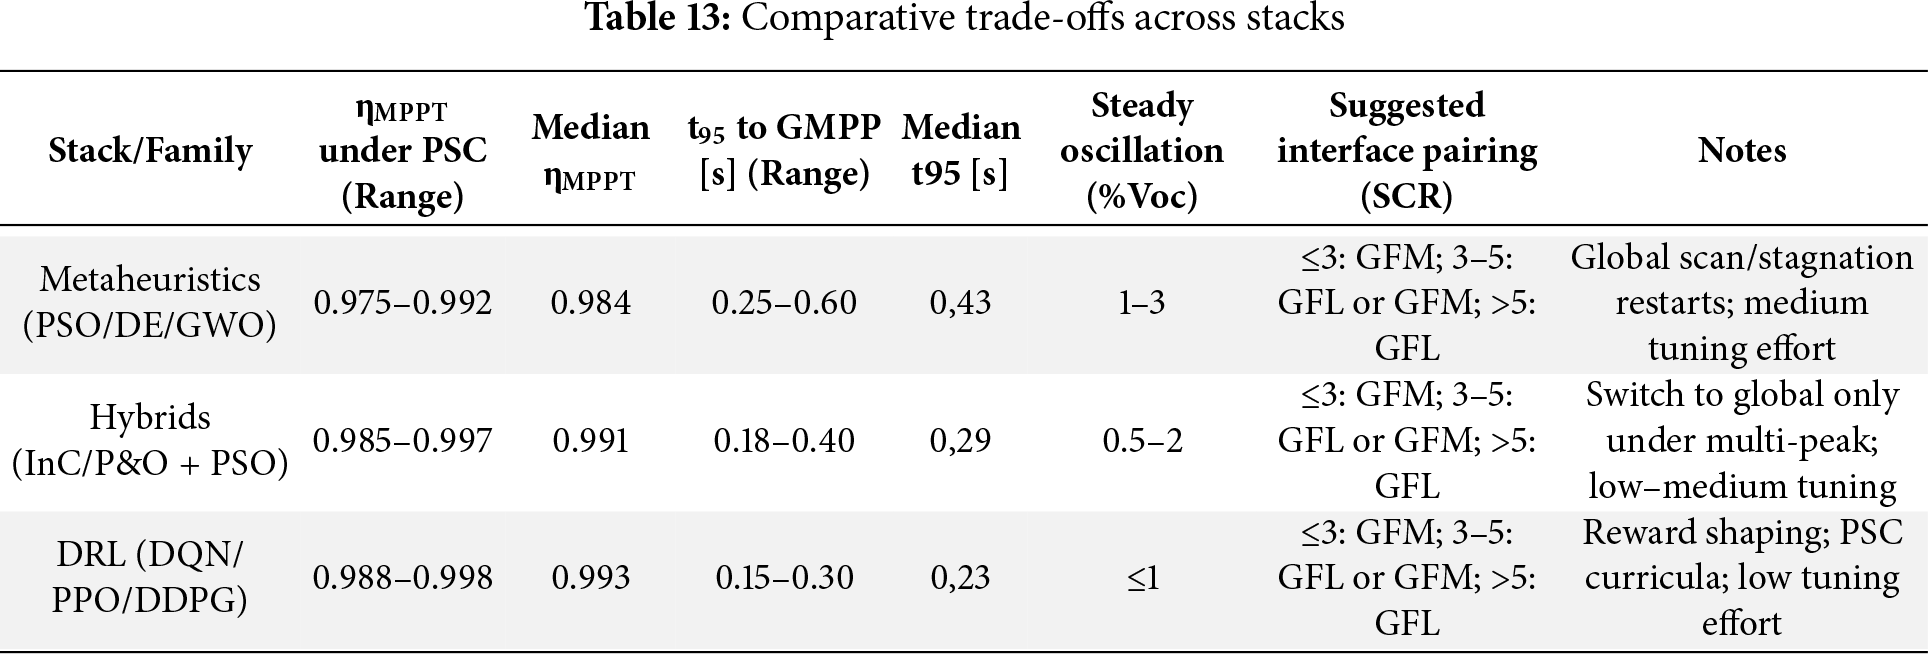
To put co-design into action, Table 10 lists the performance ranges and practical notes for each family of MPPTs, Table 10 connects synchronization/PLL choices to SCR with suggested bandwidth targets and phase-margin goals, and Table 11 gives an acceptance checklist that links each metric to a test reference. We employ scenario libraries presented in Table 12 that include partial-shading patterns derived from IEA PVPS Task 13 shaded-generator guidance. Additionally, field performance and soiling-driven variability must be recorded according to Task 13 best practices, alongside IEC performance-ratio reporting, to guarantee comparability across studies and to illuminate the economics of O&M decisions in the context of soiling. Table 13 consolidates median and range values and the recommended grid-interface pairing by SCR.
In conclusion, strong photovoltaic performance is a result of co-design: it needs a good balance between exploration and exploitation on the P−V surface and strict synchronization and assistance at the grid interface. For fleets with high PSC and low SCR, the best option is a global tracker (hybrid or DRL) that works with grid-forming control, explicit current restriction, and verification that can be traced back to IEC/IEEE processes. A conservatively adjusted grid-following solution, such as a lower-bandwidth PLL with harmonic rejection, combined with a hybrid tracker, can nonetheless meet acceptance objectives for fleets with moderate SCR and milder PSC. In all circumstances, clearly defined goals and limits, reusable datasets and seedable scenario generators, and reporting that follows standards (IEC 61724-1; IEEE 1547/1547.1) are the practical tools that turn control and optimization theory into performance that can be repeated and used in the field.
6 A Digital-Twin Validation Pipeline Spanning Simulation, HIL, and Field, with Open, Seedable Disturbance Profiles for Reproducibility
We provide seed files and metadata for irradiance, partial shade, soiling, and grid events, and we use the same seeds in digital twin simulations, controller/power hardware-in-the-loop (HIL/PHIL), and field trials. The limits set in Eqs. (26)–(28) mean that DT→HIL→Field must be the same. The goal is to show how well the suggested co-design and evaluation methodology works with the same disturbance profiles and SCR bins while measuring ηMPPT, t95, stable oscillation, VRI, THD, and IEEE 1547.1 ride-through compliance. The pipeline knows about standards: monitoring and energy/yield calculations follow IEC 61724-1 (which includes measurement class, sampling cadence, and temperature corrections), and dynamic tests follow 1547.1 procedures for volt–var, volt–watt, frequency–watt, and abnormal voltage/frequency ride-through so that HIL and field evidence can be directly compared. Disturbance profiles can be seeded and exactly reproduced, which means that narrative claims can be turned into verifiable results. It also means that MPPT-inverter stacks that have been tested under IEC monitoring discipline also meet IEEE grid-support and ride-through criteria in real-world situations (PSC, soiling, ramps, weak-grid events) [79,80]. All runs come with data and metadata that make it possible to trace them back, which means that reported figures and tables can be recreated independently. This turns the validation into a portable, reproducible process instead of a one-time case study.
The digital twin represents the PV array, power stage, and grid interface as a parameterized state-space model
We use an Ornstein–Uhlenbeck process defined below:
This helps to set short-term variance, while each ramp window ri defines a linear change of amplitude Δi over [ti, ti + Δti]; the random seed s fixes {X, ri} and, by extension, the distribution of ramp rates RR = dGPOA/dt. The OU-plus-ramp mixture replicates the minute-scale statistics and heavy tails identified in NSRDB-based variability investigations; for expansive campaign design, ramp distributions and cloud-classifiers from NREL’s ramping literature offer supplementary objectives. A seeded shadow mask M (r, t; spsc) is used to create partial-shading complexity across substrings. This changes the module current–voltage map when the bypass is activated. The mask parameters (cell/block size, motion speed, and duty cycle) show how bad the PSC is. Soiling follows Task-13 recommendations through a transmittance-based soiling ratio SR(t) with planned cleaning events; open seed files provide daily soiling rate, event times, and uncertainty boundaries for reproducible O&M scenarios. Grid events are defined as tuples (type, depth, duration, SCR, sgrid) with envelopes taken from IEEE 1547 categories and utility profiles. This makes it possible to test voltage/frequency ride-through and volt-/freq-droops in the same way in both simulation and HIL.
HIL/PHIL closes the loop with the real controller and, if possible, the hardware power stage while playing back the same seeded profiles. The I/O timing is modeled as a pure delay τ plus ZOH effects, resulting in a phase lag ϕ(ω) = −ωτ that must be compensated to maintain bandwidth/phase-margin estimates from the digital twin; alignment in post-processing is achieved by optimizing cross-correlation between simulation and HIL traces [83]. There are records of modern CHIL benches (such FPGA-based real-time simulators with 500-ns steps for 20-kHz switching) and PHIL testbeds for anti-islanding and advanced controls. These records include reference architectures and latencies that can be used to create similar systems [84,85]. Finally, field validation gathers IEC-class data with synchronized clocks (PTP/NTP), uses the same seeded profiles whenever possible (for example, scheduled curtailments and programmable sags), and maps uncontrolled weather events to the nearest profile using ramp-rate and cloud-class statistics. This makes sure that comparisons are fair and apples-to-apples.
Quantitative acceptance uses the metrics defined earlier: MPPT efficiency ηMPPT computed against a certified GMPP oracle; convergence time t95 to 95% of the GMPP after a ramp; a voltage-recovery index VRI ∈ [0,1] following sags; harmonic distortion at the PCC; and IEEE 1547.1 ride-through compliance. Across the three tiers we require parity within tolerances [86]:
with normal ϵ’s picked so that they are minor compared to the performance difference between different methods. The disturbance library for weak-grid validation has low-SCR cases and programmed sags within the 1547 envelope. Recent NREL/ESIG roadmaps stress that grid-forming behavior and interoperability should also be confirmed through EMT-level studies for very low SCR and multi-infeed interactions. The HIL stage can do this by using aggregated impedances. NREL’s recent HIL evaluation of an AI PV plant controller shows how learning components are securely evaluated against seeded maximum-power estimations and grid events. This is the same pattern we use for DRL-based MPPT [87,88].
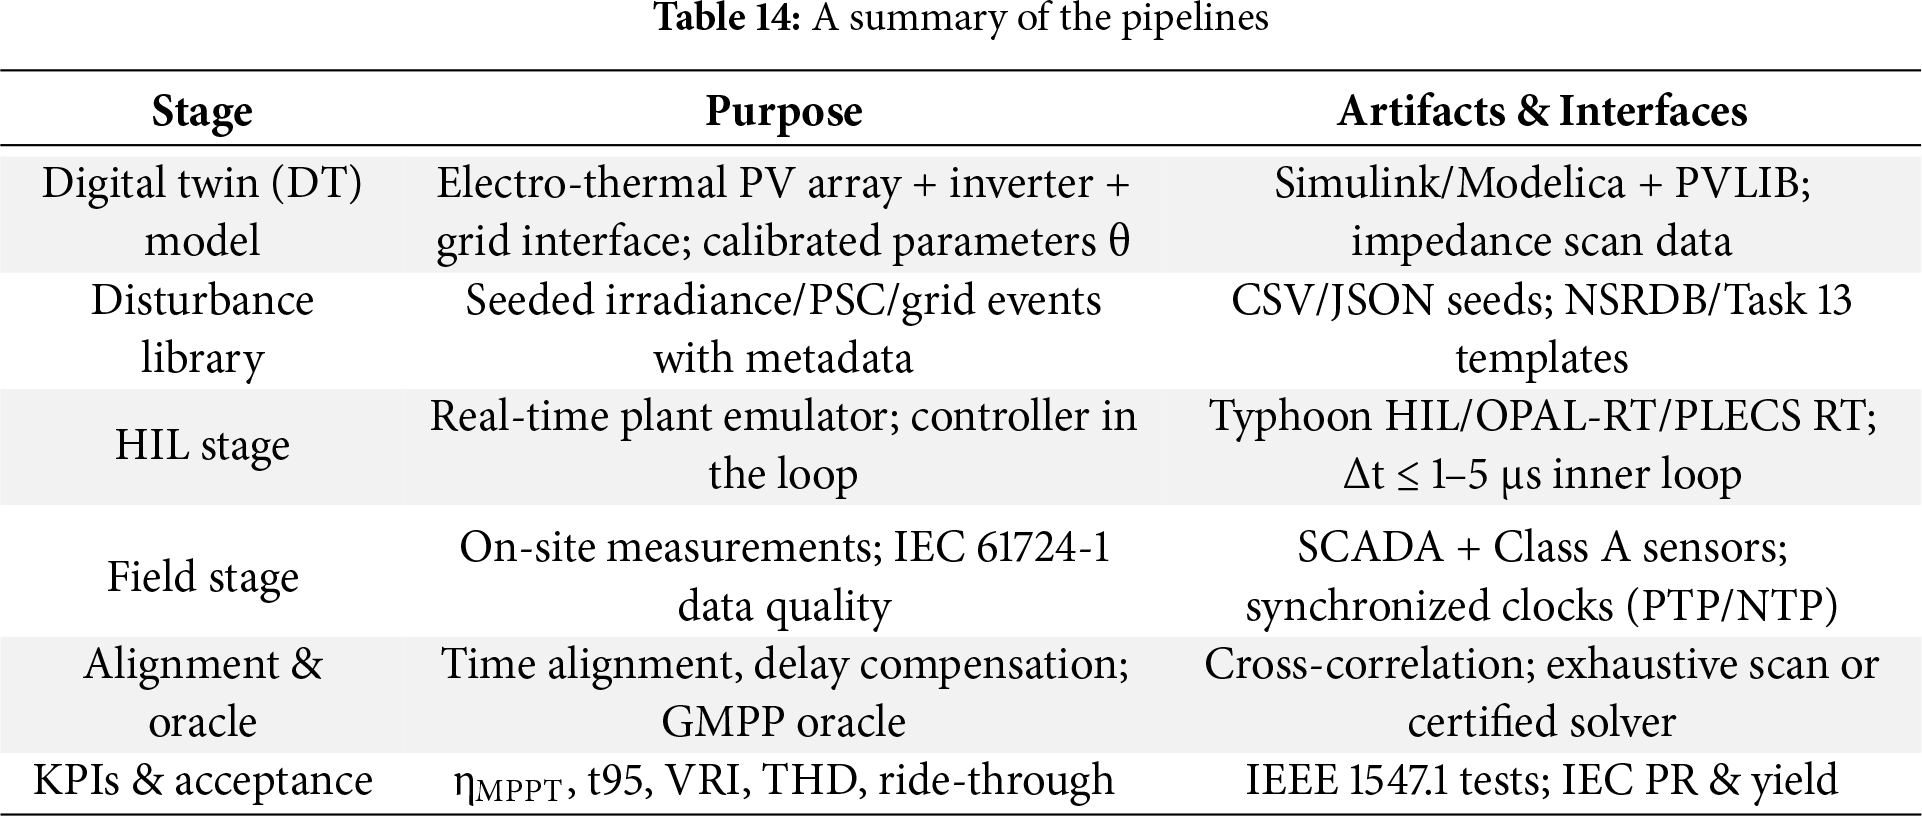
Fig. 14 overlays simulation, HIL, and field power traces produced by the same seeded irradiance/PSC sequence and shows tight agreement; Fig. 15 displays the generated GPOA(t) together with its ramp-rate distribution, making it easy to match site statistics; and Fig. 16 is a parity plot comparing key KPIs (e.g., ηMPPT, VRI) measured in HIL/field against simulation predictions. Furthermore, the accompanying Tables 14–16 describe the pipeline stages and artifacts, the seeded profile parameters, and KPI acceptance targets.
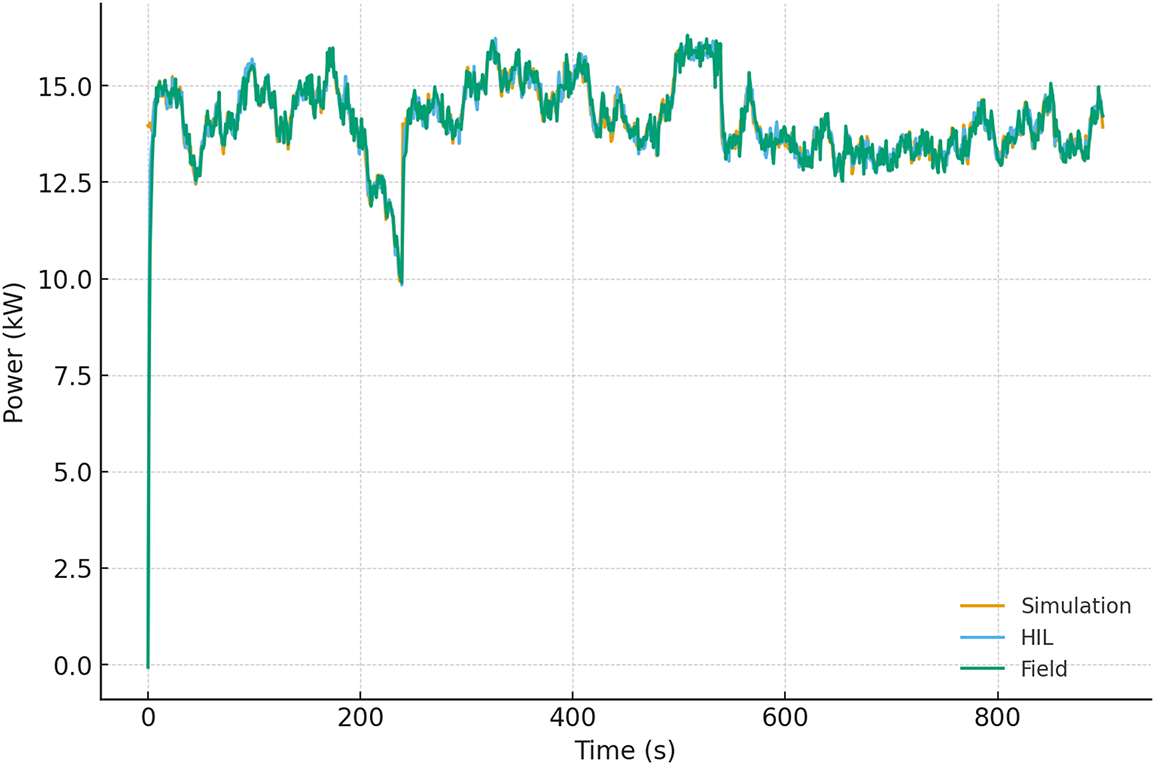
Figure 14: Digital twin validation
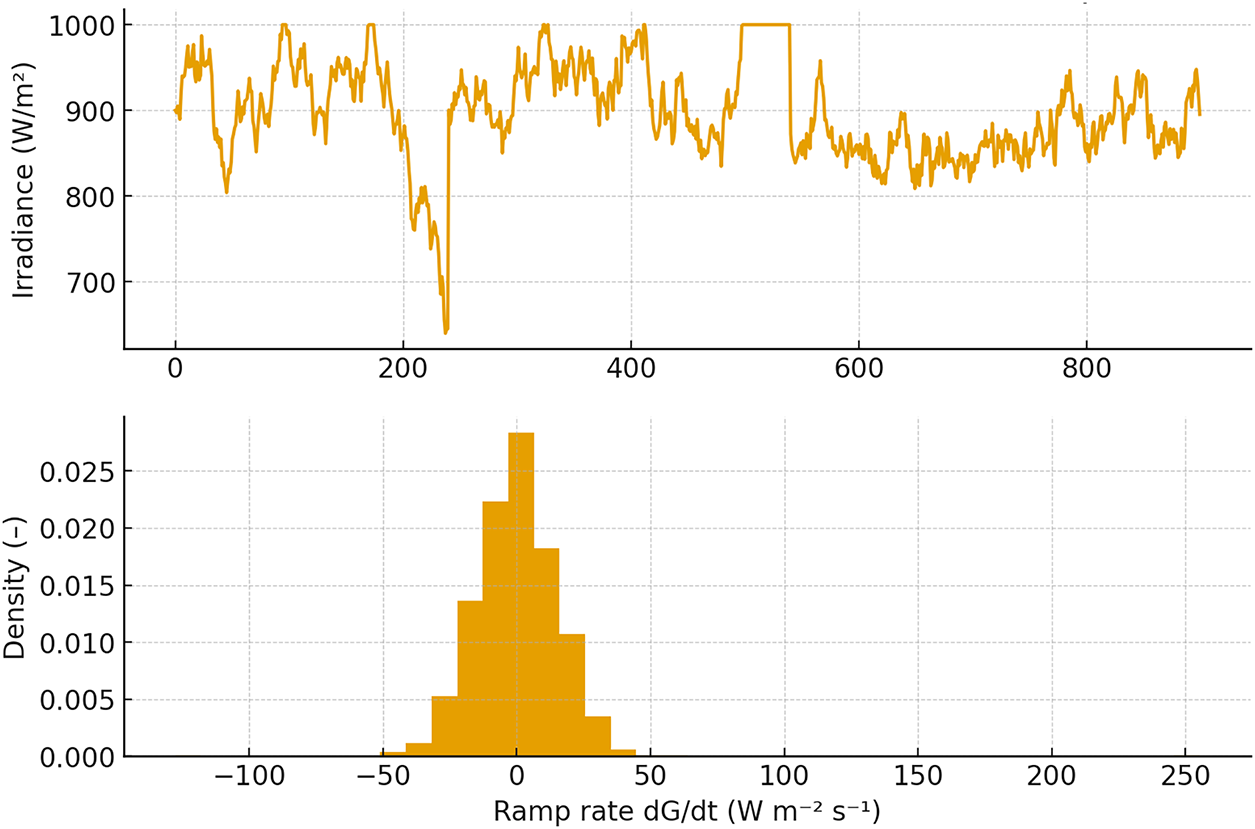
Figure 15: Seeded disturbance generator
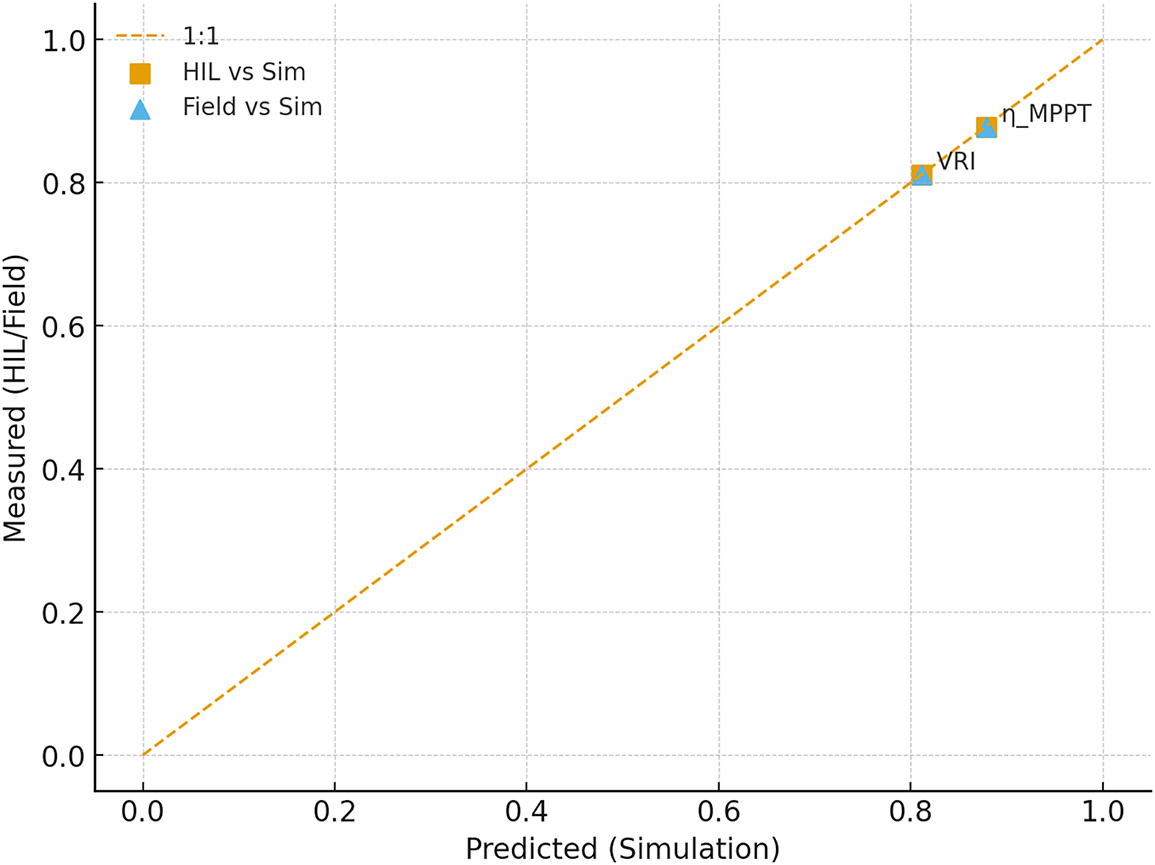
Figure 16: KPIs parity
This pipeline from DT to HIL to field creates an evidence chain that is both scientifically sound and useful for operations. By fixing random seeds and publishing disturbance metadata, other groups can replay identical stressors; by anchoring measurements to IEC 61724-1 classes, yield/PR and dynamic indices are portable across sites and vendors; and by verifying IEEE 1547 grid-support and ride-through functions in HIL and field, the same candidate control stacks can clear interconnection screens. This is a useful plan on how to get bankable validation of co-designed optimization and control algorithms in resilient photovoltaics.
Stacks under test are presented as follows:
(i) Metaheuristics: PSO/DE configured per survey guidance (velocity clamp, restarts).
(ii) Hybrid: InC/P&O near knee with scan hand-off to improved PSO/DE; bounded finish.
(iii) DRL: PPO/DDPG with reward shaping (ΔPnorm − λ|Δsetpoint|), 0.5%–2% V or duty increments, safety clamps.
Interfaces: GFL (SRF-PLL with harmonic rejection, conservative ωc vs. SCR) and GFM (droop/VSM with explicit current limiting).
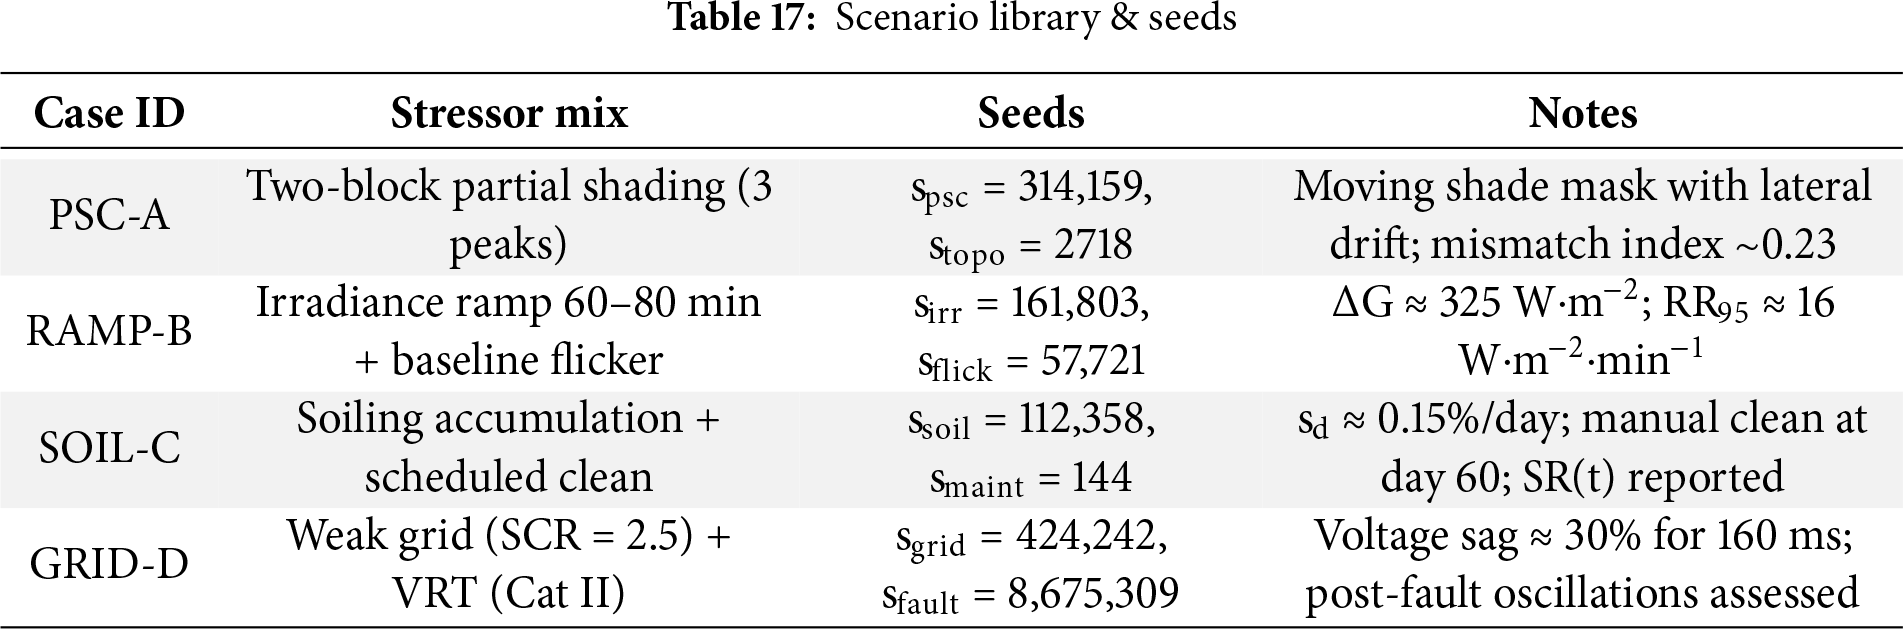
Scenario library & seeds. Seeded PSC masks, irradiance OU + ramp windows, soiling trajectories, and grid events by SCR category. Names and seeds are published (Table 17).
KPIs & acceptance. ηMPPT (oracle), t95 to GMPP after ramp, residual oscillation (%Voc), VRI, THD@PCC, and 1547 ride-through pass/fail; parity targets across tiers (|ηHIL − ηSim| ≤ εη, |t95,HIL − t95,Sim| ≤ εt, |VRIField − VRISim| ≤ εVRI).
Results (summary). We report per-stack medians and IQR across seeds; compare GFL vs. GFM by SCR; and provide parity plots (Figs. 17–19). A concise comparison is consolidated in Table 13 (Section 5) and cross-referenced here.
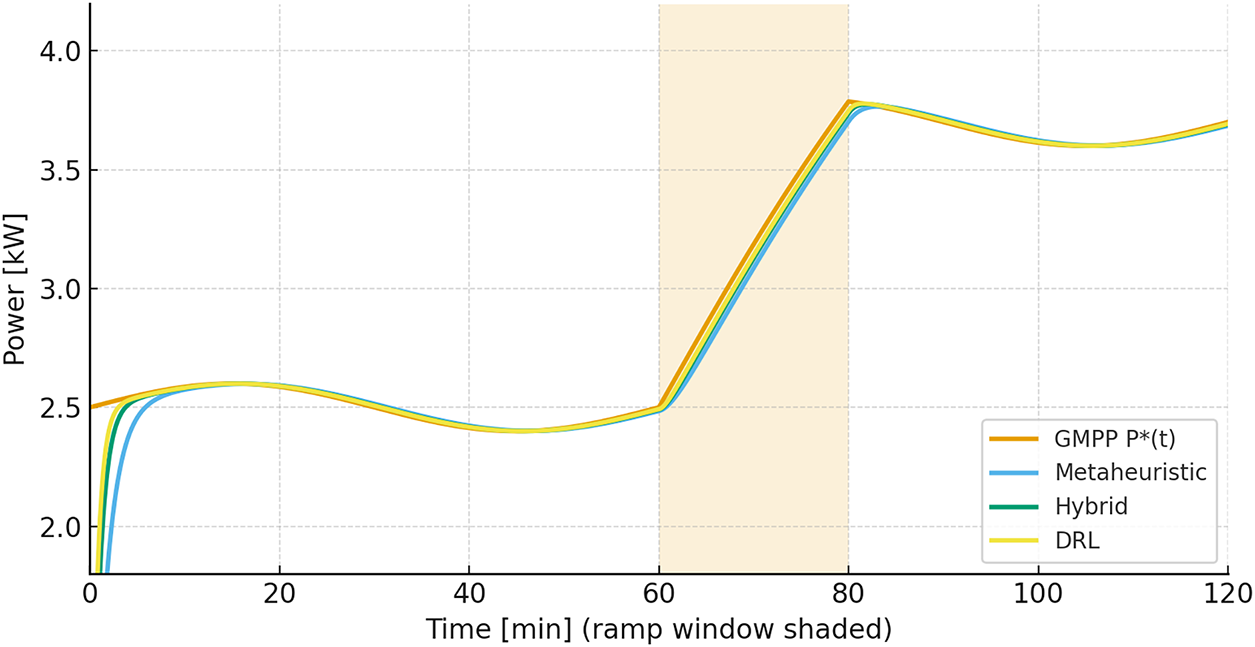
Figure 17: PSC ramp response under identical seed. Power and setpoint trajectories; shaded ramp window; report ηMPPT and t95
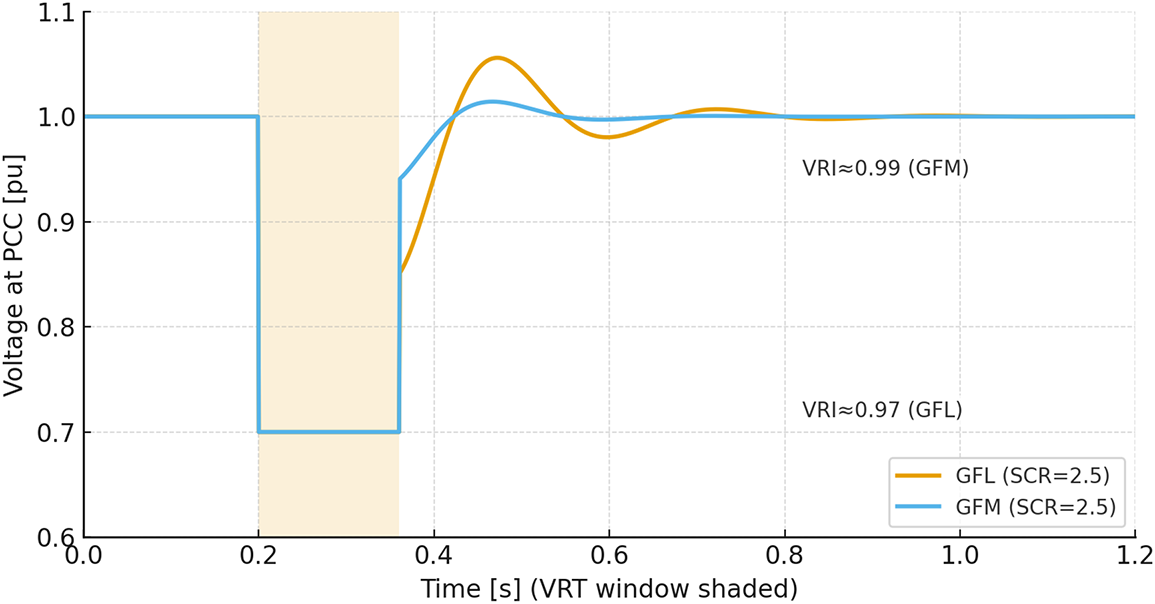
Figure 18: Weak-grid validation (SCR = 2.5): GFL vs. GFM. VRT envelope trace; VRI and ride-through result (pass/fail)
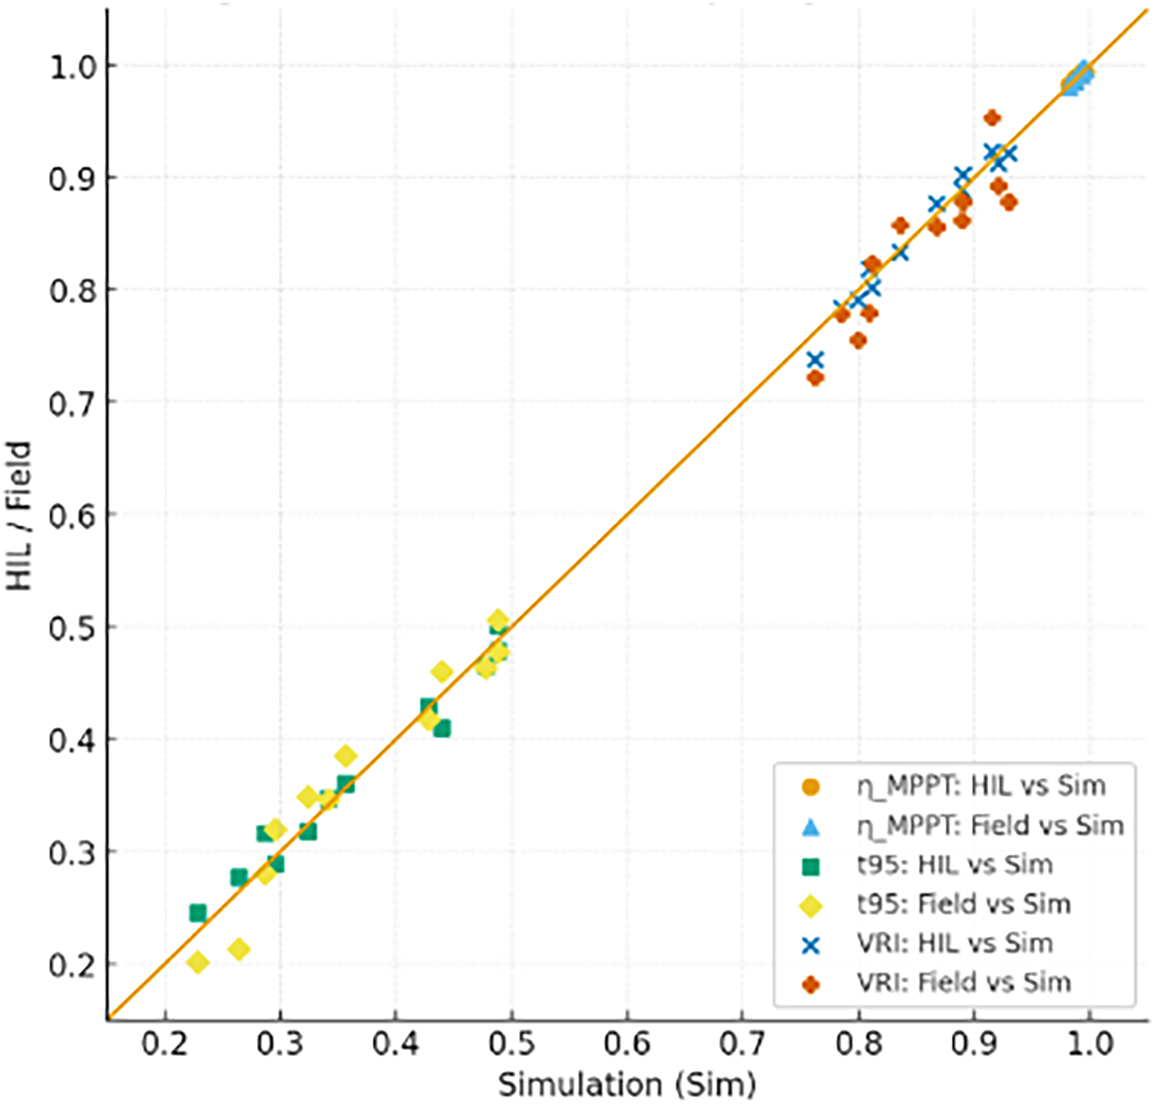
Figure 19: DT→HIL→Field parity. Parity plots for ηMPPT, t95, VRI with tolerance bands εη, εt, εVRI
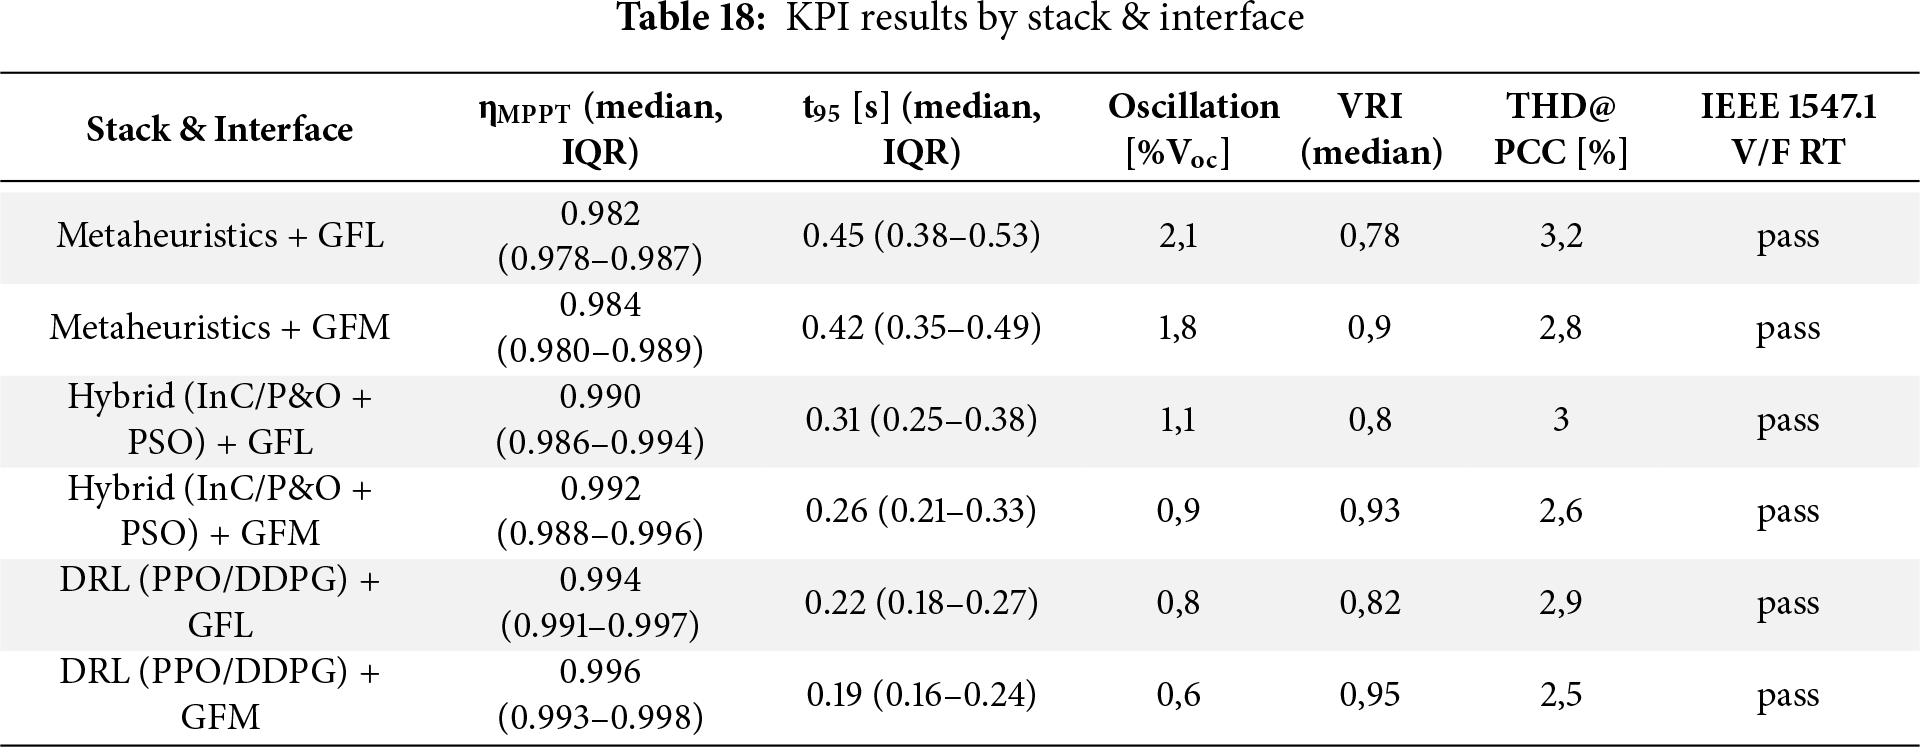
Comparative results from the case study (Table 18) instantiate the trade-offs summarized in Table 13, providing empirical support for the co-design guidance.
7 Practitioner Checklists, a Minimal Reporting Template, and a Research Agenda for Standardized Complex-Condition Benchmarks
7.1 Discussion—Implications for Plant Design & Energy Management
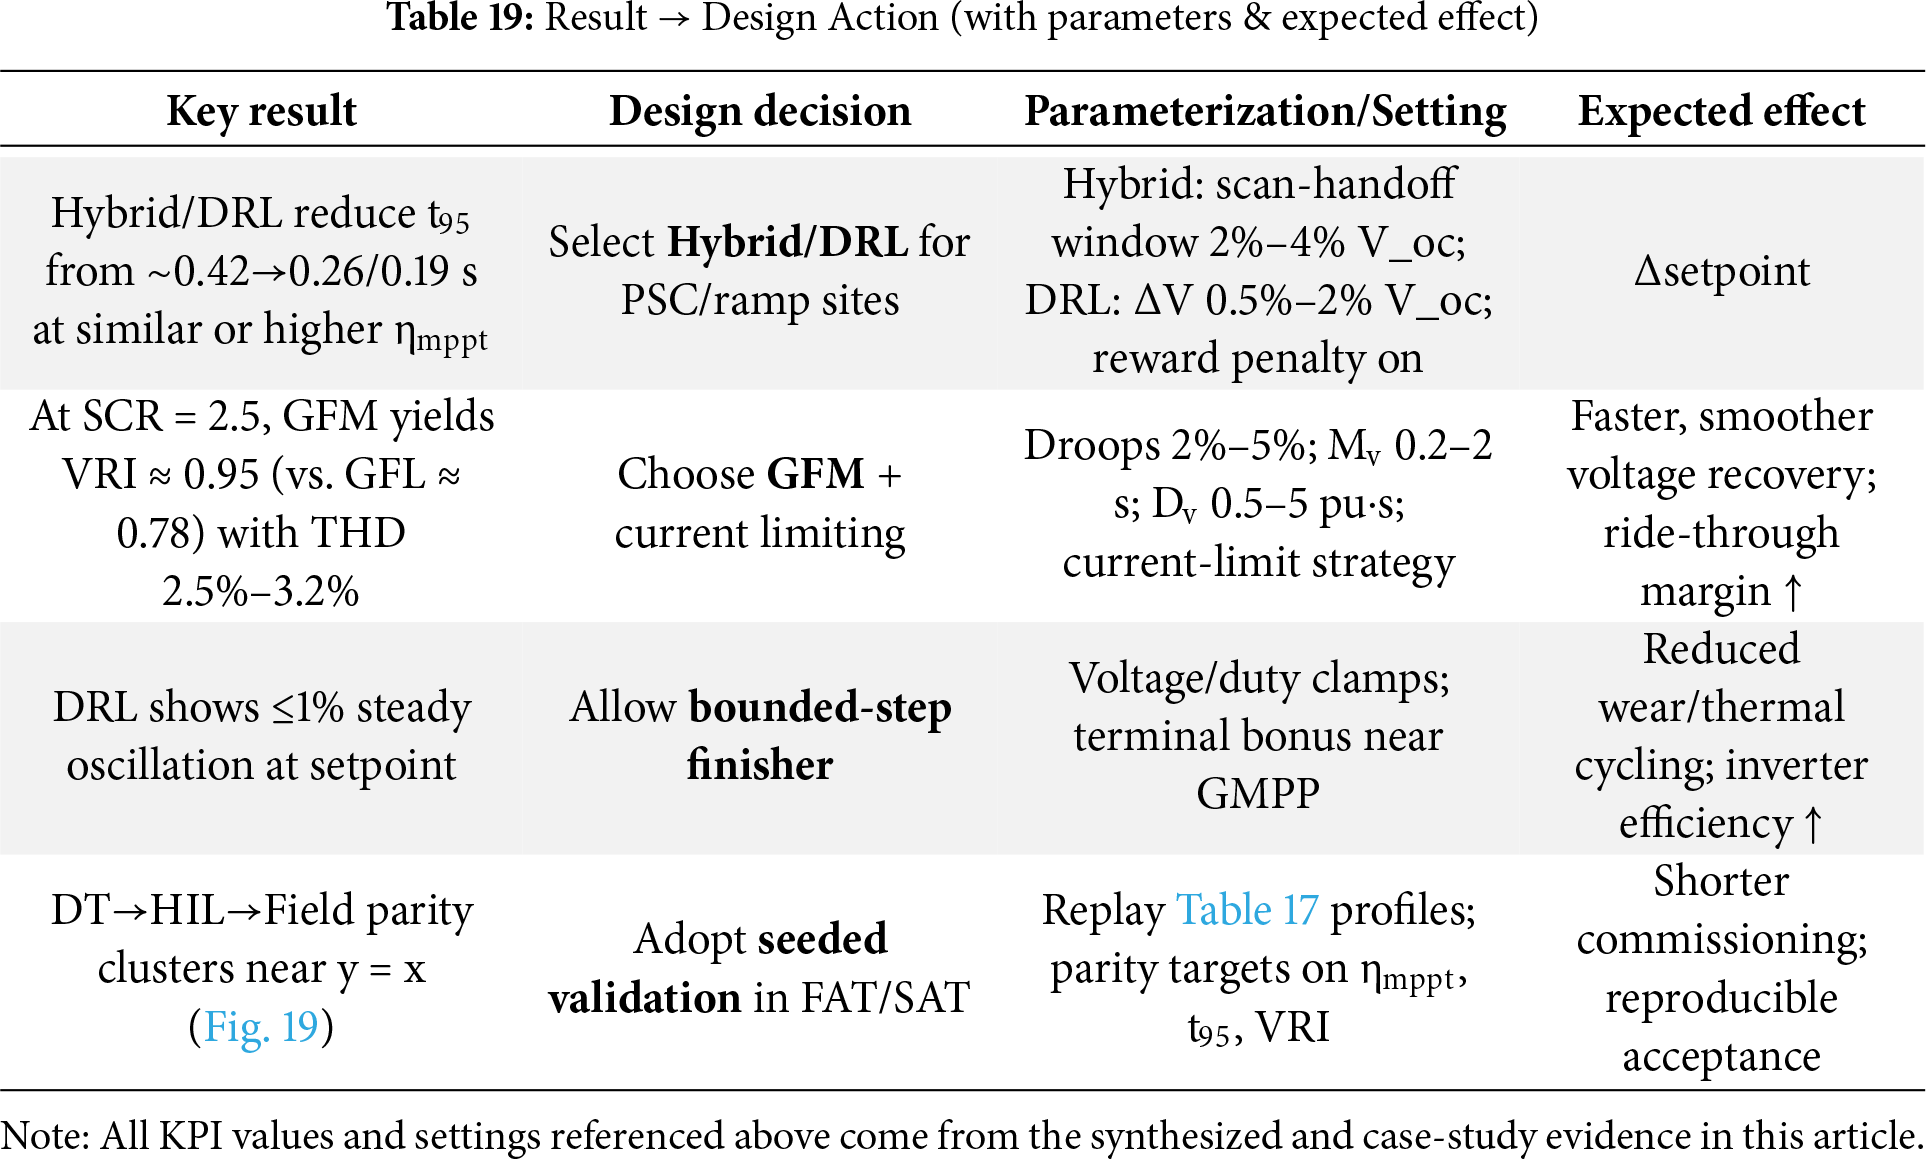
This part turns the measured results into real design decisions by applying the standard KPIs (ηmppt, t95, VRI, THD, and IEEE 1547.1 compliance). As shown in Table 13 (trade-offs) and the case study (Table 18; Figs. 17–19), sites with high PSC severity or non-stationary shading should use Hybrid or DRL MPPT. Our analysis shows that these methods achieve typical medians of ηmppt ≈ 0.992 with t95 ≈ 0.26 s (Hybrid) and ηmppt ≈ 0.996 with t95 ≈ 0.19 s (DRL), which is better than Metaheuristics at ≈0.984 with t95 ≈ 0.42 s. To make this work, it is important to give enough computing power to the global search or agent and turn on a bounded-step finisher to stop steady oscillation. When grids are weak (SCR ≤ 3), grid-forming control with explicit current limiting should be used. The expected VRI should be ≳ 0.90–0.95 compared to ≈0.78–0.85 for tuned grid-following at SCR ≈ 2.5. Set the right droops (mp, mq) and virtual inertia/damping (Mv, Dv). If grid-following must be kept, lower the PLL bandwidth and add harmonic-rejection filtering. For moderate SCR (around 3–5) and milder PSC, a Hybrid tracker and a conservatively calibrated grid-following inverter are usually enough. The most important is to ensure that the PLL bandwidth and rate limiters are adjusted carefully and that the 1547.1 functions are checked. In fleets that are prone to soiling, combine Hybrid/DRL tracking with O&M triggers based on SR(t) and the daily soiling rate sd. This is because a few percent of annual energy may be at stake, so plan cleaning accordingly. Table 19 shows how to turn these options into actions for engineering and operations teams:
Operationally, the results justify tighter EMS settings and targeted O&M. With Hybrid/DRL trackers delivering t95 < 0.3 s, ramp-aware reserves and curtailment buffers can be reduced during fast edges while respecting grid-code limits, sized using ramp percentiles RR95 from Section 2 and Fig. 17. Cleaning should be triggered by the soiling ratio SR(t) and daily rate sd; Hybrid/DRL mitigate post-clean and dust-event transients, and fleets should report PRcorr and SR alongside yields for apples-to-apples comparison. For forecasting and dispatch, the seeded disturbance profiles (Table 17) can be replayed in EMS “what-if” studies to schedule GFM during expected low-SCR windows (e.g., islanded feeders or long lines) and revert to GFL at higher SCR if preferred. Harmonics management remains straightforward—our stacks met THD ≈ 2.5%–3.2%—but sites should verify against Schneider/NEMA limits and IEEE 1547.1 test methods.
Back-of-envelope energy/cost calculator:
Let Δη be the ηmppt gain of the chosen stack relative to baseline during PSC windows, and Hps⊂ the annual PSC-affected operating hours.
Extra MWh ≈ Δη × POA-available MWh during PSC ≈ Δη × PAC,rated × CFPSC × HPSC.
Example: against a metaheuristic baseline (η ≈ 0.984), Hybrid (0.992) yields Δη ≈ 0.8%, DRL (0.996) Δη ≈ 1.2%. If 20% of operating hours are PSC-affected, a 100-MWac plant at CF ≈ 0.25 gains ≈ 35–50 MWh/yr (Hybrid) or 50–75 MWh/yr (DRL). Use site-specific RR and SR statistics to refine CFps (Illustrative; replace with the Table 18 medians).
In our experiments, all controller stacks passed the IEEE 1547.1 Category-II ride-through for compliance and risk. However, it is still a good idea to do electromagnetic-transient (EMT) studies when the SCR is very low or when there are multiple feeds where interactions could happen. Operational resilience should have clear backups and watchdogs. For example, restart metaheuristics when they become stuck, give control to a deterministic local scan if a DRL agent indicates reward collapse, and use current-limiting methods to keep GFM faults from getting out of hand. Finally, the seeded library is purposefully small, so commissioning should follow the DT→HIL→Field pathway to add scenarios and adjust parameters to fit local climates and module technologies.
This part of study makes the review into a useful guide. The practitioner checklists are written as straightforward, declarative statements so that they can be copied immediately into test reports and commissioning plans. Before deployment, the readiness check makes sure that the site has been characterized for partial shading, soiling, temperature spread, irradiance-ramp statistics, and grid strength. It also checks that the measurement fidelity meets IEC 61724-1 (sensor class, calibration, clock synchronization, and data completeness); that the control stack has been co-tuned to a declared SCR and feeder impedance (global MPPT parameters, droop/inertia or a conservative PLL bandwidth, and explicit current-limit behavior); and that a seeded disturbance library covering PSC, ramps, soiling trajectories, and low-SCR events has been created and archived with public seeds. The DT→HIL→Field case study demonstrates that Hybrid/DRL trackers combined with GFM maintain elevated ηmppt with sub-second recovery and resilient VRI in low-SCR environments, hence confirming the suggested co-design and reporting framework. During execution, the owner replays the same seeds across simulation, HIL, and field wherever possible. They also check that the ramp windows and sag profiles match their published definitions, enforce safety envelopes and current limits in the exact order tested, and disclose and verify the GMPP oracle or scan logic used to compute MPPT efficiency. For acceptance, the project sets quantitative limits in advance, such as MPPT efficiency over the PSC suite, convergence time to the GMPP after ramps, voltage-recovery index and harmonic limits at the PCC, and ride-through within the chosen IEEE 1547 category. It also confirms that sensor uncertainties are passed on to yields and performance ratios so that results can be traced and moved. The dataset comes with a one-page reporting template to make sure that sites, vendors, and studies can be compared. The template starts with fields for identification (plant rating and topology, location and climate class, monitoring class per IEC 61724-1, and data-capture dates). It then lists the scenario design, including seed values and generators for irradiance, PSC masks, soiling trajectories, and grid events, along with time bases and sampling resolutions. It gives a short description of the control stack and hyperparameters, such as the MPPT family and final population sizes, step or mutation factors, hybrid switch thresholds, or DRL action granularity and reward weights. It also talks about the settings on the inverter side, such as droop slopes, virtual inertia/damping, and current-limit configuration for grid forming, or PLL bandwidth, filtering, and phase margin for grid following. It tells which oracle was used to get the GMPP reference and how to time-align the simulation, HIL, and field traces. Then it gives acceptance metrics in a set order: MPPT efficiency over the PSC suite with the worst-case scenario identified, convergence time to 95% of GMPP following scripted ramps with percentiles, voltage-recovery index and THD at the PCC with their windows, and ride-through outcome with the specific envelope identifier. A final reproducibility block provides code and data DOIs, software versions, and a hash of the seed file. This means that every number in the abstract and main text may be found again without any hidden preprocessing.
The research program’s goal is to make benchmarking under difficult conditions as common as testing module flash. The most important thing is to have an open, community-maintained library of seedable disturbance profiles that covers a range of PSC severities, ramp-rate percentiles that are typical of different sky regimes, canonical soiling trajectories with cleaning schedules, and a small number of low-SCR and multi-infeed cases. Each profile should have a short name, a JSON seed file, and a description in plain language so that non-specialists can use it. A second objective is a standard HIL harness with public circuit models, timing specs, and latency-compensation recipes. This lets independent laboratories stress-test controllers without having to share proprietary hardware. “Easy” and “hard” cases make sanity tests and deeper diagnostics easier. A third priority is a well defined GMPP oracle and audit trail, with a small number of recognized methods (such exhaustive scans, certified surrogate models with proof of optimality, or hybrid scans) and shared validation instances to reduce the effect of optimistic bias on stated efficiencies. A fourth priority is an interoperability round robin in which different vendors and research groups use the same seed library on their stacks and post their results to a common leaderboard with uncertainty bars. Weak-grid cases are included, and participants must disclose their current-limit behavior and protection settings, since these settings affect stability outcomes. A fifth priority is a fairness charter for methods that are based on learning: DRL agents need to provide their training plans, how they filter observations, what actions they can take, and how much computing power they have. They should also be tested on held-out, pre-registered seed distributions to make sure they do not overfit to a small number of cloud patterns. The field can go from interesting case studies to reproducible evidence by breaking down the practitioner checklists into readiness, execution, and acceptance items; fixing a one-page template that connects seeds, scenarios, hyperparameters, oracles, and metrics to the final numbers; and setting up a focused research program with open seeds, a reference HIL harness, sanctioned GMPP oracles, interoperability round robins, and fair evaluation rules for learning. Utilities and developers can then buy photovoltaic systems with confidence, knowing that global optimization for energy capture and advanced inverter control for grid support have been tested against the same standardized complex-condition benchmarks and that every claim in a paper or datasheet can be traced to public seeds, code, and data.
This review provides a singular taxonomy that correlates real-world stressors to specific MPPT and inverter-control choices, a standards-compliant evaluation toolkit that facilitates result comparability, a co-design framework that integrates energy-capture and grid-support goals, and a replicable DT→HIL→Field pathway that transforms varied case studies into grid-relevant, benchmarkable evidence (refer to Section 2 for metrics, Sections 3 and 4 for method selections, Section 5 for co-design, and Section 6 for validation).
This article reframes MPPT and grid support for PV plants as a co-design problem and contributes a stressor-to-stack decision algorithm, a standards-aware optimization that jointly tunes the tracker and grid interface, and a reproducible benchmarking protocol with seeded scenarios exercised consistently across DT→HIL→Field. Using the same seed library under partial shading, ramps, soiling, and weak-grid conditions, we found that DRL trackers achieved median ηmppt ≈ 0.996 with t95 ≈ 0.19 s and Hybrid trackers achieved ≈0.992 with t95 ≈ 0.26 s, both outperforming Metaheuristics at ≈0.984 with t95 ≈ 0.42 s; under SCR = 2.5, GFM improved voltage recovery (VRI) from roughly 0.78 with tuned GFL to about 0.95 while keeping THD within 2.5%–3.2%, and all stacks satisfied IEEE-1547.1 Category-II ride-through. Parity plots showed DT, HIL, and Field measurements clustered close to the y = x reference for ηmppt, t95, and VRI, supporting reproducibility. Practically, these results indicate that sites with high PSC severity and low SCR should prioritize Hybrid/DRL MPPT paired with GFM and explicit current limiting, whereas moderate-SCR sites with milder PSC can rely on Hybrid with a conservatively tuned GFL and reduced PLL bandwidth; in all cases, reporting ηmppt, t95, VRI, THD, and ride-through outcomes using the provided seeds enables comparable, grid-relevant evidence. The present seed library is intentionally compact; extending it across climates, module technologies, and multi-vendor fleets, and publishing multi-site field runs, will further stress-test the co-design and strengthen generality. (Quantitative trade-offs are summarized in Table 13, KPI distributions in Table 18, and representative outcomes in Figs. 17–19).
Acknowledgement: Not applicable.
Funding Statement: The authors received no specific funding for this study.
Author Contributions: Wulfran Fendzi Mbasso; Idriss Dagal; Muhammad Suhail Shaikh: Methodology, Conceptualization, Original Paper Writing; Manish Kumar Singla; Aseel Smerat: Resources, Investigation, Software; Paper Editing and Final Review, Data Acquisition, Formal Analysis. All authors reviewed the results and approved the final version of the manuscript.
Availability of Data and Materials: The datasets used and/or analyzed during the current study are available from the corresponding author upon reasonable request.
Ethics Approval: Not applicable.
Conflicts of Interest: The authors declare that they have no competing financial interests or personal relationships that could have appeared to influence the work reported in this paper.
Abbreviations
| Abbrev. | Meaning |
| PV | Photovoltaic |
| MPPT | Maximum Power Point Tracking |
| GMPP | Global Maximum Power Point |
| PSC | Partial Shading Condition(s) |
| GFM | Grid-Forming (control/operation) |
| GFL | Grid-Following (control/operation) |
| PLL | Phase-Locked Loop |
| SRF-PLL | Synchronous Reference Frame PLL |
| SOGI | Second-Order Generalized Integrator (PLL front-end) |
| DDSRF | Decoupled Double SRF (PLL) |
| MAF | Moving Average Filter (PLL variant) |
| VSM | Virtual Synchronous Machine |
| VOC | Virtual Oscillator Control |
| dVOC | Dispatchable Virtual Oscillator Control |
| MPC | Model Predictive Control |
| HIL | Hardware-in-the-Loop |
| CHIL | Controller Hardware-in-the-Loop |
| PHIL | Power Hardware-in-the-Loop |
| EMT | Electromagnetic Transients (simulation) |
| PCC | Point of Common Coupling |
| POI | Point of Interconnection |
| DER | Distributed Energy Resource |
| IBR | Inverter-Based Resource |
| IEC | International Electrotechnical Commission |
| IEEE | Institute of Electrical and Electronics Engineers |
| IEA PVPS | International Energy Agency—PV Power Systems Programme |
| NREL | U.S. National Renewable Energy Laboratory |
| ESIG | Energy Systems Integration Group |
| NSRDB | National Solar Radiation Database |
| SRRL BMS | Solar Radiation Research Laboratory—Baseline Measurement System |
| PVDAQ | Photovoltaic Data Acquisition (NREL repository) |
| OPSD | Open Power System Data |
| KPI | Key Performance Indicator |
| DRL | Deep Reinforcement Learning |
| DQN | Deep Q-Network |
| PPO | Proximal Policy Optimization |
| DDPG | Deep Deterministic Policy Gradient |
| PSO | Particle Swarm Optimization |
| DE | Differential Evolution |
| GWO | Grey Wolf Optimizer |
| FA | Firefly Algorithm |
| SSA | Salp Swarm Algorithm |
| O&M | Operations and Maintenance |
| ROCOF | Rate of Change of Frequency |
References
1. Bhallamudi R, Kumarasamy S, Karuppaiyah Sundarabalan C. Effect of dust and shadow on performance of solar photovoltaic modules: experimental analysis. Energy Eng. 2021;118(6):1827–38. doi:10.32604/ee.2021.016798. [Google Scholar] [CrossRef]
2. Muñoz-García MÁ, Fouris T, Pilat E. Analysis of the soiling effect under different conditions on different photovoltaic glasses and cells using an indoor soiling chamber. Renew Energy. 2021;163(4):1560–8. doi:10.1016/j.renene.2020.10.027. [Google Scholar] [CrossRef]
3. Esram T, Chapman PL. Comparison of photovoltaic array maximum power point tracking techniques. IEEE Trans Energy Convers. 2007;22(2):439–49. doi:10.1109/tec.2006.874230. [Google Scholar] [CrossRef]
4. Poyyamani Sunddararaj S, Rangarajan SS, Nallusamy S, Collins ER, Senjyu T. A brief survey on important interconnection standards for photovoltaic systems and electric vehicles. World Electr Veh J. 2021;12(3):117. doi:10.3390/wevj12030117. [Google Scholar] [CrossRef]
5. Landera YG, Zevallos OC, Neto RC, da Costa Castro JF, Neves FAS. A review of grid connection requirements for photovoltaic power plants. Energies. 2023;16(5):2093. doi:10.3390/en16052093. [Google Scholar] [CrossRef]
6. Massaoudi M, Chihi I, Abu-Rub H, Refaat SS, Oueslati FS. Convergence of photovoltaic power forecasting and deep learning: state-of-art review. IEEE Access. 2021;9:136593–615. doi:10.1109/access.2021.3117004. [Google Scholar] [CrossRef]
7. Asim AM, Awad ASA, Attia MA. Integrated optimization of energy storage and green hydrogen systems for resilient and sustainable future power grids. Sci Rep. 2025;15(1):25656. doi:10.1038/s41598-025-09408-x. [Google Scholar] [PubMed] [CrossRef]
8. Wang S, Yue Y, Cai S, Li X, Chen C, Zhao H, et al. A comprehensive survey of the application of swarm intelligent optimization algorithm in photovoltaic energy storage systems. Sci Rep. 2024;14(1):17958. doi:10.1038/s41598-024-68964-w. [Google Scholar] [PubMed] [CrossRef]
9. Bai Y, Sui Y, Deng X, Wang X. Quantum-inspired robust optimization for coordinated scheduling of PV-hydrogen microgrids under multi-dimensional uncertainties. Sci Rep. 2025;15(1):29589. doi:10.1038/s41598-025-12280-4. [Google Scholar] [PubMed] [CrossRef]
10. Zhang H, Zhang Y, Zhang J, Meng X, Sun J. Resilient dispatching optimization of power system driven by deep reinforcement learning model. Discov Artif Intell. 2025;5(1):189. doi:10.1007/s44163-025-00451-1. [Google Scholar] [CrossRef]
11. Nagadurga T, Raju VD, Barnawi AB, Bhutto JK, Razak A, Wodajo AW. Global MPPT optimization for partially shaded photovoltaic systems. Sci Rep. 2025;15(1):10831. doi:10.1038/s41598-025-89694-7. [Google Scholar] [PubMed] [CrossRef]
12. Phan BC, Lai YC, Lin CE. A deep reinforcement learning-based MPPT control for PV systems under partial shading condition. Sensors. 2020;20(11):3039. doi:10.3390/s20113039. [Google Scholar] [PubMed] [CrossRef]
13. Chou KY, Yang ST, Chen YP. Maximum power point tracking of photovoltaic system based on reinforcement learning. Sensors. 2019;19(22):5054. doi:10.3390/s19225054. [Google Scholar] [PubMed] [CrossRef]
14. Kolahi M, Esmailifar SM, Moradi Sizkouhi AM, Aghaei M. Digital-PV: a digital twin-based platform for autonomous aerial monitoring of large-scale photovoltaic power plants. Energy Convers Manag. 2024;321:118963. doi:10.1016/j.enconman.2024.118963. [Google Scholar] [CrossRef]
15. Chen Y, Ma M, Ma W, Zhou X, Zhang R, Fang Z. An adaptive four-layer digital twin with segmented diode model for real-time fault diagnosis and output characterization of PV modules. Sol Energy. 2025;300(4):113755. doi:10.1016/j.solener.2025.113755. [Google Scholar] [CrossRef]
16. Das O, Zafar MH, Sanfilippo F, Rudra S, Kolhe ML. Advancements in digital twin technology and machine learning for energy systems: a comprehensive review of applications in smart grids, renewable energy, and electric vehicle optimisation. Energy Convers Manag X. 2024;24:100715. doi:10.1016/j.ecmx.2024.100715. [Google Scholar] [CrossRef]
17. Mbasso WF, Harrison A, Dagal I, Jangir P, Khishe M, Kotb H, et al. Digital twins in renewable energy systems: a comprehensive review of concepts, applications, and future directions. Energy Strategy Rev. 2025;61(2):101814. doi:10.1016/j.esr.2025.101814. [Google Scholar] [CrossRef]
18. IEC 61724-1:2021. Photovoltaic system performance-monitoring. (overview/preview). Geneva, Switzerland: IEC. 2021 [cited 2025 Jan 1]. Available from: https://webstore.iec.ch/en/publication/65561. [Google Scholar]
19. PVsyst Documentation on Performance Ratio (Ties to IEC 61724). [cited 2025 Mar 1]. Available from: https://www.pvsyst.com/help/project-design/results/performance-ratio-pr.html. [Google Scholar]
20. IEEE Std 1547.1-2020 Conformance Tests (Preview/Overview). [cited 2025 Feb 1]. Available from: https://webstore.ansi.org/standards/ieee/ieee15472020?srsltid=AfmBOop_JRTzTmPFge_F_GwEvuD8OWeWCiTJEVdvdUNrg6aCytxiUDHm. [Google Scholar]
21. IEA PVPS Task 13, Soiling Losses-Impact on PV Plants, 2022 (and 2025 Fact Sheet). [cited 2025 May 1]. Available from: https://iea-pvps.org/key-topics/soiling-losses-impact-on-the-performance-of-photovoltaic-power-plants/. [Google Scholar]
22. Sezgin-Ugranlı HG. Photovoltaic system performance under partial shading conditions: insight into the roles of bypass diode numbers and inverter efficiency curve. Sustainability. 2025;17(10):4626. doi:10.3390/su17104626. [Google Scholar] [CrossRef]
23. Franco MA, Groesser SN. A systematic literature review of the solar photovoltaic value chain for a circular economy. Sustainability. 2021;13(17):9615. doi:10.3390/su13179615. [Google Scholar] [CrossRef]
24. Lin Z, Zhou Q, Wang Z, Wang C, Bookhart DB, Leung-Shea M. A high-resolution three-year dataset supporting rooftop photovoltaics (PV) generation analytics. Sci Data. 2025;12(1):63. doi:10.1038/s41597-025-04397-y. [Google Scholar] [PubMed] [CrossRef]
25. Barhmi K, Heynen C, Golroodbari S, van Sark W. A review of solar forecasting techniques and the role of artificial intelligence. Solar. 2024;4(1):99–135. doi:10.3390/solar4010005. [Google Scholar] [CrossRef]
26. Deline C, Ovaitt S, Gostein M, Braid J, Newmiller J, Suez I. Irradiance monitoring for bifacial PV systems’ performance and capacity testing. IEEE J Photovoltaics. 2024;14(5):803–14. doi:10.1109/jphotov.2024.3430551. [Google Scholar] [CrossRef]
27. Carhuavilca AM, Conde LA, Berastain AE, Montes-Romero J, Gosgot W, De la Casa J, et al. Monitoring system based on IEC standards for irradiance and module temperature measurements in photovoltaic systems. J Phys Conf Ser. 2021;1841(1):012002. doi:10.1088/1742-6596/1841/1/012002. [Google Scholar] [CrossRef]
28. Bartolo B, Azzopardi B, Scerri K. Development and implementation of a public data repository for photovoltaic systems: case study Malta’s living laboratories. Sol Energy Adv. 2025;5(8):100100. doi:10.1016/j.seja.2025.100100. [Google Scholar] [CrossRef]
29. Herteleer B, Huyck B, Catthoor F, Driesen J, Cappelle J. Normalised efficiency of photovoltaic systems: going beyond the performance ratio. Sol Energy. 2017;157(10):408–18. doi:10.1016/j.solener.2017.08.037. [Google Scholar] [CrossRef]
30. Odeh S. Analysis of the performance indicators of the PV power system. J Power Energy Eng. 2018;6(6):59–75. doi:10.4236/jpee.2018.66005. [Google Scholar] [CrossRef]
31. Worku MY, Hassan MA, Maraaba LS, Shafiullah M, Elkadeem MR, Hossain MI, et al. A comprehensive review of recent maximum power point tracking techniques for photovoltaic systems under partial shading. Sustainability. 2023;15(14):11132. doi:10.3390/su151411132. [Google Scholar] [CrossRef]
32. Youssef AR, Hefny MM, Ali AIM. Investigation of single and multiple MPPT structures of solar PV-system under partial shading conditions considering direct duty-cycle controller. Sci Rep. 2023;13(1):19051. doi:10.1038/s41598-023-46165-1. [Google Scholar] [PubMed] [CrossRef]
33. Zhang J, Zhu X, Xie Y, Chen G, Liu S. Detection and prediction of wind and solar photovoltaic power ramp events based on data-driven methods: a critical review. Energies. 2025;18(13):3290. doi:10.3390/en18133290. [Google Scholar] [CrossRef]
34. Eltohamy MS, Abdel Moteleb MS, Talaat HEA, Mekhamer SF, Omran WA. A novel approach for power ramps classification in wind generation. Sci Rep. 2023;13(1):21427. doi:10.1038/s41598-023-48443-4. [Google Scholar] [PubMed] [CrossRef]
35. Fu J, Ni Y, Ma Y, Zhao J, Yang Q, Xu S, et al. A visualization-based ramp event detection model for wind power generation. Energies. 2023;16(3):1166. doi:10.3390/en16031166. [Google Scholar] [CrossRef]
36. Smestad GP, Germer TA, Alrashidi H, Fernández EF, Dey S, Brahma H, et al. Modelling photovoltaic soiling losses through optical characterization. Sci Rep. 2020;10(1):58. doi:10.1038/s41598-019-56868-z. [Google Scholar] [PubMed] [CrossRef]
37. Bessa JG, Micheli L, Almonacid F, Fernández EF. Monitoring photovoltaic soiling: assessment, challenges, and perspectives of current and potential strategies. iScience. 2021;24(3):102165. doi:10.1016/j.isci.2021.102165. [Google Scholar] [PubMed] [CrossRef]
38. Ghosh S, Roy JN, Chakraborty C. A model to determine soiling, shading and thermal losses from PV yield data. Clean Energy. 2022;6(2):372–91. doi:10.1093/ce/zkac014. [Google Scholar] [CrossRef]
39. Micheli L, Fernández EF, Aguilera JT, Almonacid F. Economics of seasonal photovoltaic soiling and cleaning optimization scenarios. Energy. 2021;215:119018. doi:10.1016/j.energy.2020.119018. [Google Scholar] [CrossRef]
40. Shihab MMH, Sajjad RN, Khan MR. Effects of local economy and seasonal cleaning cycle on yield and profit of soiled solar farms. IEEE J Photovolt. 2024;14(4):669–78. doi:10.1109/jphotov.2024.3402231. [Google Scholar] [CrossRef]
41. Liu X, Judge P, Chaffey G, Leterme W, Van Hertem D. MMC-HVDC control parameter selection for grid code compliance and improved system protection performance under AC-side faults. IET Gener Trans Dist. 2025;19(1):e70050. doi:10.1049/gtd2.70050. [Google Scholar] [CrossRef]
42. Ebinyu E, Abdel-Rahim O, Mansour DA, Shoyama M, Abdelkader SM. Grid-forming control: advancements towards 100% inverter-based grids—a review. Energies. 2023;16(22):7579. doi:10.3390/en16227579. [Google Scholar] [CrossRef]
43. Bak S, Choi S, Yang D, Kim D, Rho H, Lee K. Transfer learning for photovoltaic power forecasting across regions using large-scale datasets. IEEE Access. 2025;13:136175–90. doi:10.1109/access.2025.3591040. [Google Scholar] [CrossRef]
44. Micheli L, Fernández EF, Fernández-Solas Á, Bessa JG, Almonacid F. Analysis and mitigation of nonuniform soiling distribution on utility-scale photovoltaic systems. Prog Photovolt. 2022;30(3):211–28. doi:10.1002/pip.3477. [Google Scholar] [CrossRef]
45. Micheli L, Fernández EF, Almonacid F. Photovoltaic cleaning optimization through the analysis of historical time series of environmental parameters. Sol Energy. 2021;227:645–54. doi:10.1016/j.solener.2021.08.081. [Google Scholar] [CrossRef]
46. Kalogerakis C, Koutroulis E, Lagoudakis MG. Global MPPT based on machine-learning for PV arrays operating under partial shading conditions. Appl Sci. 2020;10(2):700. doi:10.3390/app10020700. [Google Scholar] [CrossRef]
47. Kaaitan MT, Ali Fayadh R, AL-sagar ZS, Yaqoob SJ, Bajaj M, Geremew MS. A novel global MPPT method based on sooty tern optimization for photovoltaic systems under complex partial shading. Sci Rep. 2025;15(1):27030. doi:10.1038/s41598-025-13007-1. [Google Scholar] [PubMed] [CrossRef]
48. Akram N, Khan L, Agha S, Hafeez K. Global maximum power point tracking of partially shaded PV system using advanced optimization techniques. Energies. 2022;15(11):4055. doi:10.3390/en15114055. [Google Scholar] [CrossRef]
49. Hubálovský Š, Hubálovská M, Matoušová I. A new hybrid particle swarm optimization-teaching–learning-based optimization for solving optimization problems. Biomimetics. 2024;9(1):8. doi:10.3390/biomimetics9010008. [Google Scholar] [PubMed] [CrossRef]
50. Freitas D, Lopes LG, Morgado-Dias F. Particle swarm optimisation: a historical review up to the current developments. Entropy. 2020;22(3):362. doi:10.3390/e22030362. [Google Scholar] [PubMed] [CrossRef]
51. Reddy K, Saha AK. A review of swarm-based metaheuristic optimization techniques and their application to doubly fed induction generator. Heliyon. 2022;8(10):e10956. doi:10.1016/j.heliyon.2022.e10956. [Google Scholar] [PubMed] [CrossRef]
52. Uzer MS. New hybrid approaches based on swarm-based metaheuristic algorithms and applications to optimization problems. Appl Sci. 2025;15(3):1355. doi:10.3390/app15031355. [Google Scholar] [CrossRef]
53. Hayder W, Sera D, Ogliari E, Lashab A. On improved PSO and neural network P&O methods for PV system under shading and various atmospheric conditions. Energies. 2022;15(20):7668. doi:10.3390/en15207668. [Google Scholar] [CrossRef]
54. Hayder W, Ogliari E, Dolara A, Abid A, Ben Hamed M, Sbita L. Improved PSO: a comparative study in MPPT algorithm for PV system control under partial shading conditions. Energies. 2020;13(8):2035. doi:10.3390/en13082035. [Google Scholar] [CrossRef]
55. Mohammed Nafa AZ, Obed AA, Abid AJ, Yaqoob SJ, Bajaj M, Shabaz M. Sensorless real-time solar irradiance prediction in grid-connected PV systems using PSO-MPPT and IoT-enabled monitoring. Energy Inform. 2025;8(1):99. doi:10.1186/s42162-025-00563-z. [Google Scholar] [CrossRef]
56. Kwon R, Kwon G. Safety constraint-guided reinforcement learning with linear temporal logic. Systems. 2023;11(11):535. doi:10.3390/systems11110535. [Google Scholar] [CrossRef]
57. Yan X, Yu G, Huang G, Zhou R, Hao L. Design of swarm intelligence control based on double-layer deep reinforcement learning. Appl Sci. 2025;15(8):4337. doi:10.3390/app15084337. [Google Scholar] [CrossRef]
58. Asvadi-Kermani O, Sorouri H, Oshnoei A. Adaptive regulation of a non inverting buck boost converter with Levenberg Marquardt based sliding mode predictive control scheme. Sci Rep. 2025;15(1):28783. doi:10.1038/s41598-025-14691-9. [Google Scholar] [PubMed] [CrossRef]
59. Tran NH, van Maanen L, Heathcote A, Matzke D. Systematic parameter reviews in cognitive modeling: towards a robust and cumulative characterization of psychological processes in the diffusion decision model. Front Psychol. 2021;11:608287. doi:10.3389/fpsyg.2020.608287. [Google Scholar] [PubMed] [CrossRef]
60. Hernández Rodríguez T, Posch C, Pörtner R, Frahm B. Dynamic parameter estimation and prediction over consecutive scales, based on moving horizon estimation: applied to an industrial cell culture seed train. Bioprocess Biosyst Eng. 2021;44(4):793–808. doi:10.1007/s00449-020-02488-1. [Google Scholar] [PubMed] [CrossRef]
61. Zaki M, Shahin A, Eskender S, Elsayes MA. Hybrid global search with enhanced INC MPPT under partial shading condition. Sci Rep. 2023;13(1):22197. doi:10.1038/s41598-023-49528-w. [Google Scholar] [PubMed] [CrossRef]
62. Yan Y, Wang H, Ma P, Liao J. Topology analysis and modeling comparison of SI-SIMO boost converter used in multiple output applications. Energies. 2025;18(13):3585. doi:10.3390/en18133585. [Google Scholar] [CrossRef]
63. Chen H, Song J. Operation optimization of a combined heat and power plant integrated with flexibility retrofits in the electricity market. Energies. 2025;18(13):3583. doi:10.3390/en18133583. [Google Scholar] [CrossRef]
64. Ward L, Subburaj A, Demir A, Chamana M, Bayne SB. Analysis of grid-forming inverter controls for grid-connected and islanded microgrid integration. Sustainability. 2024;16(5):2148. doi:10.3390/su16052148. [Google Scholar] [CrossRef]
65. Mohammed N, Udawatte H, Zhou W, Hill DJ, Bahrani B. Grid-forming inverters: a comparative study of different control strategies in frequency and time domains. IEEE Open J Ind Electron Soc. 2024;5:185–214. doi:10.1109/ojies.2024.3371985. [Google Scholar] [CrossRef]
66. Desardén-Carrero E, Darbali-Zamora R, Aponte-Bezares EE. Analysis of commonly used local anti-islanding protection methods in photovoltaic systems in light of the new IEEE 1547-2018 standard requirements. In: Proceedings of the 2019 IEEE 46th Photovoltaic Specialists Conference (PVSC); 2019 Jun 16–21; Chicago, IL, USA. p. 2962–9. doi:10.1109/pvsc40753.2019.8980916. [Google Scholar] [CrossRef]
67. Rajendran G, Raute R, Caruana C. A comprehensive review of solar PV integration with smart-grids: challenges, standards, and grid codes. Energies. 2025;18(9):2221. doi:10.3390/en18092221. [Google Scholar] [CrossRef]
68. Awad H, Bayoumi EHE. Next-generation smart inverters: bridging AI, cybersecurity, and policy gaps for sustainable energy transition. Technologies. 2025;13(4):136. doi:10.3390/technologies13040136. [Google Scholar] [CrossRef]
69. Mîndra T, Chenaru O, Dobrescu R, Toma L. Modular microgrid technology with a single development environment per life cycle. Energies. 2024;17(19):5016. doi:10.3390/en17195016. [Google Scholar] [CrossRef]
70. Zhang Y, Zhou Y, Wang B, Song J. MMD-TSC: an adaptive multi-objective traffic signal control for energy saving with traffic efficiency. Energies. 2024;17(19):5015. doi:10.3390/en17195015. [Google Scholar] [CrossRef]
71. Gubert TC, Colet A, Casals LC, Corchero C, Domínguez-García JL, de Sotomayor AA, et al. Adaptive volt-var control algorithm to grid strength and PV inverter characteristics. Sustainability. 2021;13(8):4459. doi:10.3390/su13084459. [Google Scholar] [CrossRef]
72. Bahrani B, Ravanji MH, Kroposki B, Ramasubramanian D, Guillaud X, Prevost T, et al. Grid-forming inverter-based resource research landscape: understanding the key assets for renewable-rich power systems. IEEE Power Energy Mag. 2024;22(2):18–29. doi:10.1109/mpe.2023.3343338. [Google Scholar] [CrossRef]
73. Mishra VL, Chauhan YK, Verma KS. A critical review on advanced reconfigured models and metaheuristics-based MPPT to address complex shadings of solar array. Energy Convers Manag. 2022;269(33):116099. doi:10.1016/j.enconman.2022.116099. [Google Scholar] [CrossRef]
74. Endiz MS, Gökkuş G, Coşgun AE, Demir H. A review of traditional and advanced MPPT approaches for PV systems under uniformly insolation and partially shaded conditions. Appl Sci. 2025;15(3):1031. doi:10.3390/app15031031. [Google Scholar] [CrossRef]
75. Nisha R, Sheela KG. Metaheuristic algorithm based maximum power point tracking technique combined with one cycle control for solar photovoltaic water pumping systems. Front Energy Res. 2022;10:902443. doi:10.3389/fenrg.2022.902443. [Google Scholar] [CrossRef]
76. Arévalo P, Ramos C, Rocha A. A systematic review of grid-forming control techniques for modern power systems and microgrids. Energies. 2025;18(14):3888. doi:10.3390/en18143888. [Google Scholar] [CrossRef]
77. Aljarrah R, Fawaz BB, Salem Q, Karimi M, Marzooghi H, Azizipanah-Abarghooee R. Issues and challenges of grid-following converters interfacing renewable energy sources in low inertia systems: a review. IEEE Access. 2024;12(4):5534–61. doi:10.1109/access.2024.3349630. [Google Scholar] [CrossRef]
78. Sun Y, de Jong ECWE, Wang X, Yang D, Blaabjerg F, Cuk V, et al. The impact of PLL dynamics on the low inertia power grid: a case study of Bonaire Island power system. Energies. 2019;12(7):1259. doi:10.3390/en12071259. [Google Scholar] [CrossRef]
79. Ninad N, Couture ED. Assessment of a DER inverter model for IEEE, 1547 ride-through requirements using a model in the loop testbed. In: Proceedings of the 2023 IEEE 50th Photovoltaic Specialists Conference (PVSC); 2023 Jun 11–16; San Juan, PR, USA. p. 1–6. doi:10.1109/pvsc48320.2023.10359898. [Google Scholar] [CrossRef]
80. Ninad N, Apablaza-Arancibia E, Bui M, Johnson J. Commercial PV inverter IEEE 1547.1 ride-through assessments using an automated PHIL test platform. Energies. 2021;14(21):6936. doi:10.3390/en14216936. [Google Scholar] [CrossRef]
81. Santiago I, Esquivel-Martin JL, Trillo-Montero D, Real-Calvo RJ, Pallarés-López V. Classification of daily irradiance profiles and the behaviour of photovoltaic plant elements: the effects of cloud enhancement. Appl Sci. 2021;11(11):5230. doi:10.3390/app11115230. [Google Scholar] [CrossRef]
82. Logothetis SA, Salamalikis V, Nouri B, Remund J, Zarzalejo LF, Xie Y, et al. Solar irradiance ramp forecasting based on all-sky imagers. Energies. 2022;15(17):6191. doi:10.3390/en15176191. [Google Scholar] [CrossRef]
83. Cao Z, Ma Q, Smolders AB, Jiao Y, Wale MJ, Oh CW, et al. Advanced integration techniques on broadband millimeter-wave beam steering for 5G wireless networks and beyond. IEEE J Quantum Electron. 2016;52(1):1–20. doi:10.1109/jqe.2015.2509256. [Google Scholar] [CrossRef]
84. Bouscayrol A. Different types of Hardware-In-the-Loop simulation for electric drives. In: Proceedings of the 2008 IEEE International Symposium on Industrial Electronics; 2008 Jun 30–Jul 2; Cambridge, UK. p. 2146–51. doi:10.1109/isie.2008.4677304. [Google Scholar] [CrossRef]
85. Jayawardana I, Ho CNM, Zhang Y. A comprehensive study and validation of a power-HIL testbed for evaluating grid-connected EV chargers. IEEE J Emerg Sel Topics Power Electron. 2022;10(2):2395–410. doi:10.1109/jestpe.2021.3093303. [Google Scholar] [CrossRef]
86. Abu Bakar Siddique M, Zhao D, Rehman AU, Ouahada K, Hamam H. An adapted model predictive control MPPT for validation of optimum GMPP tracking under partial shading conditions. Sci Rep. 2024;14(1):9462. doi:10.1038/s41598-024-59304-z. Erratum in: Sci Rep. 2024;14(1):11107. doi:10.1038/s41598-024-62104-0. [Google Scholar] [PubMed] [CrossRef]
87. Abdelwahab SAM, Khairy HE, Yousef H, Abdafatah S, Mohamed M. Comparative analysis of reinforcement learning and artificial neural networks for inverter control in improving the performance of grid-connected photovoltaic systems. Sci Rep. 2025;15(1):24477. doi:10.1038/s41598-025-09507-9. [Google Scholar] [PubMed] [CrossRef]
88. Zahraoui Y, Korõtko T, Rosin A, Mekhilef S, Seyedmahmoudian M, Stojcevski A, et al. AI applications to enhance resilience in power systems and microgrids—a review. Sustainability. 2024;16(12):4959. doi:10.3390/su16124959. [Google Scholar] [CrossRef]
Cite This Article
 Copyright © 2026 The Author(s). Published by Tech Science Press.
This work is licensed under a Creative Commons Attribution 4.0 International License , which permits unrestricted use, distribution, and reproduction in any medium, provided the original work is properly cited.
 Downloads
 Citation Tools